Using New Video Mappin~ Technology in Landscape~cology BY THOMAS J. STOHLGREN, MARGOT W. KAYE, A. DENNIS MCCRUMB, YUKA OTSUKI, BETSY PFISTER, AND CYNTHIA A. VILLA
Biological and ecological monitoring continues to play an Important role in the conservation of species; natural communities, and landscapes
(Spellerberg 1991). Although resource-monitoring programs have advanced knowledge about natural ecosystems, weaknesses persist in our ability to rapidly transfer landscape-scale Information to [he public.Ecologists COntinue to se,uch for new technologies to address this ,problem and to communicate natural resource Information quickly and effectively. New video mapping technology may provide mUCh-needed help.
Ecologists realize that only a small portion of large nature reserves can be monitored because of cost and logistical constraints. However, plant and animal populations are usually patchily distribured in subpopulations scattered throughout heterogeneous landscapes, and they are often associated with rare habitats. These SUbpoplllations and rare habitats may respond differently to climate change, land use, and management practices such as grazing, fire suppression, prescribed burning, or invasion of exotic species (Stohlgren et al. 1997b). In many national parks, monuments, and wildlife reserves, a few long-term monitoring plots are used to Infer the starus and trends of natural resources in much larger areas. To make defensible inferences about populations, habitats, and landscapes, it is necessary to extrapolate from a few monitoring plots (local scale) to the larger, unsampled landscape with known levels of aCCllracy and precision.
Recent technological developments. have given population biologists and landscape ecologists a unique tool for bridging the data gap between small, intensively sampled monitoring plots and the greater landscape and for transferring this Information qUickly to resource managers and the public. In this article, we briet1y describe this tool, a hand-held video mapping system linked to a geographiC Information system (GIS). We prOVide examples of its use in quantifying patterns of native and exotic plant species and cryptoblotic crusts In the new Grand Staircase-Escalante National Monument, Utah, and in surveying aspen
Thomas J Stohlgren (e-mail: [email protected]) is an ecoIo gist at the Midcontinent Ecological Science Center, US Geol.ogical Survey. Natural Resource &oJogy Laboratory (JVREL) , Colorado State University. Fore Collins, CO 80523-1499. Margot W Kaye. A.
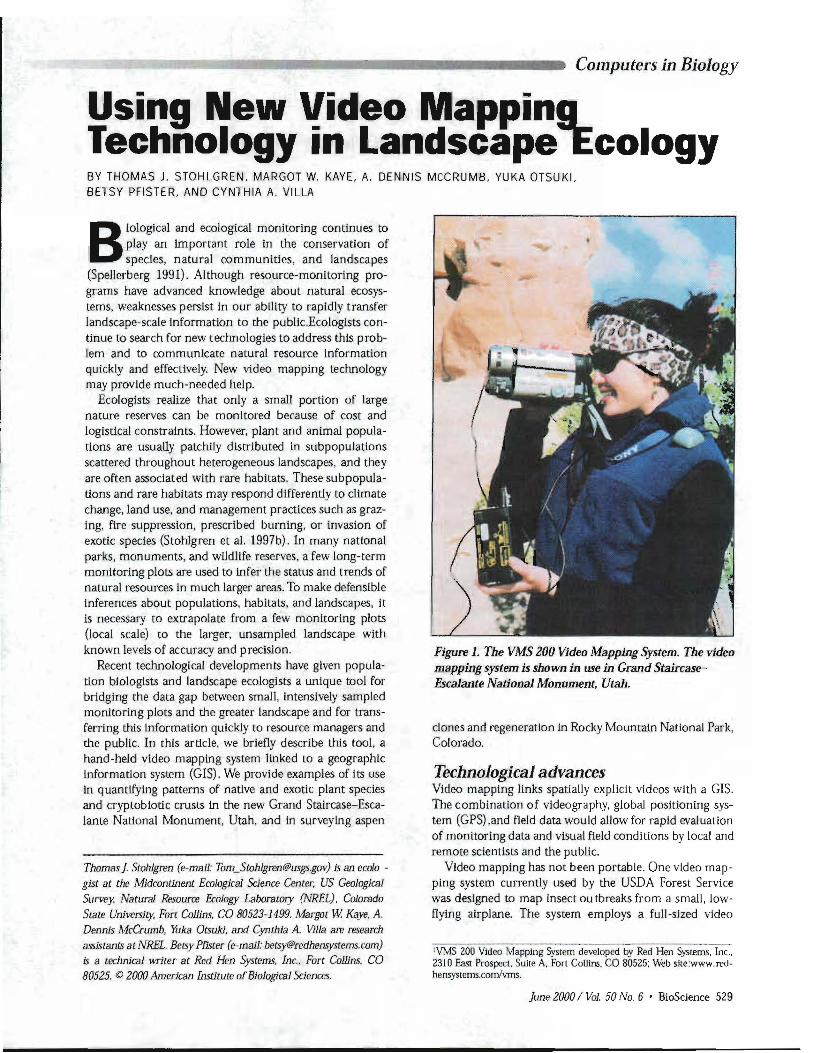
Figure 1. The VMS 200 Video Mapping System. The video mapping system is shown in U5e in Grand StaircaseEscalante National Monument. Utah.
clones and regeneration in Rocky Mountain National Park, Colorado.
Technological advances Video mapping Ilnks spatially explicit videos with a GIS. The combination of videography, global positioning system (GPS) ,and field data would allOW for rapid evaluation of monitoring data and visual field conditions by locaf and remote scientists and the public.
Video mapping has not been portable. One video mapping system currently used by the USDA Forest Service was designed to map Insect ou tbreaks from a small, lowflying airplane. The system employs a full-sized video
[VMS 200 Video Mapping System developed by Red Hen Systems. Inc.. 2310 EaS! Prospect. Suite A. Fort Collins. CO 80525; Web site:www.redhensystems.com/vrns.
june 2000 I Val. 50 No.6' BioScience 529
Computers in Biology
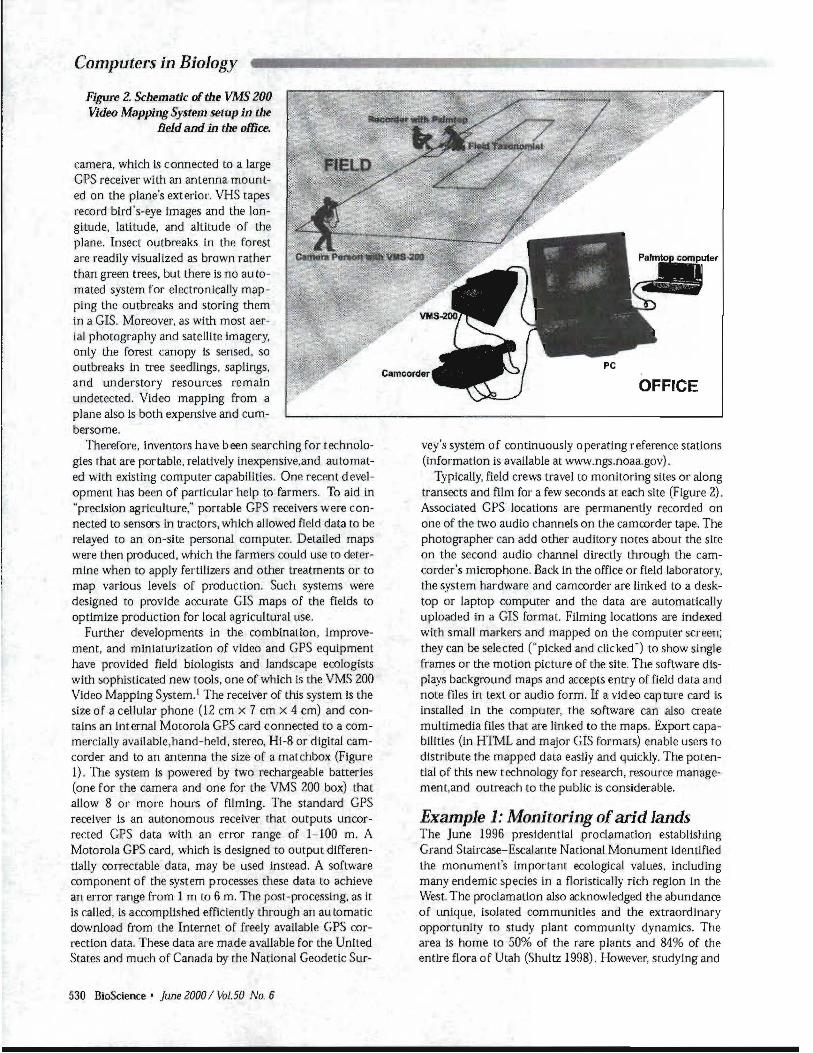
Figure 2. Schematic of the VMS 200 Video Mapping System setup in the
Held and in the office.
camera, which is connected to a la_rge GPS receiver with an antenna mounted on the plane's exterior. VHS tapes record bird's-eye images and the longitude, latitude, and altitude of the plane. Insect olltbreaks in the forest are readily visualized as brown rather than green trees, but there is no au tomated system for electronically mapping the outbreaks and storing them in a GIS. Moreover, as with most aerial photography and satellite imagery, only the forest canopy Is sensed, so outbreaks in tree seedlings, saplings, and understory resources remajn undetected. Video mapping from a plane also is both expensive and cumbersome.
Therefore, inventors have been searching for technologies that are portable, relatively inexpensive,and automated with existing computer capabilities. One recent d evelopment has been of particular help to farmers. To aid in "precision agriculture," portable GPS receivers were connected to sensors in tractors, which allowed field data to be relayed to an on-site personal computer. Detailed maps were then produced, which the farmers could use to determine when to apply fertilizers and other treatments or to
map various levels of production. Such systems wer·e designed to proVide accurate GIS maps of the fie'lds to optimize production for local agricultural use.
Further developments in the combination, improvement, and miniaturization of video and GPS eqUipment have prOVided field biologists and landscape ecologists with sophisticated new tools, one of which is the VMS 200 Video Mapping System.' The receiver of this system Is the size of a cellular phone (12 cm x 7 cm x 4 em) and contains an internal Motorola GPS card connected to a commercially availab'le,hand-held. stereo, Hi-8 or digital camcorder and to an antenna the size of a matchbox (Figure 1). The system is powered by two rechargeable batteries (one for the camera and one for the VMS 200 box) that allow 8 or more hours of filming. The standard GP$ receiver is an autonomous receiver that outputs uncorrected GPS data with an error range of 1-100 m. A Motorola GPS card, which is designed to output differentially correctable data, may be used instead. A software component of the system processes these data to achieve an error range from 1 m to 6 m. The post-processing, as it is called, is accomplished efficiently through an au tomatic download from the Internet of freely available GPS correction data. These data are made avallable for the United States and much of Canada by the National Geodetic Sur-
OFFICE
vey's system of continuously operating reference stations (information is available at www.ngs.noaa.gov).
Typically, field crews travel to monitoring sites or along transects and film for a few seconds at each site (Figure 2). Associated GPS locations are permanently recorded on one of the two audio channels on the camcorder tape. The photographer can add other auditory notes about the site on the second audio channel directly through the camcorder's microphone. Back in the office or field laboratory, the system hardware and camcorder are linked to a desktop or laptop computer and the data are automatically uploaded in a GIS fm;mat. Filming locations are indexed with small markers and mapped on the computer screen; they can be selected ("picked and clicked") to show single frames or the motion picture of the site. The software displays background maps and accepts entry of field data and note files in text or audio form. If a vid eo cap ture card is installed in the computer, the software can also create multimedia files that are linked to the maps. Export capabilities (in HTML and major GIS formats) enable users to distribute the mapped data easily and qUickly. The potential of this new technology for research, resource management,and outreach to the public is conSiderable.
Example 1: Monitoring ofarid lands The June 1996 presidential proclamation establishing Grand Staircase-Escalante National Monument identified the monument's important ecological values, including many endemic species in a floristically rich region in the West. The proclamation also acknowledged the abundance of unique, isolated communities and the extraordinary opportunity to study plant community dynamics. The area is home to 509'~) of the rare plants and 84% of the entire flora 0 f Utah (Shultz 1998). However, studying and
530 BioScience' june 2000 I Vol. 50 No.6
Computers in Biology
preserving botanical resources in the monument will not be easy. First,the monument is huge and floristically complex. Its 691,057 ha range in elevation from 1372 m to 2530 m, from low desert shrub, steppe, sage, and pinyon-juniper woodlands to forests of Pinus ponderosa,
Seoond, land"use practices such as grazing, recreation, mining, and 011 and gas exploration and exrraction threaten the native plants, cryptobiotic crust, and soils in the monument. Cryptobiotic (or microbiotic) soil crusts are filamentous webs of cyanobacteria, lichens. green and brown algae. mosses, and fungi that playa critical role In the sustainability of desert ecosystems. The thin crusts stabilize soils, slow erosion, protect sol! biota, and facilitate seedling germination and establishment as well as nutrient and water cycling for plant productivity (Belnap and Harper 1995, Belnap and Gillette 1998). However. the fragile organisms that make up the crusts may take hundreds of years to recover from disturbances (e.g., trampling by livestock and people or use of off-road vehicles: Belnap 1995, 1998). Assessing damage to the crusts at landscape scales is vital to land managers at the monument, who must protect plant and soil resources while providIng opportunities for recreation, grazing. and mineral exploration.
Previous approaches. Understanding botanical and soil resources in large areas such as the Grand Staircase-Escalante National Monument has been hampered by reliance on "searching" techniques and local-scale studIes. Searching involves the subjective selection of field observations for developing knowledge of the flora. That information has been useful in creating species lists for selected sites, such as the rare hanging gardens in the mcnument (May 1998), but additional information about landscape-scale vegetation characteristics often is reqUired for resource evaluation, plMlning, and outreach. For example, changes in the cover, biomass. and frequency of
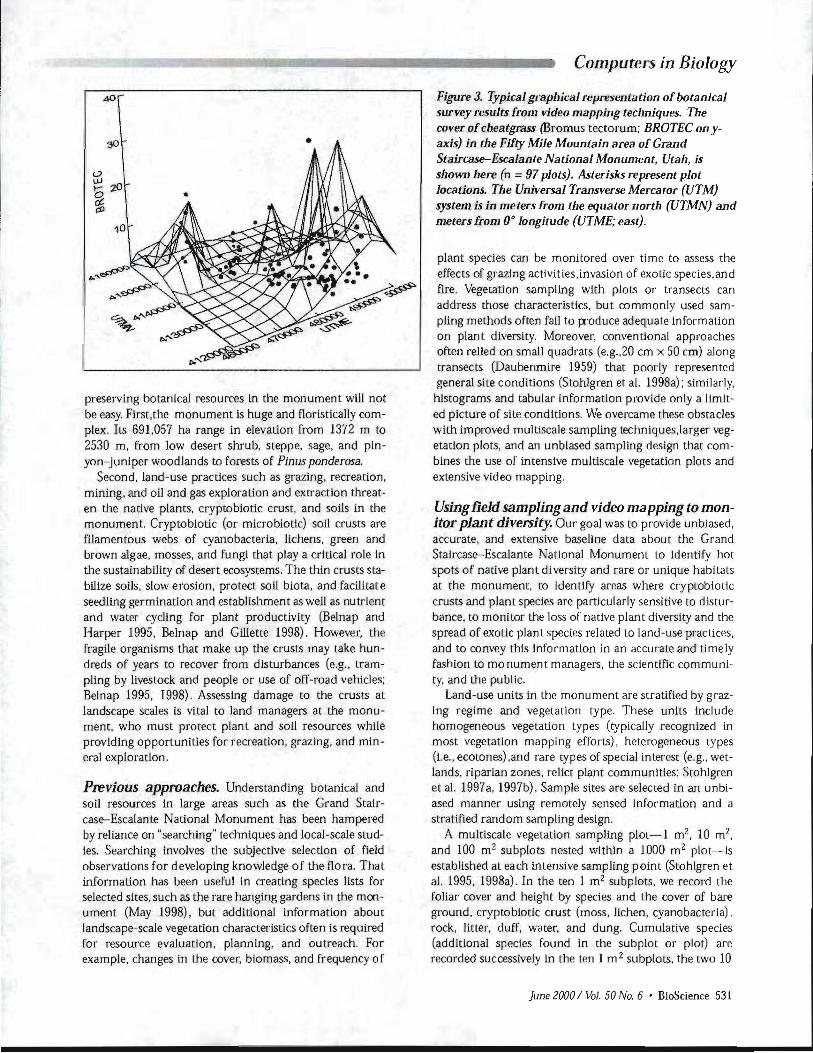
Figure 3. Typical gt-apllical representation ofbotanical survey results from video mapping techniques. The cover of cheatgrass (Bromus tectolUm; BROTEC on yaxis) in the Fifty Mile Mountain area of Grand Staircase-Escalante National Monument, Utah, is shown here (n =97 plots). Asterisks represent plot locations. The Universal Transverse Mercator (UTM) system is in meter.~ from the equator north (UTMN) and meters from 0° longitude (UTME; east).
plant species can be monitored over time to assess the effects of grazing activities,invasion of exotic species, and fire. Vegetation sampling with plots or transects can address those characteristics, but commonly used sampling methods often fail to froduce adequate information on plant diversity. Moreover, conventional approaches often relied on small quadrats (e.g.,20 cm x 50 cm) along transects (Daubenmire 1959) that poorly represented general site conditions (Stohlgren et a1. 1998a): similarly, histograms and tabular information proVide only a limited picture of site conditions. We overcame these obstacles with improved multiscale sampling techniques,larger vegetation plots, and an unbiased sampling design that COJl1
bines the use of intensive multiscale vegetation plots and extensive video mapping.
Using field samplingand video mapping to monitor plant diversity. Our goal was to prOVide unbiased, accurate, and extensive baseline data about the Grand Staircase-Escalante National Monument to identify hot spots of native plant dlversity and rare or unique habitats at the monument, to identify areas where cryptobiotic crusts and plant species are particularly sensitive to disturbance, to monitor the loss of native plant diversity and the spread of exotic plant species related to land-use practices, and to convey this information in an accurate and timely fashion to mo nument managers, the scientific community, and the public.
Land-use units in the monument are stratified by grazing regime and vegetation type. These units Include homogeneous vegetation types (typically recognized in most vegetation mapping efforts), heterogeneous types (I.e., ecotones) ,and rare types of special interest (e.g., wetlands, riparian zones, relict plant communities: Stohlgren et al. 1997a, 1997b). Sample sites are selected in an unbiased manner using remotely sensed information and a stratified random sampling design.
2A multiscale vegetation sampling plot-l m2, 10 m ,
and 100 m2 subplots nested within a 1000 m2 plot-is established at each intensive sampling point (Stohlgren et at. 1995, 1998a).ln the ten 1 m2 subplots. we record the foliar cover and height by species and the cover of bare ground. cryptobiotic ClUst (moss, Hchen, cyanobacteria). rock, litter, duff. water, and dung. Cumulative species (additional species found in the subplot or plot) are recorded successively In the ten 1 m 2 subplots, the two 10
June 2000! Vol. 50 No.6' BIoScience 531
Computers in Biology
............ -r-------------------.
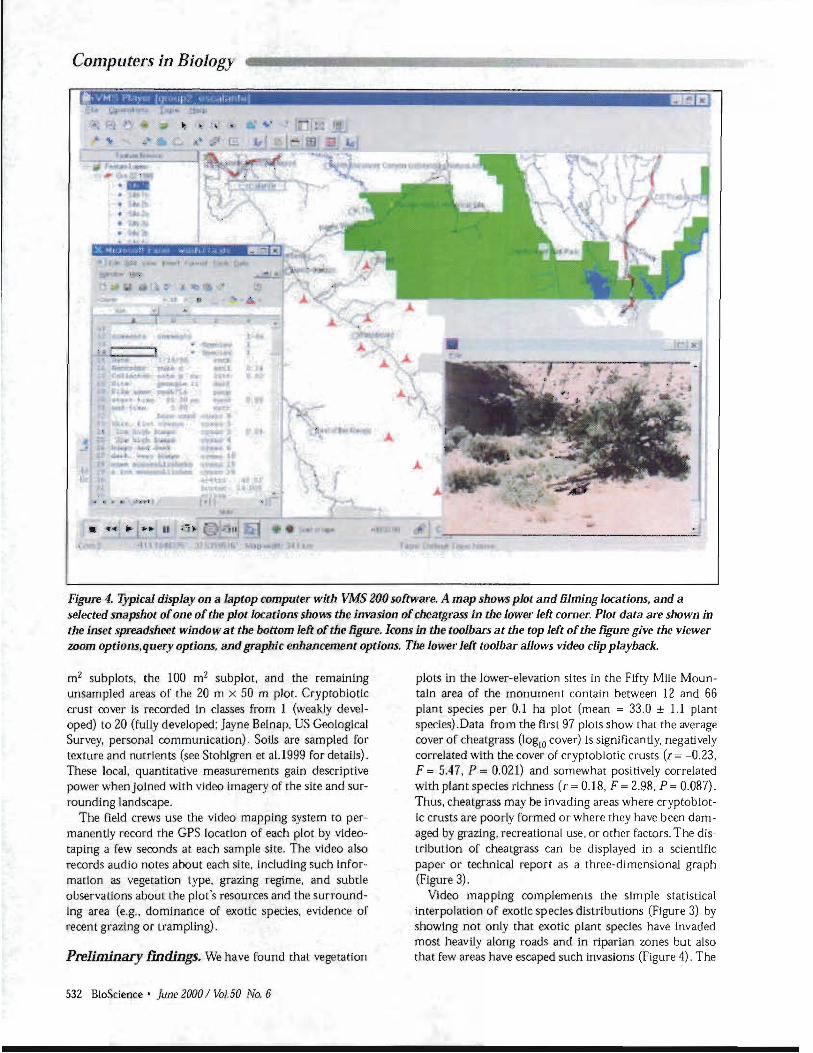
Figure 4. Typical display on a laptop computer with VMS 200 software. A map shows plot and filming locations, and a selected snapshot ofone of the plot locations shows the invasion ofcheatgrass in the lower left comer. Plot data are shown in the inset spread~heet window at the bottom left of the ligure. Icons in the toolbars at the top left ofthe flgure give the viewer zoom options,query options, and graphic enhancement options. The lower left toolbar allows video clip playback.
m2 subplots, the 100 m2 subplot, and the remaining unsampled areas of the 20 m X 50 m plOL Cryptobiotic crust cover is recorded In classes f!"Om 1 (weakly developed) to 20 (fully developed: Jayne Belnap, US Geological Survey, personal communication). Soils are sampled for texture and nutrients (see Stohlgren et a1.1999 for details). These local, quantitative measurements gain descriptive power when joined with Video imagery of the site and surrounding landscape.
The field crews use the video mapping system to permanently record the GPS location of each plot by videotaping a few seconds at each sample site. The video also records audio notes about each site, including such information as vegetation type, graZing regime, and subtle observations about the plot's resources and the surrounding area (e.g., dominance of exotic species, evidence of recent grazing or trampling).
Preliminary f"mdings. We have found that vegetation
532 BioScience' June 2000/ Vol. 50 No.6
plots in the lower-elevation sites in the Fifty Mile Mountain area of the monument contain between 12 and 66 plant species per 0.1 ha plot (mean = 33.0 ± 1.1 plant speCies) .Data from the first 97 plots show that the average cover of cheatgrass (IoglO cover) Is significantly, negatively correlated witb the cover of cryptobiotic crusts (1' = -0.23, F = 5.47, P = 0.021) and somewhat positively correlated wIth plant species richness (1' = 0.18, F = 2.98, P = 0.087). Thus, cheatgrass may be invading areas where cryptobiotIc crusts are poorly formed or where they have been damaged by graZing, recreational use, or other factors. The distribution of cheatgrass can be displayed in a scientlfic paper or technical report as a three-dimensional graph (Figure 3),
Video mapping complements the Simple statistical interpolation of exotic species distributions (Figure 3) by showing not only that exotic plant species have invaded most heavily along roads and in riparian zones bu t also that few areas have escaped such invasions (Figure 4). The
,ompuler: in Biology
It: (~, !i! ;:~:
c., /t' r9
-----==---------¥I!J:~-:~t -'.
!,
32
L6!>i':'f- N~lie
H8',,[>119~.
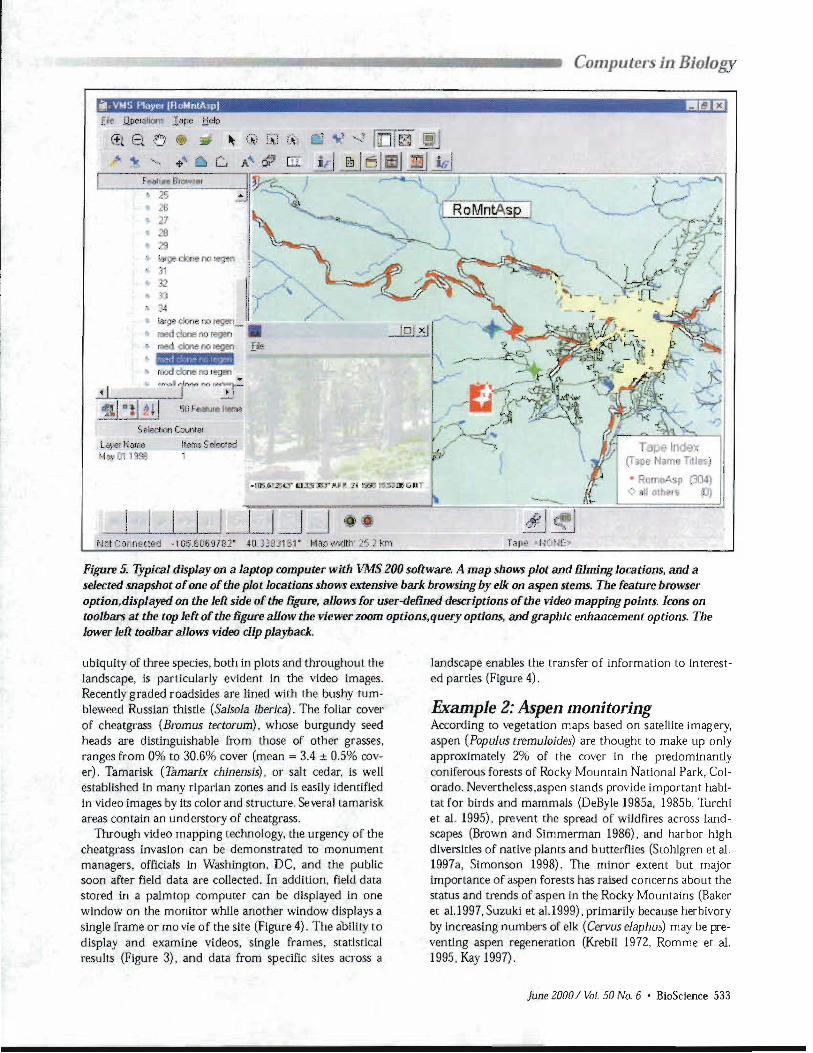
Figure 5. Typical display on a laptop computer with VMS 200 sofiware. A map shows plot and filming locations, and a selected snapshot ofone of the plot locations shows extensive bark browsing by elk on aspen stems. The feature browser option,displayed on the left side of the IlfJUre, allows for user-defined descriptions of the video mapping points. Icons on toolbars at the top left of the figure allow the viewer zoom options,query options, and graphic enhancement options. The lower left toolbar allows video dIp playback.
ubiquity of three species. both in plots and throughout the landscape. is particularly eVident in the video images. Recently graded roadsides are lined with the bushy tumbleweed Russian thistle (Sa1s01a iberica). The follar cover of cheatgrass (Bromus teetm'um) , whose burgundy seed heads are distinguishable from those of other grasses. ranges from 0% to 30.6% cover (mean = 3.4 ± 0.5% cover), Tamarisk (Tamarix chinensis) , or salt cedar, is well established In many riparian zones and is easily identified In video images by its color and structure. Several tamarisk areas contain an understory of cheatgrass.
Through video mapping technology, the urgency of the cheatgrass jnvaslon can be demonstrated to monument managers. officials In Washington, DC, and the public soon after field data are collected. In addition, field data stored in a palmtop computer can be displayed In one window on the monitor whlle another window displays a Single frame or mo vie of the site (Figure 4). The abillty to display and exam.ine Videos, single frames, statlstical results (Figure 3), and data from specific sites across a
landscape enables the transfer of information to Interested parties (Figure 4),
Example 2: Aspen monitoring Accol'ding to vegetation maps based on satellite imagery. aspen (Populus tremu1oides) are thought to make up only approximately 2% of the cover in the predominantly coniferous forests of Rocky Mountain National Park, Colorado, Nevercheless,aspen stands provide important habitat for birds and mammals (DeByle 1985a, 1985b, Turchi et al. 1995), prevent the spread of wildfires across landscapes (Brown and Simmerman 1986), and harbor high diversities of native plants and butterflies (Stohlgren et al. 1997a. Simonson 1998). The minor extent but major importance of aspen forests has raised concerns about the status and trends of aspen in the Rocky Mountains (Baker et al.1997, Suzuki et a1.1999), primarily because herbivory by increasing numbers of elk (Cervus eJaphus) may be preventing aspen regeneration (Krebil 1972, Romme et a1. 1995, Kay i997) ,
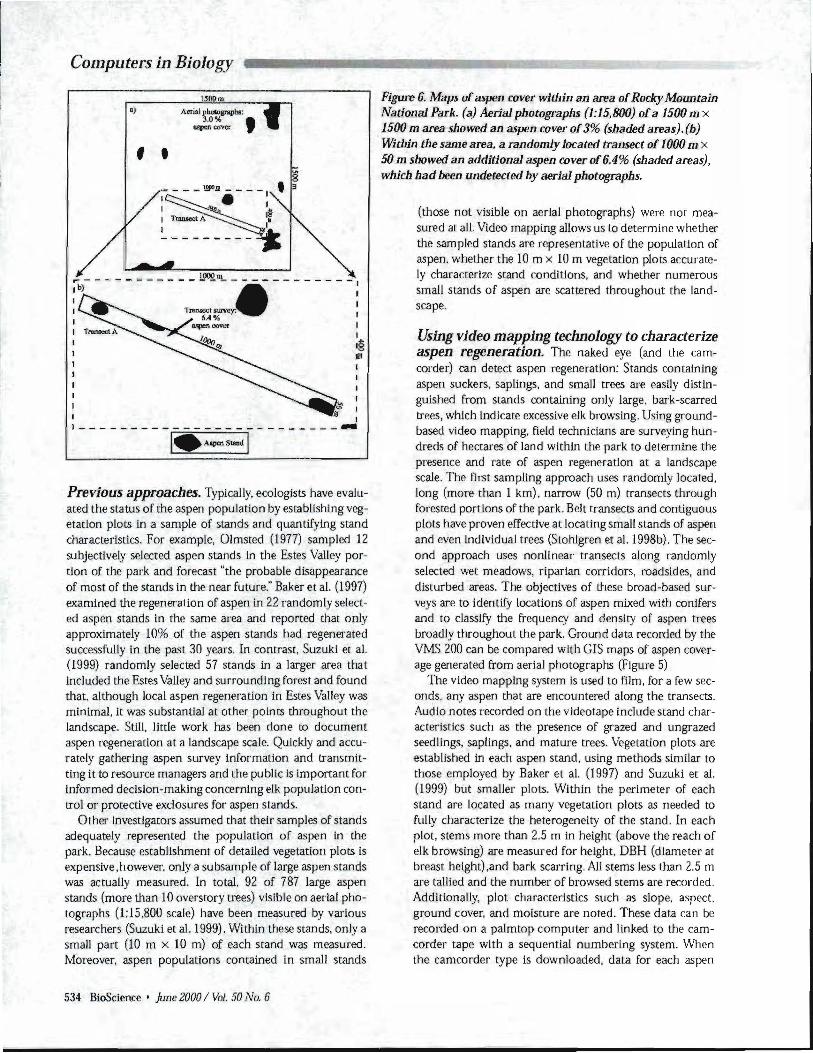
Figw'e 6. Milp5 ufaspen cover wldlin an area ofRocky Mountain BJ A.m.1 ~hor.ollTOPh.: National Park. (a) Aerial photographs (1:15, 800) ofa 1500 m x
3.0% , tJ.Sptri CO""t:r" I 1500 m area .~howed an aspen cover of3% (shaded areas). (b)
Witbin the same area, a randomly located transect of1000 m x, . 50 m showed an additional aspen cover of6.4% (shaded areas), which had been undetected by aerial photographs. ~
\!lPO.!I. (those not visible on aerial photographs) were not measured at all. Video mapping allows us to determine whether the sampled stands are representative of the population of aspen. whether the IO m x 10 m vegetation plots accurately characterize stand conditions, and whether numerous
- I small stands of aspen are scattered throughout the landscape.:
I I Using video mapping technology to characterize Ig
aspen regeneration. The naked eye (and the cam13 I corder) can detect aspen regeneration: Stands containing I
aspen suckers, saplings, and small trees are easily distinI I guished from stands containing only large. bark-scarred I I trees, which Lnd.icate excessive elk browsing. Using ground
based video mapping, field technicians are surveying hun---------~:~;~J-------- .. dreds of hectares of land within the park to determine the presence and rate of aspen regeneration at a landscape scale. The first sampling approach uses randomly located,
Previous approaches. Typically, ecologists have evalu long (more than] km), narrow (50 m) transects through ated the status of the aspen population by establishing veg forested portions of the park. Belt transects and contiguous etation plots in a sample of stands and quantifying stand plots have proven effective at locating small stands of aspeli1 characteristics. For example, Olmsted (1977) sampled 12 and even individual trees (Stohlgren et a!. 1998b). The secsubjectively selected aspen stands in the Estes VaHey por ond approach uses nonlinear transects along randomly tion of the park and forecast "the probable disappearance selected wet meadows, riparian corridors, roadsides, and of most of the stands in the near future:' Baker et al. (1997) disturbed areas. The objectives of these broad-based surexamined the regeneration of aspen in 22 randomly select veys are to identify locations of aspen mixed with conifers ed aspen stands in the same area and reported that only and to claSSify the frequency and density of aspen trees approximately 10% of the aspen stands had regenerated broadly throughout the park. Ground data recorded by the successfully in the past 30 years In contrast, Suzuki et al. VMS 200 can be compared with GIS maps of aspen cover(1999) randomly selected 57 stands in a larger area that age generated from aerial photographs (Figure 5). Included the Estes Valley and surrounding forest and found 1l,e video mapping system is used to film, for a few secthat, although local aspen regeneration in Estes Valley was onds, any aspen that are encountered along the transects. mlnlmal, it was substantial at other point~ throughout the Audio notes recorded on the videotapo include stand charlandscape. Still, little work has been done to document acteristics such as the presence of grazed and ungrazed aspen regeneration at a landscape scale. QUickly and accu seedlings, saplings, and mature trees. Vegetation plots are rately gathering aspen survey information and transmit established in each a~pen stand, using methods similar to ting it to resource managers and the public is important for those employed by Baker et a!. (1997) and Suzuki et a!. informed decision-making concerning elk population con (1999) but smaller plots. Within the perimeter of each trol or protective exclosures for aspen stands. stand are located as many vegetation plots as needed to
Other Investigators assumed that their samples of stands fully character,ize the heterogeneity of the stand. In each adequately represented the population of aspen in the plot, stems more than 2.5 m in height (above the reach of parle Because establishment of detailed vegetation plots is elk broWSing) are measured for height, DBH (diameter at expenSive ,however, only a subsample of large aspen stands breast height) ,and bark scarring. AIJ stems less than 2.5 m was actually measured. In total, 92 of 787 large aspen are tallied and the number of browsed stems are recorded. stands (more than 10 overstory trees) viSible on aerial pho Additionally, plot characteristics such as slope. aspect, tographs (1:15,800 scale) have been measured by various ground cover, and moisture are noted. These data can be researchers (Suzuki et al.. 1999). Within these stands, only a recorded on a palmtop computer and linked to the camsmall part (10 m x 10 m) of each stand was measured. corder tape with a sequential numbering system. When Moreover, aspen populations contained in smaU stands the camcorder type is downloaded, data for each aspen
534 BioScience' June 2000/ Vol. 50 llio. 6
patch is georeferenced and integrated into the Gl~.
Preliminary findings. The VMS 200 technology is effective for mapping the condition and location of small aspen stands, saplings, and suckers throughout the forests of Rocky Mountain National Park. We have learned that aerial photography misses many small aspen stands because they are hidden by larger conifers in the overstory. Indeed, whereas satellite imagery suggested that aspen covers less than 2% of the Rocky Mountain landscape and a detailed GIS map created from aerial photographs showed aspen to cover 3% of the landscape in a 1500 m2
area (Figure 6a), the video mapping data showed aspen cover at 6.4% (Figure 6b). These results indicate that a substantial amount of aspen cover was not included in previous GIS databases. Videography proved to be particularly useful in mapping where elk herbivory has been locally severe (Figure 5). The new GIS database updated with the video mapping system demonstrated that aspen regeneration persists across the landscape. Small patches of regeneration, scattered individuals, and small clones throughout the landscape most lIkely contribute to the persistence of aspen by aiding their recovery or developing into new stands after dIsturbance and by redUCing herbivory pressure in space and time.
Video data collected with the mapping system also demonstrate that many larger aspen clones are poorly represented by one or two vegetation sampling plots. In some cases,five or six sampling plots are needed to fully characterize a single stand. Among plots within the same stand, regeneration and stem densities can vary considerably. Limited vegetation plots in heterogeneous aspen stands mischaracterize aspen regeneration within the park. Video data clearly demonstrate the variability in stand characteristics, and associated vegetation plot data quantify that variability.
Linking science and outreach The video mapping system described here proVides ecologists with a tool to describe landscape-scale conditions to land managers, the scientific community, and the public. The present-day "video age" allows mapped information to be more re.liable, accessible, and visual. In the Grand Staircase-Escalante National Monument, describing the magnitude and extent 0 f exotic plant invasions has been greatly facilitated by video mapping. Although plot-level information proVides ImpOltant quantitative information and is the basis of a sound monitoring program, the video mapping system prOVides land managers with a rapid visual assessment of the spatial distribution and impact of invasive plant species over a much broader landscape. Cheatgrass invasions, for example, were found to be far more extensive than preViously thought. The combined video, single-frame photographs, and field data from the plots provide the detailed, geoindexed information needed to monitor exotic plant invasions in an easily under
Computer'inioJoffY
stood format. Monument staff are involved in planning fuwre land
uses and levels of resource protection in the area. The availability 0 f videos. still shots, and field data describing the status of natural resources is important for such efforts. Many sampling sites in the monument are remote. accessible only by long, strenuous hikes over rough terrain. The video and photographs linked to a simple GIS help translate remote resource conditions to office staff and the publle.
Rocky Mountain National Park staff can use current field data linked to video images and offer timely information on the ecological and aesthetic aspects of vegetatJon and elk management. Selected long-term monitoring plots are used to infer the status and trends of natural resources in much larger areas, with video mapping proViding supportive, qualitative, spatially explicit information at broader spatial scales. There is considerable discussion about reducing the elk herd in Rocky Mountain National Park to pFOtect aspen. Such decisions are never easy, and public scrutiny could be intense. Detailed data on aspen regeneration and other botanical resources are important considerations in such management decisions. In general, public opinion on the topic has been based on the evaluation of a handful of high-profile aspen stands located in the Estes Valley near the main thoroughfares of the park. However, extensive ground surveys combined with video mapping show a spectrum of regeneration levels and graZing Intensities in aspen patches. Geoindexed video and audio cUps and associated vegetation plot data make these remote asp en stands visibly accessible to the public.
These video mapping technologies are adaptable to a wide range of applications. The system described In this article is already being used in several weed control districts in the Rocky Mountain states and for oil pipeline aerial insp ectiom in Canada. crop scou ting, and mllitary reconnaissance.
The greatest potentlal contribution of this technology is educating the public through easlly comprehended technology. Video mapping. because its inherent level of user interactivity Is high,can greatly improve public awareness. The Videos. photographs, and spatial analysis of results can be made Immediately available on the World Wide Web or at computer displays in visitor centers. Video documentation can provide reallstic, easily Interpretable data for communicating ecological conditions to those who manage, use, and care about natural resources.
Acknowledgments John Moeny, Kelly Bull, Jeannie Leatherman. Anne Overlin. Nate Pierce. Sean Stewart, Seth Ohms, Jeanette Haddock, and Geneva Chong assisted with Grand Staircase-Escalante National Monument (GSENM) fieldwork. Carol Volk. Melissa Rodarte,and David Barnett assisted on the aspen regeneration project in Rocky Mountain
June 2000 I Vol. 50 No.6' BioScience 535
Computers in Biology
National Park. Eric Sutherland and Ken Burgess at Red Hen Systems, Inc., and Farmers Software, Inc., were very helpful in training crews with the VMS 200 equipment. The Bureau of Land Management provided funding for the GSENM research, and the Biological Resources D ivision of the US Geological Survey provided funding for the aspen research. We received logistical support from the staffs of GSENM and Rocky Mountain National Park, the National Resource Ecology Laboratory at Colorado State University, and the Mid continent Ecologtcal Science Center (Biological Resources Division,US Geological Survey). Geneva Chong, Rebecca Chasan, and three anonymous reviewers provided helpful suggestions on earlier versions of the manuscript. To all we are grateful.
References cited Baker we Mumoe JA. Hessl AE.1997. The effect of elk on aspen PQPU
'!arion In the winter range of Rocky Mountain National Park. Colorado, USA. Ecography 20: 155-165.
Belnap j. 1995. Soil surface disturbances: Their roLe in occeleraring desertification.Environmental Monitoring and Assessment 37: 39-57.
___.1998. Impacts oftrampHng solis in southeast Utah ecosystl'ms. Pages 231-244 In Hill LM. I'd. Learning from the land: Grand StaJrcase-Escalante National ,fvbnument science symposium proceedings. Salt Lake City (UT): Ilureau of Land Management.. Report no. BLMJUT/GI-98/006+ 1220.
Belnap 1. GllINte DA.1998. Vulnerability 0 f desert soil surfaces to wind erosion: Impacts of soil texture and disturhance. Journal of Arid Environments 39:133-L42.
Belnap J. Harper .KT. 1995. Inlluence of cryptoblotic soil cruSts on elemental col1tent of tissue in two desert seed plants. Arid Soli Research and Rehabllitation 9: 107-115.
Brown JK, Simmerman DG.l986. Appraisal of fuels aJJd flammability In western a'ipen: A prescribed fire gUide. Ogden (UT): USDA Forest Service, Intermountain Research Station. General Technical Report INT-205.
DcBy!e NV. 1985a. Wildlife. Pages 135-152 in DeByle NV, Winokur RP. eds. Aspen: Ecology and management in the westem Uniteu States. Ft. Collins (CO): USOA FOlEst Service. Rocky Mountain Forest and Range Experiment Station.General Technical Report RM-119.
___. 1985b. Animal impacts. Pages 115-123 in DeByle NV. Winokur RP. eds. A~pen: Ecology <lnd managemem In the western United States.Ft. Collins (CO):USDA Forest Service. Rocky Mountain Forest and Range Expertmcnt Station. General Technical Report RM
119. Kay CE.1997. Is aspen doomed? Journal of Forestry 95:4-11. Krebil RG.l972. Mortality of aspen on the Gros Ventre elk winter range.
Ogden (UI): USDA Forest Service. IntermountaIn Resea.rch Station. Research Paper [NT-129.
May CL.I 998.Geoecology of the hanging gardens:Endemic resources in the GSENM. Pages 245-257 In Hill LM. I'd. Learning from the land: Grand Stairca<ie-Escalante National Monument scIence sympOSium proceedings. Salt Lake City (UT): Ilureau of Land Management. Report no. RLWUT/GI-98/006+1220.
Olmsted CEo 1977. The effect of large herbivores on aspen In Rocky Mountain National Park. PhD dissertation. University of Colorado, Boulder, CO.
Romme WHo Turner MG, Wallace LL, Walker JS. 1995. Aspen. elk, and flfC in northern Yellowstone National Park.Ecology 76:2097-2106.
Shult7lM. 1998. The flora and falma 0 f the Colorado Plateau: What do we know? Pages 203-209 in HUI LM. ed. Learning limn the land: Grand Staircase-Escalante Nation,ll Monument science sympOSium proceedlngs. Sail' Lake City (UT): Bureau of Land Management. Report no. BLM/UT/GI-98/006+1220.
Simonson S.1998. Rapid assessment of butterfly diversity: A method for landscape evaluation. Master's thesis. Colorado State UnlVl'rsity. Fort Colllns.CO.
Spellerberg IF. 1991. Monitoring Ecological Cbange. New York: Cambl'idge University Press.
SlOhlgren TJ, Chong GW. KaU<han MA.Schell LD. 1997a. Rapid assessment of plant div('(Slty patterns:A methodology for landscapes.Ecologlcal Moniroring and Assessment 48:25-43.
StohJgren TJ, Coughenour MB. Chong GW.Blnkley D. Kalkhan :vi.Schell LD. Buckley D. Bl'rry J. 1997b. Landscape analysis of plant diversity. Landscape Ecology 12:155-170.
Stohlgren TJ. Bull KA. Otsuk.i y. 1998a. Comparison of I'a.ugeland sampling techniques in tbe central grasslands. Journal of Range Management 51: 164-172.
Stohlgren TJ, Belnap J, Choug Gw, ReIch R.1998b. A plan {Q assess native and exotie plant dlv(,l'sity and cryptobiotic Cl'llsts in the Grand Stalrcase-EscaJante National Monument. Pages 269-276 in HUI LM. ed. Leaming from rhe land: Grand StaJrcase-Escalante National Monument science symposium !I'Oceedings. Salt Lake City (VT): Ilureau of Land Management. Report no. BLMJUTIGI-98/006+1220.
Stohlgren TJ. Binkley D. Chong GW. KaIkhan MA. Schell LD. Bull KA, Otsuki Y. Newman G. Bashkin M. Son Y. 1999. Exotic pl.anc species Invade hot spots of native plan! diverSity. Ecological Monographs 69: 25-46.
Suzuki K, Suzuki H. Binkley D. Stohlgren TJ, 1999. Aspen regeneration In (he Colorado Front Range: Dlffemncl's at local and landscape scales. Landscape Ecology 14 :231-237.
Turchi GM. Kennedy PL. Urban D. 1995. Bird species richness in relation to isolation of aspen habitat. WHson Bulletin 107:463-474.