Using Online Ratings as a Proxy of Word-of-Mouth in Motion Picture Revenue Forecasting Chrysanthos Dellarocas • Neveen Awad Farag • Xiaoquan (Michael) Zhang R. H. Smith School of Business, University of Maryland, College Park, MD 20742 Wayne State University, Detroit, MI 48202 Sloan School of Management, Massachusetts Institute of Technology, Cambridge, MA 02139 [email protected]• [email protected]• [email protected]Abstract The emergence of online product review forums has enabled firms to monitor consumer opinions about their products in real-time by mining publicly available information from the Internet. This paper studies the value of online product ratings in revenue forecasting of new experience goods. Our objective is to understand what metrics of online ratings are the most informative indicators of a product’s future sales and how the explanatory power of such metrics compares to that of other variables that have traditionally been used for similar purposes in the past. We focus our attention on online movie ratings and incorporate our findings into practical motion picture revenue forecasting models that use very early (opening weekend) box office and movie ratings data to generate remarkably accurate forecasts of a movie’s future revenue trajectory. Among the metrics of online ratings we considered, we found the valence of user ratings to be the most significant explanatory variable. The gender diversity of online raters was also significant, supporting the theory that word-of-mouth that is more widely dispersed among different social groups is more effective. Interestingly, our analysis found user ratings to be more influential in predicting future revenues than average professional critic reviews. Overall, our study has established that online ratings are a useful source of information about a movie’s long-term prospects, enabling exhibitors and distributors to obtain revenue forecasts of a given accuracy sooner than with older techniques. 1
The emergence of online product review forums has enabled firms to monitor consumer
opinions about their products in real-time by mining publicly available information from the
Internet. This paper studies the value of online product ratings in revenue forecasting of new
experience goods. Our objective is to understand what metrics of online ratings are the most
informative indicators of a product’s future sales and how the explanatory power of such metrics
compares to that of other variables that have traditionally been used for similar purposes in the
past. We focus our attention on online movie ratings and incorporate our findings into practical
motion picture revenue forecasting models that use very early (opening weekend) box office
and movie ratings data to generate remarkably accurate forecasts of a movie’s future revenue
trajectory. Among the metrics of online ratings we considered, we found the valence of user
ratings to be the most significant explanatory variable. The gender diversity of online raters
was also significant, supporting the theory that word-of-mouth that is more widely dispersed
among different social groups is more effective. Interestingly, our analysis found user ratings
to be more influential in predicting future revenues than average professional critic reviews.
Overall, our study has established that online ratings are a useful source of information about
a movie’s long-term prospects, enabling exhibitors and distributors to obtain revenue forecasts
of a given accuracy sooner than with older techniques.
1
1 Introduction
Recent advances in information technology have enabled the creation of a diverse mosaic of technology-
mediated word-of-mouth communities where individuals exchange experiences and opinions on a va-
riety of topics ranging from products and services, to politics and world events1. Online communities
allow opinions of a single individual to instantly reach thousands, or even millions, of other people.
This escalation in audience is altering the dynamics of many industries where word-of-mouth has
traditionally played an important role. For example, the entertainment industry has found that the
rapid spread of word-of-mouth is shrinking the lifecycles of its products (movies) and causing it to
rethink its release and marketing strategies2.
Rapid measurement is the first prerequisite of the fast reactions that are needed in this new
playing field. Fortunately, in addition to accelerating its diffusion, the Internet has made word-
of-mouth instantly measurable: traces of word-of-mouth can be found in many publicly available
Internet forums, such as product review sites, discussion groups, chat rooms, and web logs. This
public data provides organizations with the newfound ability to measure word-of-mouth as it happens
by monitoring information available on the Internet.
Unfortunately, unlike traditional media, online word-of-mouth currently lacks an accepted set
of metrics. Therefore, even though firms can collect large amounts of information from online
communities, it is not yet clear how they should analyze it. Only a handful of studies have looked
at the information value of online word-of-mouth; each has studied a different type of community
and (perhaps as a consequence of this) has found a different metric to be most relevant. Godes
and Mayzlin (2004) studied unstructured Usenet conversations about TV shows. They related
various metrics of these conversations to a dynamic model of sales and found that the "dispersion"
of conversations across communities had explanatory power, whereas the volume of conversations
did not. Liu (2004) found that the volume of messages posted on Internet message boards about
upcoming and newly released movies was a better predictor of their box office success than the1Examples of such communities include online product review forums, Internet discussion groups, instant messag-
ing chat rooms, mailing lists and web logs. Schindler and Bickart (2003) provide a comprehensive overview.2Movies are seeing much more rapid change in revenues between the opening weekend and second weekend,
suggesting that public opinion is spreading faster (Lippman 2003). Rick Sands, the chief operating officer at Miramax,summarized this trend by stating that “In the old days . . . you could buy your gross for the weekend and overcomebad word of mouth, because it took time to filter out into the general audience. Those days are over. Today, thereis no fooling the public” (Muñoz, 2003).
2
valence (percentage of messages that express positive opinions) of these messages.
This paper focuses on another important type of online word-of-mouth: numerical product
ratings posted by consumers online. In the last few years, a number of popular web sites (such
as Amazon, Epinions, Yahoo, etc.) have attempted to introduce structure into the conversations
posted therein by allowing users to submit numerical ratings about the topic being discussed in
addition to (or instead of) a more detailed text review. The introduction of numerical ratings has
significantly lowered the cost of submitting evaluations online. This has led to a rapid increase of
the number of consumers who became active contributors.
Our objective is to establish evidence for the usefulness of online product ratings in revenue
forecasting of new experience goods. Furthermore, we are interested in understanding what metrics
of online ratings are the most informative indicators of a product’s future sales and how the ex-
planatory power of such metrics compares to that of other variables (such as marketing expenditures
and expert reviews) that have traditionally been used for similar purposes in the past. We focus
our attention on online movie ratings and incorporate our findings into practical motion picture
revenue forecasting models that use very early (opening weekend) box office and movie ratings data
to generate remarkably accurate forecasts of a movie’s future revenue trajectory3.
A number of factors make the motion picture industry an ideal test bed for this type of study.
First, it is an industry where word-of-mouth plays an important role. Second, there is widespread
availability of movie ratings on the Internet; the most popular sites (Yahoo! Movies, IMDB, Rotten-
Tomatoes.com) receive hundreds of ratings within hours of a new movie’s release. Third, production,
marketing and daily box office data are easily available for most movies, making it easy to corre-
late the dynamic evolution of a movie’s performance to that of online ratings. Fourth, a sizable
academic literature exists on motion picture revenue forecasting (Section 2 provides an overview).
Several of these studies have attempted to model the impact of word-of-mouth on movie revenues;
most, however, have relied on more traditional explanatory variables, such as a movie’s star power,
marketing expenditures, distribution strategy, or professional critic reviews. These studies, thus,
serve as a useful benchmark for assessing the added value of online ratings.3Throughout the paper, our perspective is that online ratings consititute a valuable real-time “window” into
consumer attitudes that can be exploited by firms to forecast future revenues earlier than with more traditionalmethods. Our study does not attempt to consider the important question of whether online ratings influence (asopposed to predict) future revenues.
3
We developed and tested a family of forecasting models, based on a novel extension of the Bass
model of product diffusion (Bass 1969) that takes into consideration the unique properties of the
motion picture industry. Among the metrics of online ratings we considered, we found the valence
(average numerical value) of user ratings to be the most significant explanatory variable. The gender
diversity of online raters was also significant, supporting the theory that word-of-mouth that is more
widely dispersed among different social groups is more effective (Godes and Mayzlin 2004). The
daily volume of online ratings was highly correlated with the corresponding box office revenues. It
is, therefore, best viewed as a proxy of sales volume. Our results support the hypothesis that the
impact of word-of-mouth on future sales is proportional to the volume of past adopters; we did not
find any special significance of the volume of online ratings beyond that.
Interestingly, our analysis found user ratings to be more influential in predicting future revenues
than average professional critic ratings. Given the amount of attention that critic ratings have
been receiving until now, this result has considerable practical consequences. At the same time,
the correlation between user and expert ratings was relatively low; higher predictive power could
be achieved by combining them. This finding provides support for the credibility of user ratings,
but also suggests that they should best be viewed as a complement, rather than as a substitute, of
expert reviews.
Using only opening weekend box office and online ratings data, our best model was able to
forecast the total revenue of movies in a randomly chosen hold-out subset of our sample with an
average relative absolute error of 14.1%. As we discuss in Section 5, such levels of accuracy would
have required the use of two weeks of box office data using older techniques.
Overall, our study provides positive evidence that online ratings are a useful source of information
about a movie’s long-term prospects. From a managerial perspective, the added value of online
ratings is that they allow forecasts of a given accuracy to be obtained sooner than with older
techniques. The ability to generate very early forecasts has the potential to alter the way that the
movie industry is using such tools. Currently, post-release forecasts are primarily of value to movie
exhibitors who use them to better manage the yield from their exhibition capacity. We believe that
the real-time availability of reliable estimates of word-of-mouth can have important implications
for motion picture marketing as well. Such information may allow movie distributors to fine-tune a
movie’s campaign, or to develop entirely new marketing strategies that can attempt to respond to
4
an audience’s initial reception of a new movie.
The rest of the paper is organized as follows. Section 2 discusses related work. Section 3 describes
our data set. Section 4 introduces our forecasting models. Section 5 presents the results of fitting
our models to our data set and compares their forecasting accuracy to that of older models. Finally,
Section 6 summarizes our findings, discusses the managerial implications of this work, points to its
limitations, and suggests potential avenues for future research.
2 Related Work
Our work relates to two important streams of past research: forecasting models of motion picture
revenues and methodologies for measuring word-of-mouth.
Forecasting models of motion picture revenues
Predicting the success of a motion picture has largely been viewed in the industry as a “wild guess”
(Litman and Ahn 1998). Despite such difficulty, several researchers have proposed models that
attempt to forecast motion picture revenues. Such models can be classified along two dimensions.
One classification can be based on the type of forecasting model employed:
1. Econometric models identify factors that predict or influence motion picture box office success.
A large variety of factors have been examined. Some studies have looked at movie charac-
teristics, such as star power (De Vany and Walls 1999; Ravid 1999), movie genre and MPAA
ratings (Austin and Gordon 1987), and academy awards (Dodds and Holbrook 1988). Oth-
ers have examined a movie’s media advertising (Faber and O’Guinn 1984), timing of release
(Krider and Weinberg 1996), distribution strategy (Jones and Mason 1990; Jones and Ritz
1991) and competition (Ainslie, Dreze and Zufryden 2003). Several researchers have studied
the role of professional critic reviews (Eliashberg and Shugan 1997; Reinstein and Snyder 2005;
Basuroy, Chatterjee and Ravid 2003). Finally, a few integrative studies examined the relative
contribution of a combination of factors (Litman 1983; Neelamegham and Chintagunta 1999;
Elberse and Eliashberg 2003; Boatwright et al. 2005).
2. Behavioral models focus on factors involved in individual decision making towards selecting
5
a movie to watch (Eliashberg and Sawney, 1994; Sawney and Eliashberg, 1996; Zufryden,
1996; De Silva 1998; Eliashberg et al. 2000). Such models usually employ a hierarchical
framework that develops forecasting models by relating behavioral traits of consumers to
aggregate econometric factors.
Another classification can be based on the timing of the forecast. Most of the proposed models
are designed to produce forecasts before a movie’s initial release (Litman 1983; Zufryden 1996; De
Silva 1998; Eliashberg et al. 2000) while others focus on forecasting later-week revenues after a
movie’s early box office revenues become known (Shawhney and Eliashberg 1996; Neelamegham
and Chintagunta 1999). The latter category tends to generate more accurate forecasting results due
to the fact that these models have access to more explanatory variables, including early box office
receipts, critic reviews, and word-of-mouth effects.
Our study proposes a family of diffusion models whose goal is to forecast later-week revenues
very soon (i.e. within 2-3 days) after a movie’s initial release. The novelty of our approach lies
in the examination of various metrics of online ratings as a proxy of word-of-mouth. To the best
of our knowledge we are the first to examine the use of these metrics in the context of movie
revenue forecasting4. Our contribution lies in establishing which metrics of online ratings are the
best predictors of motion picture performance and in comparing the predictive power of these new
metrics to that of more traditional explanatory variables used in past research such as a movie’s
marketing expenditures, distribution strategy, and professional critic reviews.
Methodologies for measuring word-of-mouth
Traditional attempts to measure word-of-mouth are based on two principal techniques: inference and
survey. For example, Bass (1969) and those who have extended his model typically use aggregated
sales data to infer the model’s coefficient of internal influence, which, in turn is assumed to relate
to word-of-mouth. As another example, Reingen et al. (1984) conduct a survey of the members of
a sorority in which they compare brand preference congruity between women that lived in the same4Concurrently and independently Liu (2004) studied the impact of unstructured online discussions on movie
revenues. Our study, in contrast, focuses on numerical online ratings. Whereas Liu found that the volume ofdiscussion was significant but its valence (positive or negative) marginally so, our study finds the valence of userratings to be the most significant variable. Furthermore, our modified Bass model helps disentangle the different wayin which the volume and valence of ratings both relate to the evolution of a movie’s box office revenues.
6
house and those that did not. They find that those that lived together had more congruent brand
preferences than those that did not. The study then infers that those that lived together had more
opportunities for interaction and thus, that word-of-mouth communication was more prevalent.
Surveys remain the most popular method to study word of mouth, largely because individuals
can be asked directly about their communication habits; the error then lies in the self-reporting of
behavior. Several well-known studies, such as Bowman and Narayandas (2001), Brown and Reingen
(1987), Reingen and Kernan (1986) and Richins (1983), base their analyses on proprietary surveys
designed to test a specific hypothesis related to word-of-mouth.
The advent of the Internet introduced a third technique for measuring word of mouth: directly
through online discussion groups and online review forums. Researchers can easily gather large
amounts of data from such forums. Nevertheless, sound methodological principles for analyzing
such data are still in the process of being established. Previous research has looked at unstructured
online discussion forums and has used volume and dispersion when examining online word of mouth.
The theory behind measuring dispersion, or the spread of communication across communities, is
that word of mouth spreads quickly within communities, but slowly across them (Granovetter 1973).
Godes and Mayzlin (2004) have found that the dispersion of conversations about weekly TV shows
across Internet communities has positive correlation with the evolution of viewership of these shows.
The theory behind volume is that the more consumers discuss a product, the higher the chance that
other consumers will become aware of it. In a recent paper, Duan et. al. (2005) explore the dynamic
relationship between online user reviews and motion picture box office revenues. They find that,
whereas the volume of online postings shows significant correlation with box office sales, the valence
(average numerical rating) of those postings does not have a significant impact. In this study we
extend previous attempts to measure the impact of online word-of-mouth by looking at structured
product rating forums and suggesting methodologies that endogenize the impact of volume and,
thus, allow us to better explore the impact of the valence of online feedback.
7
Variable Min Mean Max Box office (aggregate; in millions) 2.5 68.1 403.7 Production Budget (in millions) 2 46.1 140 Marketing Budget (in millions) 2 24.3 50 Exhibition longevity (in weeks) 3 14 51 Screens in opening week 4 2,393 3,615 Volume of total user ratings 67 689 6,295 Volume of first week user ratings 2 312 3,802 Volume of critic ratings 7 13 20 Average aggregate user rating (range 1-5) 1.9 3.4 4.4 Average critic rating (range 1-5) 1.4 3.1 4.6
Total number of movies 80 Total number of user ratings 55,156 Total number of critic ratings 1,040 Total number of unique users 34,893
Table 1: Key summary statistics of our data set.
3 Data Set
Data Collection Methodology
Data for this study were collected from Yahoo! Movies (http://movies.yahoo.com) and BoxOffice-
Mojo (http://www.boxofficemojo.com). From Yahoo! Movies, we collected the names of all movies
released during 2002. For the purpose of our analysis, we excluded titles that were (a) not released in
the United States, (b) not a theatrical release (e.g. DVD releases), or (c) not released nation-wide.
For each of the remaining titles we collected detailed ratings information, including all professional
critic reviews (text and letter ratings, which we converted to a number between 1 and 5) and all
user reviews (date and time of review, user id, review text, integer ratings between 1 and 5).
We used Boxofficemojo to obtain weekly box office, budget and marketing expenses data. This
information was missing for several movies from the publicly accessible parts of that site. We
obtained a data set of 80 movies with complete production, weekly box office, critic reviews and
daily user review data5. Our final data set consists of 1188 weekly box office data, 1040 critic
reviews (an average of 13 reviews per movie), and 55156 user reviews from 34893 individual users
(an average of 689 reviews per movie and 1.5 reviews per user). Table 1 provides some key summary
statistics.5The final movie sample was found to have similar overall profile with the full set of nationally-released 2002
movies (in terms of genre, budget, and marketing), ensuring that no bias was introduced by considering only a moviesubset.
8
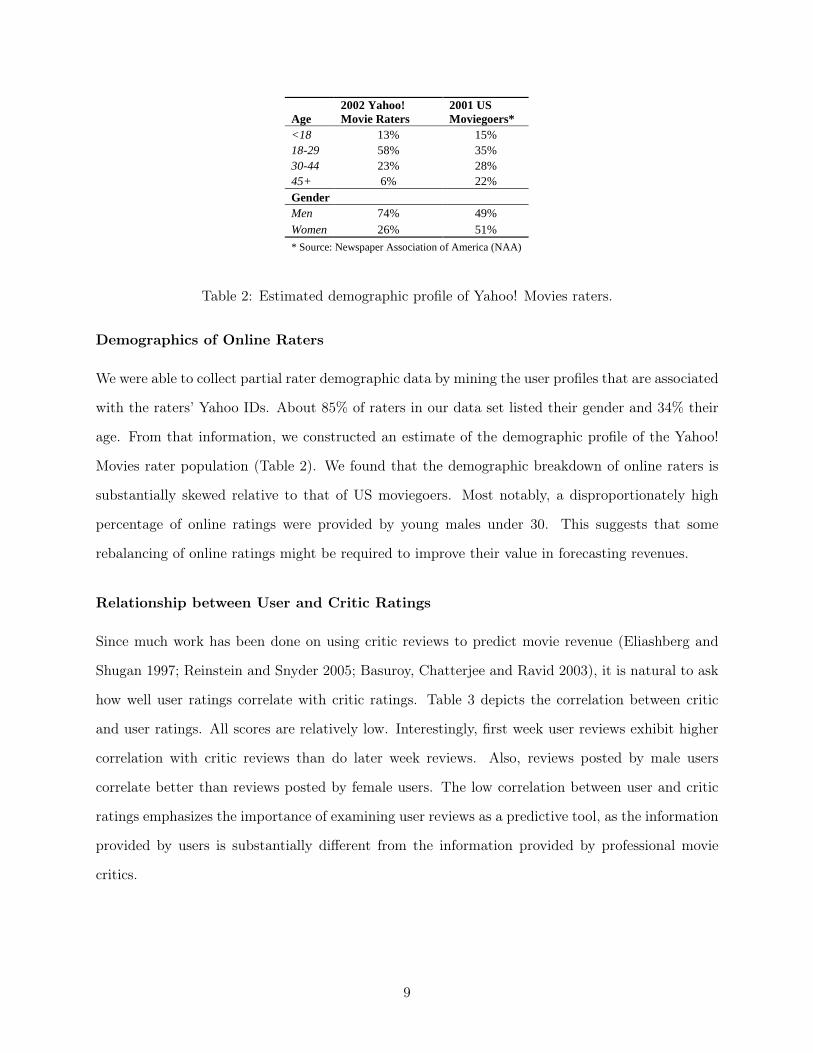
Age 2002 Yahoo! Movie Raters
2001 US Moviegoers*
<18 13% 15% 18-29 58% 35% 30-44 23% 28% 45+ 6% 22% Gender Men 74% 49% Women 26% 51%
* Source: Newspaper Association of America (NAA)
Table 2: Estimated demographic profile of Yahoo! Movies raters.
Demographics of Online Raters
We were able to collect partial rater demographic data by mining the user profiles that are associated
with the raters’ Yahoo IDs. About 85% of raters in our data set listed their gender and 34% their
age. From that information, we constructed an estimate of the demographic profile of the Yahoo!
Movies rater population (Table 2). We found that the demographic breakdown of online raters is
substantially skewed relative to that of US moviegoers. Most notably, a disproportionately high
percentage of online ratings were provided by young males under 30. This suggests that some
rebalancing of online ratings might be required to improve their value in forecasting revenues.
Relationship between User and Critic Ratings
Since much work has been done on using critic reviews to predict movie revenue (Eliashberg and
Shugan 1997; Reinstein and Snyder 2005; Basuroy, Chatterjee and Ravid 2003), it is natural to ask
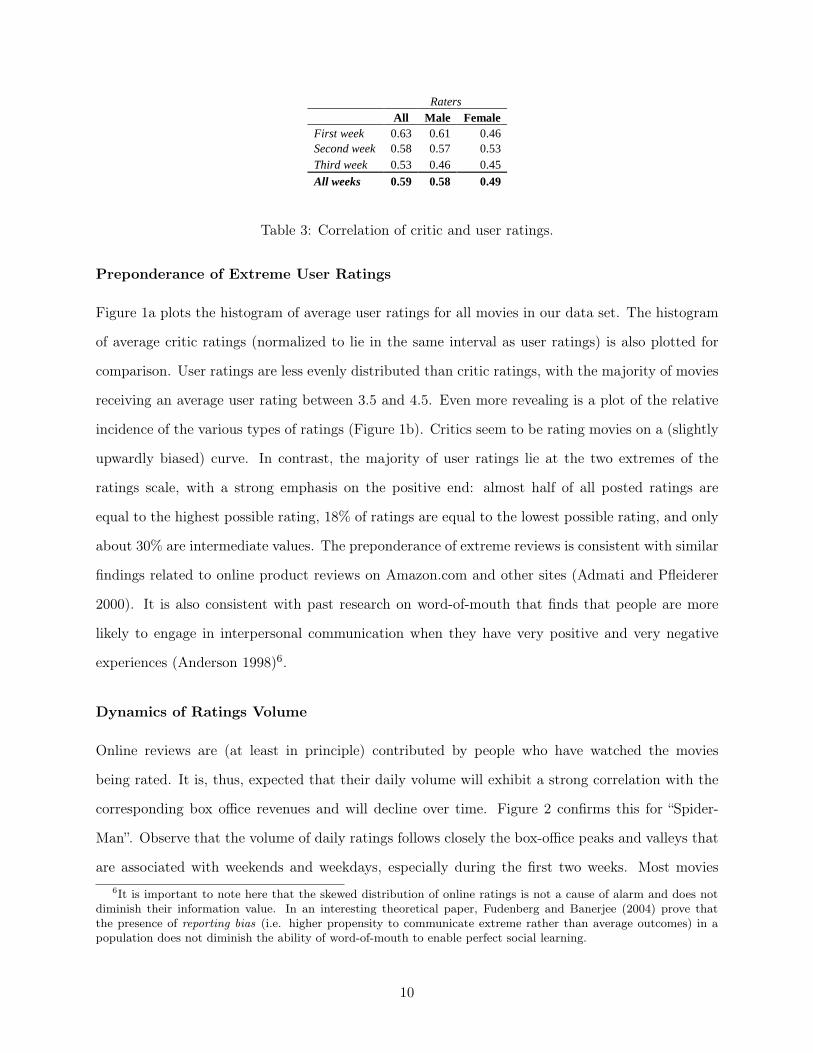
how well user ratings correlate with critic ratings. Table 3 depicts the correlation between critic
and user ratings. All scores are relatively low. Interestingly, first week user reviews exhibit higher
correlation with critic reviews than do later week reviews. Also, reviews posted by male users
correlate better than reviews posted by female users. The low correlation between user and critic
ratings emphasizes the importance of examining user reviews as a predictive tool, as the information
provided by users is substantially different from the information provided by professional movie
critics.
9
Raters All Male Female
First week 0.63 0.61 0.46 Second week 0.58 0.57 0.53 Third week 0.53 0.46 0.45
All weeks 0.59 0.58 0.49
Table 3: Correlation of critic and user ratings.
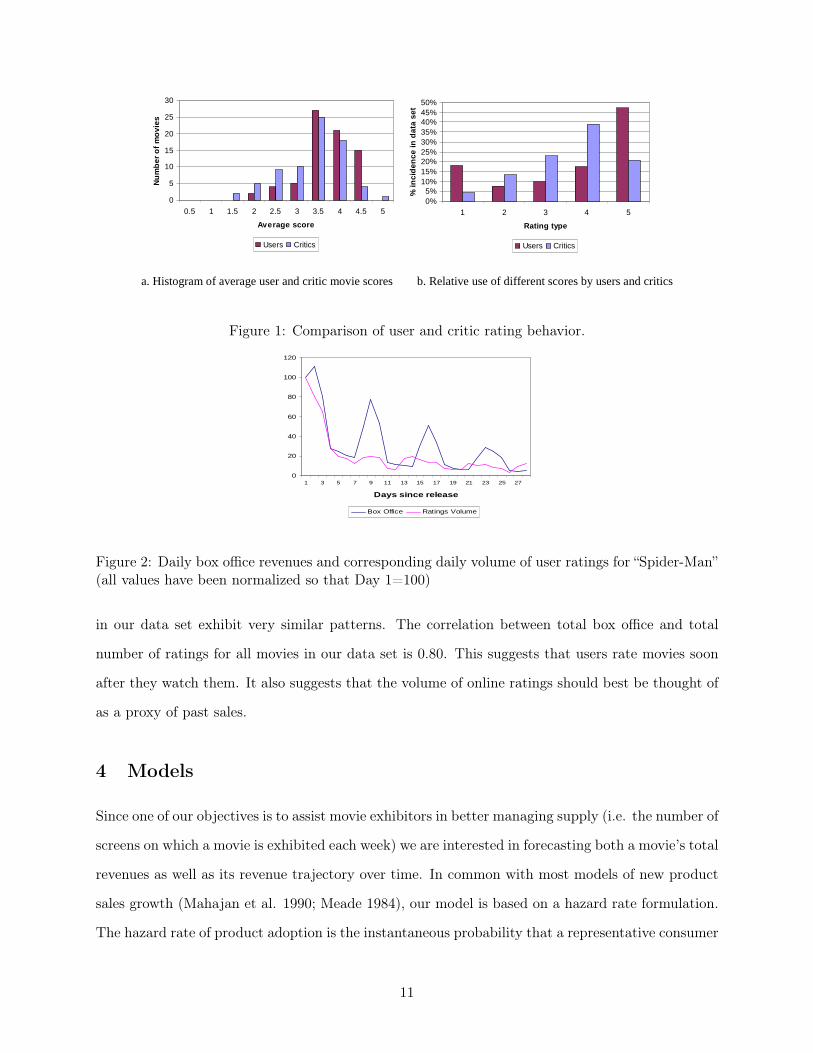
Preponderance of Extreme User Ratings
Figure 1a plots the histogram of average user ratings for all movies in our data set. The histogram
of average critic ratings (normalized to lie in the same interval as user ratings) is also plotted for
comparison. User ratings are less evenly distributed than critic ratings, with the majority of movies
receiving an average user rating between 3.5 and 4.5. Even more revealing is a plot of the relative
incidence of the various types of ratings (Figure 1b). Critics seem to be rating movies on a (slightly
upwardly biased) curve. In contrast, the majority of user ratings lie at the two extremes of the
ratings scale, with a strong emphasis on the positive end: almost half of all posted ratings are
equal to the highest possible rating, 18% of ratings are equal to the lowest possible rating, and only
about 30% are intermediate values. The preponderance of extreme reviews is consistent with similar
findings related to online product reviews on Amazon.com and other sites (Admati and Pfleiderer
2000). It is also consistent with past research on word-of-mouth that finds that people are more
likely to engage in interpersonal communication when they have very positive and very negative
experiences (Anderson 1998)6.
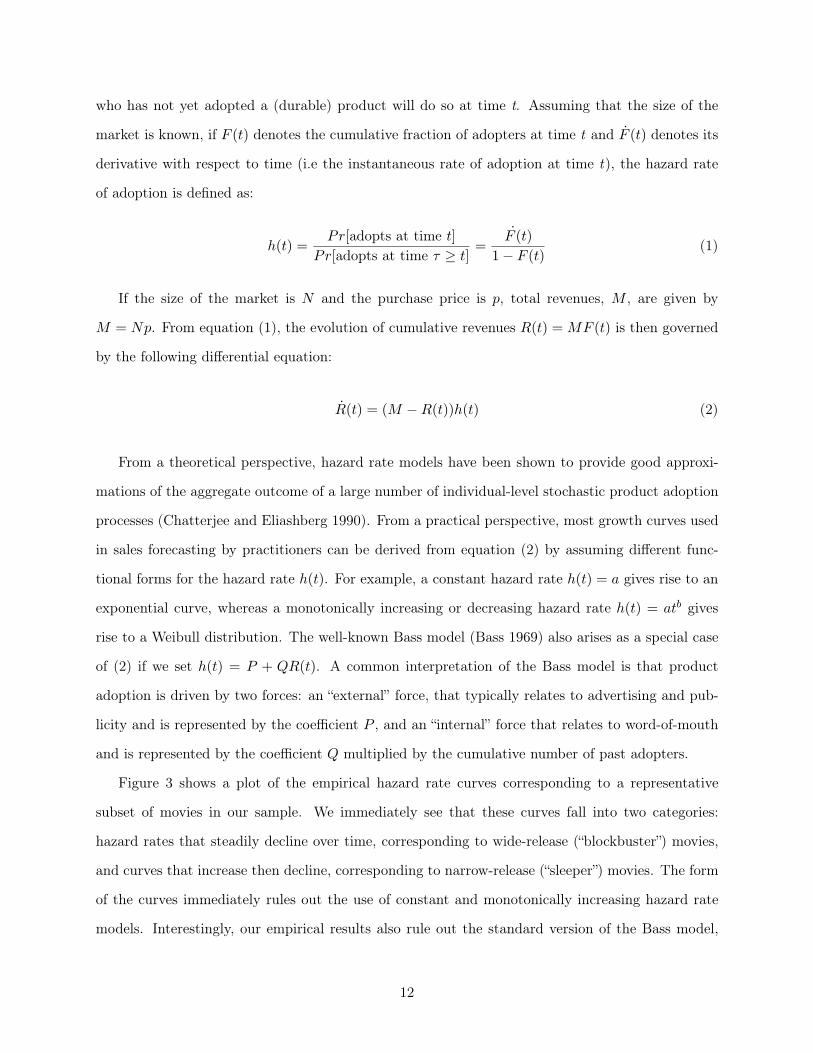
Dynamics of Ratings Volume
Online reviews are (at least in principle) contributed by people who have watched the movies
being rated. It is, thus, expected that their daily volume will exhibit a strong correlation with the
corresponding box office revenues and will decline over time. Figure 2 confirms this for “Spider-
Man”. Observe that the volume of daily ratings follows closely the box-office peaks and valleys that
are associated with weekends and weekdays, especially during the first two weeks. Most movies6It is important to note here that the skewed distribution of online ratings is not a cause of alarm and does not
diminish their information value. In an interesting theoretical paper, Fudenberg and Banerjee (2004) prove thatthe presence of reporting bias (i.e. higher propensity to communicate extreme rather than average outcomes) in apopulation does not diminish the ability of word-of-mouth to enable perfect social learning.
10
a. Histogram of average user and critic movie scores b. Relative use of different scores by users and critics
0%5%
10%15%20%25%30%35%40%45%50%
1 2 3 4 5
Rating type
% in
cid
ence
in d
ata
set
Users Critics
0
5
10
15
20
25
30
0.5 1 1.5 2 2.5 3 3.5 4 4.5 5
Average score
Nu
mb
er o
f m
ovi
es
Users Critics
Figure 1: Comparison of user and critic rating behavior.
0
20
40
60
80
100
120
1 3 5 7 9 11 13 15 17 19 21 23 25 27
Days since release
Box Office Ratings Volume
Figure 2: Daily box office revenues and corresponding daily volume of user ratings for “Spider-Man”(all values have been normalized so that Day 1=100)
in our data set exhibit very similar patterns. The correlation between total box office and total
number of ratings for all movies in our data set is 0.80. This suggests that users rate movies soon
after they watch them. It also suggests that the volume of online ratings should best be thought of
as a proxy of past sales.
4 Models
Since one of our objectives is to assist movie exhibitors in better managing supply (i.e. the number of
screens on which a movie is exhibited each week) we are interested in forecasting both a movie’s total
revenues as well as its revenue trajectory over time. In common with most models of new product
sales growth (Mahajan et al. 1990; Meade 1984), our model is based on a hazard rate formulation.
The hazard rate of product adoption is the instantaneous probability that a representative consumer
11
who has not yet adopted a (durable) product will do so at time t. Assuming that the size of the
market is known, if F (t) denotes the cumulative fraction of adopters at time t and F (t) denotes its
derivative with respect to time (i.e the instantaneous rate of adoption at time t), the hazard rate
of adoption is defined as:
h(t) =Pr[adopts at time t]
Pr[adopts at time τ ≥ t]=
F (t)1− F (t)
(1)
If the size of the market is N and the purchase price is p, total revenues, M , are given by
M = Np. From equation (1), the evolution of cumulative revenues R(t) = MF (t) is then governed
by the following differential equation:
R(t) = (M −R(t))h(t) (2)
From a theoretical perspective, hazard rate models have been shown to provide good approxi-
mations of the aggregate outcome of a large number of individual-level stochastic product adoption
processes (Chatterjee and Eliashberg 1990). From a practical perspective, most growth curves used
in sales forecasting by practitioners can be derived from equation (2) by assuming different func-
tional forms for the hazard rate h(t). For example, a constant hazard rate h(t) = a gives rise to an
exponential curve, whereas a monotonically increasing or decreasing hazard rate h(t) = atb gives
rise to a Weibull distribution. The well-known Bass model (Bass 1969) also arises as a special case
of (2) if we set h(t) = P + QR(t). A common interpretation of the Bass model is that product
adoption is driven by two forces: an “external” force, that typically relates to advertising and pub-
licity and is represented by the coefficient P , and an “internal” force that relates to word-of-mouth
and is represented by the coefficient Q multiplied by the cumulative number of past adopters.
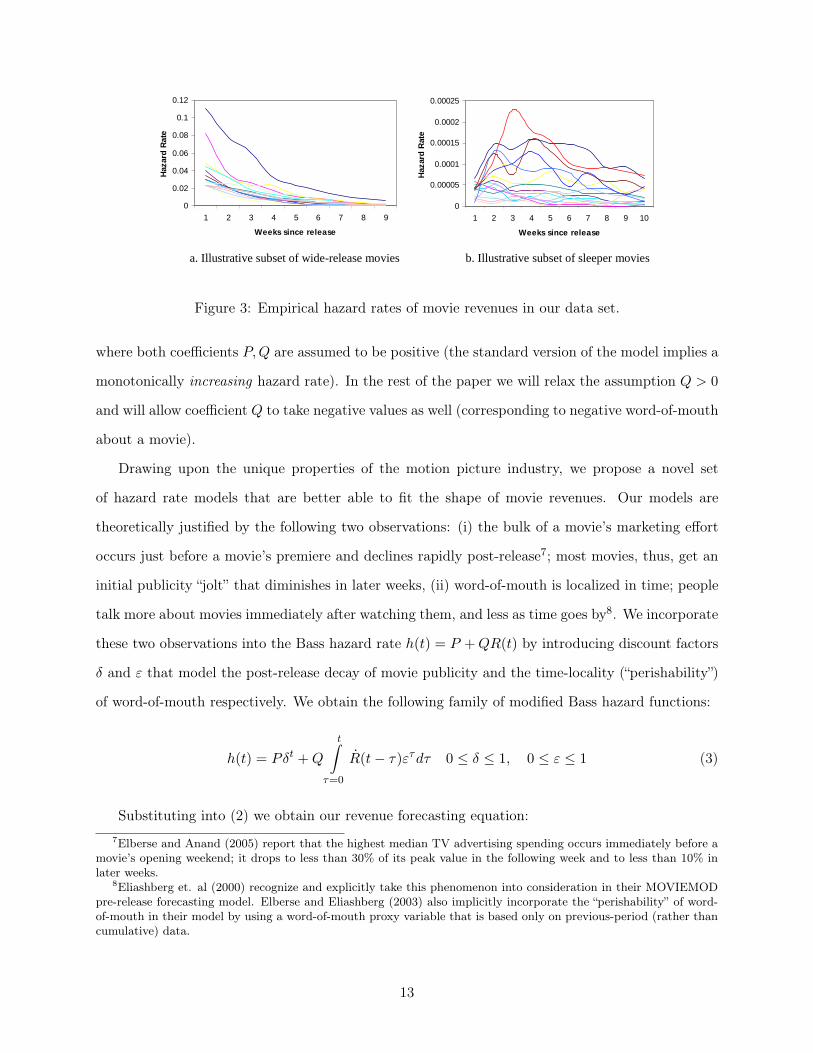
Figure 3 shows a plot of the empirical hazard rate curves corresponding to a representative
subset of movies in our sample. We immediately see that these curves fall into two categories:
hazard rates that steadily decline over time, corresponding to wide-release (“blockbuster”) movies,
and curves that increase then decline, corresponding to narrow-release (“sleeper”) movies. The form
of the curves immediately rules out the use of constant and monotonically increasing hazard rate
models. Interestingly, our empirical results also rule out the standard version of the Bass model,
12
a. Illustrative subset of wide-release movies b. Illustrative subset of sleeper movies
0
0.02
0.04
0.06
0.08
0.1
0.12
1 2 3 4 5 6 7 8 9
Weeks since release
Haz
ard
Rat
e
0
0.00005
0.0001
0.00015
0.0002
0.00025
1 2 3 4 5 6 7 8 9 10
Weeks since release
Haz
ard
Rat
e
Figure 3: Empirical hazard rates of movie revenues in our data set.
where both coefficients P, Q are assumed to be positive (the standard version of the model implies a
monotonically increasing hazard rate). In the rest of the paper we will relax the assumption Q > 0
and will allow coefficient Q to take negative values as well (corresponding to negative word-of-mouth
about a movie).
Drawing upon the unique properties of the motion picture industry, we propose a novel set
of hazard rate models that are better able to fit the shape of movie revenues. Our models are
theoretically justified by the following two observations: (i) the bulk of a movie’s marketing effort
occurs just before a movie’s premiere and declines rapidly post-release7; most movies, thus, get an
initial publicity “jolt” that diminishes in later weeks, (ii) word-of-mouth is localized in time; people
talk more about movies immediately after watching them, and less as time goes by8. We incorporate
these two observations into the Bass hazard rate h(t) = P + QR(t) by introducing discount factors
δ and ε that model the post-release decay of movie publicity and the time-locality (“perishability”)
of word-of-mouth respectively. We obtain the following family of modified Bass hazard functions:
h(t) = Pδt + Q
t∫
τ=0
R(t− τ)ετdτ 0 ≤ δ ≤ 1, 0 ≤ ε ≤ 1 (3)
Substituting into (2) we obtain our revenue forecasting equation:7Elberse and Anand (2005) report that the highest median TV advertising spending occurs immediately before a
movie’s opening weekend; it drops to less than 30% of its peak value in the following week and to less than 10% inlater weeks.
8Eliashberg et. al (2000) recognize and explicitly take this phenomenon into consideration in their MOVIEMODpre-release forecasting model. Elberse and Eliashberg (2003) also implicitly incorporate the “perishability” of word-of-mouth in their model by using a word-of-mouth proxy variable that is based only on previous-period (rather thancumulative) data.
13
R(t) = (M −R(t))(Pδt + Q
t∫
τ=0
R(t− τ)ετdτ) (4)
Despite its apparent complexity, equation (4) has a simple intuitive interpretation: the instan-
taneous probability that a non-adopter will adopt a product at time t is proportional to the residual
impact of early publicity surrounding the product, as well as word-of-mouth from previous adopters,
where the impact of conversations with recent adopters is greater than the impact of conversations
with earlier adopters (or, alternatively, where recent adopters talk more than early adopters). The
above equation defines a fairly general class of models. Depending on the values of parameters
P, Q, M, δ, ε, hazard function that are monotonically increasing, monotonically decreasing, or in-
verse U-shaped (first increasing, then decreasing) can be generated. For δ = ε = 1, equation (4)
reduces to the standard Bass model.
Given a sample of movies with known weekly box office revenues, production, and ratings data,
estimation of a revenue forecasting model based on equation (4) requires two steps: First, using
nonlinear least squares estimation, equation (4) is fitted to weekly box office revenue data. This
step produces a set of coefficients Pi, Qi,Mi, δi, εi for each movie in our sample. Second, linear
prediction models are developed for each of the 5 coefficients by regressing the estimates produced
by the first step against the set of available covariates. To forecast future box office revenues of a
new movie we reverse the process: Using early (production, box office, and online ratings) data and
the prediction models of the second step we derive estimates P , Q, M , δ, ε of the five coefficients
for the new movie. Substitution into (4) and numerical integration then provide a forecast of the
movie’s cumulative revenues at any future point in time.
We experimented with fitting the full 5-parameter model to revenue data of our sample. Al-
though model fit to weekly revenue data was excellent (Adjusted R2 > 0.99), the overall ability of
the model to forecast revenues was very poor, since the errors of the five linear prediction mod-
els generated by the second step of the model estimation procedure were compounded in the final
forecast.
A more effective model was obtained by limiting the degrees of freedom of equation (4). Specif-
ically, we assume that (i) discount factors δ, ε do not change across different movies, and (ii) the
maximum theoretical market size N is the same for all movies and equal to the entire population
14
of moviegoers. The theoretical justification for the last assumption is based on the observation that
most movies are taken out of theaters not when they exhaust their full market potential, but rather,
when their rate of revenue growth falls below the opportunity cost of screening the movie (relative
to screening a newer, potentially more profitable movie)9. Based on this observation, we make the
(arguably, rather extreme) assumption that, if a movie remains on theaters forever, all moviegoers
will eventually watch it, albeit at an arbitrarily slow rate. If we take δ and ε as given, the above
two assumptions leave our model with only two free parameters (Pi, Qi) per movie.
We acknowledge that our assumption regarding a movie’s eventual number of adopters (equal
to the entire population for all movies) is unorthodox, especially in comparison with the traditional
Bass model literature. Observe, however, that, whereas an accurate estimate of a product’s max-
imum market potential is essential in the traditional Bass model, it is less so in our model. The
traditional Bass model h(t) = P + QR(t), P, Q > 0 has a monotonically increasing hazard rate.
Therefore, the only way in which the sales curve can level off is if the market is exhausted. This
property makes the shape of sales forecasts particularly sensitive to the estimated maximum market
potential. The more general model formulation we propose allows the hazard rate to become arbi-
trarily small before the market is saturated. As long as we choose M to be higher than the highest
total revenues of any product in our sample, our model is capable of approximating a large variety
of sales growth curves using only two free parameters. Most notably, our model does not require
the direct estimation of a movie’s market potential as a separate parameter, avoiding an additional
source of forecasting error.
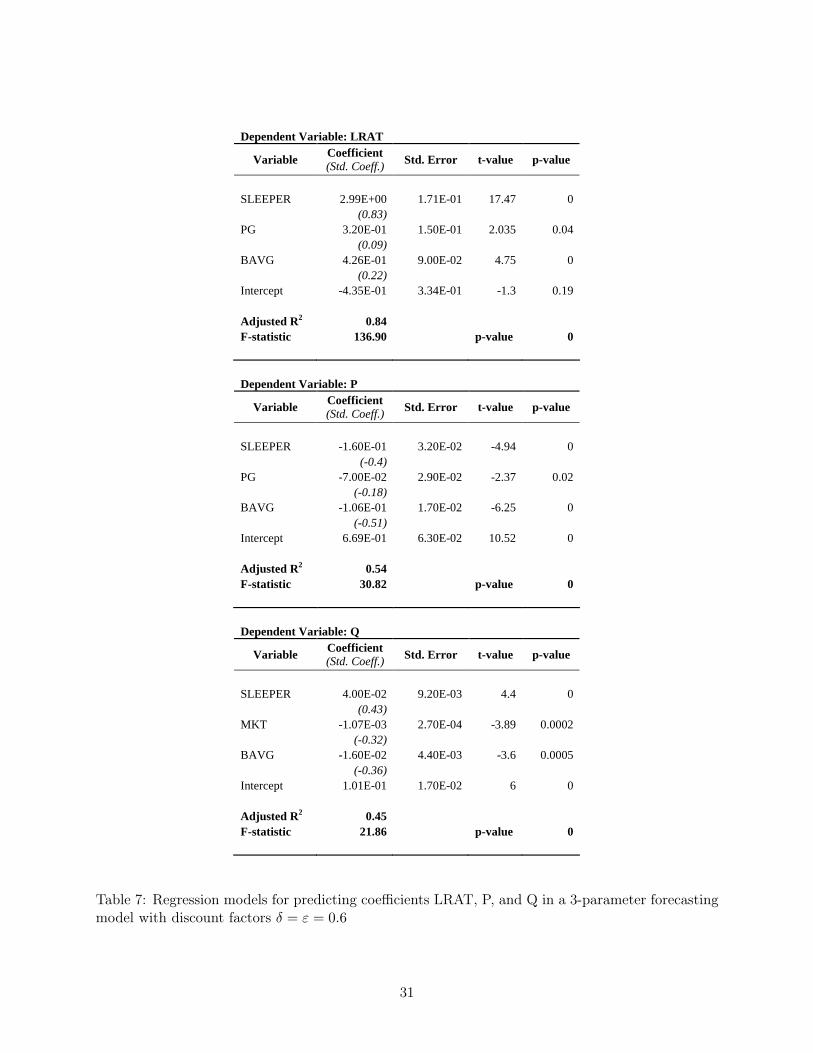
Of course, the litmus test of any forecasting model is its forecasting accuracy. Appendix A (to
be read after Section 5) compares the forecasting accuracy of our 2-parameter models with that
of a more conventional 3-parameter family that assumes that a movie’s total box office revenues
represent its market potential. We show that the 2-parameter family outperforms the 3-parameter
family by a factor of almost 100%.9The increasingly profitable secondary market of movie rentals and DVDs provides compelling evidence for the
validity of this assumption.
15
Production, marketing, and distribution strategy BDG Production budget (in millions of $) MKT Estimated marketing costs (in millions of $) SCR Number of screens in opening week SLEEPER Categorical variable indicating if movie is sleeper or wide-release MPAA Rating (dummy variables) G, PG, PG13, R, NR Genre (dummy variables) SCIFI, THRILLER, COMEDY, ROMANCE, DRAMA, ACTION, KIDS Professional Critic Ratings CRAVG Arithmetic mean of professional critics reviews
User Ratings BAVG Balanced arithmetic mean of user ratings posted during opening weekend* TOT Total number of user ratings posted during opening weekend AENTR Entropy of age group distribution of opening weekend raters GENTR Entropy of gender distribution of opening weekend raters Box office data BOX Box office revenues during opening weekend (in millions of $) *Average of arithmetic means of ratings posted by males and females
Table 4: List of independent variables.
5 Results
Independent Variables
Table 4 lists all independent variables used in subsequent analyses.
Production, Marketing and Availability. Several authors have shown that the budget, advertising
and availability of a film is significantly related to its box office performance (Litman 1983; Litman
and Kohl 1989; Litman and Ahn 1998; Ravid 1999; Elberse and Eliashberg 2003). Accordingly, we
include a movie’s production budget (BDG), marketing budget (MKT ), number of opening weekend
screens (SCR) to our variable list.
Release Strategy. Most movies are released using one of two distinct strategies. Wide-release
16
or “blockbuster” movies (such as Star Wars) open simultaneously in large numbers of theaters
worldwide and are accompanied by intensive pre-release marketing campaigns. Revenues for such
movies typically peak during the first weekend and exhibit a steady decline in subsequent weeks.
“Sleeper” movies (such as My Big Fat Greek Wedding) are initially released in small numbers of
theaters with modest marketing campaigns and rely on word-of-mouth for growth. Revenue streams
for such movies typically increase for several weeks before they start to decline. Given the different
growth patterns of these two movie categories, it is reasonable to expect that release strategy
will have an important impact on parameters P and Q. Accordingly, we use a dummy variable
(SLEEPER) to distinguish between the two classes of movies in our sample. We coded a movie as
a “sleeper” if its number of opening weekend screens was less than 30010.
MPAA Ratings. Ravid (1999) found MPAA ratings to be significant variables in his regressions.
We code MPAA ratings using five dummy variables (G, PG, PG13, R, and NR).
Genre. Several papers have included the genre of a film as a control variable (Austin and Gordon
1987; Litman 1983; Litman and Ahn 1998). We collected the genre description from Yahoo! Movies
and coded a movie’s genre using 7 dummy variables (Sci-Fi, Thriller, Children, Romance, Comedy,
Action, Drama).
Professional Critics. An important objective of our study is to compare the relative predictive
power of professional critics and user ratings. Accordingly, we included the arithmetic mean of the
numerical equivalent (see Section 3) of all professional critic ratings published by Yahoo for each
movie (CRAVG).
User Ratings. Past work on online word-of-mouth has considered the relationship of the volume,
valence, and dispersion of online conversations to product revenues (Godes and Mayzlin 2004; Liu
2004; Duan et al. 2005). We use the total number of posted ratings during the first three days
of a movie’s release (TOT ) as our measure of volume. We base our measure of valence on the
arithmetic mean of posted ratings during the same period. Given the substantial discrepancy that
exists between the demographics of online reviewers and those of moviegoers (Table 2), we found
that a balanced average (BAVG) metric, equal to the average of the arithmetic means of ratings
posted by (self-reported) male and female Yahoo users during the period of interest, performed10Our data set exhibited a clear clustering of movies with regards to the number of opening weekend screens: The
highest number of opening weekend screens for a movie classified as “sleeper” was 208. In constrast, the lowest numberof opening weekend screens for a wide-release movie was 809.
17
better than the raw average of all posted ratings.
According to the theory of strong and weak ties (Granovetter 1973), word-of-mouth is more
effective when it spreads among different social groups than when it remains confined within a single
group. The dispersion of online word-of-mouth about a product has, thus, been shown to exhibit
positive correlation with the evolution of its revenues (Godes and Mayzlin 2004). Finding a good
metric for dispersion was tricky in our context, because Yahoo! Movies does not allow threaded
discussions through which one could infer a network of strong and weak ties. We hypothesized,
however, that dispersion can be proxied through some measure of the demographic (gender, age)
diversity of each movie’s raters. The underlying assumption is that most movie conversations take
place within social groups of similar age or of the same gender. To test this hypothesis we included
the entropy of the (self-reported) gender and age distribution of each movie’s opening weekend
raters to our list of independent variables11.
Nonlinear Model Estimation
As we discuss in Section 4, estimation of our 2-parameter model requires fixing the values of pa-
rameters M, δ, ε for all movies. Since we did not have a basis for selecting a particular set of δ, ε,
we estimated separate models for all possible combinations of discount factors in increments of 0.1.
This gave us 100 models. Furthermore, we found that, as long as it was higher than the total
revenues of the highest-grossing movie in our sample, the choice of M was not very crucial to the
model’s forecasting accuracy (even though it did affect the combination of δ, ε that produced the
best results). The reported results are based on assuming M=$1000 million. This, in turn, corre-
sponds to the assumption of a population of 166 million moviegoers and an average ticket price of
$6.
The average fit of equation (4) to weekly revenue vectors of movies in our data set was excellent
with an average R2 > 0.98 for all pairs of discount factors where δ = ε. Model fit deteriorated
rapidly as parameters δ and ε diverged from each other12.11Given a population whose members are distributed among a finite number of disjoint classes i = 1, ..., N with
respective probabilities pi, entropy, defined as H = −∑ipilogpi, represents a measure of population diversity with
respect to that classification. Entropy is minimized if all members of the population belong to the same class. Onthe other hand, entropy is maximized if the population is evenly distributed among all classes.
12We were intrigued by this interesting empirical relationship; a rigorous exploration of its causes, however, fallsoutside of the scope of this paper. One possible explanation is that the mechanisms of decay (“consumer forgetting”)are similar for stimuli received through publicity or word-of-mouth channels. Thus, when averaged across all movies,
18
Regression Analysis
In this section we report the results of regressing the sets of coefficients Pi and Qi obtained by the
previous nonlinear estimation step to our list of independent variables. In selecting each model, we
followed a variable selection procedure similar to the traditional stepwise selection method: in each
step, we included a significant variable (at the 5% level) that brought the highest increase in adjusted
R2 and checked if inclusion of that variable caused a blow-up of the variance inflation factor (VIF),
a commonly used measure of multicollinearity. Following each variable inclusion step, we removed
any previously included variables that were no longer significant (at the 6% level). We stopped
adding variables when the adjusted R2 did not increase, when additional variables were no longer
significant, or when adding new variables resulted in VIF higher than 8 for any of the variables. We
repeated the above procedure for all combinations of discount factors and only accepted the subset
of variables that were significant in all 100 models. The resulting models are summarized in Table
513.
Coefficient P. Coefficient P can be predicted with very high accuracy (Adj-R2 = 0.99) from first
weekend box-office data (BOX ). This is not surprising and follows directly from the model definition.
(For t = 0, equation (4) gives P = R(0)/M) To get a better sense of the conceptual significance of
coefficient P we removed BOX from the list of independent variables and repeated variable selection
on the remaining covariates. We obtained a lower but still respectable (Adj-R2 = 0.78) model fit.
The two variables that were significant were marketing budget (MKT ) and user ratings volume
(TOT ), supporting our interpretation of coefficient P as capturing the “external” forces (marketing,
publicity) that drive initial movie revenues14.
Coefficient Q. Five variables were significant in predicting coefficient Q. Among categorical
variables, SLEEPER and PG were significant. The significance of SLEEPER is consistent with the
higher relative importance of word-of-mouth for sleeper movies. The (positive) significance of PG
relates to the fact that movies with less restrictive MPAA ratings generally do better in the box
publicity and word-of-mouth decay at the same rate. Further investigation is needed to explore the validity of thishypothesis and the presence or absence of similar relationships in other markets.
13The specific coefficients of each model depend on the choice of discount factors δ and ε. Table 5 reports coefficientsobtained for δ = ε = 0.6.
14We believe that the high statistical significance of the volume of opening week ratings (TOT ) in predictingcoefficient P is simply a consequence of the high correlation (0.80) between TOT and BOX, rather than a statementabout the impact of the volume of ratings on initial movie performance. TOT here acts simply as a proxy of boxoffice revenues, capturing a fraction of the variance of revenues that cannot be accounted for by the variation of MKT.
Table 6: Mean relative absolute error (RAE) of total revenue forecasts obtained through 2-parameterforecasting models and different pairs of discount factors.
Forecasting Accuracy
To test the forecasting accuracy of our models we followed a procedure similar to that used by
Sawhney and Eliashberg (1996). Specifically, we randomly divided our data set into a training set
of 50 movies and a hold-out set consisting of the remaining 30 movies. We used the training set to
calibrate regression equations for P, Q and then applied the equations to the hold-out set to obtain
forecasts of a movie’s total revenue at the end of its exhibition history.
Table 6 lists the average relative absolute error (RAE = |Predicted − Actual|/Actual) that
is associated with the above forecasts for each of the 100 combinations of discount factors δ, ε we
considered. Observe that forecasting errors are minimized when δ = ε and grow rapidly as the
two discount factors diverge from each another. We will, therefore, focus our attention on the case
δ = ε, corresponding to the (highlighted) diagonal terms of Table 6. As the two discount factors
range between 0 and 1, mean RAE first declines, reaches a minimum (14.1%) at δ = ε = 0.6 and
then begins to grow again. Interestingly, the case δ = ε = 1, that corresponds to the standard Bass
model, has a mean RAE of 16.1%. This is 14% higher than the mean RAE of our best discounted
model. Our forecasting results, thus, confirm our theory-based hypothesis that introduction of
discount factors to the two terms of a Bass equation improves the model’s forecasting accuracy in
the context of movie revenues.
Of the two post-release motion picture forecasting models we are aware of, only the model of
Sawhney and Eliashberg (1996) is directly comparable to ours15. Sawhney and Eliashberg (1996)15The model of Neelamegham and Chintagunta (1999) focuses on predicting first-week viewership for movies that
22
developed and tested BOXMOD-I, a model for forecasting the gross revenues of motion pictures
based on their early box-office data. They tested how the forecasting accuracy of their model
improves as more box-office data becomes available and reported mean RAE of 71.1%, 51.6%,
13.2%, 7.2% and 1.8% when using no box-office data, one week of data, two weeks of data, three
weeks of data and all available box-office data, respectively. Using only 3 days of box-office and
user and critic ratings data, our best model (2-parameter model with discount factors δ = ε = 0.6)
achieves levels of forecasting accuracy (mean RAE of 14.1%) for which BOXMOD-I requires two
weeks of box office data. This comparison reinforces our original hypothesis that the use of online
ratings enables reliable forecasts of the impact of a new experience good to be made much faster
than with older methodologies16.
6 Summary, Managerial Implications, and Research Opportunities
Product review sites are widespread on the Internet and rapidly gaining popularity among con-
sumers. Previous research has established that online product ratings have an influence on con-
sumer behavior (Chevalier and Mayzlin 2003; Senecal and Nantel 2004). This paper shows that
these systems can serve as a valuable source of information for firms as well. Specifically, firms can
use statistics of online ratings as a reliable proxy of word-of-mouth in revenue forecasting models
for new experience goods. We apply this idea to the context of motion pictures and propose motion
picture revenue-forecasting models that use statistics of online movie reviews posted by users on
Yahoo! Movies during the first weekend of a new movie’s release to forecast that movie’s future
box-office performance.
Online movie ratings are available in large numbers within hours of a new movie’s theatrical
release. As a predictor of a movie’s long-term revenues we have found them to be more informative
than other measures currently used by industry experts, such as critic reviews and early cumulative
revenues. Their use, thus, allows the generation of reliable forecasts much sooner. Specifically, we
have shown that, using only opening weekend (box-office, user and critic review) data, our approach
are introduced sequentially in different markets (e.g. different countries). They use post-release data from one marketin order to predict the movie’s performance in another market. Their objective, thus, is different from ours: ourmodel uses early box office and ratings data to predict a movie’s future performance in the same market.
16Since BOXMOD-I does not incorporate covariates, our result should be interpreted as evidence for explanatorypower of online ratings rather than as a statement about the power of the underlying behavioral model on whichBOXMOD-I is based.
23
can generate forecasts whose accuracy would require two weeks of data using older techniques.
The ability to derive early post-release forecasts of a new movie’s performance has traditionally
been of value to exhibitors (theater owners). Exhibitor chains need to manage the yield from their
exhibition capacity, based on their estimates of demand for movies that they are currently exhibiting.
Using such estimates they can adapt the exhibition capacity allocated to a new movie, either by
dropping the movie from a theater or by shifting it to a smaller (or larger) screening room. They
are, thus, very interested in early forecasts of gross box-office revenues in making their exhibition
decisions17. We argue that the ability to generate reliable forecasts so quickly after a movie’s
premiere can have important implications for motion picture marketing as well. Such knowledge
will allow movie distributors to fine-tune a movie’s campaign or, perhaps, to develop entirely new
marketing strategies that can respond to an audience’s initial reception of a new movie18.
In addition to its managerial implications, our study has produced several empirical insights
related to the use of online product ratings in revenue forecasting.
First, we found that the average valence of opening weekend user ratings was a highly significant
predictor of a movie’s long-term box office performance. Given that the demographics of online
raters are skewed relative to the population of moviegoers, we also found that rebalancing the
average valence of user ratings, by giving equal weight to the arithmetic mean of ratings posted by
males and females, improves their predictive accuracy.
Second, our analysis found user ratings to be more influential in predicting future revenues than
average professional critic reviews. Given the amount of attention that critic ratings have been
receiving until now, this result has considerable practical consequences. On the other hand, we
found the correlation between the user and critic ratings to be relatively low; our models were able
to achieve better forecasting accuracy by considering a weighted average of user and critic ratings.
This suggests that a degree of complementarity exists between the viewpoints of users and experts;
both can, thus, add value to predicting a new product’s future success.
Third, we found that the gender diversity of a movie’s online raters exhibits a positive correlation17Today exhibitors usually commit to exhibit a movie for a minimum of three to four weeks. However, the increasing
volatility of second and later-week revenues (Lippman 2003) plus the availability of rapid forecasting tools, such asthe ones we propose in this paper, might lead the industry to adopt more flexible contracts that allow exhibitors tore-evaluate their decisions immediately after the opening week.
18See Mahajan, Muller and Kerin (1984) for some early ideas on how firms can adapt advertising policies to positiveand negative word-of-mouth.
24
with that movie’s long-term revenues. This finding supports the theory that word-of-mouth that
is more widely dispersed among different social groups is more effective and suggests the need for
further research in developing good measures of WOM dispersion from online data.
Fourth, we found that the weekly volume of online ratings exhibits high correlation with weekly
sales, suggesting that people post ratings soon after they watch a movie. Our study supports the
hypothesis, commonly made in diffusion theory, that the impact of word-of-mouth on future sales is
proportional to the volume of past adopters but does not find any special significance of the volume
of online ratings beyond that.
We conclude by pointing out a number of limitations of the current study and associated op-
portunities for future research. First, in common with the majority of past work in this area, our
models do not incorporate the impact of competition from other movies. Such an enhancement
is not possible with our current data set, since we don’t have complete box office and production
data for all movies playing on all weeks. Second, our objective in this paper was to generate future
revenue forecasts from a single, early measurement of box office revenues and online ratings. We,
thus, do not have to worry about potential endogeneity issues associated with the interplay between
word-of-mouth and revenues. In future work, we plan to examine a model that uses measurements
of revenues and ratings at multiple points in time to obtain more accurate forecasts; in such a model,
endogeneity will be a more important factor, and will be dealt with accordingly. Third, given its
forecasting focus, our study did not attempt to consider the important question of whether online
ratings influence (as opposed to predict) future revenues. The perspective of the paper has been
that online ratings offer firms a valuable, real-time “window”, that allows very fast measurement of
what consumers think about a new product, as opposed to a force that, in itself, influences con-
sumer behavior. Throughout the paper we have, thus, been very careful not to make any statements
about causality. Given the increasing popularity of online product review sites, an investigation of
causality would be an exciting next step of this line of research.
References
Admati, A., and P. Pfleiderer (2000) Noisytalk.com: Broadcasting Opinions in a Noisy Envi-
ronment, Working Paper 1670R, Stanford University.
25
Ainslie, A., Dreze, X. and Zufryden, F. (2003) Modeling Movie Lifecycles and Market Share.
Working Paper.
Anderson, E.W. (1998) Customer satisfaction and word of mouth. Journal of Service 1 (1), 5-17.
Austin, B. and Gordon, T. (1987) Movie Genres: Toward a Conceptualized Model and Stan-
dardized Definition. In B. Austin (ed.) Current Research in Film: Audience, Economics, and
Law, Vol. 3. Ablex Publishing Co., Norwood, NJ.
Banerjee, A. and Fudenberg, D. (2004) Word-of-mouth learning. Games and Economic Be-
havior 46 (1) 1-22.
Bass, F. (1969) A new product growth model for consumer durables. Management Science 15
(January): 215-227.
Basuroy, S., Chatterjee, S., and Ravid, S.A. (2003) How Critical are Critical Reviews? The
Box Office Effects of Film Critics, Star Power and Budgets. Journal of Marketing 67 (October)
103-117.
Bowman, D., and Narayandas, D. (2001) Managing customer-initiated contacts with manu-
facturers: The impact on share of category requirements and word-of-mouth behavior. J.
Marketing Res. 38, 291-297.
Brown, J.J.,and Reingen, P. (1987) Social ties and word-of-mouth referral behavior. J. Con-
sumer Res. 14 350-362.
Chatterjee, R. and Eliashberg, J. (1990) The Innovation Diffusion Process in a Heterogeneous
Population: A Micromodeling Approach. Management Science 36 (9), 1057-1079.
Chevalier, J.A., and Mayzlin, D. (2003) The Effect of Word of Mouth on Sales: Online Book
Reviews. Yale SOM Working Paper No’s. ES-28 & MK-15.
De Silva, I. (1998) Consumer Selection of Motion Pictures. The Motion Picture Mega-Industry.
B. Litman. Boston, MA, Allyn & Bacon Publishing, Inc.
De Vany, A. and Walls, W.D. (1999) Uncertainty in the movie industry: Does star power re-
duce the terror of the box office? J. Cultural Econom. 23 (4): 285-318.
26
Dodds, J. and Holbrook, M. (1988) What’s an Oscar Worth? An Empirical Estimation of the
Effect of Nominations and Awards on Movie Distribution and Revenues. In B. Austin (ed.)
Current Research in Film: Audience, Economics, and Law, Vol. 4. Ablex Publishing Co.,
Norwood, NJ.
Duan, W., Gu, B., and Whinston, A.B. (2005) Do Online Reviews Matter? - An Empirical
Investigation of Panel Data. Working Paper, University of Texas at Austin.
Elberse, A., and Anand, B.N. (2005) The Effectiveness of Pre-Release Advertising for Motion
Pictures. Working Paper, Harvard Business School.
Elberse, A. and Eliashberg, J. (2003) Demand and Supply Dynamics for Sequentually Released
Products in International Markets: The Case of Motion Pictures. Marketing Science 22 (3)
329-354.
Eliashberg, J. and Sawhney, M.S. (1994) Modeling Goes to Hollywood: Predicting Individual
Differences in Movie Enjoyment. Management Science 40(9): 1151-1173.
Eliashberg, J., and Shugan, S.M. (1997) Film critics: Influencers or predictors? Journal of
Marketing 61(2): 68-78.
Eliashberg, J., Jonker, J., Sawhney, M.S. and Wierenga, B. (2000) MOVIEMOD: An Im-
plementable Decision Support System for Pre-Release Market Evaluation of Motion Pictures.
Marketing Science 19 (3) 226-243.
Faber, R. and O’Guinn, T. (1984) Effect of Media Advertising and Other Sources on Movie
Selection. Journalism Quarterly 61: 371-377.
Godes, D., and, Mayzlin D. (2004) Using Online Conversations to Study Word of Mouth Com-
munication. Marketing Science 23 (4): 545-560.
Granovetter, M. (1973) The strength of weak ties. American Journal of Sociology 78(6): 1360-
1380.
Jones, J.M. and Mason, C.H. (1990) The role of distribution in the diffusion of new durable
consumer products. Technical working paper, Marketing Science Institute, Cambridge, MA,
27
90-110.
Jones, J.M. and Ritz, C.J. (1991) Incorporating distribution into new product diffusion models.
Internat. J. Res. Marketing 8 (June): 91-112.
Krider, R. and Weinberg, C. (1998) Competitive Dynamics and the Introduction of New Prod-
ucts: The Motion Picture Timing Game. Journal of Marketing Research 35 (February): 1-15.
Lippman, J. (2003) Box-Office Records Mask Second-Weekend Drops. The Wall Street Journal,
June 6, 2003.
Litman, B.R. and Ahn, H. (1998) Predicting Financial Success of Motion Pictures. In B.R.
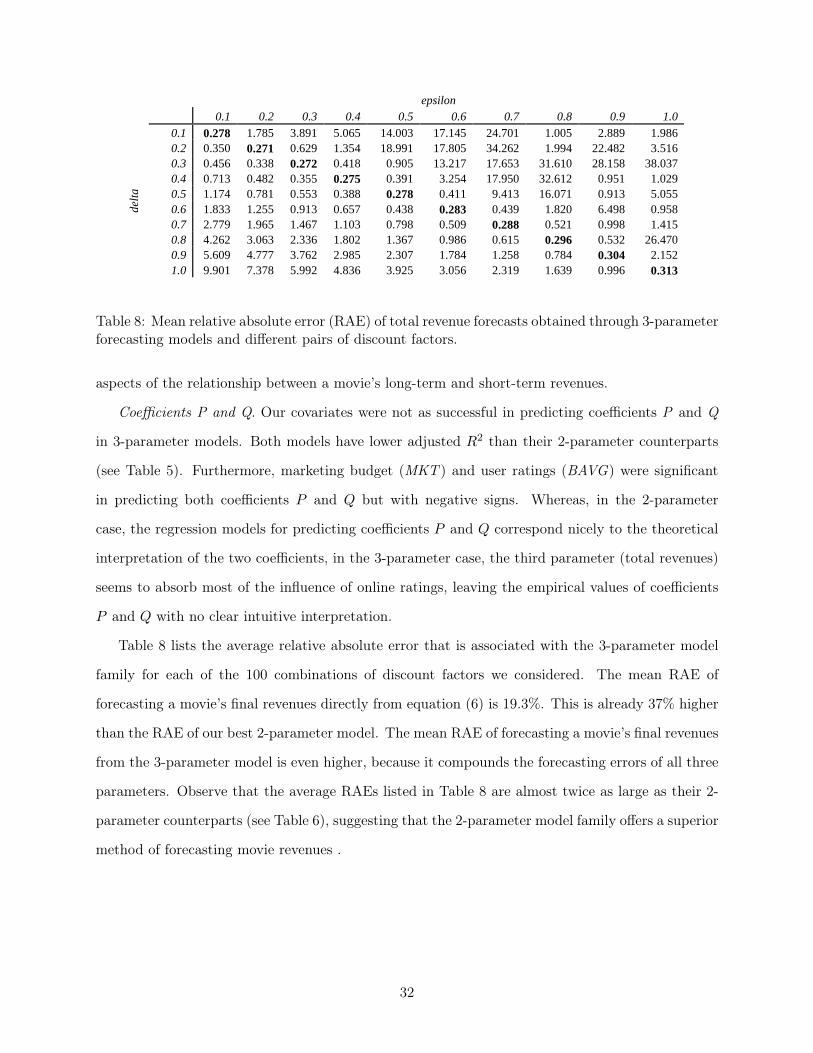
Table 8: Mean relative absolute error (RAE) of total revenue forecasts obtained through 3-parameterforecasting models and different pairs of discount factors.
aspects of the relationship between a movie’s long-term and short-term revenues.
Coefficients P and Q. Our covariates were not as successful in predicting coefficients P and Q
in 3-parameter models. Both models have lower adjusted R2 than their 2-parameter counterparts
(see Table 5). Furthermore, marketing budget (MKT ) and user ratings (BAVG) were significant
in predicting both coefficients P and Q but with negative signs. Whereas, in the 2-parameter
case, the regression models for predicting coefficients P and Q correspond nicely to the theoretical
interpretation of the two coefficients, in the 3-parameter case, the third parameter (total revenues)
seems to absorb most of the influence of online ratings, leaving the empirical values of coefficients
P and Q with no clear intuitive interpretation.
Table 8 lists the average relative absolute error that is associated with the 3-parameter model
family for each of the 100 combinations of discount factors we considered. The mean RAE of
forecasting a movie’s final revenues directly from equation (6) is 19.3%. This is already 37% higher
than the RAE of our best 2-parameter model. The mean RAE of forecasting a movie’s final revenues
from the 3-parameter model is even higher, because it compounds the forecasting errors of all three
parameters. Observe that the average RAEs listed in Table 8 are almost twice as large as their 2-
parameter counterparts (see Table 6), suggesting that the 2-parameter model family offers a superior