USING RESULTS FROM COVERAGE ASSESSMENT SURVEYS TO IMPROVE PROGRAM OPERATION Jessica Blankenship PhD Helen Keller International
Transcript
USING RESULTS FROM COVERAGE ASSESSMENT SURVEYS TO IMPROVE PROGRAM OPERATION
Jessica Blankenship PhD Helen Keller International
POST EVENT COVERAGE SURVEYS
• A post-event coverage survey (PECS) is a household survey conducted to validate coverage for a region of interest and evaluate effectiveness of programme activities
• Standard 30x30 cluster sampling
methodology from the WHO Immunization Coverage cluster survey reference manual.
• 4 components:
– Household – Health Workers – Community Health Workers – Community Leaders 2
Presenter
Presentation Notes
HKI routinely implements post-event coverage surveys (PECS) in 13 countries in sub-Saharan Africa to measure the coverage and quality of essential child survival services through Child Health Days (CHDs). PECS are used to validate administrative data, evaluate the quality of distribution/knowledge of service and to determine barriers to high coverage and good programme implementation
PECS AS A COMPONENT OF SYSTEMATIC MONITORING OF CHILD HEALTH DAYS
3
Standardized survey modified in country to address specific barriers to high and equitable coverage of Child Heath Day (CHD) services Key components of an HKI PECS:
• Streamlined: <25 questions with 30 clusters collected in under 2 weeks
• High level of internal training and oversight to ensure data quality
• Relatively inexpensive: < $30,000 for a 30x30 sample
Presenter
Presentation Notes
44 surveys since 2010 13 countries PECS results provide data to make evidence-based decisions on how to improve programs For example: Communications Strategy: Which messages were heard? Which messages were remembered? Which channel was most/least effective at reaching targeted caregivers? For example: Outreach Strategy: Which activities had the biggest impact on coverage? Which activities were not effective? Why?
4
Child Health Days Child Health Days
PECS PECS
6 Months
4-6 Weeks
PECS TIMELINE ILLUSTRATED
June CHDs
July PECS
Interpret Results & Adapt Program
October CHDs
November PECS
Interpret Results & Adapt Program
PECS ARE A KEY COMPONENT OF THE PROGRAMME COURSE CORRECTION CYCLE
Presenter
Presentation Notes
44 surveys since 2010 13 countries PECS results provide data to make evidence-based decisions on how to improve programs For example: Communications Strategy: Which messages were heard? Which messages were remembered? Which channel was most/least effective at reaching targeted caregivers? For example: Outreach Strategy: Which activities had the biggest impact on coverage? Which activities were not effective? Why?
61.3
46.9 52.9
0102030405060708090
100
Round 1 2009 Round 1 2011 Round 2 2011
Coverage of VAS for children 6-59 months in Littoral Region (%)
USING PECS DATA TO INFORM PROGRAMME STRATEGY: CAMEROON
6
Presenter
Presentation Notes
Historically low coverage higher when combined with measles campaign in 2009 but consistently around 50% Since 2011: PECs have been implemented after each round of CHD to inform strategy. Has been streamlined to keep costs down, is implemented internally after each round. Average cost is 18,000 per 30x30 Urban area
USING PECS DATA TO INFORM PROGRAMME STRATEGY: CAMEROON
7
Identified Major Barriers to High and Equitable Coverage • Awareness:
– Unaware of the CHD’s being held – No exposure to communication and social
mobilization materials
• Distribution areas were too large for health workers to reach all houses during the CHDs
– Caregivers stated that the distribution teams did not pass their house
– Health workers and community health workers stated that they were unable to reach all households within the allotted CHD time.
Presenter
Presentation Notes
Historically low coverage higher when combined with measles campaign in 2009 but consistently around 50% Since 2011: PECs have been implemnted after each round of CHD to inform strategy. Has been streamlined to keep costs down, is implemented internally after each round. Average cost is 18,000 per 30x30 Urban area
USING PECS DATA TO INFORM PROGRAMME STRATEGY: CAMEROON
8
Implemented Actions: • Awareness:
– Mass Communication Strategy with inexpensive blanketed messaging to increase awareness of key information on CHD’s
– Disseminated through markets, religious houses, schools, health centers and through community health workers.
• Large distribution areas: • Increased number of teams to
reduce total number of households to cover
Presenter
Presentation Notes
Historically low coverage higher when combined with measles campaign in 2009 but consistently around 50% Since 2011: PECs have been implemented after each round of CHD to inform strategy. Has been streamlined to keep costs down, is implemented internally after each round. Average cost is 18,000 per 30x30 Urban area
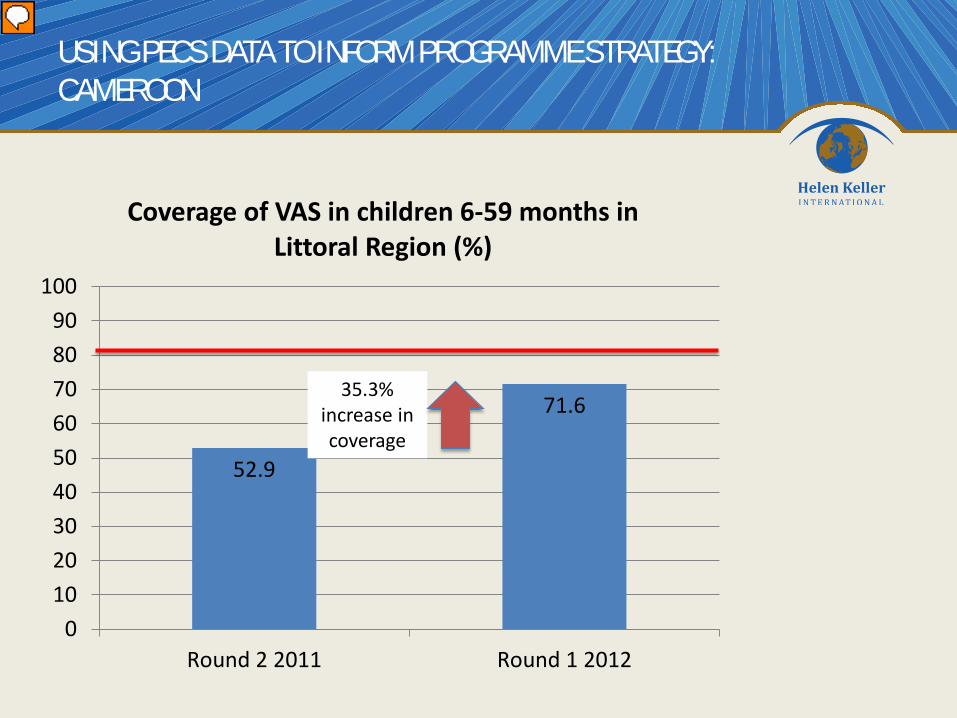
52.9
71.6
0102030405060708090
100
Round 2 2011 Round 1 2012
Coverage of VAS in children 6-59 months in Littoral Region (%)
USING PECS DATA TO INFORM PROGRAMME STRATEGY: CAMEROON
35.3% increase in coverage
Presenter
Presentation Notes
Historically low coverage higher when combined with measles campaign in 2009 but consistently around 50% Since 2011: PECs have been implemented after each round of CHD to inform strategy. Has been streamlined to keep costs down, is implemented internally after each round. Average cost is 18,000 per 30x30 Urban area
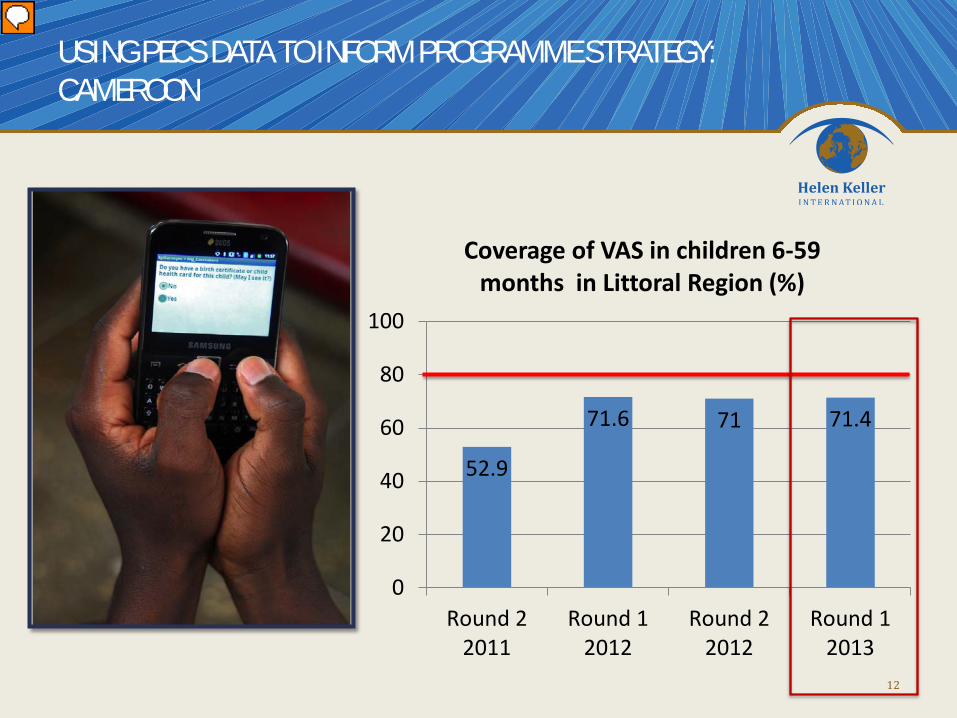
52.9
71.6 71 71.4
0
20
40
60
80
100
Round 22011
Round 12012
Round 22012
Round 12013
Coverage of VAS in children 6-59 months in Littoral Region (%)
USING PECS DATA TO INFORM PROGRAMME STRATEGY: CAMEROON
10
Stagnation in coverage with no change in identified barriers: • Awareness • Distribution team did
not pass • Health workers state
distribution areas too large
Presenter
Presentation Notes
Historically low coverage higher when combined with measles campaign in 2009 but consistently around 50% Since 2011: PECs have been implemented after each round of CHD to inform strategy. Has been streamlined to keep costs down, is implemented internally after each round. Average cost is 18,000 per 30x30 Urban area
52.9
71.6 71 71.4
0
20
40
60
80
100
Round 22011
Round 12012
Round 22012
Round 12013
Coverage of VAS in children 6-59 months in Littoral Region (%)
USING PECS DATA TO INFORM PROGRAMME STRATEGY: CAMEROON
11
Stagnation in coverage with no change in identified barriers: • Awareness • Distribution team did
not pass • Health workers state
distribution areas too large
Presenter
Presentation Notes
Historically low coverage higher when combined with measles campaign in 2009 but consistently around 50% Since 2011: PECs have been implemented after each round of CHD to inform strategy. Has been streamlined to keep costs down, is implemented internally after each round. Average cost is 18,000 per 30x30 Urban area
52.9
71.6 71 71.4
0
20
40
60
80
100
Round 22011
Round 12012
Round 22012
Round 12013
Coverage of VAS in children 6-59 months in Littoral Region (%)
USING PECS DATA TO INFORM PROGRAMME STRATEGY: CAMEROON
12
Presenter
Presentation Notes
Historically low coverage higher when combined with measles campaign in 2009 but consistently around 50% Since 2011: PECs have been implemented after each round of CHD to inform strategy. Has been streamlined to keep costs down, is implemented internally after each round. Average cost is 18,000 per 30x30 Urban area
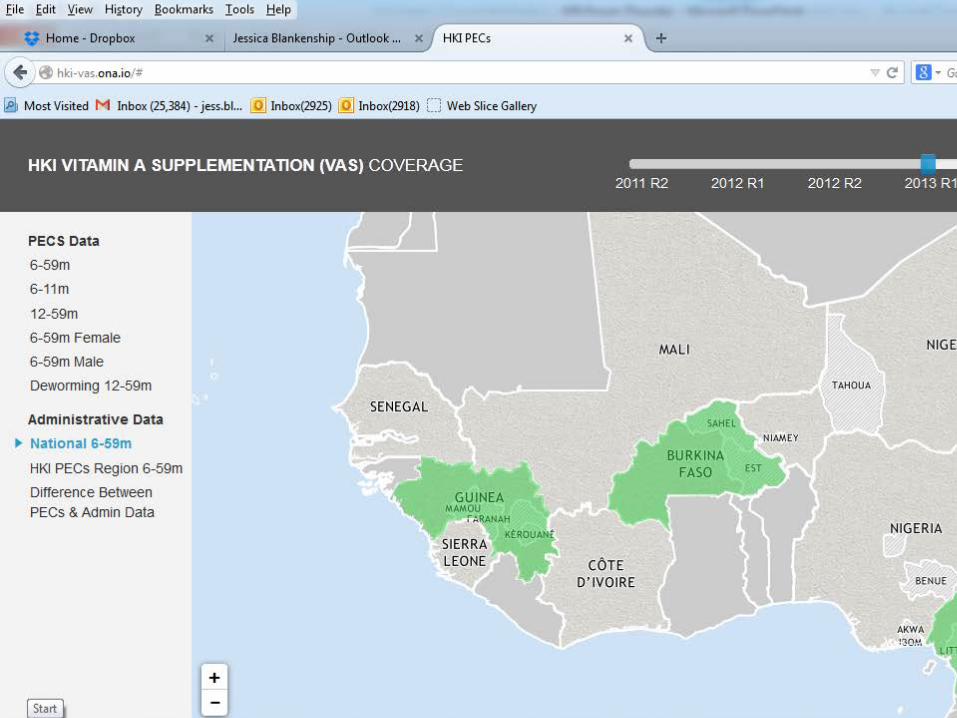
Children missed are in green
GEO-SPATIAL VISUALIZATION OF VITAMIN A COVERAGE
IDENTIFICATION OF A NEW BARRIER TO HIGH AND EQUITABLE COVERAGE
14
Barrier: Areas which were difficult to access where skipped by distribution teams
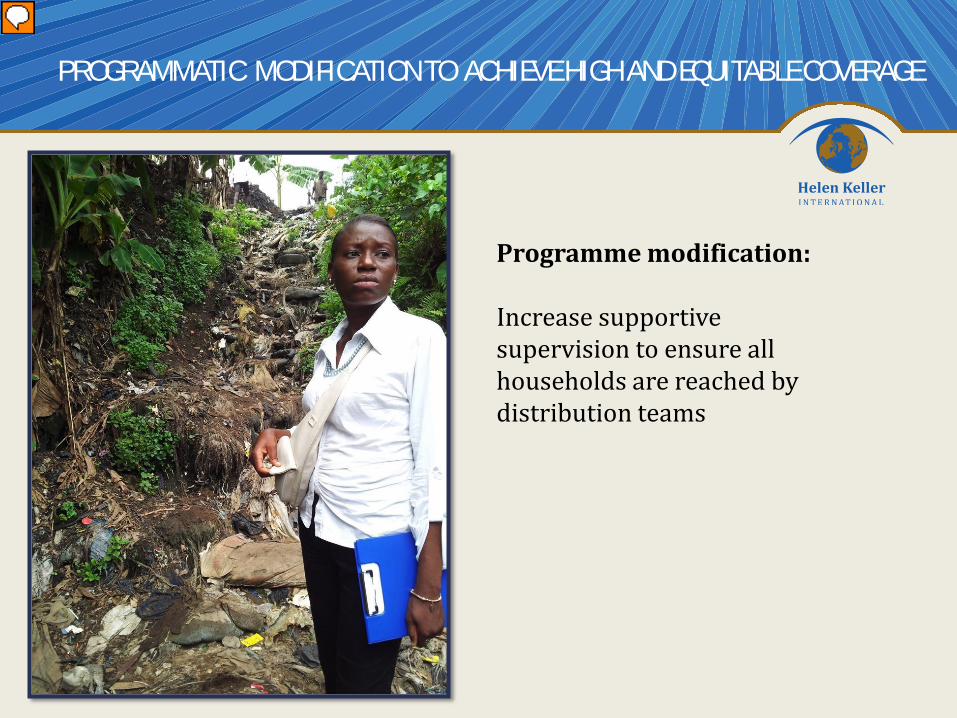
PROGRAMMATIC MODIFICATION TO ACHIEVE HIGH AND EQUITABLE COVERAGE
Programme modification: Increase supportive supervision to ensure all households are reached by distribution teams
Presenter
Presentation Notes
The geo-spatial visualization of any coverage data allows field teams to quickly identify areas that have been overlooked and recognize potential obstacles to service delivery Example: From the Cameroon data, houses that were past the garbage dump area and in some cases built on top of the garbage dumping grounds had coverage of 25%. The field team could use the map of this area and the data showing coverage to adjust their strategy and show community mobilizers and healthcare workers what was going wrong
52.9 71.6 71.0 71.4
79.8
020406080
100
Round 22011
Round 12012
Round 22012
Round 12013
Round 22013
Coverage of VAS for children 6-59 months in Littoral Region (%)
USING PECS DATA TO INFORM PROGRAMME STRATEGY: CAMEROON
16
Presenter
Presentation Notes
Historically low coverage higher when combined with measles campaign in 2009 but consistently around 50% Close the gap Since 2011: PECs have been implemented after each round of CHD to inform strategy. Has been streamlined to keep costs down, is implemented internally after each round. Average cost is 18,000 per 30x30 Urban area
Key components to using PECS • Streamlined • Systematic
PECS PROVIDES HIGH QUALITY, TIMELY DATA TO INFORM PROGRAMME COURSE CORRECTION
17
• Affordable • Provide timely feedback
Presenter
Presentation Notes
Use of PECs within HKI We are endeavoring to make our data high quality and dynamic so that our programmes can be dynamic and address barriers as they occur.
18
19
20
Presenter
Presentation Notes
HKI has integrated PECs as a component of our monitoring system along with supportive supervision and routine process monitoring. By streamlining the questionnaires, we can standardize the implementation of the PECs to ensure high quality of survey implementation and high data quality while internally implementing and keeping the cost of the surveys minimum. High quality of implementation internally and low survey costs allows HKI to implement PECs routinely as required to inform programme strategy to identify barriers to high and equitable coverage and determine which activities are most effective.
DYNAMIC DATA ENABLES RESPONSIVE PROGRAMMING TO ACHIEVE HIGH AND EQUITABLE COVERAGE
21
Presenter
Presentation Notes
Goal of PECs in HKI—streamlining the PEC survey to make it relatively quick, straightforward and inexpensive to implement and the incorporation of mobile data collection enables HKI with partners to collect data analysis and use the results and interpretation of barriers to inform programme strategy month prior to the next CHD round. Dynamic data for responsive programming to achieve high and equitable coverage
ACKNOWLEDGEMENTS
22
This work was made possible through the generosity of the Canadian Government through the Department of Foreign Affairs, Trade and Development