27
e Using SAP Root Cause Analysis & System Monitoring for SAP Mobile Platform Document Version: 4 SAP AGS Customer Use

e
Using SAP Root Cause Analysis & System
Monitoring for SAP Mobile Platform
Document Version: 4 SAP AGS
Customer Use

USING SAP ROOT CAUSE ANALYSIS & SYSTEM MONITORING FOR SYBASE UNWIRED PLATFORM
2
© Copyright 2012 SAP AG. All rights reserved. No part of this publication may be reproduced or transmitted in any form or for any purpose without the express permission of SAP AG. The information contained herein may be changed without prior notice. Some software products marketed by SAP AG and its distributors contain proprietary software components of other software vendors. No part of this publication may be reproduced or transmitted in any form or for any purpose without the express permission of SAP AG. The information contained herein may be changed without prior notice. Some software products marketed by SAP AG and its distributors contain proprietary software components of other software vendors. Microsoft, Windows, Excel, Outlook, and PowerPoint are registered trademarks of Microsoft Corporation. IBM, DB2, DB2 Universal Database, System i, System i5, System p, System p5, System x, System z, System z10, System z9, z10, z9, iSeries, pSeries, xSeries, zSeries, eServer, z/VM, z/OS, i5/OS, S/390, OS/390, OS/400, AS/400, S/390 Parallel Enterprise Server, PowerVM, Power Architecture, POWER6+, POWER6, POWER5+, POWER5, POWER, OpenPower, PowerPC, BatchPipes, BladeCenter, System Storage, GPFS, HACMP, RETAIN, DB2 Connect, RACF, Redbooks, OS/2, Parallel Sysplex, MVS/ESA, AIX, Intelligent Miner, WebSphere, Netfinity, Tivoli and Informix are trademarks or registered trademarks of IBM Corporation. Linux is the registered trademark of Linus Torvalds in the U.S. and other countries. Adobe, the Adobe logo, Acrobat, PostScript, and Reader are either trademarks or registered trademarks of Adobe Systems Incorporated in the United States and/or other countries. Oracle is a registered trademark of Oracle Corporation. UNIX, X/Open, OSF/1, and Motif are registered trademarks of the Open Group. Citrix, ICA, Program Neighborhood, MetaFrame, WinFrame, VideoFrame, and MultiWin are trademarks or registered trademarks of Citrix Systems, Inc. HTML, XML, XHTML and W3C are trademarks or registered trademarks of W3C®, World Wide Web Consortium, Massachusetts Institute of Technology. Java is a registered trademark of Sun Microsystems, Inc. JavaScript is a registered trademark of Sun Microsystems, Inc., used under license for technology invented and implemented by Netscape. SAP, R/3, xApps, xApp, SAP NetWeaver, Duet, PartnerEdge, ByDesign, SAP Business ByDesign, and other SAP products and services mentioned herein as well as their respective logos are trademarks or registered trademarks of SAP AG in Germany and in several other countries all over the world. All other product and service names mentioned are the trademarks of their respective companies. Data contained in this document serves informational purposes only. National product specifications may vary. These materials are subject to change without notice. These materials are provided by SAP AG and its affiliated companies (“SAP Group”) for informational purposes only, without representation or warranty of any kind, and SAP Group shall not be liable for errors or omissions with respect to the materials. The only warranties for SAP Group products and services are those that are set forth in the express warranty statements accompanying such products and services, if any. Nothing herein should be construed as constituting an additional warranty. Disclaimer
Some components of this product are based on Java™. Any code change in these components may cause unpredictable and severe malfunctions and is therefore expressly prohibited, as is any decompilation of these components. Any Java™ Source Code delivered with this product is only to be used by SAP’s Support Services and may not be modified or altered in any way.

USING SAP ROOT CAUSE ANALYSIS & SYSTEM MONITORING FOR SYBASE UNWIRED PLATFORM
3
Typographic Conventions
Type Style Description
Example Text Words or characters quoted from the screen. These include field names, screen titles, pushbuttons labels, menu names, menu paths, and menu options. Cross-references to other documentation
Example text Emphasized words or phrases in body text, graphic titles, and table titles
Example text File and directory names and their paths, messages, names of variables and parameters, source text, and names of installation, upgrade and database tools.
Example text User entry texts. These are words or characters that you enter in the system exactly as they appear in the documentation.
<Example text> Variable user entry. Angle brackets indicate that you replace these words and characters with appropriate entries to make entries in the system.
EXAMPLE TEXT Keys on the keyboard, for example, F2 or ENTER

USING SAP ROOT CUASE ANALYSIS & SYSTEM MONITORING FOR SYBASE UNWIRED PLATFORM
4
TABLE OF CONTENT
1. INTRODUCTION ........................................................................................................................... 5 1.1 Summary ......................................................................................................................................... 5 1.2 How to use this guideline ............................................................................................................. 5 1.3 Supported Version for this guide ................................................................................................ 5 1.4 SAP Notes for the Managed System Setup for SUP ................................................................. 5
2. ROOT CAUSE ANALYSIS FOR SUP IN SOLUTION MANAGER ................................................... 6 2.1 Root Cause Analysis Work Center ............................................................................................... 6 2.1.2 Work Center Overview .................................................................................................................. 6 2.2 File System Browser ..................................................................................................................... 7 2.3 OS Command Console .................................................................................................................... 8 2.4 Change Reporting & Change Analysis ........................................................................................ 9 2.4.2 E2E Change Analysis.................................................................................................................... 10 2.5 Log Viewer ..................................................................................................................................... 11 2.6 E2E Workload Analysis ................................................................................................................ 12 2.7 E2E Exception Analysis ............................................................................................................... 15 2.8 E2E Trace Analysis ....................................................................................................................... 17
1. TECHNICAL MONITORING .........................................................................................................20 1.1 Concept and Goal ......................................................................................................................... 20 1.2 Activate and Apply the Monitoring Template ......................................................................... 20 1.3 Monitoring the System ............................................................................................................... 20 1.4 Maintain the Monitoring Template ........................................................................................... 21
2. CA WILY INTROSCOPE ..............................................................................................................24
USING SAP ROOT CAUSE ANALYSIS & SYSTEM MONITORING FOR SYBASE UNWIRED PLATFORM
5
1. INTRODUCTION
1.1 Summary
Sybase Unwired Platform (SUP) is integrated into SAP Root Cause Analysis application SAP Solution Manager Diagnostics (SMD). This document provides information of how to use SMD of an SAP Solution Manager managing system with and for SUP managed systems.
1.2 How to use this guideline
The document provides the following information about monitoring of SUP : Maintain the monitoring template Customizing the Sybase Unwired Platform Activating and applying the monitoring template Monitoring the Sybase Unwired Platform
1.3 Supported Version for this guide
Sybase Unwired Platform 2.1.0 Sybase Unwired Platform 2.1.1 Sybase Unwired Platform 2.1.2 Sybase Unwired Platform 2.1.3 Sybase Unwired Platform 2.2.0 Gateway 2.0
1.4 SAP Notes for the Managed System Setup for SUP
You need to request the note regarding the SUP and Solution Manager. Since these Notes are updated regularly, make sure that you always use the newest version
SAP Note Number Description
1634219 Managed System Setup for Sybase Unwired Platform 2.1
1762741 Setup for SUP 2.2 with Solution Manager 7.1 SP05
USING SAP ROOT CAUSE ANALYSIS & SYSTEM MONITORING FOR SYBASE UNWIRED PLATFORM
6
2. ROOT CAUSE ANALYSIS FOR SUP IN SOLUTION MANAGER After SMD Managed System Setup and Configuration, the Root Cause Analysis features of SAP Solution Manager Diagnostics are available in the Root Cause Analysis work center of SAP Solution Manager. Find further information about End-to-End Root Cause Analysis on SAP Service Marketplace: https://service.sap.com/diagnostics.
2.1 Root Cause Analysis Work Center
2.1.1 How to Enter
1. Log on as administrator user on the Solution Manager system
2. Choose the Root Cause Analysis work center
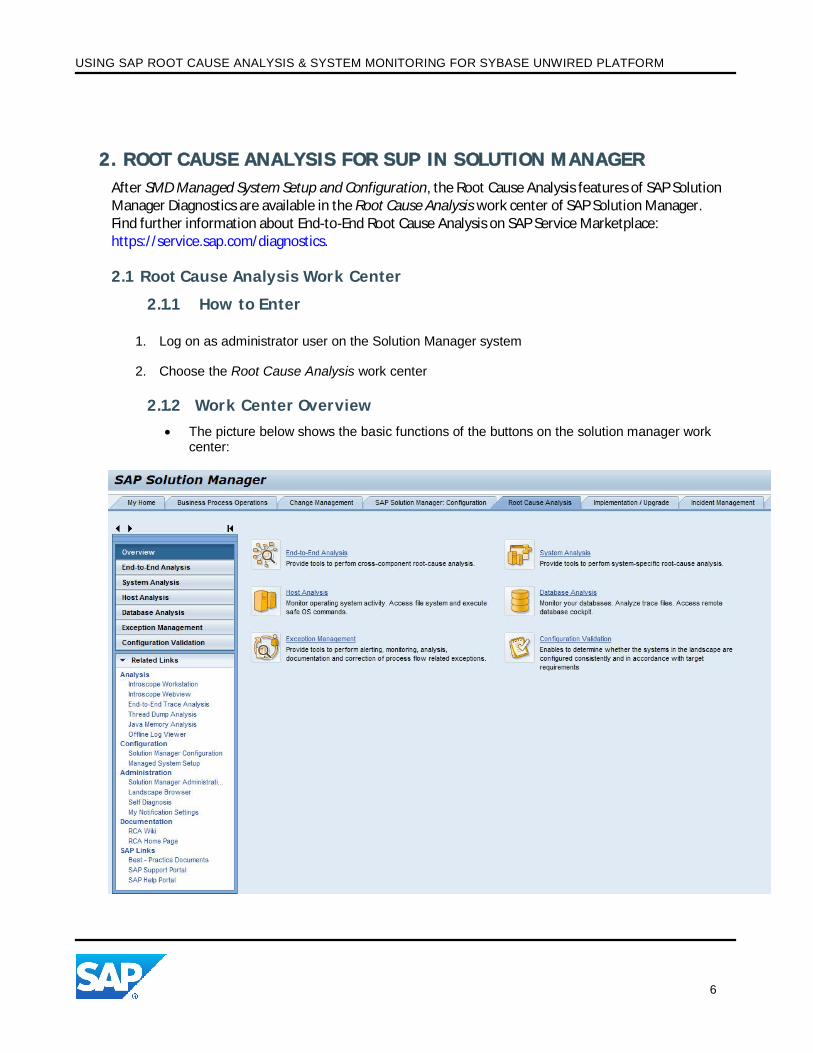
2.1.2 Work Center Overview
The picture below shows the basic functions of the buttons on the solution manager work center:

USING SAP ROOT CAUSE ANALYSIS & SYSTEM MONITORING FOR SYBASE UNWIRED PLATFORM
7
The picture below shows the basic functions of the buttons on the monitoring configuration work center:
2.2 File System Browser SAP Solution Manager’s File System Browser allows for (remote) BPC file access. Files can be collected into a basket for later analysis and can be downloaded to local drive. Enter File System Browser via Host Analysis. Select the server host. Select File System Browser. Microsoft Internet Explorer has to be the default browser in order to open File System Browser. The predefined folders are:
SUP folder, pointing to For SUP installation: UnwiredPlatform/Servers/UnwiredServer For SCC logs and others: SCC_3_2
SMDAgent related files: SMDAgent SAP folder is accessible by clicking sap.
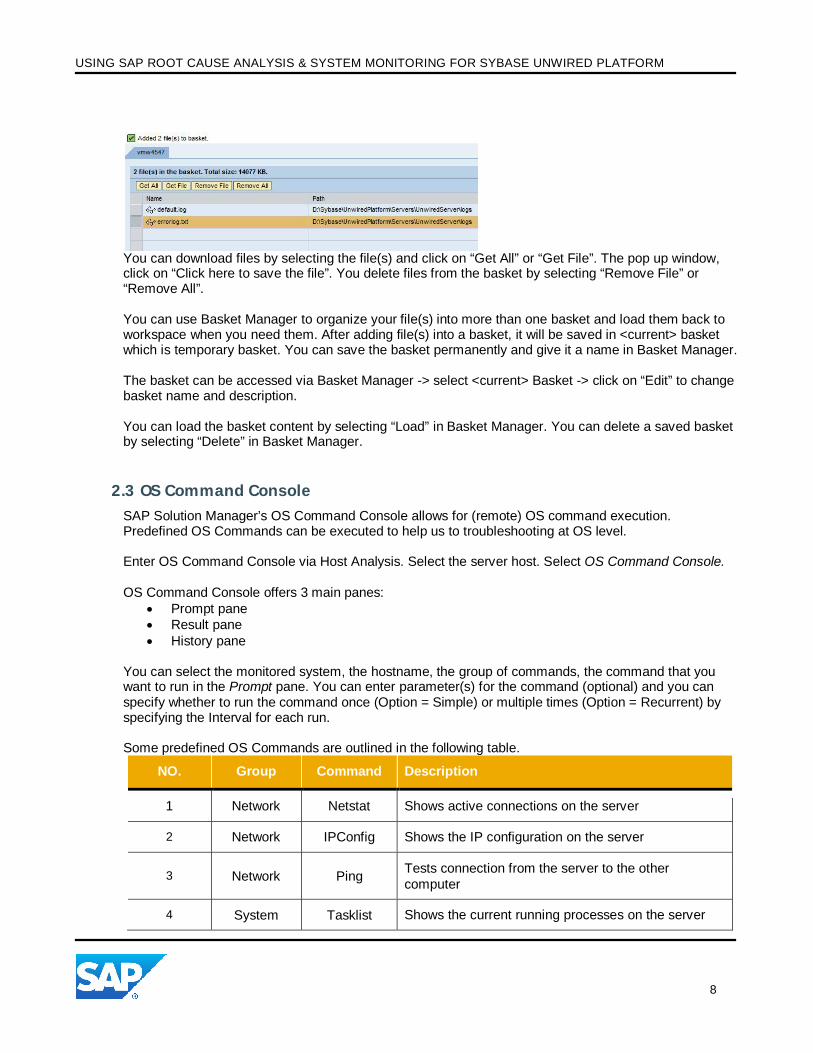
You can add file(s) into a basket by checking the file(s) and either clicks on “Add All to Basket” or “Add Selections to Basket”. You can display the content of the basket by selecting “Show Basket”.
USING SAP ROOT CAUSE ANALYSIS & SYSTEM MONITORING FOR SYBASE UNWIRED PLATFORM
8
You can download files by selecting the file(s) and click on “Get All” or “Get File”. The pop up window, click on “Click here to save the file”. You delete files from the basket by selecting “Remove File” or “Remove All”. You can use Basket Manager to organize your file(s) into more than one basket and load them back to workspace when you need them. After adding file(s) into a basket, it will be saved in <current> basket which is temporary basket. You can save the basket permanently and give it a name in Basket Manager. The basket can be accessed via Basket Manager -> select <current> Basket -> click on “Edit” to change basket name and description. You can load the basket content by selecting “Load” in Basket Manager. You can delete a saved basket by selecting “Delete” in Basket Manager.
2.3 OS Command Console SAP Solution Manager’s OS Command Console allows for (remote) OS command execution. Predefined OS Commands can be executed to help us to troubleshooting at OS level. Enter OS Command Console via Host Analysis. Select the server host. Select OS Command Console. OS Command Console offers 3 main panes:
Prompt pane Result pane History pane
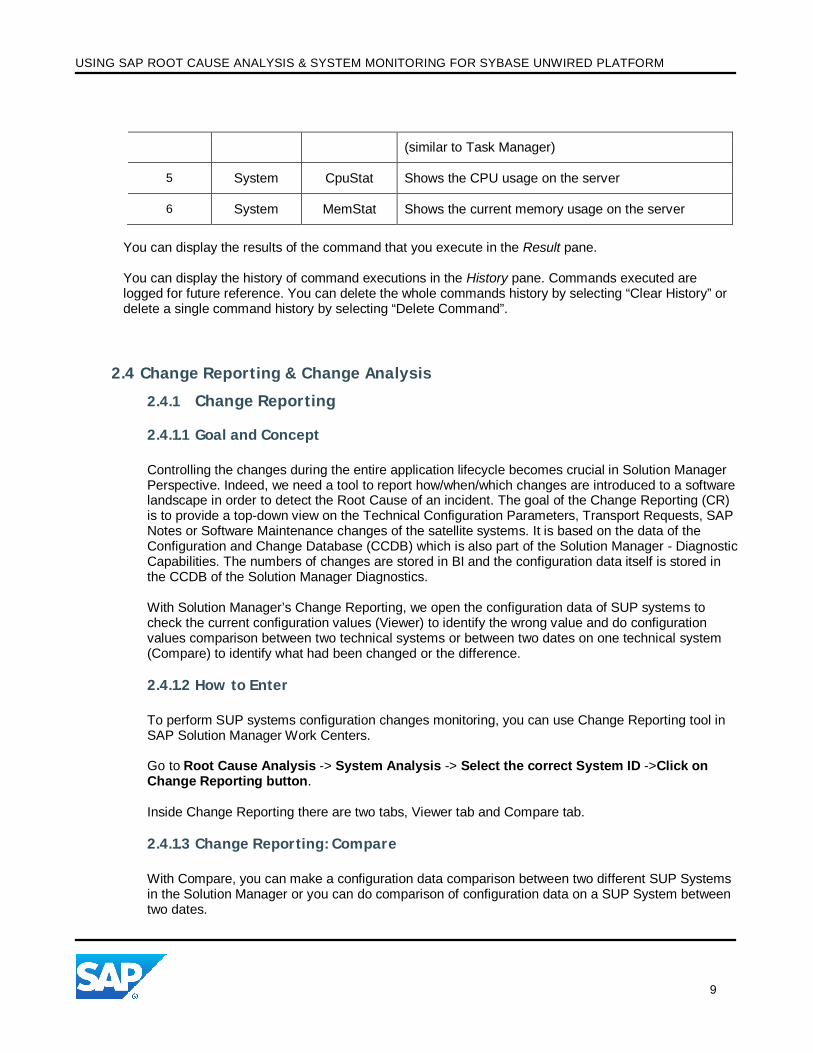
You can select the monitored system, the hostname, the group of commands, the command that you want to run in the Prompt pane. You can enter parameter(s) for the command (optional) and you can specify whether to run the command once (Option = Simple) or multiple times (Option = Recurrent) by specifying the Interval for each run. Some predefined OS Commands are outlined in the following table.
NO. Group Command Description
1 Network Netstat Shows active connections on the server
2 Network IPConfig Shows the IP configuration on the server
3 Network Ping Tests connection from the server to the other computer
4 System Tasklist Shows the current running processes on the server
USING SAP ROOT CAUSE ANALYSIS & SYSTEM MONITORING FOR SYBASE UNWIRED PLATFORM
9
(similar to Task Manager)
5 System CpuStat Shows the CPU usage on the server
6 System MemStat Shows the current memory usage on the server
You can display the results of the command that you execute in the Result pane. You can display the history of command executions in the History pane. Commands executed are logged for future reference. You can delete the whole commands history by selecting “Clear History” or delete a single command history by selecting “Delete Command”.
2.4 Change Reporting & Change Analysis
2.4.1 Change Reporting
2.4.1.1 Goal and Concept
Controlling the changes during the entire application lifecycle becomes crucial in Solution Manager Perspective. Indeed, we need a tool to report how/when/which changes are introduced to a software landscape in order to detect the Root Cause of an incident. The goal of the Change Reporting (CR) is to provide a top-down view on the Technical Configuration Parameters, Transport Requests, SAP Notes or Software Maintenance changes of the satellite systems. It is based on the data of the Configuration and Change Database (CCDB) which is also part of the Solution Manager - Diagnostic Capabilities. The numbers of changes are stored in BI and the configuration data itself is stored in the CCDB of the Solution Manager Diagnostics. With Solution Manager’s Change Reporting, we open the configuration data of SUP systems to check the current configuration values (Viewer) to identify the wrong value and do configuration values comparison between two technical systems or between two dates on one technical system (Compare) to identify what had been changed or the difference. 2.4.1.2 How to Enter
To perform SUP systems configuration changes monitoring, you can use Change Reporting tool in SAP Solution Manager Work Centers. Go to Root Cause Analysis -> System Analysis -> Select the correct System ID ->Click on Change Reporting button. Inside Change Reporting there are two tabs, Viewer tab and Compare tab. 2.4.1.3 Change Reporting: Compare
With Compare, you can make a configuration data comparison between two different SUP Systems in the Solution Manager or you can do comparison of configuration data on a SUP System between two dates.

USING SAP ROOT CAUSE ANALYSIS & SYSTEM MONITORING FOR SYBASE UNWIRED PLATFORM
10
The Compare screen contains 3 areas: Reference System/date Custom System/date Result Summary
Select the date in the Reference area; select a Technical system and a date in the Custom area, Select the configuration node for both of them, Choose comparison type, fast or deep and click on Compare button. The result of the comparison will be shown in the Result Summary area.
2.4.2 E2E Change Analysis
2.4.2.1 Goal and Concept
The goal of the E2E Change Analysis (E2E CA) is to provide a top-down view on the configuration parameter and software (configuration items) changes of the managed systems. It is based on the data of the Configuration and Change Database (CCDB) which is also part of the Solution Manager – Diagnostic Capabilities. The numbers of changes are stored in BI and the configuration data itself is stored in the CCDB of the Solution Manager Diagnostics.
2.4.2.2 E2E Change Analysis Overview Tab
The central entry point for the Change analysis is the Overview Tab of the E2E CA application. The “Overview - Summary” allows identifying in a chart or table view the Product Instance which had the most and/or the most recent changes and should be analyzed.
The time frame can be selected using the “Custom Selection”.
The button “History of Changes for the last 2 years” reads the data of the current quarter and the 7 quarters before.
The “Last Change Date” table lists the data of the most recent change per change group and type. Expanding the hierarchy node will display the change type.
USING SAP ROOT CAUSE ANALYSIS & SYSTEM MONITORING FOR SYBASE UNWIRED PLATFORM
11
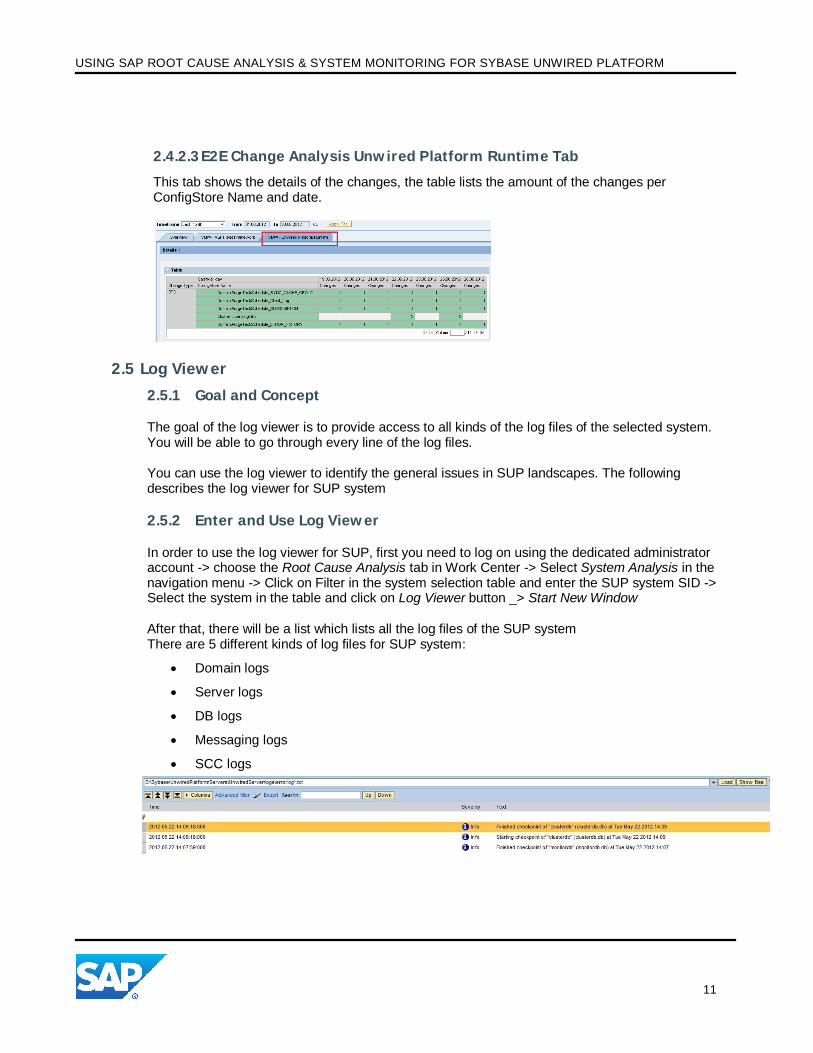
2.4.2.3 E2E Change Analysis Unwired Platform Runtime Tab
This tab shows the details of the changes, the table lists the amount of the changes per ConfigStore Name and date.
2.5 Log Viewer
2.5.1 Goal and Concept The goal of the log viewer is to provide access to all kinds of the log files of the selected system. You will be able to go through every line of the log files. You can use the log viewer to identify the general issues in SUP landscapes. The following describes the log viewer for SUP system 2.5.2 Enter and Use Log Viewer In order to use the log viewer for SUP, first you need to log on using the dedicated administrator account -> choose the Root Cause Analysis tab in Work Center -> Select System Analysis in the navigation menu -> Click on Filter in the system selection table and enter the SUP system SID -> Select the system in the table and click on Log Viewer button _> Start New Window After that, there will be a list which lists all the log files of the SUP system There are 5 different kinds of log files for SUP system:
Domain logs
Server logs
DB logs
Messaging logs
SCC logs

USING SAP ROOT CAUSE ANALYSIS & SYSTEM MONITORING FOR SYBASE UNWIRED PLATFORM
12
2.6 E2E Workload Analysis
2.6.1 Goal and Concept The goal of the E2E Workload Analysis is to provide access to statistical performance data of different systems. You will be able to perform a cross-system correlation analysis based on the temporal behavior of the performance metrics. Dedicated Key Performance Indicators (KPI) are calculated and displayed, allowing you to quickly gauge which system of software component is the root cause of a potential performance problem. You can use E2E Workload analysis to identify the general performance bottlenecks in SUP landscapes. The following describes the SUP specific E2E Workload Analysis data. Additional information about the architecture and features of the E2E Workload Analysis can be found in the E2E Workload Analysis –User guide available in the SAP Support Portal (www.service.sap.com/diagnostics) 2.6.2 How to Enter E2E Workload Analysis for Sybase Unwired Platform The E2E Workload Analysis application can be started from the Solution Manager Work Center. 1. Select one or several SUP technical systems
2. Click Workload Analysis button
For instance, here is a screenshot in Solution Manager 7.1
2.6.3 E2E Workload Analysis Overview Tab The central entry point for the workload analysis is the Overview Tab of the E2E WA application. This section of the application has two parts: the left-hand side contains the graphical display of the time-dependent parameters. On the right-hand side, selected KPI values for the chosen SUP systems are displayed. Please note that these values are calculated for the timeframe chosen in the application. When you start the workload analysis the overview tab is displayed. In order to display the data, click on the “Click here to load data from Business Warehouse” link.

USING SAP ROOT CAUSE ANALYSIS & SYSTEM MONITORING FOR SYBASE UNWIRED PLATFORM
13
2.6.4 Key Performance Indicators
The KPI area on the right-hand side allows the comparison of different parameters specific to the analyzed system. For SUP Server, the average response time of the incoming and out-coming requests are displayed. The following SUP specific KPIs are displayed for the SUP Server:
These values are recorded by Wily Introscope Interprise manager and transferred once per hour to Solution Manager BI. 2.6.5 Time Profile
For the Graphical Display, the standard Display Type is the "Time Profile". Here, regardless of the timeframe chosen for display, the aggregated Day Profile is always displayed. For example: If last week has been chosen, the graph - which always ranges from 0:00 to 23:00 on the x-axis - displays the average hourly values for the last week.
USING SAP ROOT CAUSE ANALYSIS & SYSTEM MONITORING FOR SYBASE UNWIRED PLATFORM
14
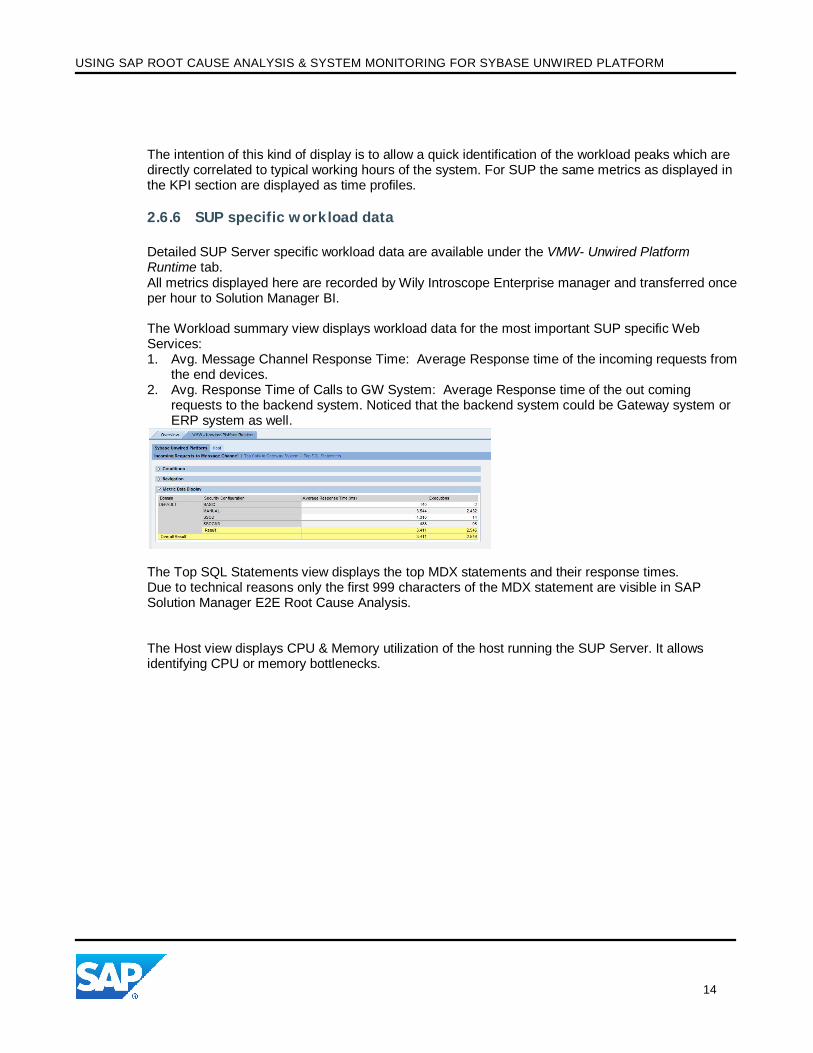
The intention of this kind of display is to allow a quick identification of the workload peaks which are directly correlated to typical working hours of the system. For SUP the same metrics as displayed in the KPI section are displayed as time profiles. 2.6.6 SUP specific workload data
Detailed SUP Server specific workload data are available under the VMW- Unwired Platform Runtime tab. All metrics displayed here are recorded by Wily Introscope Enterprise manager and transferred once per hour to Solution Manager BI. The Workload summary view displays workload data for the most important SUP specific Web Services: 1. Avg. Message Channel Response Time: Average Response time of the incoming requests from
the end devices. 2. Avg. Response Time of Calls to GW System: Average Response time of the out coming
requests to the backend system. Noticed that the backend system could be Gateway system or ERP system as well.
The Top SQL Statements view displays the top MDX statements and their response times. Due to technical reasons only the first 999 characters of the MDX statement are visible in SAP Solution Manager E2E Root Cause Analysis.
The Host view displays CPU & Memory utilization of the host running the SUP Server. It allows identifying CPU or memory bottlenecks.
USING SAP ROOT CAUSE ANALYSIS & SYSTEM MONITORING FOR SYBASE UNWIRED PLATFORM
15
2.7 E2E Exception Analysis
2.7.1 Goal and Concept The goal of the E2E Exception Analysis is to easily and efficiently identify the most frequent errors and the applications which are causing them. It provides an overview of dumps and exceptions from SUP based instances. Dedicated Key Performance Indicators (KPI) are calculated and displayed, allowing you to quickly isolate locations that cause a large number of errors or an unusual number of critical system errors. Thus, E2E Exception Analysis serves as a central hub for the analysis of errors, exceptions and dumps across all monitored systems. All data is extracted in regular intervals and can either be displayed in a condensed manner or in greater detail according to the requirements. In-depth analysis of specific error states can be initiated by accessing individual logs, traces or transactions through various Jump-in features.
2.7.2 How to Enter
1. Select one or several SUP Servers. 2. Press button “Exception Analysis”.
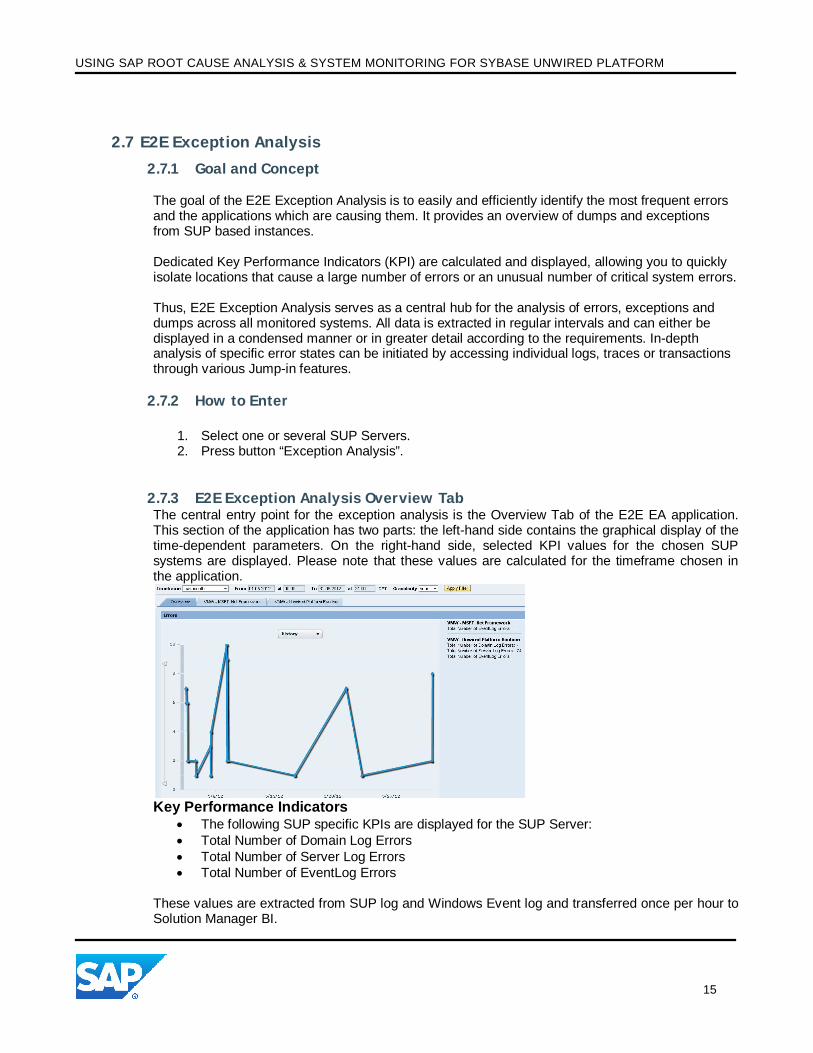
2.7.3 E2E Exception Analysis Overview Tab The central entry point for the exception analysis is the Overview Tab of the E2E EA application. This section of the application has two parts: the left-hand side contains the graphical display of the time-dependent parameters. On the right-hand side, selected KPI values for the chosen SUP systems are displayed. Please note that these values are calculated for the timeframe chosen in the application.
Key Performance Indicators
The following SUP specific KPIs are displayed for the SUP Server: Total Number of Domain Log Errors Total Number of Server Log Errors Total Number of EventLog Errors
These values are extracted from SUP log and Windows Event log and transferred once per hour to Solution Manager BI.
USING SAP ROOT CAUSE ANALYSIS & SYSTEM MONITORING FOR SYBASE UNWIRED PLATFORM
16
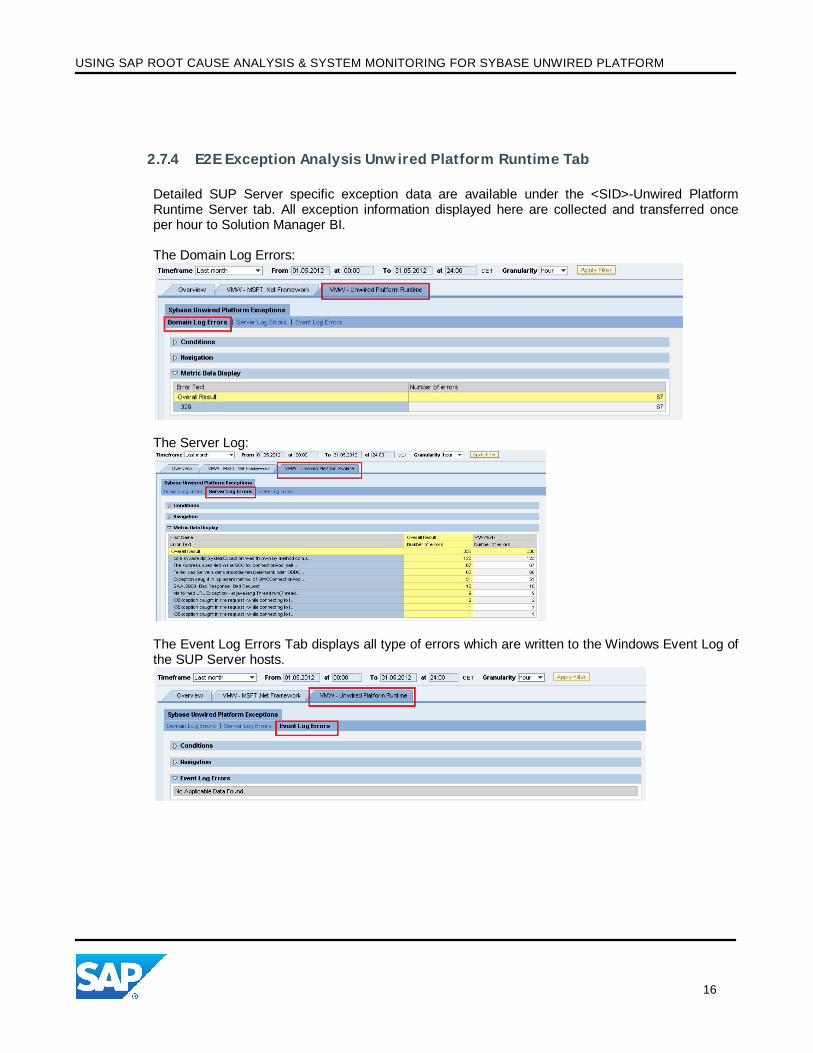
2.7.4 E2E Exception Analysis Unwired Platform Runtime Tab
Detailed SUP Server specific exception data are available under the <SID>-Unwired Platform Runtime Server tab. All exception information displayed here are collected and transferred once per hour to Solution Manager BI. The Domain Log Errors:
The Server Log:
The Event Log Errors Tab displays all type of errors which are written to the Windows Event Log of the SUP Server hosts.
USING SAP ROOT CAUSE ANALYSIS & SYSTEM MONITORING FOR SYBASE UNWIRED PLATFORM
17
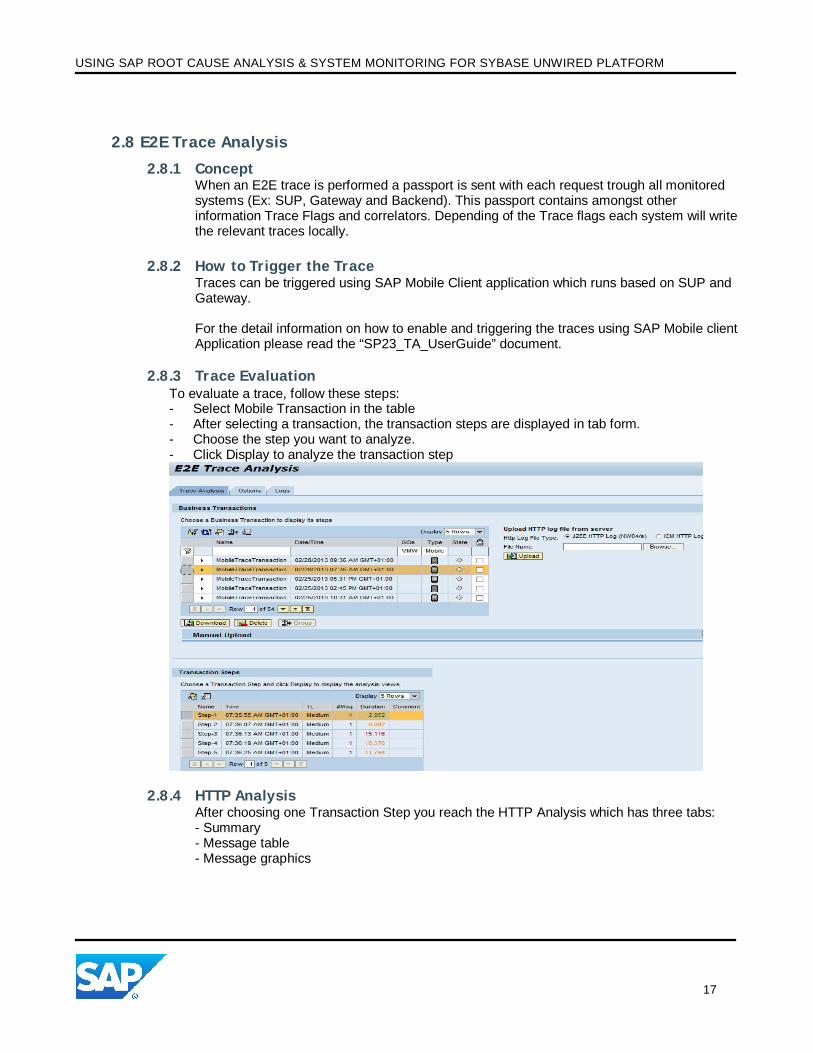
2.8 E2E Trace Analysis
2.8.1 Concept When an E2E trace is performed a passport is sent with each request trough all monitored systems (Ex: SUP, Gateway and Backend). This passport contains amongst other information Trace Flags and correlators. Depending of the Trace flags each system will write the relevant traces locally.
2.8.2 How to Trigger the Trace Traces can be triggered using SAP Mobile Client application which runs based on SUP and Gateway.
For the detail information on how to enable and triggering the traces using SAP Mobile client Application please read the “SP23_TA_UserGuide” document.
2.8.3 Trace Evaluation To evaluate a trace, follow these steps: - Select Mobile Transaction in the table - After selecting a transaction, the transaction steps are displayed in tab form. - Choose the step you want to analyze. - Click Display to analyze the transaction step
2.8.4 HTTP Analysis After choosing one Transaction Step you reach the HTTP Analysis which has three tabs: - Summary - Message table - Message graphics
USING SAP ROOT CAUSE ANALYSIS & SYSTEM MONITORING FOR SYBASE UNWIRED PLATFORM
18
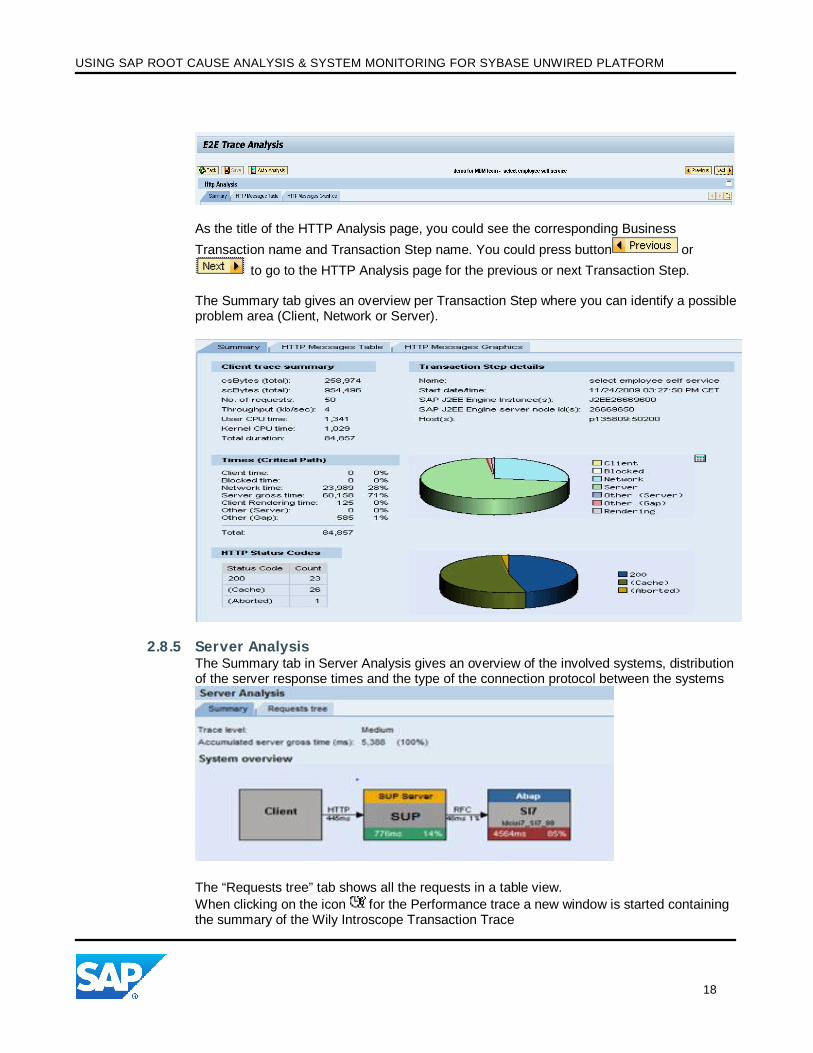
As the title of the HTTP Analysis page, you could see the corresponding Business Transaction name and Transaction Step name. You could press button or
to go to the HTTP Analysis page for the previous or next Transaction Step. The Summary tab gives an overview per Transaction Step where you can identify a possible problem area (Client, Network or Server).
2.8.5 Server Analysis The Summary tab in Server Analysis gives an overview of the involved systems, distribution of the server response times and the type of the connection protocol between the systems
The “Requests tree” tab shows all the requests in a table view. When clicking on the icon for the Performance trace a new window is started containing the summary of the Wily Introscope Transaction Trace

USING SAP ROOT CAUSE ANALYSIS & SYSTEM MONITORING FOR SYBASE UNWIRED PLATFORM
19
When clicking on the icon for the SQL Trace a new window is started containing the summary of SQL trace.

USING SAP ROOT CAUSE ANALYSIS & SYSTEM MONITORING FOR SYBASE UNWIRED PLATFORM
20
1. TECHNICAL MONITORING
1.1 Concept and Goal The central system monitoring in SAP Solution Manager 7.1 builds the foundation for a reliable and stable operation of complex heterogeneous system landscapes, as well as their instances, databases and hosts. Central configuration capabilities in conjunction with system landscape aware predefined monitoring templates significantly reduce the TCO for the configuration and operation of the infrastructure.
1.2 Activate and Apply the Monitoring Template
1.2.1 Procedure
1. Assume the template has been maintained in the SAP Solution Manager:Configuration – Technical Monitoring work center in the step 4. Now we select step 5 – Define Scope
2. Click on Filter in the system selection table and enter the SUP system SID 3. Select Step 6 – Setup Monitoring 4. Click the edit button, click the Assign Templates link, Select the template you want to use.
5. Final step is to click the Apply and Activate button. And now the template is activated and ready to be used.
1.3 Monitoring the System
1.3.1 How to Enter
1. Select one or several SUP systems in the System Monitoring application of the Technical
Monitoring workcenter.
2. Click System Monitoring -> Start New Window
1.3.2 Main User Interface
1. When opening a new window, you can see the UI like below:
USING SAP ROOT CAUSE ANALYSIS & SYSTEM MONITORING FOR SYBASE UNWIRED PLATFORM
21
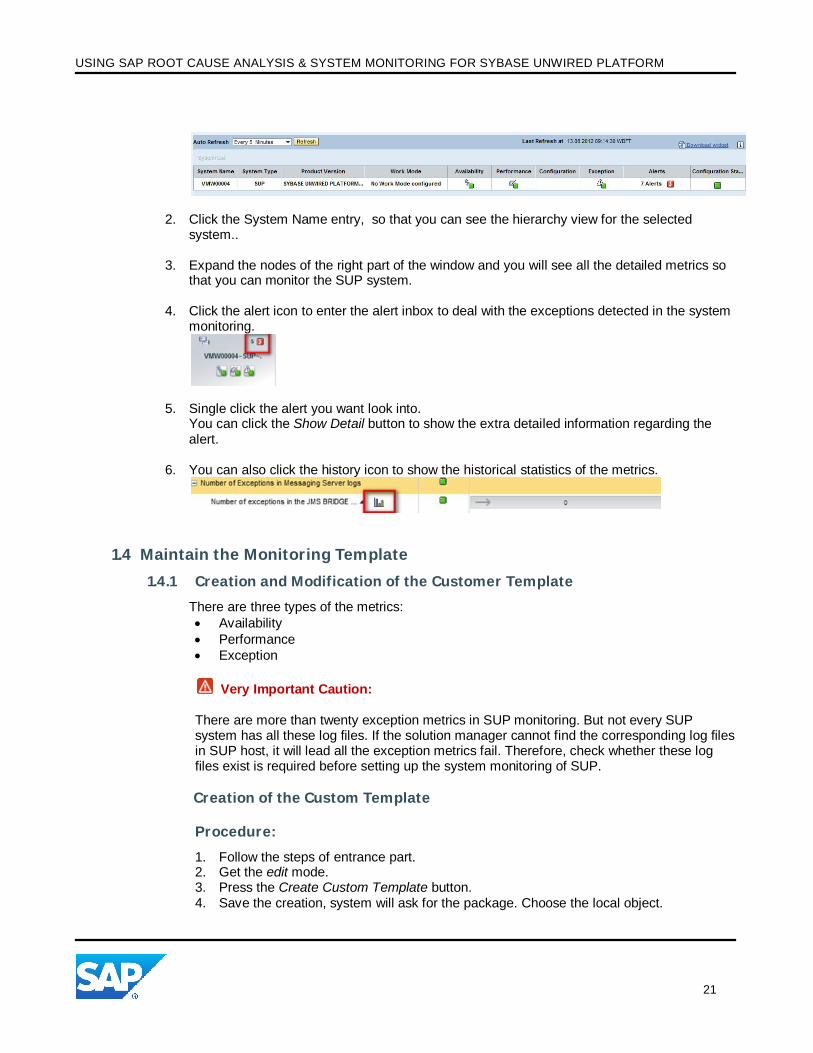
2. Click the System Name entry, so that you can see the hierarchy view for the selected system..
3. Expand the nodes of the right part of the window and you will see all the detailed metrics so that you can monitor the SUP system.
4. Click the alert icon to enter the alert inbox to deal with the exceptions detected in the system monitoring.
5. Single click the alert you want look into. You can click the Show Detail button to show the extra detailed information regarding the alert.
6. You can also click the history icon to show the historical statistics of the metrics.
1.4 Maintain the Monitoring Template
1.4.1 Creation and Modification of the Customer Template
There are three types of the metrics: Availability Performance Exception
Very Important Caution:
There are more than twenty exception metrics in SUP monitoring. But not every SUP system has all these log files. If the solution manager cannot find the corresponding log files in SUP host, it will lead all the exception metrics fail. Therefore, check whether these log files exist is required before setting up the system monitoring of SUP.
Creation of the Custom Template
Procedure:
1. Follow the steps of entrance part. 2. Get the edit mode. 3. Press the Create Custom Template button. 4. Save the creation, system will ask for the package. Choose the local object.
USING SAP ROOT CAUSE ANALYSIS & SYSTEM MONITORING FOR SYBASE UNWIRED PLATFORM
22
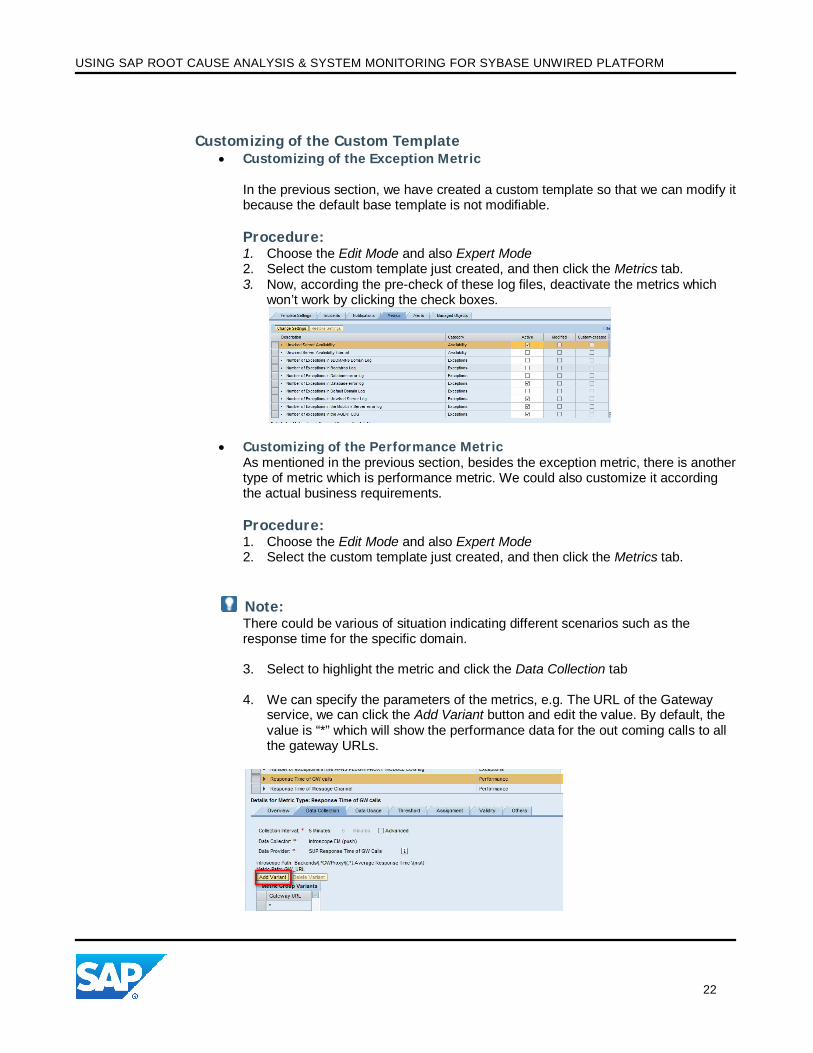
Customizing of the Custom Template Customizing of the Exception Metric
In the previous section, we have created a custom template so that we can modify it because the default base template is not modifiable. Procedure: 1. Choose the Edit Mode and also Expert Mode 2. Select the custom template just created, and then click the Metrics tab. 3. Now, according the pre-check of these log files, deactivate the metrics which
won’t work by clicking the check boxes.
Customizing of the Performance Metric As mentioned in the previous section, besides the exception metric, there is another type of metric which is performance metric. We could also customize it according the actual business requirements. Procedure: 1. Choose the Edit Mode and also Expert Mode 2. Select the custom template just created, and then click the Metrics tab.
Note: There could be various of situation indicating different scenarios such as the response time for the specific domain. 3. Select to highlight the metric and click the Data Collection tab
4. We can specify the parameters of the metrics, e.g. The URL of the Gateway
service, we can click the Add Variant button and edit the value. By default, the value is “*” which will show the performance data for the out coming calls to all the gateway URLs.

USING SAP ROOT CAUSE ANALYSIS & SYSTEM MONITORING FOR SYBASE UNWIRED PLATFORM
23
Customizing of the Database Metric The database template also needs to be modified according to the different scenarios or it won’t work properly. Procedure: 1. Choose a different base template. Database -> Sybase SQL anywhere –
Technical System Monitoring. 2. Create a customer template and select the custom template just created. 3. Here are some rules for the activation of the database template:
a. If the database is installed in the same host as the SUP system, you need to only activate :
Number of Exceptions in Database error log b. If the database is installed in a separate host, then Only deactivate: Number of Exceptions in Database error log c. Change the installation driver for every metric manually according to
where the db is installed (c:\ OR d:\)
d. Always check whether the log files exist on the host or not, if not,
make sure they are deactivated.

USING SAP ROOT CAUSE ANALYSIS & SYSTEM MONITORING FOR SYBASE UNWIRED PLATFORM
24
2. CA WILY INTROSCOPE 2.1.1 CA Wily Introscope .Net Agent
The SUP .Net Application Server is monitored and analyzed via CA Wily Introscope .Net Agent. CA Wily Introscope is used to instrument SUP .Net components in order to (a) measure the average response time of incoming requests and outcoming calls and send the performance measurements to CA Wily Introscope Enterprise Manager. The CA Wily Introscope Enterprise Manager is an integral part of SAP Solution Manager.
2.1.2 CA Wily Introscope Workstation
The clients of CA Wily Introscope are CA Wily Introscope Workstation or Introscope Webview. These clients allow you to display real time data measured by .Net Agent and to query the historical data stored in the Enterprise Manager.
Access the Introscope WorkStation or Introscope Webview from Solution Manager Work Centers. Select Host Analysis.
Select the host of a BPC application server. Select “Introscope WorkStation” or “Introscope Webview. Authenticate against CA Wily Introscope by providing username and password.
2.1.3 Dashboards
Inside the CA Wily Introscope workstation Console view, you will find Sybase Unwired Platform (ODP) Triage on the SAP navigation dashboards (Click page 3 and the SUP dashboard is on the bottom).

USING SAP ROOT CAUSE ANALYSIS & SYSTEM MONITORING FOR SYBASE UNWIRED PLATFORM
25
Every graph on the dashboards offers detailed information if the mouse hovers over a point of the metric. For the dashboard, you can find the detailed description of the metrics displayed in the following way
Right click the target Dashboard Click the links Click the Metrics Grouping Display it in Management Module Editor Click description tab
2.1.4 Dashboards for Sybase Unwired Platform
There are three links in SUP: Triage link to Triage dashboards and Overview link to Overview dashboards .
2.1.4.1 Triage dashboards Select Triage link. You will be brought to SUP Triage dashboard as shown below. The Triage dashboard contains a few dashboards which are:
Average Response Time of Client Requests Average Response Time of Calls to Backend System Number of Client Requests Datatier Response Time (Database) SUP Server Processes Heap Usage SUP Server Processes CPU Usage
These graphs provide a quick view on all kinds of performance data of the configured SUP hosts.
USING SAP ROOT CAUSE ANALYSIS & SYSTEM MONITORING FOR SYBASE UNWIRED PLATFORM
26
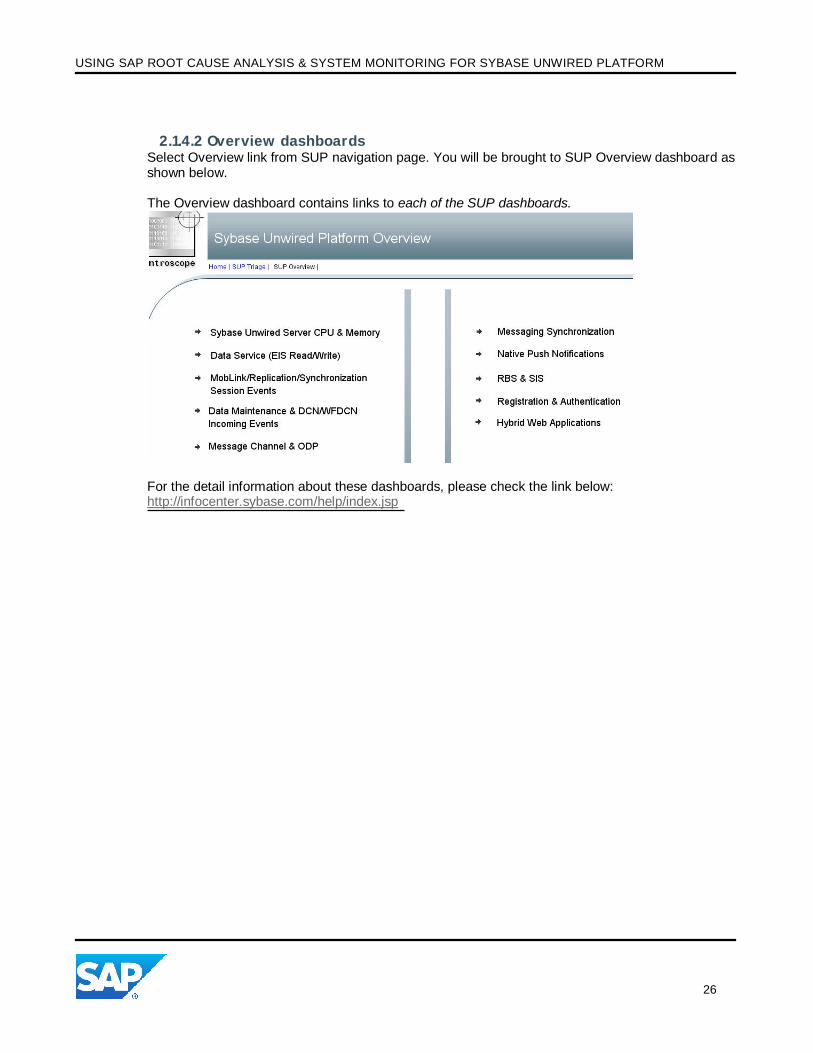
2.1.4.2 Overview dashboards Select Overview link from SUP navigation page. You will be brought to SUP Overview dashboard as shown below. The Overview dashboard contains links to each of the SUP dashboards.
For the detail information about these dashboards, please check the link below: http://infocenter.sybase.com/help/index.jsp

www.sap.com
©2012 SAP AG. All rights reserved.
SAP, R/3, SAP NetWeaver, Duet, PartnerEdge, ByDesign, SAP BusinessObjects Explorer, StreamWork, SAP HANA, and other SAP products and services mentioned herein as well as their respective logos are trademarks or registered trademarks of SAP AG in Germany and other countries. Business Objects and the Business Objects logo, BusinessObjects, Crystal Reports, Crystal Decisions, Web Intelligence, Xcelsius, and other Business Objects products and services mentioned herein as well as their respective logos are trademarks or registered trademarks of Business Objects Software Ltd. Business Objects is an SAP company. Sybase and Adaptive Server, iAnywhere, Sybase 365, SQL Anywhere, and other Sybase products and services mentioned herein as well as their respective logos are trademarks or registered trademarks of Sybase, Inc. Sybase is an SAP company. All other product and service names mentioned are the trademarks of their respective companies. Data contained in this document serves informational purposes only. National product specifications may vary. These materials are subject to change without notice. These materials are provided by SAP AG and its affiliated companies ("SAP Group") for informational purposes only, without representation or warranty of any kind, and SAP Group shall not be liable for errors or omissions with respect to the materials. The only warranties for SAP Group products and services are those that are set forth in the express warranty statements accompanying such products and services, if any. Nothing herein should be construed as constituting an additional warranty. .


