47
Using SAS ® Output Delivery System (ODS) Markup to Generate Custom PivotTable and PivotChart Reports Chevell Parker Technical Support Analyst, SAS Institute Inc.
| Date post: | 10-Apr-2018 |
| Category: |
Documents |
| Upload: | truongtuong |
| View: | 252 times |
| Download: | 2 times |

Using SAS® Output Delivery System (ODS) Markup to Generate Custom PivotTable and PivotChart Reports
Chevell Parker Technical Support Analyst, SAS Institute Inc.

2
Copyright © 2010, SAS Institute Inc. All rights reserved.
Overview
Introduction to Microsoft Excel PivotTable Reports
Customizing PivotTable Reports and Worksheets
Creating and Enhancing PivotChart Reports

3
Copyright © 2010, SAS Institute Inc. All rights reserved.
Introduction to Microsoft Excel PivotTable Reports
Defining a PivotTable Report
Anatomy of a PivotTable Report
Creating a PivotTable Report
Customizing PivotTable Reports
4
Copyright © 2010, SAS Institute Inc. All rights reserved.
Defining a PivotTable Report
A PivotTable report is a special table that is stored in the cache memory.
This type of storage enables you to view the report in various ways.
In the SAS® System, the closest equivalent to a
PivotTable is the TABULATE procedure.

5
Copyright © 2010, SAS Institute Inc. All rights reserved.
Why the Hype over PivotTable Reports?
Answers fundamental business questions
Makes sense out of the masses of data
Is easy to generate and chart
Provides the ability to change the orientation of data

6
Copyright © 2010, SAS Institute Inc. All rights reserved.
Anatomy of a PivotTable Report
A PivotTable report comprises various areas of the page:
Page area—filters or subsets a page.
Row area—adds data to the row.
Column area—adds column and field headers.
Data area—adds summary value that is to be analyzed.

7
Copyright © 2010, SAS Institute Inc. All rights reserved.
Creating Pivot Table Layout-Classic
Product_Line Year Profit
Quarter
8
Copyright © 2010, SAS Institute Inc. All rights reserved.
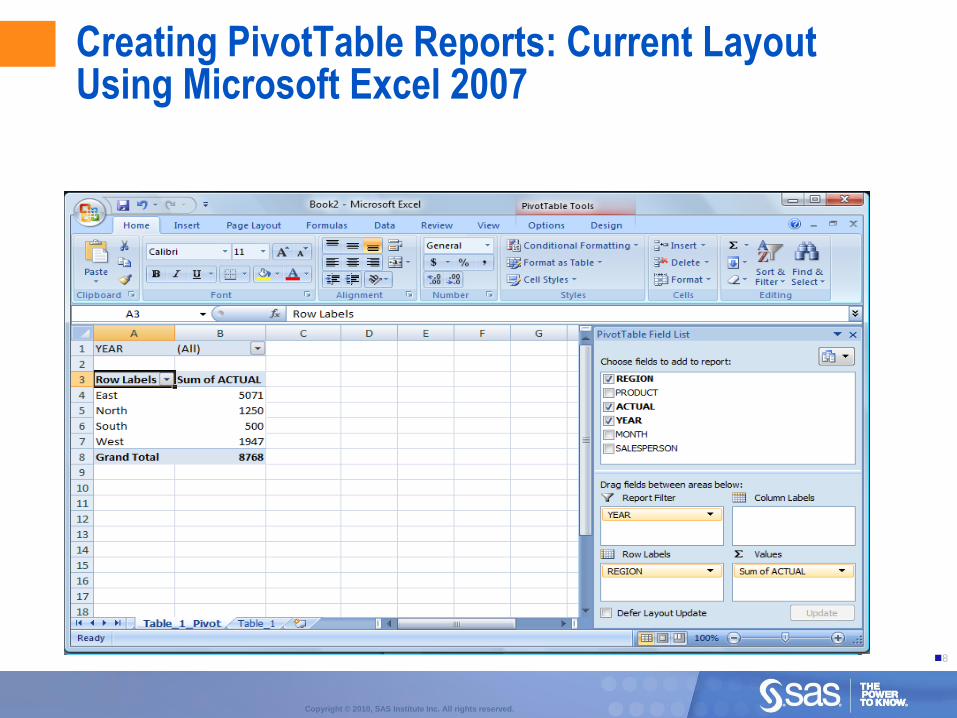
Creating PivotTable Reports: Current Layout Using Microsoft Excel 2007
Year
YEAR

9
Copyright © 2010, SAS Institute Inc. All rights reserved.
Preparing and Reviewing Source Data
To prepare your data as the source of the PivotTable report, do the following:
Verify subtotal are removed from the data.
Verify that columns contain one type of data.
Verify that each column has a heading.
Verify all blank spaces are removed from the source data.

10
Copyright © 2010, SAS Institute Inc. All rights reserved.
Creating Basic PivotTable Reports with Microsoft Excel
11
Copyright © 2010, SAS Institute Inc. All rights reserved.
Creating PivotTable Reports Using the TableEditor Tagset
With the TableEditor tagset, PivotTable reports are created from options that are passed in the code.
The TableEditor tagset can generate worksheets, PivotTable reports, and PivotChart reports.
Automation is used from within the Microsoft Internet Explorer browser.
You can execute TableEditor code in various ways.
The tagset uses Visual Basic for Applications (VBA) to modify Excel objects.
The TableEditor tagset is available at support.sas.com/rnd/base/ods/odsmarkup/tableeditor/index.html.
12
Copyright © 2010, SAS Institute Inc. All rights reserved.
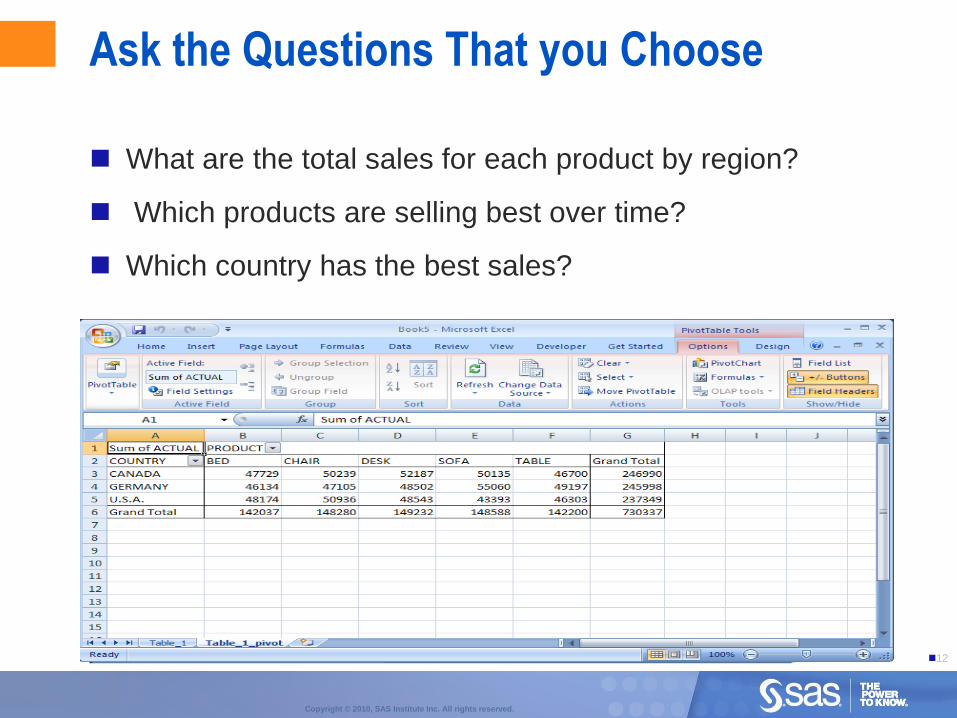
Ask the Questions That you Choose
What are the total sales for each product by region?
Which products are selling best over time?
Which country has the best sales?
13
Copyright © 2010, SAS Institute Inc. All rights reserved.
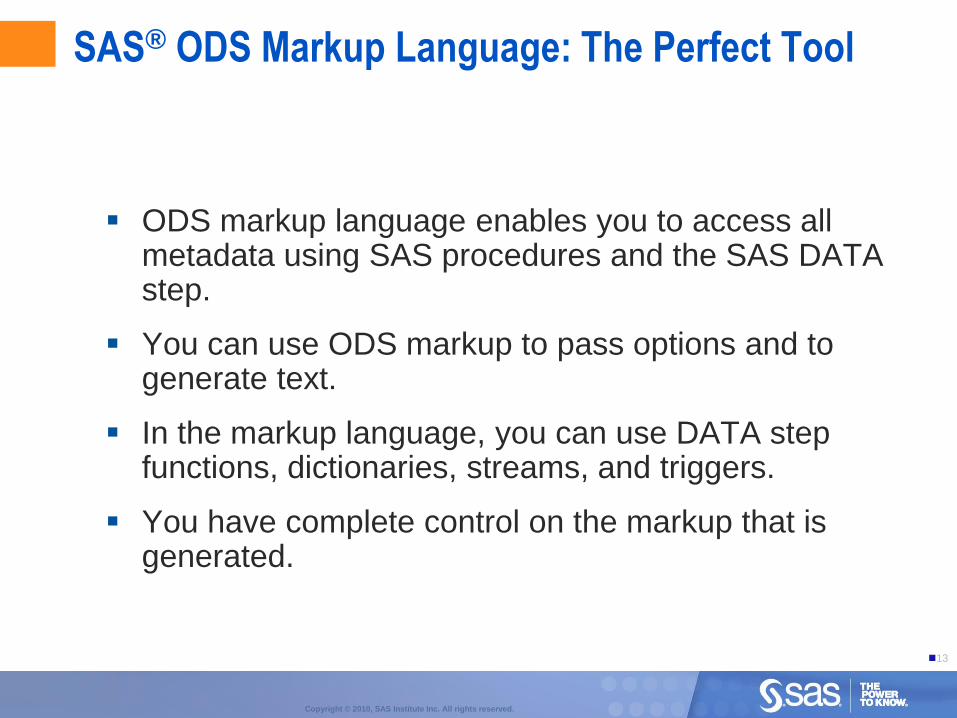
SAS® ODS Markup Language: The Perfect Tool
ODS markup language enables you to access all metadata using SAS procedures and the SAS DATA step.
You can use ODS markup to pass options and to generate text.
In the markup language, you can use DATA step functions, dictionaries, streams, and triggers.
You have complete control on the markup that is generated.

14
Copyright © 2010, SAS Institute Inc. All rights reserved.
ods tagsets.tableeditor file=“temp.html"
Options(pivotrow="product,product_category"
pivotcol="month"
pivotdata="actual,predict"
pivotpage="region");
proc print data=sashelp.prdsale;
run;
ods tagsets.tableeditor close;
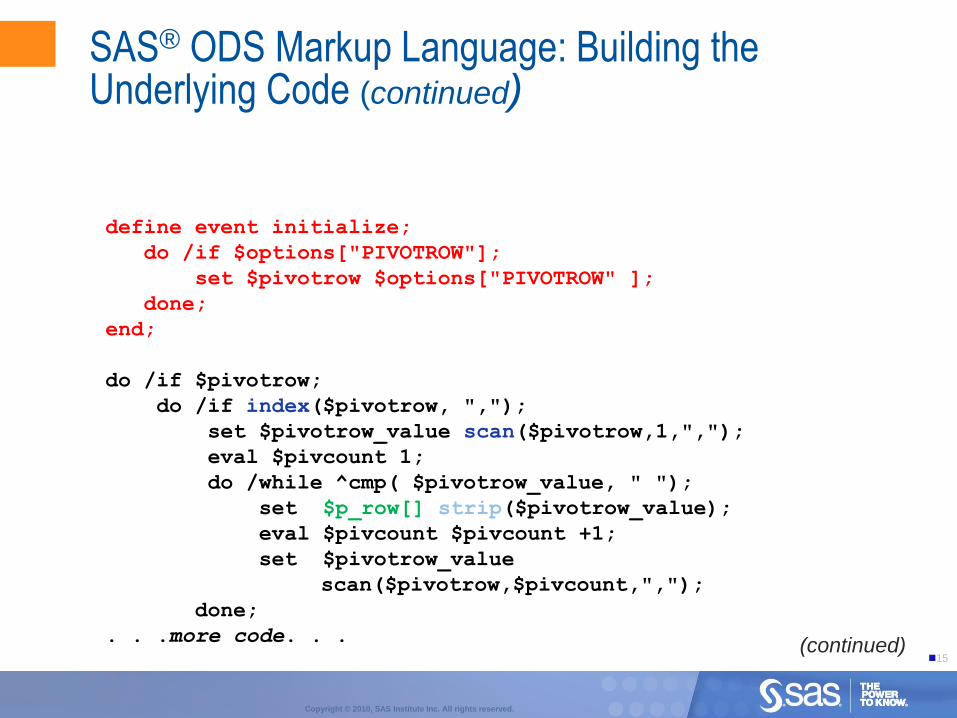
SAS® ODS Markup Language: Building the Underlying Code
15
Copyright © 2010, SAS Institute Inc. All rights reserved.
define event initialize;
do /if $options["PIVOTROW"];
set $pivotrow $options["PIVOTROW" ];
done;
end;
do /if $pivotrow;
do /if index($pivotrow, ",");
set $pivotrow_value scan($pivotrow,1,",");
eval $pivcount 1;
do /while ^cmp( $pivotrow_value, " ");
set $p_row[] strip($pivotrow_value);
eval $pivcount $pivcount +1;
set $pivotrow_value
scan($pivotrow,$pivcount,",");
done;
. . .more code. . .
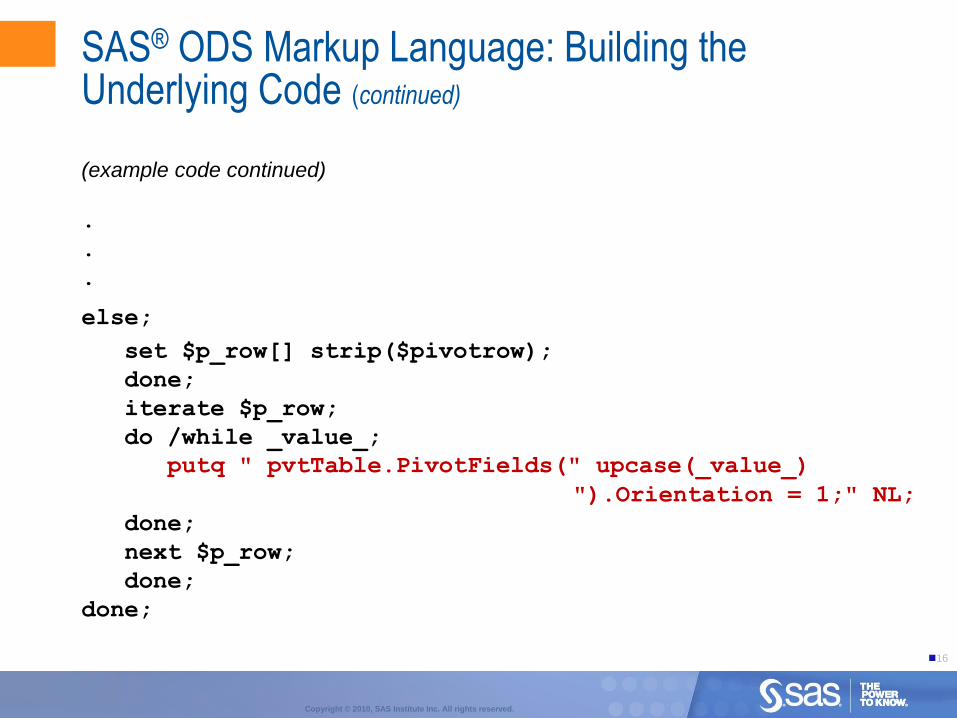
SAS® ODS Markup Language: Building the Underlying Code (continued)
(continued)
16
Copyright © 2010, SAS Institute Inc. All rights reserved.
.
.
.
else;
set $p_row[] strip($pivotrow);
done;
iterate $p_row;
do /while _value_;
putq " pvtTable.PivotFields(" upcase(_value_)
").Orientation = 1;" NL;
done;
next $p_row;
done;
done;
SAS® ODS Markup Language: Building the Underlying Code (continued)
(example code continued)

17
Copyright © 2010, SAS Institute Inc. All rights reserved.
Doc_Body (Start)
Table (Start)
(Finish)
Doc_Body (Finish)
Stream opened
Workbook statements added
Stream closed
Stream re-opened
Worksheet statements added
Stream closed
Stream re-opened
Workbook statements added
Stream closed
Excel options
Excel options
Excel options
tr.select();
document.execCommand("copy");
var xl = new
ActiveXObject("Excel.Application");
xl.Visible = true;
var wb = xl.Workbooks.Add();
var sheet = wb.ActiveSheet;
wb.Worksheets.Add;
var pws = wb.ActiveSheet;
pws.Name="Pivot_example";
var pvtTable = pws.PivotTableWizard( 1,
varSource=wb.sheets("Pivot")… ;
PivotFields("PRODUCT").Orientation = 1;
PivotFields("YEAR").Orientation = 2;
PivotFields("PROFIT").Orientation = 4;
sheet.SaveAs("c:\\temp\\xxx.xls");
// delete unused sheets
wb.Sheets("Sheet1").Delete;
wb.Sheets("Sheet2").Delete;
wb.Sheets("Sheet3").Delete;

18
Copyright © 2010, SAS Institute Inc. All rights reserved.
ods tagsets.tableeditor
file="%sysfunc(getoption(work))\work.html"
options(auto_excel="yes"
pivotrow="product"
pivotcol="month"
pivotdata="actual,predict"
pivotpage="region");
proc print data=sashelp.prdsale;
run;
ods tagsets.tableeditor close;
SAS® ODS Markup: Methods of Creating PivotTables
The following example creates a Web page in a temporary file that
automatically opens an Excel worksheet and a PivotTable report.
The OPTIONS parameter defines the various areas of the report.

19
Copyright © 2010, SAS Institute Inc. All rights reserved.
SAS® ODS Markup: Methods of Creating PivotTables (continued)
The previous
code
generates this
HTML Web
page. To
create the
corresponding
PivotTable
report, click Create
PivotTable.

20
Copyright © 2010, SAS Institute Inc. All rights reserved.
Column Area
Row Area
Data Area
SAS® ODS Markup: Methods of Creating PivotTables (continued)
The PivotTable report that is created from the HTML Web page:
Page Area

21
Copyright © 2010, SAS Institute Inc. All rights reserved.
Customizing PivotTable Reports
You can customize PivotTable reports in the following ways:
add and modify the statistics or functions
enhance output using number formats and styles
provide captions and other customizations
update existing workbooks and worksheets

22
Copyright © 2010, SAS Institute Inc. All rights reserved.
Modifying the Default Summary Function in Excel
Available statistics in Excel:
Average—the average of the data items
Count—the number of data items
Countnums—the number of data items with numeric values
Max—the data item with the largest value
Min—the data item with the smallest value
Product—the result of multiplying the data items
StdDev—the sample standard deviation
StdDevP—the population standard deviation
Sum—the result of adding the data items
Var—the sample variance
Varp—the population variance

23
Copyright © 2010, SAS Institute Inc. All rights reserved.
Modifying the Default Summary Function Using ODS Markup
ods tagsets.tableeditor
file="temp.html"
options(pivotrow="product_line"
pivotcol="year"
pivotdata="profit,quantity"
pivotdata_stats="sum,average");
proc print data=sashelp.orsales;
run;
ods tagsets.tableeditor close;

24
Copyright © 2010, SAS Institute Inc. All rights reserved.
Changing Summary Field Calculations
ods tagsets.tableeditor
options(sheet_name="Profit"
pivotrow="product_line"
pivotcol="year"
pivotdata="profit"
pivotdata_stats="sum"
pivotcalc="column") ;
proc print data=sashelp.orsales;
run;
ods tagsets.tableeditor close;
25
Copyright © 2010, SAS Institute Inc. All rights reserved.
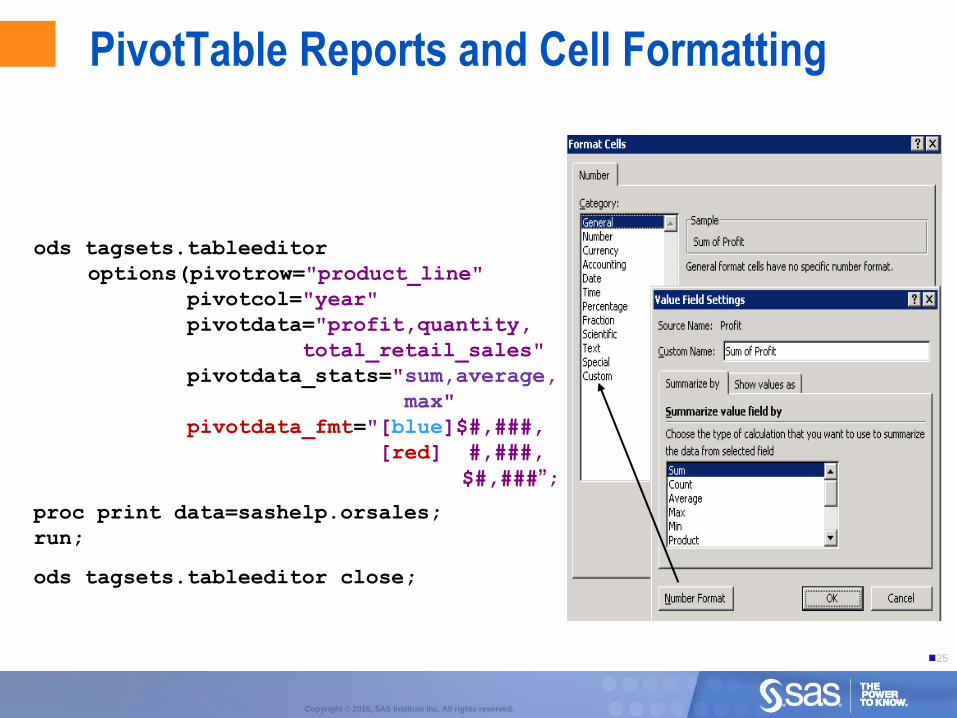
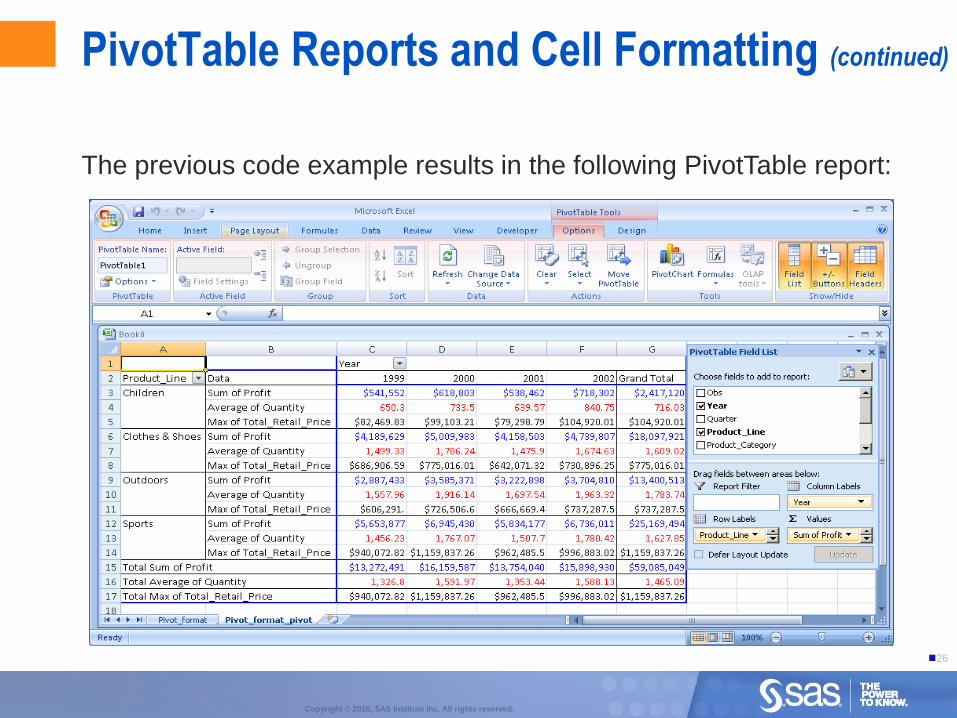
PivotTable Reports and Cell Formatting
ods tagsets.tableeditor
options(pivotrow="product_line"
pivotcol="year"
pivotdata="profit,quantity,
total_retail_sales"
pivotdata_stats="sum,average,
max"
pivotdata_fmt="[blue]$#,###,
[red] #,###,
$#,###”;
proc print data=sashelp.orsales;
run;
ods tagsets.tableeditor close;
26
Copyright © 2010, SAS Institute Inc. All rights reserved.
PivotTable Reports and Cell Formatting (continued)
The previous code example results in the following PivotTable report:

27
Copyright © 2010, SAS Institute Inc. All rights reserved.
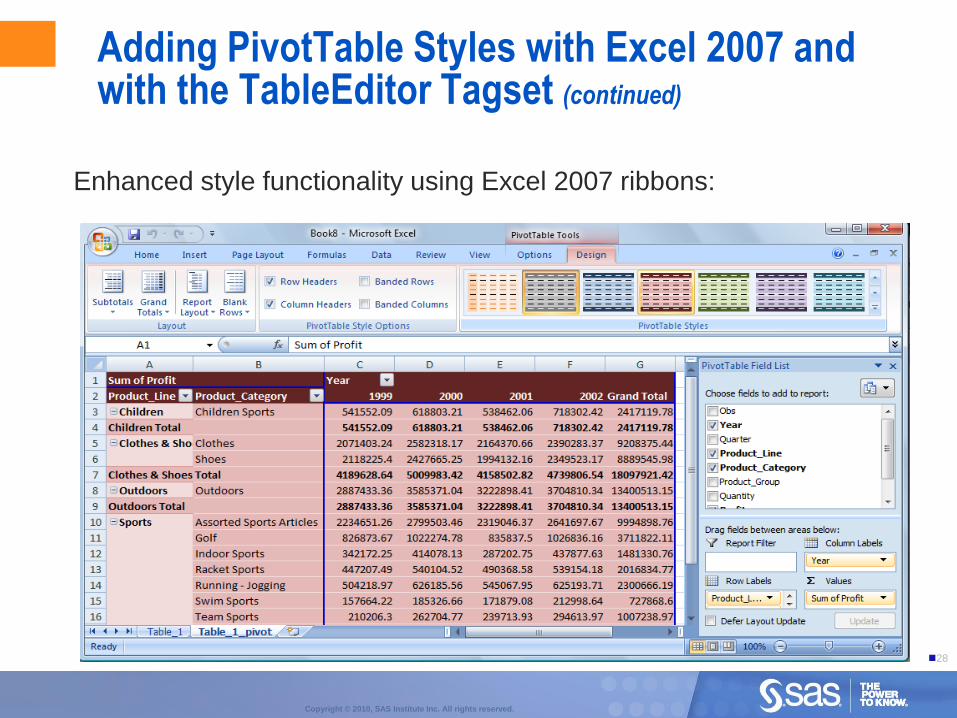
Adding PivotTable Styles with Excel 2007 and with the TableEditor Tagset
Excel 2007 uses a ribbon command bar to enhance style functionality.
With the TableEditor tagset, you apply styles with the PIVOT_FORMAT= option.
Note: To see a complete list of available options, specify the DOC=“HELP” option.
28
Copyright © 2010, SAS Institute Inc. All rights reserved.
Adding PivotTable Styles with Excel 2007 and with the TableEditor Tagset (continued)
Enhanced style functionality using Excel 2007 ribbons:

29
Copyright © 2010, SAS Institute Inc. All rights reserved.
Adding PivotTable Styles with Excel 2007 and with the TableEditor Tagset (continued)
ods tagsets.tableeditor file="temp.html”
options(pivotrow="product_line"
pivotcol="year"
pivotdata="profit,quantity"
pivot_format="dark2");
. . .more code. . .
ods tagsets.tableeditor file="temp.html";
options(pivotrow="product_line"
pivotcol="year"
pivotdata="profit,quantity"
pivot_format="dark3");
. . .more code. . .
ods tagsets.tableeditor file="temp.html";
options(pivotrow="product_line, product_category"
pivotcol="year"
pivotdata="profit,quantity"
pivot_format="dark4");
. . .more code. . .
Enhanced style functionality using the TableEditor tagset:

30
Copyright © 2010, SAS Institute Inc. All rights reserved.
Using the Tagset to Modify Captions and Totals for Calculations
Add captions for data values.
Control the display of the field list.
Remove a row and the final calculated total.

31
Copyright © 2010, SAS Institute Inc. All rights reserved.
Modifying Captions
ods tagsets.tableeditor file="temp.html"
options(pivotrow="Product_line"
pivotcol="year"
pivotdata="profit,quantity"
pivotcalc="row"
pivot_fieldlist="no"
pivotdata_caption="% of profit,
% of quantity"
);
proc print data=sashelp.orsales
run;
ods tagsets.tableeditor close;
Captions can be added to enhance your report.
32
Copyright © 2010, SAS Institute Inc. All rights reserved.
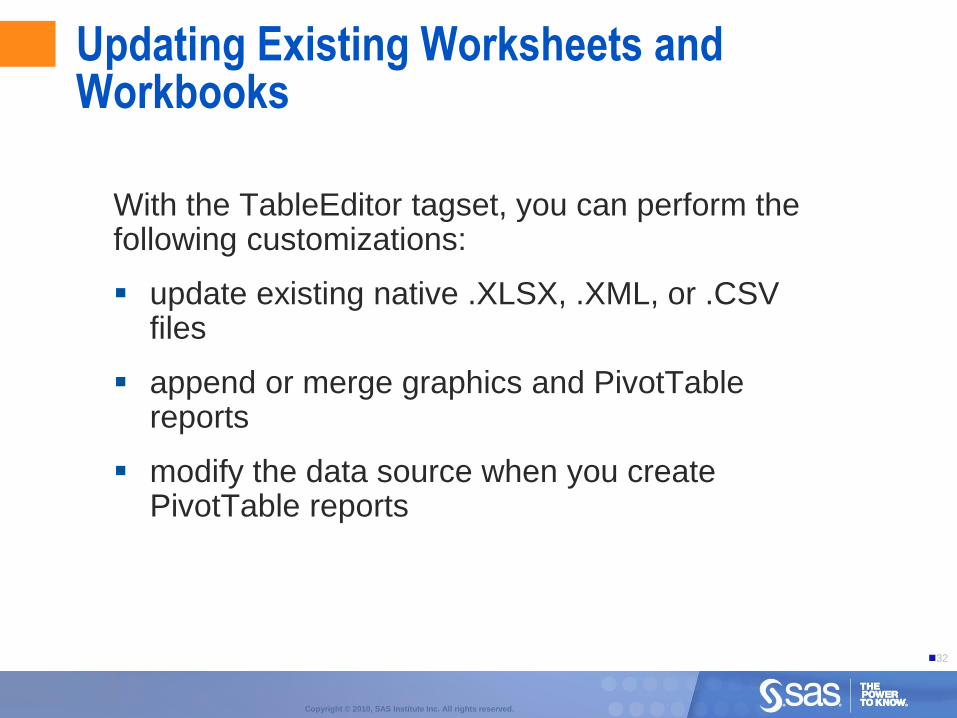
Updating Existing Worksheets and Workbooks
With the TableEditor tagset, you can perform the following customizations:
update existing native .XLSX, .XML, or .CSV files
append or merge graphics and PivotTable reports
modify the data source when you create PivotTable reports
33
Copyright © 2010, SAS Institute Inc. All rights reserved.
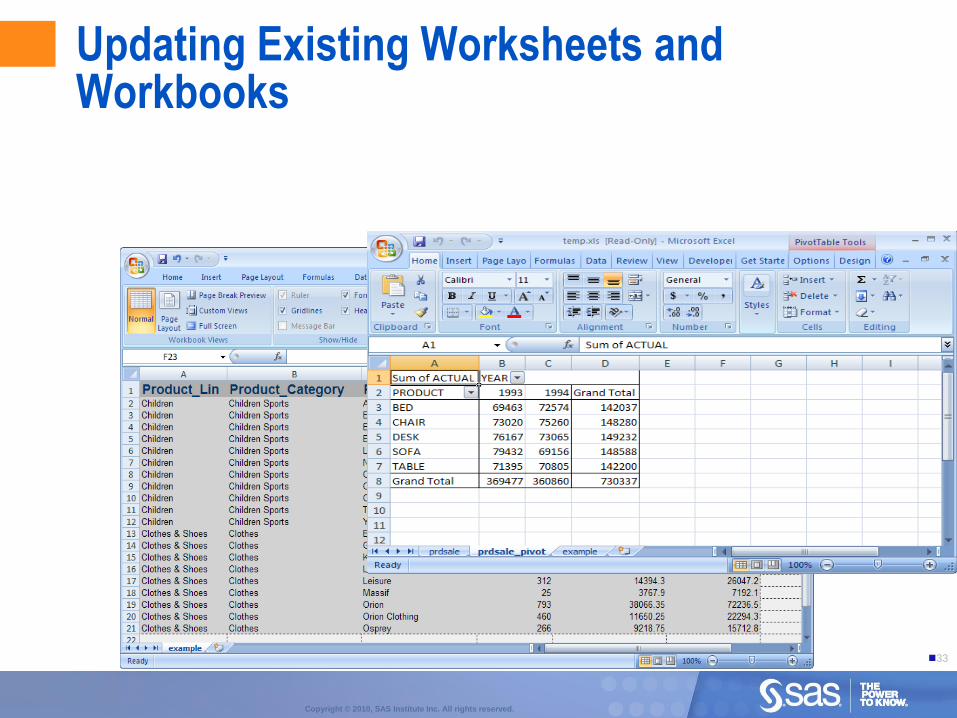
Updating Existing Worksheets and Workbooks
34
Copyright © 2010, SAS Institute Inc. All rights reserved.
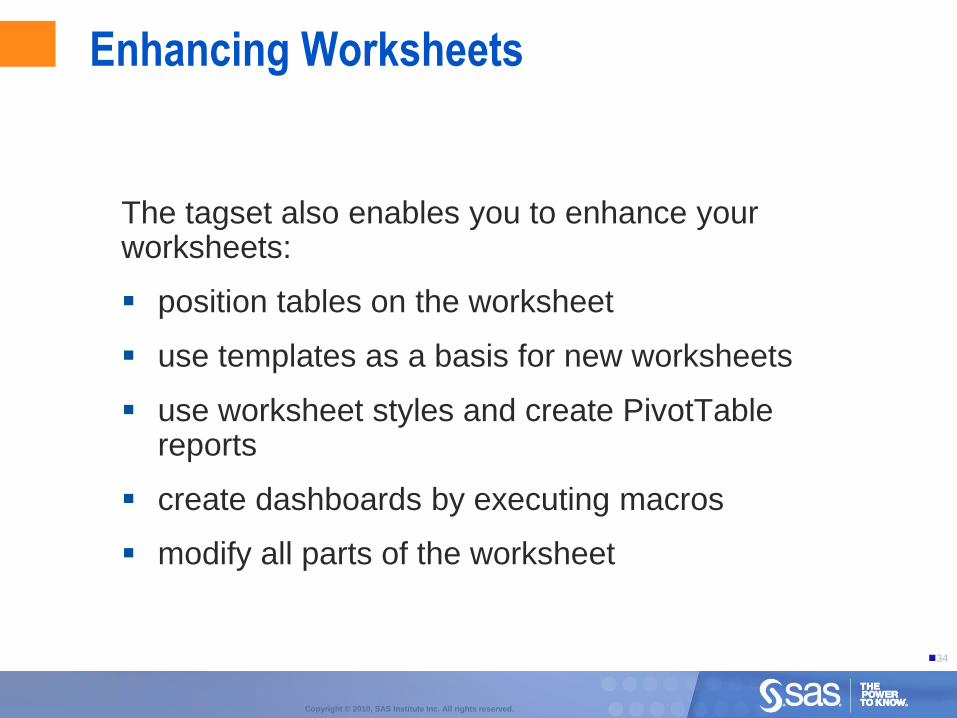
Enhancing Worksheets
The tagset also enables you to enhance your worksheets:
position tables on the worksheet
use templates as a basis for new worksheets
use worksheet styles and create PivotTable reports
create dashboards by executing macros
modify all parts of the worksheet
35
Copyright © 2010, SAS Institute Inc. All rights reserved.
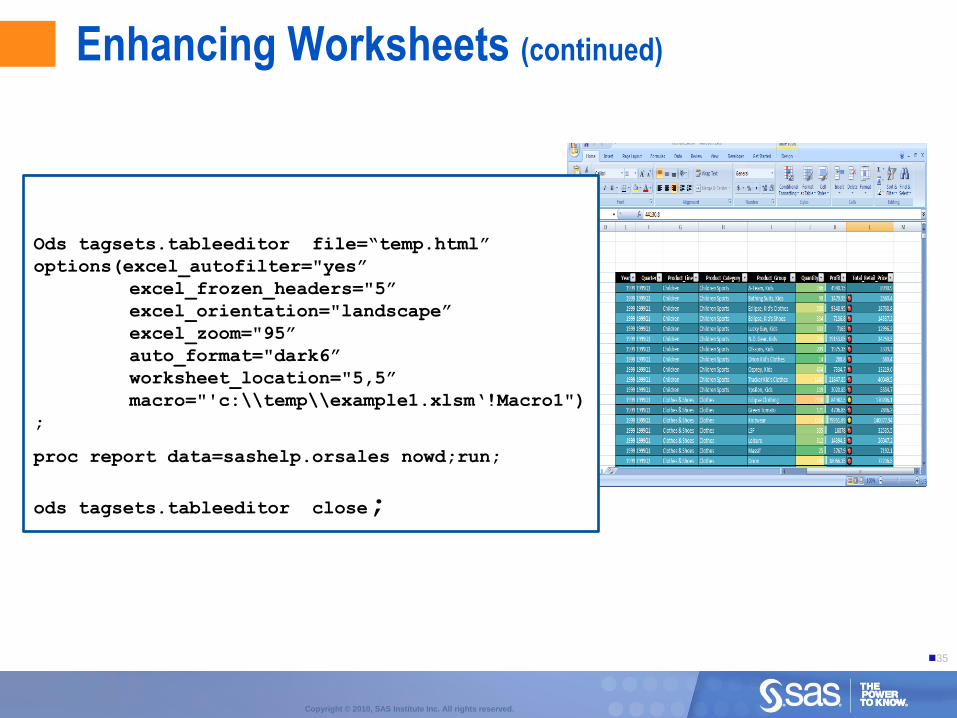
Enhancing Worksheets (continued)
Ods tagsets.tableeditor file=“temp.html”
options(excel_autofilter="yes”
excel_frozen_headers="5”
excel_orientation="landscape”
excel_zoom="95”
auto_format="dark6”
worksheet_location="5,5”
macro="'c:\\temp\\example1.xlsm„!Macro1")
;
proc report data=sashelp.orsales nowd;run;
ods tagsets.tableeditor close;
36
Copyright © 2010, SAS Institute Inc. All rights reserved.
Creating Effective PivotChart Reports
You can perform the following customizations using either Excel or the tagset:
change the type of chart
customize chart axes
modify the charts
embed charts

37
Copyright © 2010, SAS Institute Inc. All rights reserved.
Selecting and Modifying Chart Types
In Excel 2007:
Graphic capabilities have been enhanced.
You can specify a data source or have it dynamically created.
You can modify areas of a chart.

38
Copyright © 2010, SAS Institute Inc. All rights reserved.
Chart Title Value Axis
Category Axis
Field List
Legend
Components of a PivotChart Report
Series Title
Chart Area
39
Copyright © 2010, SAS Institute Inc. All rights reserved.
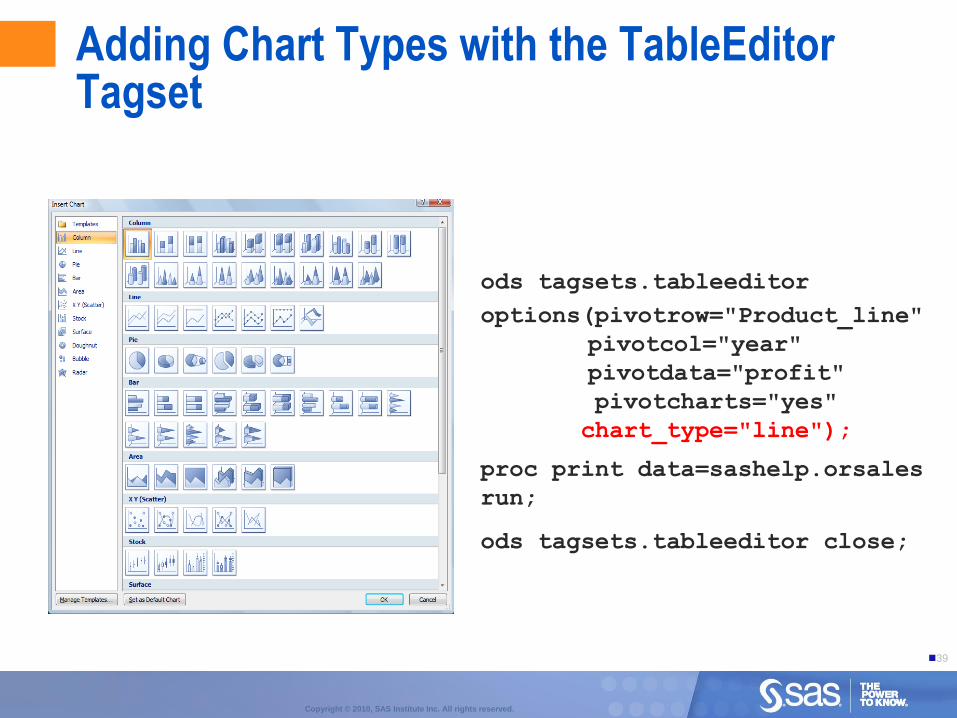
Adding Chart Types with the TableEditor Tagset
ods tagsets.tableeditor
options(pivotrow="Product_line"
pivotcol="year"
pivotdata="profit"
pivotcharts="yes"
chart_type="line");
proc print data=sashelp.orsales
run;
ods tagsets.tableeditor close;
40
Copyright © 2010, SAS Institute Inc. All rights reserved.
ods tagsets.tableeditor
options(pivotrow="product_ line"
pivotcol="year"
pivotdata="profit"
pivotdata_fmt="#,###"
pivotcharts="yes"
chart_type="cylindercol"
chart_title="Profit Analysis"
chart_yaxes_title="Profit"
chart_xaxes_title="Product");
proc print data=orsales;
run;
ods tagsets.tableeditor close;
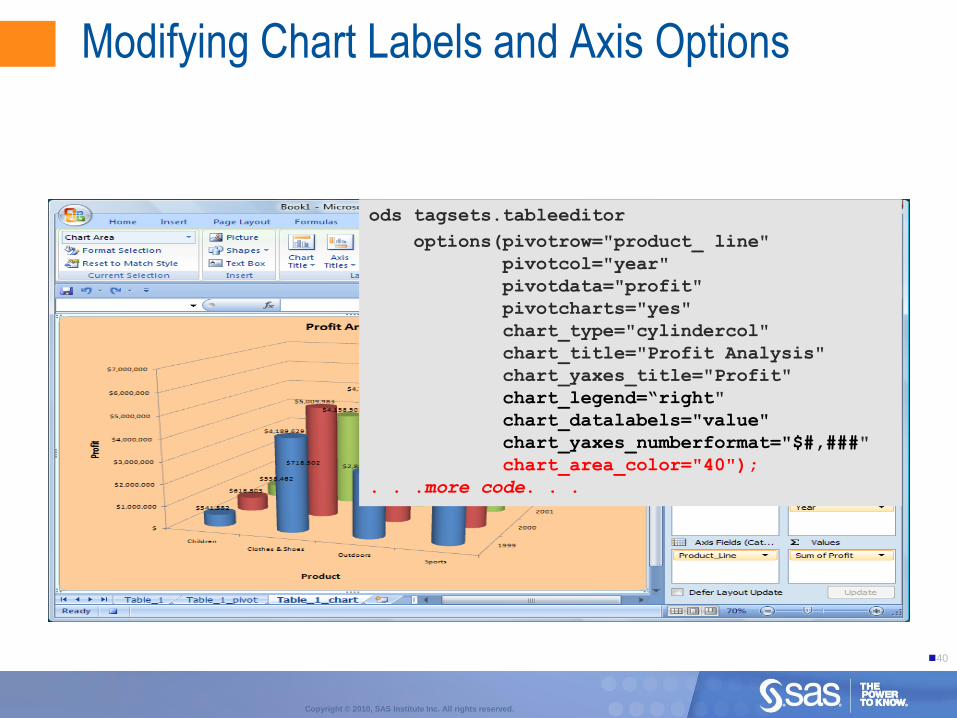
ods tagsets.tableeditor
options(pivotrow="product_ line"
pivotcol="year"
pivotdata="profit"
pivotcharts="yes”
chart_type="cylindercol"
chart_title="Profit Analysis"
chart_yaxes_title="Profit"
chart_legend="below"
chart_datalabels="value"
chart_yaxes_numberformat=" $#,###"
chart_xaxes_orientation=" -45")
. . .more code. . .
ods tagsets.tableeditor
options(pivotrow="product_ line"
pivotcol="year"
pivotdata="profit"
pivotcharts="yes"
chart_type="cylindercol"
chart_title="Profit Analysis"
chart_yaxes_title="Profit"
chart_legend=“right"
chart_datalabels="value"
chart_yaxes_numberformat="$#,###"
chart_area_color="40");
. . .more code. . .
Modifying Chart Labels and Axis Options

41
Copyright © 2010, SAS Institute Inc. All rights reserved.
Modifying Chart Styles
ods tagsets.tableeditor
options(pivotrow="product_ line"
pivotcol="year"
pivotdata="profit"
pivotcharts="yes"
chart_type="cylindercol"
chart_title="Profit Analysis"
chart_yaxes_title="Profit"
chart_legend="below"
chart_datalabels="value"
chart_yaxes_numberformat="$#,###"
chart_style="43");
. . .more code. . .
42
Copyright © 2010, SAS Institute Inc. All rights reserved.
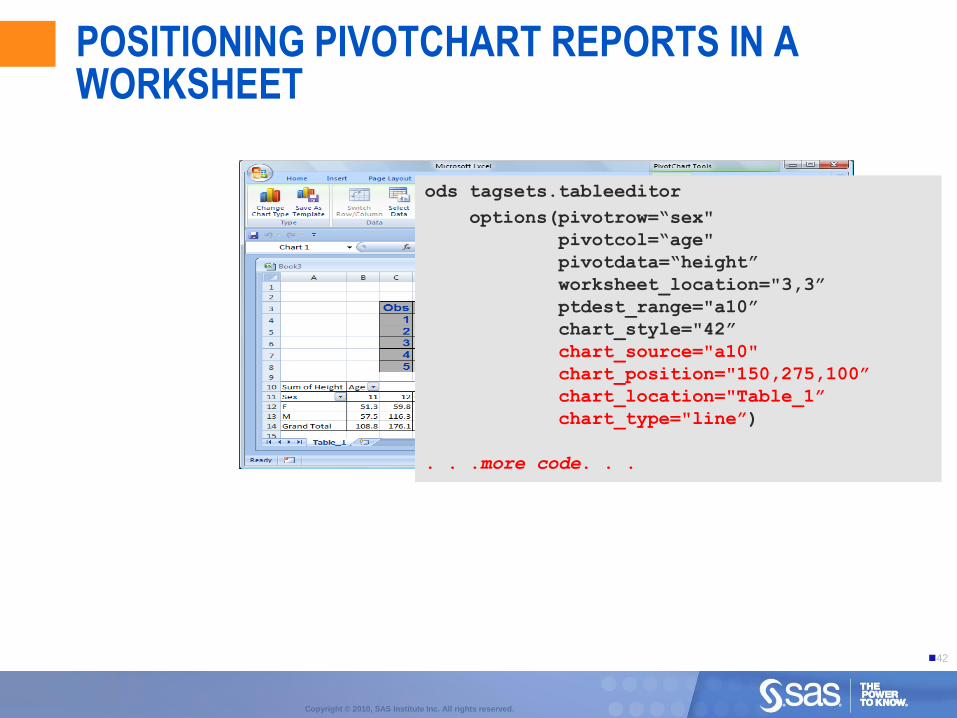
POSITIONING PIVOTCHART REPORTS IN A WORKSHEET
ods tagsets.tableeditor
options(pivotrow=“sex"
pivotcol=“age"
pivotdata=“height”
worksheet_location="3,3”
ptdest_range="a10”
chart_style="42”
chart_source="a10"
chart_position="150,275,100”
chart_location="Table_1”
chart_type="line”)
. . .more code. . .

43
Copyright © 2010, SAS Institute Inc. All rights reserved.
Modifying Chart Layouts
ods tagsets.tableeditor file="c:\temp.html”
options(pivotrow="product_line”
pivotcol="year”
pivotdata="profit”
pivotdata_fmt="#,###”
pivotcharts="yes”
chart_type="barclustered”
chart_title="Profit Analysis”
chart_yaxes_title="Profit”
chart_xaxes_title="Product_Line”
chart_style="42”
chart_legend="bottom”
chart_datalabels="value”
chart_layout="9");
. . .more code. . .
44
Copyright © 2010, SAS Institute Inc. All rights reserved.
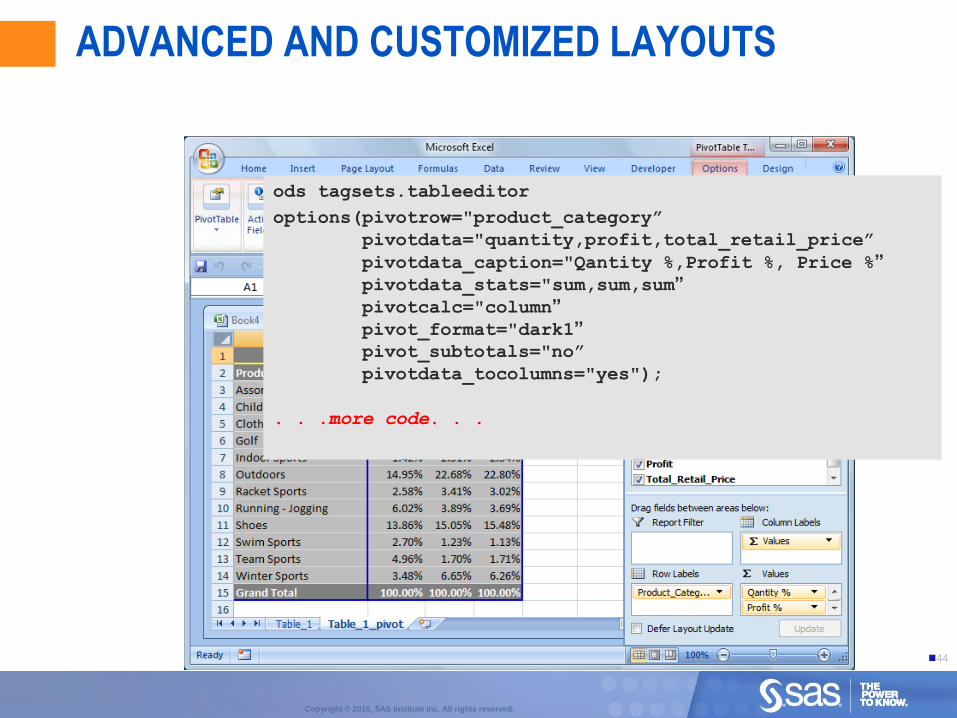
ADVANCED AND CUSTOMIZED LAYOUTS
ods tagsets.tableeditor
options(pivotrow="product_category”
pivotdata="quantity,profit,total_retail_price”
pivotdata_caption="Qantity %,Profit %, Price %”
pivotdata_stats="sum,sum,sum”
pivotcalc="column”
pivot_format="dark1”
pivot_subtotals="no”
pivotdata_tocolumns="yes");
. . .more code. . .
45
Copyright © 2010, SAS Institute Inc. All rights reserved.
Conclusion
Creating effective, customized PivotTable or PivotChart reports is easy with the TableEditor tagset, which was created with SAS ODS markup language.
46
Copyright © 2010, SAS Institute Inc. All rights reserved.
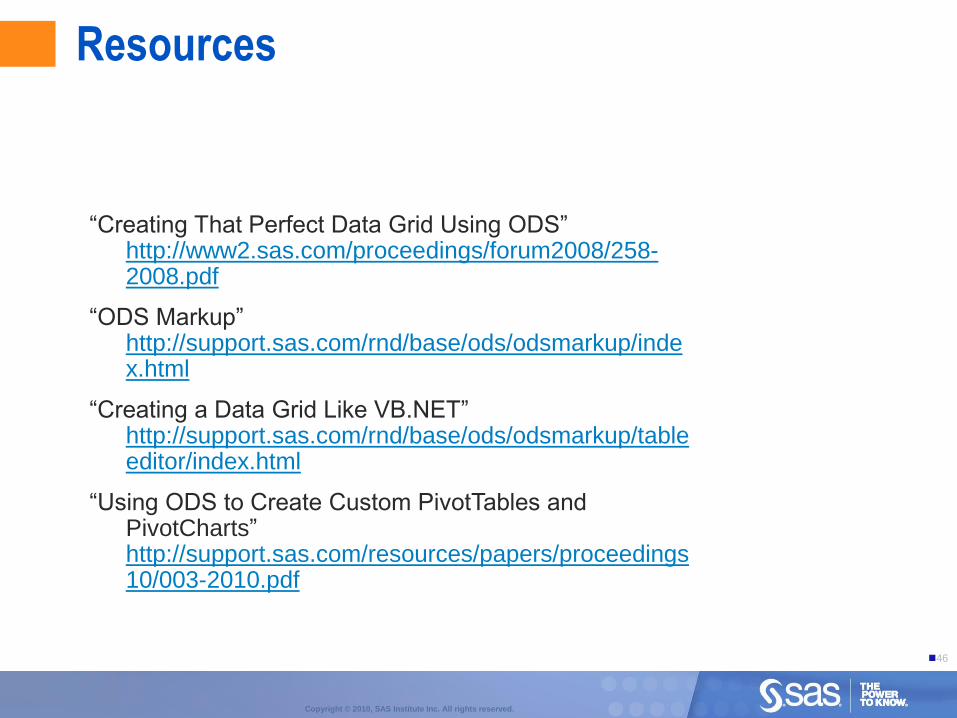
Resources
“Creating That Perfect Data Grid Using ODS” http://www2.sas.com/proceedings/forum2008/258-2008.pdf
“ODS Markup” http://support.sas.com/rnd/base/ods/odsmarkup/index.html
“Creating a Data Grid Like VB.NET” http://support.sas.com/rnd/base/ods/odsmarkup/tableeditor/index.html
“Using ODS to Create Custom PivotTables and PivotCharts” http://support.sas.com/resources/papers/proceedings10/003-2010.pdf

47
Copyright © 2010, SAS Institute Inc. All rights reserved.
Contact Information
EMAIL: [email protected]


