Using Six Sigma Transfer Functions for Analysing Customer’s Voice Dr. Thomas M. Fehlmann Euro Project Office AG, Zurich, Switzerland Eberhard Kranich T-Systems International GmbH, Bonn, Germany Abstract Purpose: Marketing surveys based on the one-question approach such as Net Promoter ® Score (NPS) have become popular for understanding the customer's experience with respect to various touch-points. The one-question approach avoids the pitfalls of multi-paged questionnaires. However, two issues must be addressed: (i) How can specific information on what drives customer referrals be extracted from a one question survey? and, (ii) Are such surveys suitable to reveal the Voice of Customer (VoC), as required for Lean and Six Sigma? The goal of this paper is to explain how such survey results can be leveraged for understanding customer’s voice, using Six Sigma concepts. The approach is extensible for covering analysing customer’s voice in helpdesk tickets, and from social media, as well. Approach: Combined with relevant information about customers from loyalty programs, Customer Relationship Management (CRM) systems, and from social networks, the corresponding customer can be categorized into segments. By means of Six Sigma Transfer Functions – a concept used in Design for Six Sigma (Hu and Antony, 2007) – root causes for the received answers can be identified by using Verbatim Analysis, a technique of Quality Function Deployment (QFD), to extract the VoC. Following (Denney, 2005), the root causes that drive the customer's responses are termed Business Drivers. Eigenvector Theory (Kressner, 2005) is used for analysing the response. Findings: One-question survey results can effectively be leveraged for understanding customer’s voice, by interpretation of the customer’s verbatim as Six Sigma transfer functions. This paper explains detection, selection, and validation of business drivers for customer surveys regarding products and services, uncovering perceived importance and satisfaction with their implementation in the software product. Research Implications: While transfer functions in mathematics and signal theory are well understood, its application to Six Sigma requires identifying the right controls from a wide range of possibilities. More than one solution might exist, and it is unknown how to qualify the optimum solution.
Transcript
Using Six Sigma Transfer Functions for
Analysing Customer’s Voice
Dr. Thomas M. Fehlmann
Euro Project Office AG, Zurich, Switzerland
Eberhard Kranich
T-Systems International GmbH, Bonn, Germany
Abstract
Purpose: Marketing surveys based on the one-question approach such as Net
Promoter® Score (NPS) have become popular for understanding the
customer's experience with respect to various touch-points. The one-question
approach avoids the pitfalls of multi-paged questionnaires. However, two
issues must be addressed: (i) How can specific information on what drives
customer referrals be extracted from a one question survey? and, (ii) Are
such surveys suitable to reveal the Voice of Customer (VoC), as required for
Lean and Six Sigma?
The goal of this paper is to explain how such survey results can be leveraged
for understanding customer’s voice, using Six Sigma concepts. The approach
is extensible for covering analysing customer’s voice in helpdesk tickets, and
from social media, as well.
Approach: Combined with relevant information about customers from loyalty
programs, Customer Relationship Management (CRM) systems, and from
social networks, the corresponding customer can be categorized into
segments.
By means of Six Sigma Transfer Functions – a concept used in Design for Six
Sigma (Hu and Antony, 2007) – root causes for the received answers can be
identified by using Verbatim Analysis, a technique of Quality Function
Deployment (QFD), to extract the VoC. Following (Denney, 2005), the root
causes that drive the customer's responses are termed Business Drivers.
Eigenvector Theory (Kressner, 2005) is used for analysing the response.
Findings: One-question survey results can effectively be leveraged for
understanding customer’s voice, by interpretation of the customer’s verbatim
as Six Sigma transfer functions. This paper explains detection, selection, and
validation of business drivers for customer surveys regarding products and
services, uncovering perceived importance and satisfaction with their
implementation in the software product.
Research Implications: While transfer functions in mathematics and signal
theory are well understood, its application to Six Sigma requires identifying
the right controls from a wide range of possibilities. More than one solution
might exist, and it is unknown how to qualify the optimum solution.
Originality: Transfer functions link Lean Six Sigma to VoC gathered by
marketing and customer communication, replacing lengthy and costly survey
questionnaires, thanks to eigenvalues that validate the analysis. This hasn’t
been published in a journal so far.
Keywords: Product Management, Product Innovation, Voice of the
Customer, Customer Surveys, Net Promoter® Score, Six Sigma, Transfer
Functions, Quality Function Deployment, Business Drivers for Product
Improvement, Business Drivers for Software Development.
Paper type: Research Paper
1 Introduction
1.1 Voice of the Customer – by Surveys?
The last few years have seen an abundance of surveys and questionnaires; all
intended to orientate an organization towards customer’s needs. You cannot
stay in a hotel overnight without getting a questionnaire, even your telecom
provider or commuter railway asks you whether you found helpful and
professional people in their stores or services.
Because interactive surveys via the web have become so cheap, they are used
to collect all kind of information from customers or prospects. However, are
surveys really appropriate for collecting customer’s voice?
Customers are aware of the fact that collectors of information usually know
whom they ask, thanks to their CRM system and new sparkling information
sources such as social media. So, can they answer honestly, especially if they
depend from that service?
Even worse, some surveys (especially in hotels) ask for behaviour character-
istics, naturally without taking circumstances into account. Salary and bonuses
might depend from such answers. So, what will people answer when they
realize that their answer affects the salary payment of their business contact?
Sometime, surveys are created that contains dozens of questions; sometimes,
silly questions are asked such as “How skilled were our consultants?” if I hire
them exactly for the skills I personally don’t have? How should I rate them?
All this is neither lean, nor able to collect Voice of the Customer (VoC).
Questionnaire-based surveys reflect the suppliers’ view on products and
services only, and the responses at best express the customer’s consent. That’s
not VoC!
1.2 The Gemba Way for Getting Feedback
Lean Six Sigma better looks at Gemba ways to get feedback. Gemba, (現場 genba), is a Japanese term meaning "the real place". Gemba refers to the place
where value is created: the factory floor, the sales point or where the service
provider interacts directly with the customer (Imai 1997).
Glenn Mazur introduced this term into Quality Function Deployment (QFD) to
denote the customer's place of business or lifestyle (Mazur, 2009). The idea is
that to be customer-driven, one must go to the customer's Gemba to
understand his use of product or service, using all one's senses to gather and
process data.
However, Gemba visits for services provided are not always possible and not
always able to properly assess the customer’s experience. For software,
usability tests have been widely accepted as a kind of Gemba visits, although
tests usually are conducted in lab environments and targeted to improve
human interaction design.
On the other hand, bright opportunities for Gemba visits are often ignored:
helpdesk tickets and feedback from support interventions. Helpdesk tickets
describe an unintended use of some product or service, and thus is a treasure
of information for the supplier to understand future business growth oppor-
tunities. Nevertheless, it’s ignored because analysing support data is difficult
and seems unattractive. Market researchers and quality managers rely on
multi-paged, and (from a respondent point of view) time-consuming
questionnaires to evaluate customer experience after support interventions,
reflecting the supplier view only.
Please tell us the reasons why you selected your score:
If a friend or colleague would ask you: how likely
are you to recommend <our product/service>?
Not at all likely Extremely likely
No. of Detractors No. of Promoters
All Respondents
%NPS = %Promoters – %Detractors
Surv
eyN
PS
Sco
re
Figure 1: NPS Ultimate Question Score Overview
When Fred Reichheld introduced the Ultimate Question approach for surveys
(Reichheld, 2007), it was a big step away from the supplier view. By asking
one question on how likely the customer is to recommend the supplier towards
friends and relatives (not business partners) by means of a scoring scale from
0 (= not at all likely) to 10 (= extremely likely) he brought the customer view,
his or her emotions and feelings, into surveys. This is the Gemba approach.
Additionally, the customer is invited to comment in his own words why he
selected that score.
These comments are the source treasure for analysing VoC. The Net Promoter
Score (NPS) itself is not a linear measurement – the respondents scoring with
9 and 10 are called promoters, those scoring between 0 to 6 detractors, and the
7 and 8 passive; the NPS is calculated as the difference between promoter
percentage and detractor percentage of the total sample. That metric has been
much disputed (Schneider et. al., 2009). Nevertheless, Reichheld claims NPS
is predicative for future business growth, and since the NPS approach is not
limited to measuring and statistical analysis but to acting upon the feedback
received by the customer, he is most probably right (Owen, 2009). The
predicative effect is not due to some statistical reason but for the closed-loop
work that is also part of the NPS approach. Companies use the NPS to
eliminate detractors, convert passives into promoters, and keep promoters by
product and process improvement, and this in turn is instrumental to business
growth.
However, in order to be able to act upon an NPS survey, we don’t need
statistical analysis but a verbatim analysis that allows us to understand what
the experience of customer in reality is – even if there are thousands of them!
The aim of this paper is to explain that such analysis is possible with little
effort, using standard Six Sigma techniques know from Design for Six Sigma
(DfSS). For DfSS, see e.g., (Creveling et. al., 2003). How it works is
demonstrated for NPS surveys. On the other hand, it is not the aim of this
paper to discuss statistical or metronomic significance of NPS.
2 Transfer Functions
2.1 Transfer Functions for understanding Cause-Effect
If root causes in Gemba visits are hidden behind the observed effects, e.g., the
VoC behind a support call or complaint, then the method of choice to uncover
such causes are transfer functions. Transfer functions map Controls onto
Responses, for instance design decision into product features in DfSS, or
Voice of the Engineer onto VoC in QFD. The response is known – observable,
measurable – whilst the choice of controls is uncertain, and the optimum
control profile sought for designing a product or service right.
A Transfer Function describes the mapping of the input parameters
to the output of a process, mathematically expressed as ( ). In DfSS terminology, are called process controls,
denoted by the n-dimensional real-valued column vector ( ) ,
and the output is termed the process response. A process with multiple
process response is characterised by the m-dimensional real-valued column
vector ( ) . The vector x is called the solution profile and the
vector the response profile. Assume all profiles be normalized to vector
length one.
A typical example of a single process response transfer function is the duration
y for a set of tasks:
∑
( ) (1)
where the duration of each task j is denoted by , . An example of
a multiple process response transfer function is the overall cost y of removing
software defects injected in a phase i of a software development process:
∑
(2)
with represents the number of defects injected in phase i and detected in
phase j, and the corresponding cost (2) is a system of linear equations and
can be rewritten in matrix-vector notation , see (Fehlmann and
Kranich, 2011). Applications of multiple response linear transfer functions are
of special interest in, for instance, Axiomatic Design and QFD, see e.g., (Yang
and El-Haik, 2009).
2.2 Validating Transfer Functions
A transfer function may be simple, polynomial, complex function or a
composition of other (transfer) functions and its form can be determined by
means of statistical techniques such as Multiple Linear Regression Analysis,
Design of Experiments or the Response Surface Methodology when
experimental data are available, see, e.g., (Hu and Antony, 2007).
However, in DfSS, QFD, and in all sorts of quality management, linear
mappings in form of multiple response transfer functions play an outstanding
role. For a brief linear algebra background on linear mappings and their
relationships to matrices, see (Fehlmann and Kranich, 2011), (Lang, 1973),
and (Roman, 2007) for further details.
Let be a linear multiple response transfer function. This function
can be represented by an matrix , and let ( ) be its
components, . To each linear mapping, its dual linear
mapping is the transpose of the matrix , i.e., ( ). The
matrix product is symmetric and – in most cases – positive definite, i.e.,
for all .
Symmetric positive definite matrices have real – non imaginary – eigenvalues
and therefore its associated transfer function has a principal eigenvector. The
eigenvector is characterized by the equation , where the eigen-
value because of the assumption all profiles have length zero. If is a –
measured or otherwise known – response profile, then ( ) is a
candidate solution profile.
Now calculate the Euclidian difference between the known response profile
and the candidate controls profile ( ) ( ( )):
‖ ‖ √∑( )
(3)
(3) is called the Convergence Gap. If the convergence gap is zero, the vector
is an eigenvector of to the eigenvalue 1, since all profiles are assumed to
be normalized to length one. If the convergence gap is sufficiently close to
zero, i.e., within predefined limits, the controls ( ) are still good
enough. For some applications like QFD and AHP, the convergence gap is
used for validating the expert analysis of the transfer function (in AHP: the
pairwise decision matrix). The eigenvector theory eliminates the measurement
errors made in the expert analysis using redundant information in the decision
matrix. A similar statement also holds for QFD. For a theoretical background
regarding QFD matrices, see (Fehlmann, 2005).
If the vector is out of the limits for an eigenvector, it doesn’t define
acceptable controls. The inequality ( ( )) means that the transfer
function applied to the controls ( ) yield some significantly different
response than the response profile vector that was observed, or required.
Therefore, it is no solution to the problem of finding suitable controls for
getting the response within allowable limits.
2.3 Finding the Right Controls
It is obvious how eigenvectors can be used to find optimum solutions for any
problem of the form ( ) where is unknown. As already mentioned,
the convergence gap plays an invaluable role in QFD and DfSS for validating
controls. In QFD for instance, the transfer function is found by collecting
expert opinion for each of the matrix cells. In DfSS, the cell values are
measured by Design of Experiments (DOE), or other Six Sigma tools.
A natural question arises: how many controls are needed to guarantee the
expected response with minimal cost? Most often more dimensions are needed
for the controls than for the observed response profile. Therefore holds.
Otherwise, some of the responses would be interdependent and thus
redundant; the dimensions of control and response profiles behave like degrees
of freedom in mathematical statistics.
In practice, control profiles must be mapped to some real domain controls that
allow guaranteeing the observed response accurately enough. How this works
will now be explained for VoC analysis.
3 Voice of the Customer Analysis
3.1 Building Transfer Functions from VoC
Generally, VoC is expressed with words and statements. The most popular and
widely used analysis method for such VoC is Verbatim Analysis. The basic
technique of verbatim analysis is to apply Six Sigma’s affinity diagram
developing procedure to VoC.
This technique is hard to automate because of the variety of natural language
and the difficulty of recognizing semantics. Most customer verbatims require a
context for understanding. Nevertheless, for surveys or support tickets that
amount to a few hundred samples, manual analysis is feasible. Since there is
not much of higher value than a customer verbatim, it pays off. It’s no waste.
3.2 Business Drivers
Transfer functions origin from analysis of signals and systems such as Fourier
transforms (Girod et.al., 2001). The principle of customer verbatim analysis is
similar to signal theory. It is called frequency analysis; instead of counting
wave functions, you count how often certain words or notions are referenced.
The customer verbatim is categorized into references to some Business
Drivers (Denney, 2005). It is advisable to take as few business drivers as
possibly needed for explaining the observed behaviour in the response. Most
domain experts know business drivers quite well, and the customers itself
supply keywords that allow detecting new business drivers unheard so far.
Analysing social media and community discussions might help as well for
selecting a suitable set of business drivers.
If frequency of references is collected and matched to the various customer
segments, a multi-response transfer function is defined that maps frequency of
verbatims to segment responses. The frequency yields a profile for the -axis
of the matrix. The response profile we get from the NPS score by segments.
3.3 Measurement Errors
In reality, the observed response profile as well as the transfer function
(the result of verbatim analysis) is subject to measurement errors. Respondents
may not understand the NPS scale and skew their score. Availability of
context information and verbal skills impact the verbatim analysis; language
sometimes is fuzzy and people don’t express them correctly. Written
statements often contain syntax flaws and the semantics are not clear. Humans
knowing the context may understand better, but for an analysis tool it might
become rather complicated.
However, the eigenvector theory yields a test for such frequency analysis.
Assume the matrix found by verbatim analysis; if the analysis is correct,
must have an eigenvector with . Let be the survey response
profile; ideally and therefore, since is a principal eigenvector, it
would hold . Thus the Euclidian difference ‖ ‖ is a size metrics for
the total Measurement Error of both the response measurement and the
transfer function .
3.4 Adjusting the Analysis
Since calculating an eigenvector in practice is very easy, both measurement
error and convergence gap might be used to identify mistakes done in the
verbatim analysis. However, the measurement error has the advantage that it
doesn’t depend from the choice of controls; thus it is the primary choice for
identifying mistakes in the verbatim analysis.
For verbatim analysis, most often the fuzzy meaning can be interpreted in the
several ways, and the preferred way is such that the analysis result matches the
overall observed response, i.e., the measurement error decreases.
This principle allows for defining algorithms that do the verbatim analysis
automatically. Not unlike multiple linear regressions, searching for minimal
measurement error yields an improved transfer function and therefore an
improved as well from the frequency analysis.
With that improved transfer function , the control profile can be
calculated and compared to its convergence gap.
4 Lessons Learned
4.1 Benefits
NPS surveys can deliver more information than traditional questionnaire-
based surveys can by not reflecting the supplier view but by stimulating
customer’s voice through an emotional channel.
Verbatim analysis is well understood in the Six Sigma community and tools
are available to extend it for much larger response samples than only a few
hundred. Transfer functions, validated by the eigenvector theory, play a major
role in DfSS and thus can easily be adapted to understand VoC when physical
Gemba is impossible.
NPS surveys are popular, well-received by customers, transport an important
message to the respondent, namely how important it is to recommend his or
her preferred supplier, and allow for better Gemba in service areas.
The predictive value of NPS lies in the actions and follow-ups, in personal
contacts with respondents, in process improvement where needed, in better
meeting business requirements of customers.
4.2 Limitations
If importance and satisfaction differ too much, or if NPS is not applicable
because it’s negative, the eigenvector validation method doesn’t work as nice.
However, this is easy to test, and the responses itself are still helpful even if
they cannot explain the observed NPS.
Verbatim analysis for large survey samples require a sophisticated tool set for
automatic analysis of the responses. However, the eigenvector theory also
softens mistakes made in the analysis.
If business drivers are unknown, or not able to explain the observed NPS, the
verbatim analysis can still be used to find relevant drivers.
4.3 Managerial Impact
The NPS approach described in this paper offers the ability to extract the
essential business drivers reflecting the Gemba VoC. Hence, the NPS
approach – when combined with Six Sigma transfer functions and eigenvector
theory – helps managers and strategic decision makers of a company to
promptly produce products or services the customers really want, even in the
case when the free-text answer is fuzzy in some sense. Again, this emphasizes
the advantage of using a constructive method against a purely descriptive
statistical approach.
4.4 Future Steps
In the past, the authors conducted and analysed a small number of NPS
surveys with at most 300 respondents in the Business-to-Business (B2B)
environment. Since the results proved to be very promising, a first step is to
conduct NPS surveys with much larger samples in Business-to-Consumer
(B2C) settings, probably for a large company. It is of special interest in such
an environment how and by means of which tools the verbatim analysis can be
performed efficiently.
The subject of the second step is to carry out a comparison of the NPS results
and those results obtained by traditional statistical methods for calculating
customer’s satisfaction.
5 Outlook and Conclusion
Business Drivers is a valuable concept for analysing customer’s voice. NPS
measures the probability of referrals, resulting from their importance, and
from satisfaction with them. Both transfer functions are validated by its eigen-
vector.
Eigenvector theory is a constructive, not empirical, method for analysing
cause-effect relationships. It is useful in many business areas, as presented
here when analysing business drivers that cause high NPS in surveys for a
software vendor. Eigenvectors also enable software project managers to
establish self-control for reaching business goals, such as to deliver the
business driver’s importance profile found in the survey; see (Fehlmann,
2011). The method is easy to use and requires no more investments than doing
an NPS survey right, knowing your customer base, and requires some rather
simple vector calculations involving linear algebra.
Transfer functions for verbatim analysis method is well suited to NPS surveys
but can be easily adapted to any free-text analysis, including support cases and
customer feedback received through social media and chat forums.
6 Appendix: A Sample NPS Survey
The following section exemplifies the NPS approach described in this research
paper in a practical context.
6.1 Sample NPS Profile
We assume a travel company collected feedback using an NPS survey for their
helpdesk service helping in case of service disruption or cancellations.
Table 1: Sample NPS Profile According Customer Segments
NPS Profile
NPS-1 Young Traveller 20% 2.8
NPS-2 Business Traveller 17% 2.3
NPS-3 Holiday Traveller 20% 2.8
NPS-4 Elderly Leisure 14% 2.0
The NPS profile in Table 1 is calculated by normalization.
NPS scores are not continuous satisfaction ratio scales. The eleven selectable
scores between 0 and 10 collapse into three groups: promoters, passives, and
detractors. Only promoters and detractors are explicitly included in the
calculation. When both young and holiday travellers score with 20%, a signifi-
cant difference in the number of passives still might exist. Only passives
moved into promoter or detractor status affect the overall score.
6.2 Sample Verbatim Analysis
We use five business drivers for performing verbatim analysis, see Table 2.
The business drivers reflect the customer’s viewpoint.
Table 2: Suspected Business Drivers for Verbatim Analysis in the Sample Case
Topics Attributes
BD-1 Responsiveness No waiting loops – immediate response
BD-2 Compelling Can commit for connections and reimbursement
BD-3 Friendliness Keeps cool under stress – calm down
BD-4 Personal Knows frequent travellers from login or mobile
BD-5 Competence Able to solve traveller’s problem
Analysing the customer verbatims now allows counting how many times each
of the five suspected business drivers has been referenced in one of the
responses. It can be explicit or by some predefined keyword that refers to it,
e.g. “know me”, “preferred”, “my preference” for BD-4: “Personal”. The
reference can be positive or negative. Counting all positive references means
assessing how important the topic is for the sample. Positive and negative
references are indicative for satisfaction with the respective business driver.
The passives must be taken into account for the frequency analysis. Since
passives cannot affect the overall NPS, the verbatims for their group must be
weakened accordingly for the frequency count. This is called the Attenuation
Factor.
Obviously, NPS surveys do not measure customer satisfaction but something
else: the willingness to let the suppliers business grow by recommending it.
6.3 Sample VoC Analysis
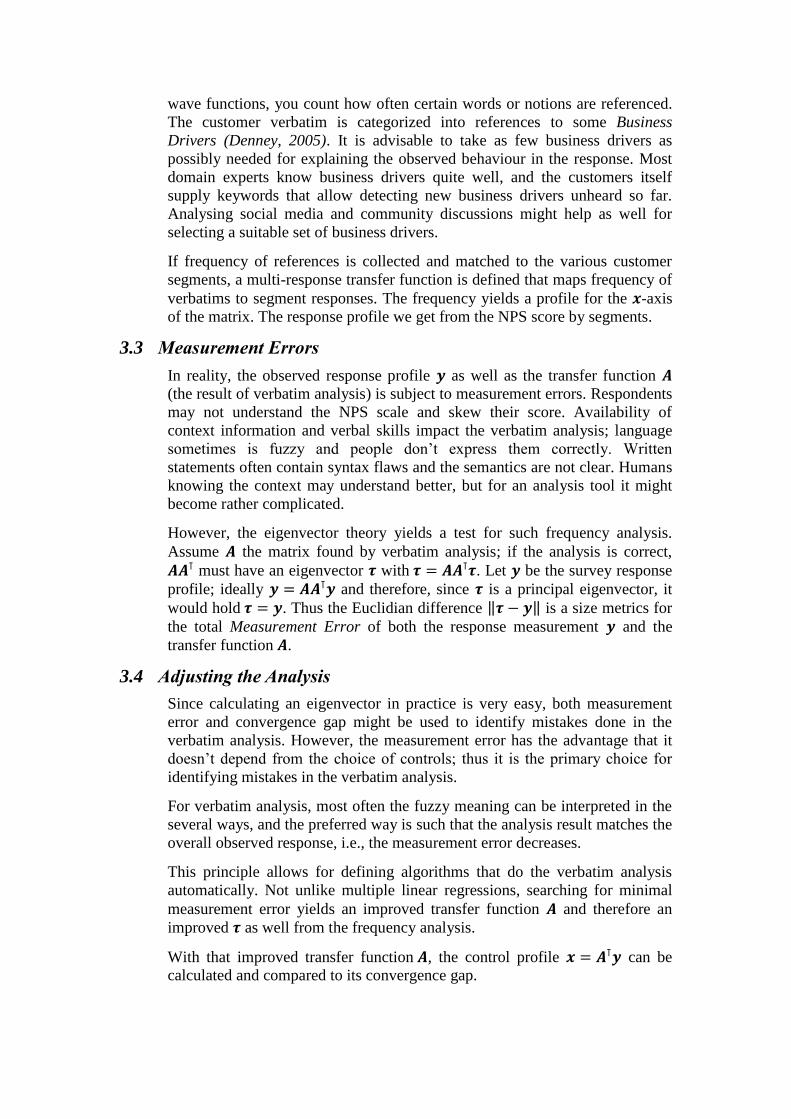
Conducting frequency counts results in two transfer functions: one explains
the observed NPS score from the importance (Figure 2), the other takes
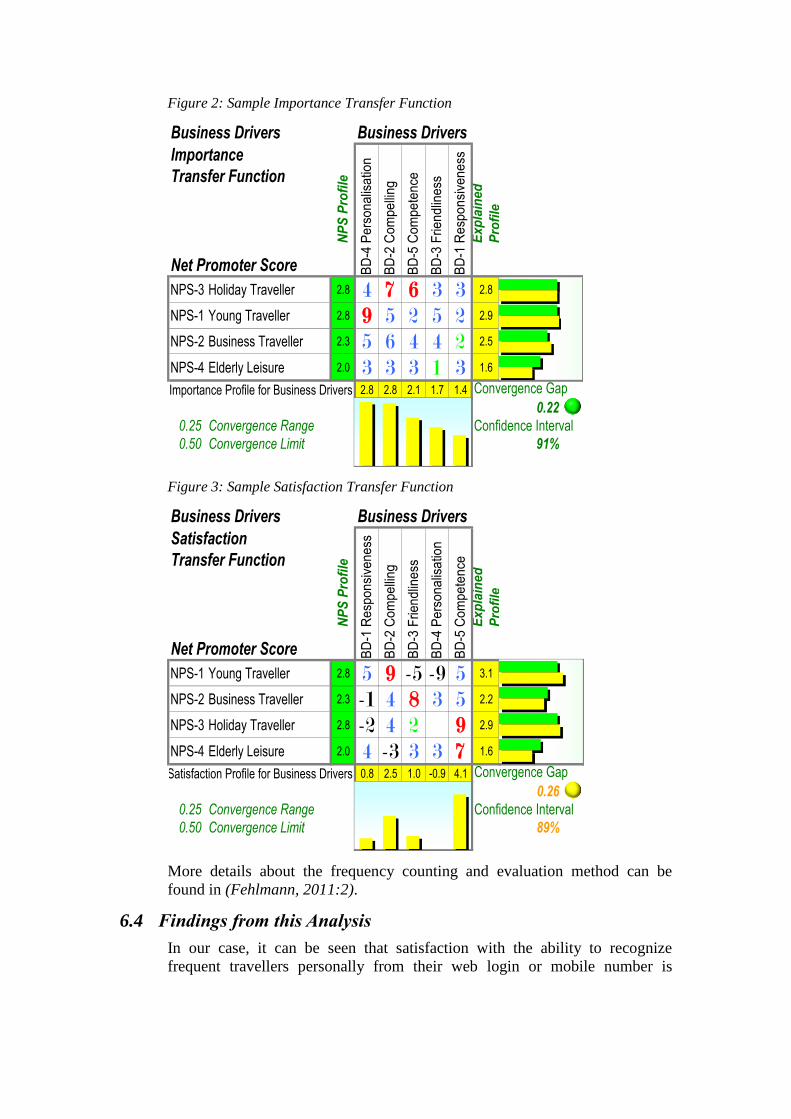
satisfaction into account and thus might even become negative, see Figure 3.
Not both transfer functions are always capable of explaining the observed
score. Usually, importance is better explained than satisfaction if the overall
NPS is positive; negative NPS cannot be explained by a positive definite
transfer function, and eigenvectors exist only as long as the –matrix
remains positive. Thus, with satisfaction below a certain level, this VoC–
Analysis might be inappropriate for the purpose.
Figure 2: Sample Importance Transfer Function
Business Drivers
NP
S P
rofi
le
Pe
rson
alis
atio
n
Com
pe
lling
Com
pe
ten
ce
Frien
dlin
ess
Resp
on
sive
ne
ss
Ex
pla
ine
d
Pro
file
BD
-4
BD
-2
BD
-5
BD
-3
BD
-1
NPS-3 Holiday Traveller 2.8 4 7 6 3 3 2.8
NPS-1 Young Traveller 2.8 9 5 2 5 2 2.9
NPS-2 Business Traveller 2.3 5 6 4 4 2 2.5
NPS-4 Elderly Leisure 2.0 3 3 3 1 3 1.6
Importance Profile for Business Drivers 2.8 2.8 2.1 1.7 1.4 Convergence Gap
0.22
0.25 Convergence Range Confidence Interval
0.50 Convergence Limit 91%
Business Drivers
Importance
Transfer Function
Net Promoter Score
Figure 3: Sample Satisfaction Transfer Function
Business Drivers
NP
S P
rofi
le
Resp
on
sive
ne
ss
Com
pe
lling
Frien
dlin
ess
Pe
rson
alis
atio
n
Com
pe
ten
ce
Ex
pla
ine
d
Pro
file
BD
-1
BD
-2
BD
-3
BD
-4
BD
-5
NPS-1 Young Traveller 2.8 5 9 -5 -9 5 3.1
NPS-2 Business Traveller 2.3 -1 4 8 3 5 2.2
NPS-3 Holiday Traveller 2.8 -2 4 2 9 2.9
NPS-4 Elderly Leisure 2.0 4 -3 3 3 7 1.6
Satisfaction Profile for Business Drivers 0.8 2.5 1.0 -0.9 4.1 Convergence Gap
0.26
0.25 Convergence Range Confidence Interval
0.50 Convergence Limit 89%
Business Drivers
Satisfaction
Transfer Function
Net Promoter Score
More details about the frequency counting and evaluation method can be
found in (Fehlmann, 2011:2).
6.4 Findings from this Analysis
In our case, it can be seen that satisfaction with the ability to recognize
frequent travellers personally from their web login or mobile number is
unsatisfactory but quite important for the sample respondents. This yields
clear advice where to invest into service improvement next.
Satisfaction explains the observed NPS less good than importance – it could
hint at the willingness of respondents that the sample travel company is able to
improve, and better meet the business drivers deemed important.
References
Akao, Y. (1995), Quality Function Deployment: Integrating Customer Requirements into Product
Design. Productivity Press, University Park, IL.
Creveling, C.M., Slutsky, J.L., Antis, D. (2003), Design for Six Sigma, Prentice Hall, Princeton, NJ.
Denney, R. (2005), Succeeding with Use Cases – Working Smart to Deliver Quality. Booch–Jacobson–
Rumbaugh – Series, Addison-Wesley, New York, NY.
Fehlmann, Th. (2005), The Impact of Linear Algebra on QFD, in: International Journal of Quality &
Reliability Mgmt, Vol. 21 No. 9, pp. 83-96, Emerald Group Publishing Ltd., Bradford, UK.
Fehlmann, Th. (2011), Agile Software Projects with Six Sigma. In: 3rd
European Research Conference
on Continuous Improvement and Lean Six Sigma, Glasgow, UK.
Fehlmann, Th. (2011), Understanding Business Drivers for Software Products from Marketing. In:
Proceedings of the MetriKon 2011, Kaiserslautern, Germany.
Fehlmann, Th., Kranich, E. (2011), Transfer Functions, Eigenvectors and QFD in Concert. In:
17th
International QFD Symposium, ISQFD 2011, Stuttgart, Germany.
Gigerenzer, G. (2007), Gut Feelings. The Intelligence of the Unconscious. Viking, New York.
George, M. ed. (2010), The Lean Six Sigma Guide to Doing More with Less, John Wiley & Sons,
Hoboken, NJ.
Girod, B., Rabenstein, R., Stenger, A. (2001), Signals and Systems, 2nd
edition, Wiley.
Hu, M. and Antony, J. (2007), Enhancing Design Decision-Making through Development of Proper
Transfer Function in Design for Six Sigma Framework. In: International Journal of Six Sigma
and Competitive Advantage 3, 2007, pp. 33-55.
Imai, M. (1997), Gemba Kaizen: A Commonsense, Low-Cost Approach to Management, McGraw-
Hill, New York, NY.
Kressner, D. (2005), Numerical Methods for General and Structured Eigenvalue Problems, Springer,
Lecture Notes in Computational Science and Engineering, Vol. 46, Berlin, Germany
Lang, S. (1973), Linear Algebra. Springer-Verlag New York Inc., New York, NY, USA. (3rd
edition).
Mazur, J., Bylund, N. (2009), Globalizing Gemba Visits for Multinationals. In: Transactions from the
21st Symposium on Quality Function Deployment, Savannah, GA.
Owen, R., Brooks, L. L. (2009), Answering the Ultimate Question – How Net Promoter Can Transform
Your Business, Jossey-Bass, San Francisco, CA 94103, USA.
Reichheld, F. (2007), The Ultimate Question: Driving Good Profits and True Growth. Harvard
Business School Press, Boston, MA.
Roman, S. (2007), Advanced Linear Algebra. Springer Verlag. New York, NY 10013, USA.
(3rd
edition).
Schneider, D., Berent, M., Thomas, R., Krosnick, J. (2008), Measuring Customer Satisfaction and
Loyalty: Improving the ‘Net-Promoter’ Score, Poster presented at the Annual Meeting of the
American Association for Public Opinion Research, New Orleans, Louisiana.
Yang, K. and El-Haik, B. S. (2009). Design for Six Sigma. Mc Graw-Hill. New York, NY, USA.