15
Using Student Surveys: Implications for State and District Policy May 1, 2014 @AYPF_Tweets #aypfevents
| Date post: | 27-Dec-2015 |
| Category: |
Documents |
| Upload: | roger-walton |
| View: | 215 times |
| Download: | 1 times |
Using Student Surveys: Implications for State and
District Policy May 1, 2014
@AYPF_Tweets#aypfevents
© C
CS
R
The CCSR 5 Essentials Survey Helping Schools Organize
for Improvement
Elaine AllensworthThe University of Chicago Consortium on
Chicago School Research

© C
CS
R
Chicago 5 Essentials Surveys
Demonstrate that student and teacher reports have an empirical relationship to school improvement
Provide an evidence
about how policies and initiatives affect students’ and teachers experiences in schools
Give actionable information that schools can use to prioritize initiatives and drive improvement

© C
CS
R
Chicago 5 Essentials SurveysAdministered to teachers in all grades and students in grades 6-12
- Response rates of about 80% in 2013- Yearly administration since 2011, biennial from1997
Framework developed in 1994
- Developed jointly by researchers, teachers, principals, members of reform organizations
- Grounded in research and school practice

© C
CS
R
Each Essential Represents Multiple Measures5 Essentials Measures
Course ClarityMath PedagogyEnglish PedagogyStudent Discussion Classroom BehaviorChallenge
Questions
I learn a lot from feedback on my work.
It's clear to me what I need to do to get a good grade.
The work we do in class is good preparation for the test.
The homework assignments help me to learn the course material.
I know what my teacher wants me to learn in this class.
Course Clarity

© C
CS
R
Diagnostic tool for school improvement- Individual school reports provided confidentially to school
leaders since 1997- In 2008, CPS adopted the “Five Fundamentals” for school
improvement planning, based on survey tool- In 2009, reports became publicly-available- In 2013, survey results included in school accountability
Research tool- Allows researchers to understand how policies worked –
effects on instruction, learning climate, support for student learning
- Provides insight into key processes in schools – what matters most
Surveys used for both research and school practice

© C
CS
R
Initial study 1990-1996 Replicated from 1997-2005 Measurement of each component
refined over time- Identify key construct from theory or
practice- Develop measures – refine with each
survey administration- Use in research – discover how it
matters for schools or student outcomes
- Refine theory- Track progress in schools
Surveys validated and refined through two decades of research
© C
CS
R
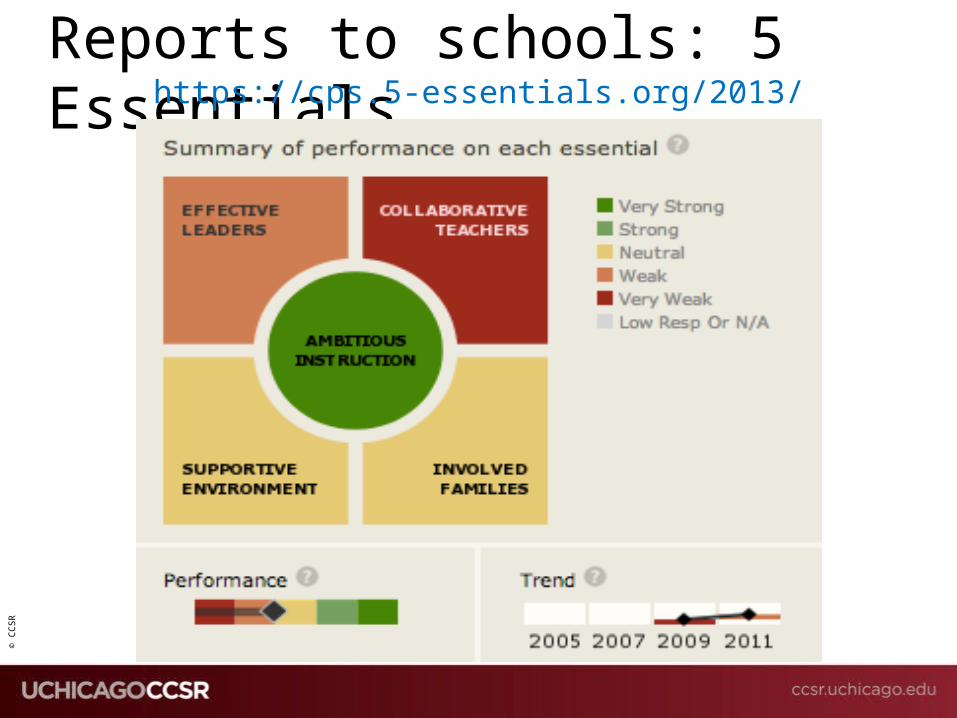
Reports to schools: 5 Essentialshttps://cps.5-essentials.org/2013/

© C
CS
R
Reports to schools: Effective leaders example

© C
CS
R
Reports to schools: Program coherence example

© C
CS
R
Now given in multiple cities by Uchicago Impact Adopted by State of Illinois in 2012-13 school year
- Mandated by law- Five Essentials Day- High participation in first year- Stakeholder meetings in first year – not enough at
local level- Pushback once results were given to schools- Need for validation across settings, adapting to
different contexts
Expansion of 5 Essentials Surveys

© C
CS
R
Issues in design, implementation Trade-offs from survey length, report length
Trade-offs from making results public vs confidential
Framework - useful or confusing
Comparisons to other schools – context with challenges
Content stability vs adaptability over time and across places

© C
CS
R
Chicago 5 Essentials Surveys

Denver Public SchoolsLEAP: Leading Effective Academic Practice
American Youth Policy Forum: 5/1/2014
14
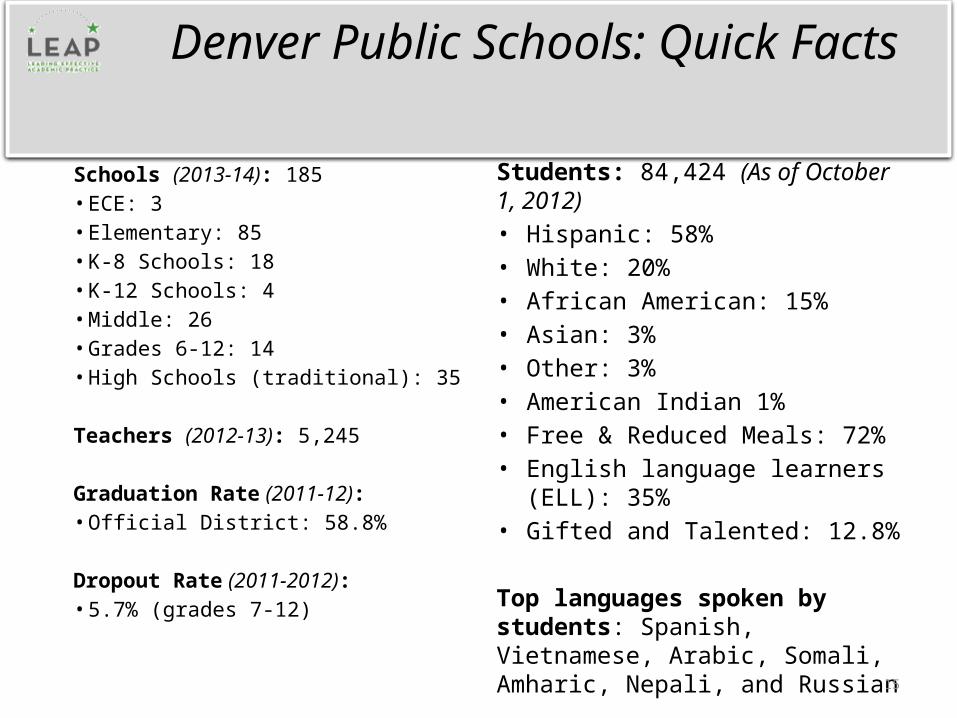
Denver Public Schools: Quick Facts
Schools (2013-14): 185 • ECE: 3• Elementary: 85• K-8 Schools: 18• K-12 Schools: 4• Middle: 26• Grades 6-12: 14• High Schools (traditional): 35 Teachers (2012-13): 5,245
Graduation Rate (2011-12): • Official District: 58.8%
Dropout Rate (2011-2012): • 5.7% (grades 7-12)
Students: 84,424 (As of October 1, 2012)• Hispanic: 58%• White: 20%• African American: 15%• Asian: 3%• Other: 3%• American Indian 1%• Free & Reduced Meals: 72%• English language learners (ELL): 35%• Gifted and Talented: 12.8%
Top languages spoken by students: Spanish, Vietnamese, Arabic, Somali, Amharic, Nepali, and Russian
15


