41
Using Technical Indicators with Dow Jones EURO STOXX 50 ® Index Futures August 2009

Using Technical Indicators with Dow Jones EURO STOXX 50®
Index Futures
August 2009

Eurex – The International Derivatives Exchange
2
Risk Statement● This presentation is for information purposes only and does not
constitute investment advice nor an offer, solicitation or recommendation to acquire or dispose of any investment or to engage in any other transaction. This presentation is not intended for solicitation purposes but only for use as general information. All descriptions, examples and calculations contained in this publication are for illustrative purposes only.

Eurex – The International Derivatives Exchange
3
Agenda
Chart Analysis & Trading Strategies
• Moving Averages
• Candlestick Formations
• Continuations and Reversals
Conclusions and Outlook
Brief Introduction to Eurex
Overview of Charting Techniques
Eurex – The International Derivatives Exchange
4
About Eurex
●Eurex is one of the world's leading derivatives exchanges and is jointly operated by Deutsche Börse AG and SIX Swiss Exchange.
●On December 20, 2007, Eurex completed the acquisition of International Securities Exchange, Inc. (ISE).
●With market participants connected from 700 locations worldwide, trading volume at Eurex exceeds 1,5 billion contracts a year.

Eurex – The International Derivatives Exchange
Tradable Eurex Products from the U.S.
5
Please find the current products available for trade in the U.S. and the current trading hours on our website: www.eurexchange.com:
Trading > Products > Trading in the U.S.
Trading > Trading Calendar > Trading Hours
Equity Index DerivativesBenchmark Equity Index Futures
DAX® Index, MDAX® Index, TecDAX® Index, Dow Jones EURO STOXX 50® Index, Dow Jones STOXX 50® Index, SLI Swiss Leader Index® and RDxxt® USD - RDX Extended Index Futures
Sector Index Futures
Dow Jones STOXX® Large 200 Index, Dow Jones STOXX® Mid 200 Index, Dow Jones STOXX® Small 200 Index, Dow Jones EURO STOXX® Banks Index, Dow Jones STOXX® 600 Banks Index, Dow Jones STOXX® 600 Industrial Goods & Services Index, Dow Jones STOXX® 600 Insurance Index, Dow Jones STOXX® 600 Media Index, Dow Jones STOXX® 600 Personal & Household Goods Index, Dow Jones STOXX® 600 Travel & Leisure Index, Dow Jones STOXX® 600 Utilities Index, Dow Jones EURO STOXX® Select Dividend 30 Index, Dow Jones STOXX® 600 Index, Dow Jones Global Titans 50 SM Index, SMIM® Index
Money Market Derivatives
Money Market FuturesOne-Month EONIA Futures (FEO1)Three-Month EURIBOR Futures (FEU3)
Options on Money Market FuturesOptions on Three-Month EURIBOR Futures (OEU3)
Fixed Income Derivatives
Fixed Income FuturesEuro-Schatz, Euro-Bobl, Euro-Bund and Euro-Buxl® FuturesCONF Futures (CONF)
Options on Fixed Income FuturesOptions on Euro-Schatz, Euro-Bobl and Euro-Bund Futures
Commodity Derivatives
CO2 DerivativesEUA Futures (F2PE)CER Futures (FCER)Options on EUA Futures (O2PE)
Gold DerivativesGold Futures (FGFX)Gold Options (OGFX)
Inflation DerivativesEuro-Inflation Futures (HICP)

Eurex – The International Derivatives Exchange
6
Why Trade on Eurex?
● Trade during different time zones
● Diversify
● Markets that provide similar profit risk/reward scenarios

Eurex – The International Derivatives Exchange
7
Eurex Trading Hours
FDAX FESX Futures (12:50 AM - 3:00 PM CST)
Xetra Cash Market (2:00 AM CST - 10:30 AM CST)
00:00 02:00 04:00 06:00 08:00 10:00 12:00 14:00 15:00
● Eurex Trading beings at 1:00 AM CST and stays into continuous trading until 3:00 PM CST.
● Xetra, the cash market for the underlying index, is open from 2:00 AM CST until 10:30 AM CST.
●Xetra is currently not available to US customers for trading.
Eurex – The International Derivatives Exchange
8
Agenda
Overview of Charting Techniques
Chart Analysis & Trading Strategies
• Moving Averages
• Candlestick Formations
• Continuations and Reversals
Conclusions and Outlook
Brief Introduction to Eurex

Eurex – The International Derivatives Exchange
9
Overview
• Today’s webinar focuses on technical indicators and related trading strategies in Dow Jones EURO STOXX 50® Futures
We will discuss:
• Technical indicators, their purpose, and how they work
• And how we can set up trades in Dow Jones EURO STOXX 50® Index Futures at Eurex based on signals generated by technical indicators

Eurex – The International Derivatives Exchange
10
Why Use Technical Indicators?
• Information Edge: Identify trends and understand the market by utilizing available information
• Knowledge Edge:Know your market!What drives your market? What are the common behavior patterns?
• Trading Edge:Set up trades to capitalize on signals generated by technical indicatorsUnderstand what others are doingImprove your trading by setting trading targets and stop limits under technical considerations

Eurex – The International Derivatives Exchange
11
Types of Technical Indicators
Indicators
• Trend lines & Common Chart Formations
• Moving Averages
• MACD (Moving Average Convergence Divergence)
• Candle Stick Charts
• Other Indicators
Continuations and ReversalsVolume & Open Interest

Eurex – The International Derivatives Exchange
12
• Institutional Investors – Real Money While real money is also focused on fundamental analysis, pricing trends are observed with technical tools, especially in light of entry and exit points in trading
• Proprietary TradersThe greatest user group of technical indicators are proprietary traders seeking fullest utilization of available market information:
- Bank Proprietary Desks- Proprietary Trading Groups- Active Traders/Day Traders
Who Trades with Technical Indicators?
Eurex – The International Derivatives Exchange
13
Agenda
Chart Analysis & Trading Strategies• Moving Averages
• Candlestick Formations
• Continuations and Reversals
Conclusions and Outlook
Overview of Charting Techniques
Brief Introduction to Eurex

Eurex – The International Derivatives Exchange
14
Price & Volume
• Strong drops tends to go hand in hand with high trading volume
• While price and volume information is easiest to obtain, it is the first of numerous sources of trading related information to be discovered
Eurex – The International Derivatives Exchange
15
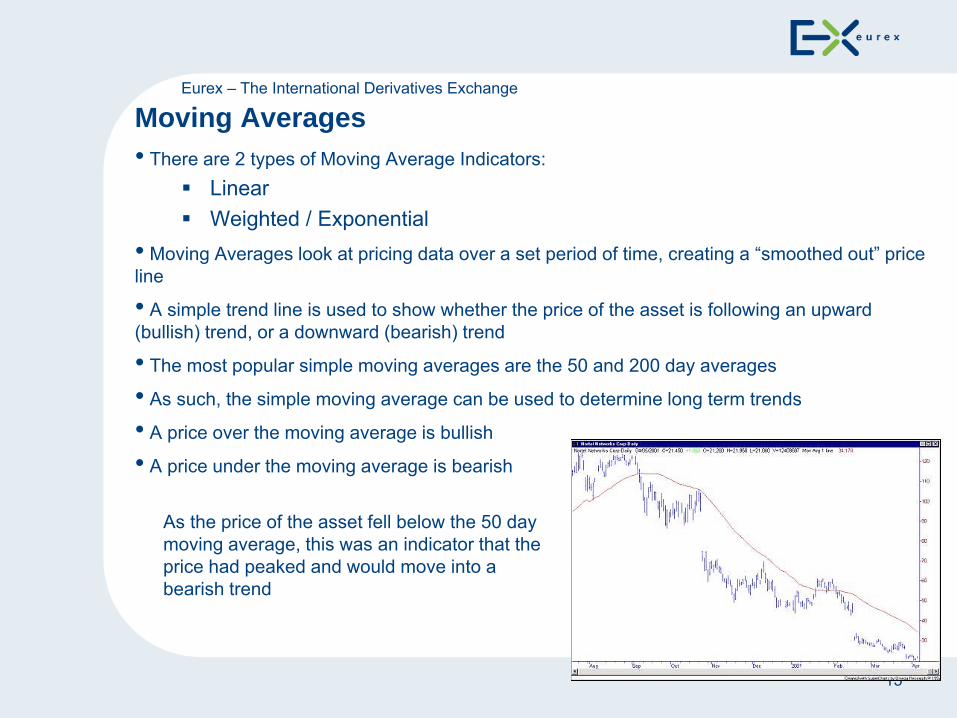
Moving Averages• There are 2 types of Moving Average Indicators:
LinearWeighted / Exponential
• Moving Averages look at pricing data over a set period of time, creating a “smoothed out” price line
• A simple trend line is used to show whether the price of the asset is following an upward (bullish) trend, or a downward (bearish) trend
• The most popular simple moving averages are the 50 and 200 day averages
• As such, the simple moving average can be used to determine long term trends
• A price over the moving average is bullish
• A price under the moving average is bearish
As the price of the asset fell below the 50 day moving average, this was an indicator that the price had peaked and would move into a bearish trend

Eurex – The International Derivatives Exchange
16
Weighted / Exponential M/A• A weakness of the simple moving average is that, in real life, prices from a long time ago affect the current price less than recent developments
• Analysts use a formula that gives more weight to more recent price movements
• One popular example is the ‘Linearly Weighted Moving Average’:For example, 10 day Moving average: if we take the day before the current day as day 10, and we use the prices back to day 1 to calculate the Moving Average, we can weight the Moving Average with the calculation:
- 10th Day x 10, 9th Day x 9… 1st Day x 1And then divide this by 10+9+8…+1 = 55 (In this case)
• The actual weighting can be defined by the trader, and many variations are used

Eurex – The International Derivatives Exchange
17
Weighted Moving Averages – The Trade
On February 27th, 2008, the 10 day weighted moving average crosses the 20 day, generating a sell signal
Our investor shorts the Dow Jones EURO STOXX 50® Futures with a 5 day perspective

Eurex – The International Derivatives Exchange
18
MACD (Moving Average Convergence Divergence)
• The MACD relies on the relationship between short-term and long-term moving averages
• Usually when a short-term moving average crosses a long-term moving average, this is a trade signal
•
• As the momentum grows in a trend, the moving averages move apart
• The MACD was created to exploit this divergence by analysing the difference between the two exponential moving averages
• Specifically, the short term average is subtracted from the long term average and plotted onto a graph

Eurex – The International Derivatives Exchange
19
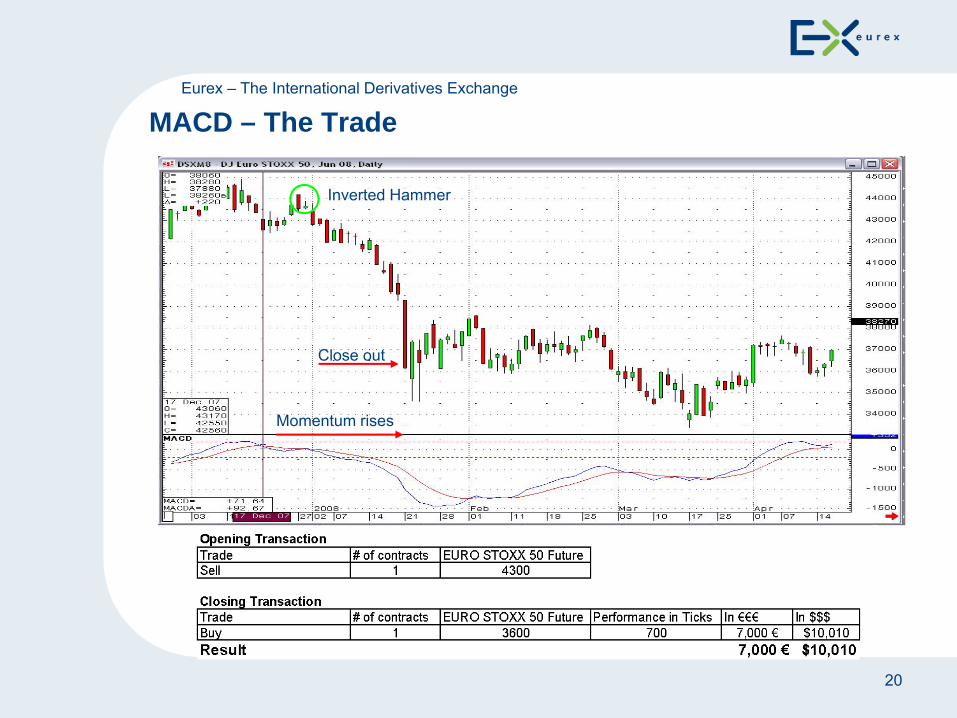
MACD Continued• A positive MACD, shows that the short term average price is higher than the long term average price. It is used to signal increasing upward momentum, and vice versa
• Commonly, the MACD is plotted separately with a 9 period moving average drawn with it as a ‘trigger line’
• Transaction signals are created when the MACD crosses the trigger line (dotted line)
The signal is often considered more risky if it is the wrong side of 0 (in the negative for a bull crossover and in the positive for a bear crossover)
The MACD crossing 0 is also a strong signal. As a result, a center line is often drawn.
Eurex – The International Derivatives Exchange
20
MACD – The Trade
Close out
Inverted Hammer
Momentum rises

Eurex – The International Derivatives Exchange
21
Drawbacks of MACD
• Traders can be whipsawed in and out of trades
• Because it is a lagging indicator, a buy signal may be created too late, after the trader has missed out on the real action, after the profit potential has already been realised and the price has turned.
• The MACD is also unable to compare different securities
• This can be remedied using percentage price oscillators

Eurex – The International Derivatives Exchange
22
Agenda
Chart Analysis & Trading Strategies
• Candlestick Formations
• Continuations and Reversals
Conclusions and Outlook
Overview of Charting Techniques
• Moving Averages
Brief Introduction to Eurex

Eurex – The International Derivatives Exchange
23
Candlestick Techniques• All candlestick techniques are built on market sentiment
• The theory is that you can deduce what is going on in the market from the patterns that the candles form
Information regarding the sentiment and mood of the market can be read from these candles
For example:
If the shadows (wick) are very short and the body black, we know it has been an unusually bad day, opening at the high and closing at the low
The opposite also holds…
Eurex – The International Derivatives Exchange
24
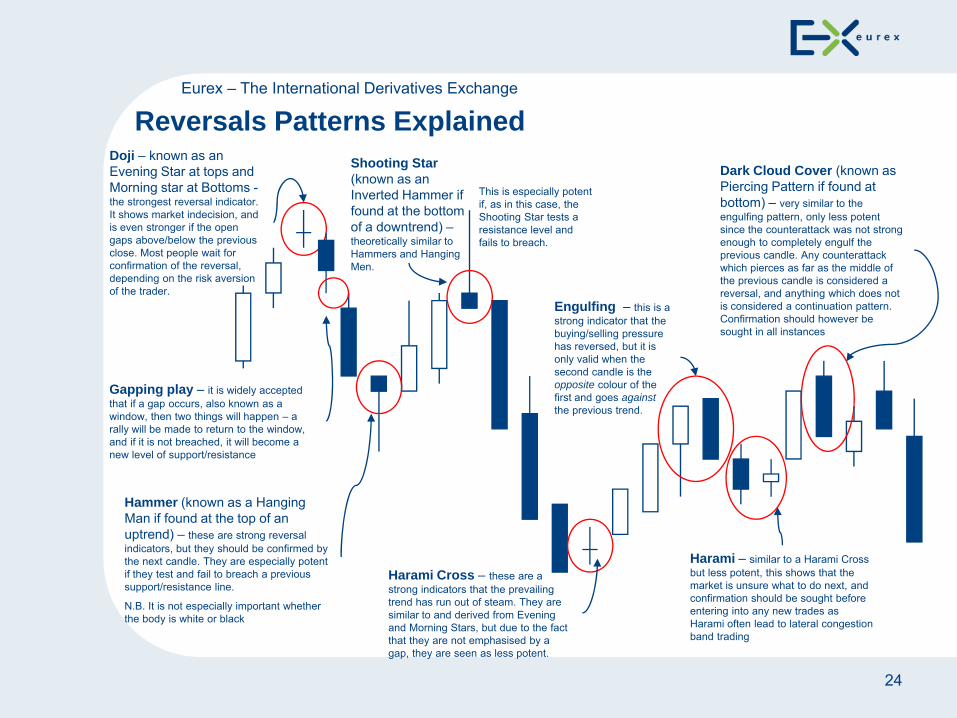
Reversals Patterns ExplainedDoji – known as an Evening Star at tops and Morning star at Bottoms -the strongest reversal indicator. It shows market indecision, and is even stronger if the open gaps above/below the previous close. Most people wait for confirmation of the reversal, depending on the risk aversion of the trader.
Gapping play – it is widely accepted that if a gap occurs, also known as a window, then two things will happen – a rally will be made to return to the window, and if it is not breached, it will become a new level of support/resistance
Hammer (known as a Hanging Man if found at the top of an uptrend) – these are strong reversal indicators, but they should be confirmed by the next candle. They are especially potent if they test and fail to breach a previous support/resistance line.
N.B. It is not especially important whether the body is white or black
Shooting Star(known as an Inverted Hammer if found at the bottom of a downtrend) –theoretically similar to Hammers and Hanging Men.
Harami Cross – these are a strong indicators that the prevailing trend has run out of steam. They are similar to and derived from Evening and Morning Stars, but due to the fact that they are not emphasised by a gap, they are seen as less potent.
Engulfing – this is a strong indicator that the buying/selling pressure has reversed, but it is only valid when the second candle is the opposite colour of the first and goes againstthe previous trend.
Harami – similar to a Harami Cross but less potent, this shows that the market is unsure what to do next, and confirmation should be sought before entering into any new trades as Harami often lead to lateral congestion band trading
Dark Cloud Cover (known as Piercing Pattern if found at bottom) – very similar to the engulfing pattern, only less potent since the counterattack was not strong enough to completely engulf the previous candle. Any counterattack which pierces as far as the middle of the previous candle is considered a reversal, and anything which does not is considered a continuation pattern. Confirmation should however be sought in all instances
This is especially potent if, as in this case, the Shooting Star tests a resistance level and fails to breach.

Eurex – The International Derivatives Exchange
25
Candlestick Reversal Patterns – The Doji Trade

Eurex – The International Derivatives Exchange
26
Candlestick Reversal Patterns – Hammer Trade
Hammer # 1
Hammer # 2
Close out

Eurex – The International Derivatives Exchange
27
Agenda
Chart Analysis & Trading Strategies
• Continuations and Reversals
Conclusions and Outlook
Overview of Charting Techniques
• Moving Averages
• Candlestick Formations
Brief Introduction to Eurex

Eurex – The International Derivatives Exchange
28
Reversals - Head and Shoulders• A head and shoulders pattern, as the names suggests, is formed by a new high/low (left shoulder) followed by a higher/lower high/low (the head) and a return to the previous high/low (right shoulder)• The price action must break through the neckline in order for the reversal pattern to be complete• After breaking out the price may well move back to and test the neckline. If this line is tested and holds, as we see in the diagram, then the pattern is very much confirmed
• Volume is very important in this pattern• The Right shoulder should be formed on significantly lower volume than the head and left shoulder,• but we should see a spike in volume once the neckline is broken

Eurex – The International Derivatives Exchange
29
Head and Shoulders Trade
Eurex – The International Derivatives Exchange
30
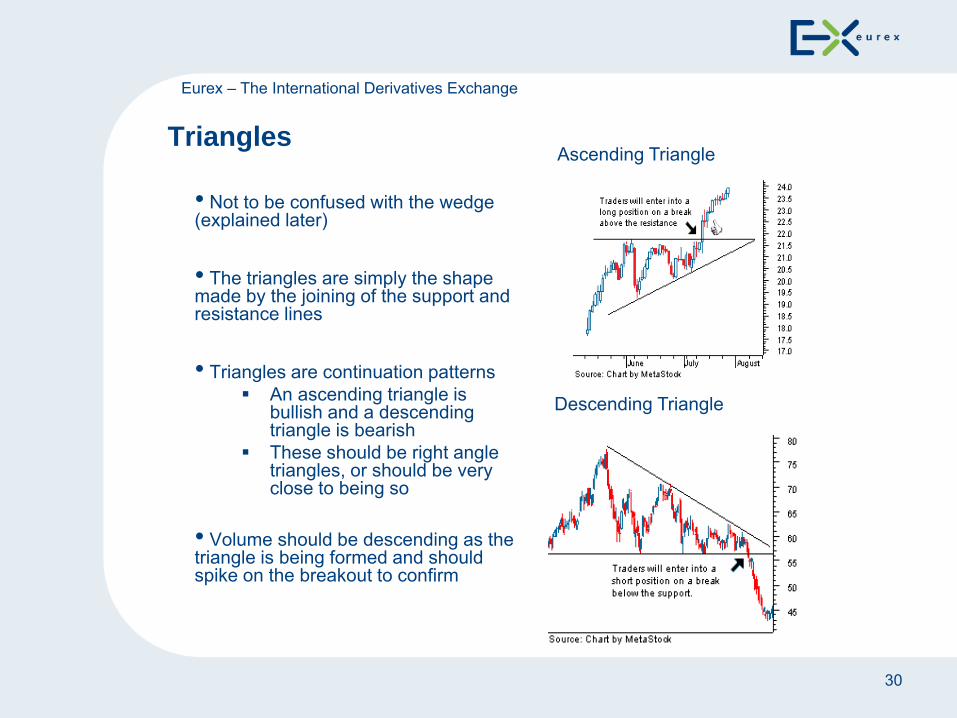
Triangles
• Not to be confused with the wedge (explained later)
• The triangles are simply the shape made by the joining of the support and resistance lines
• Triangles are continuation patterns An ascending triangle is bullish and a descending triangle is bearish These should be right angle triangles, or should be very close to being so
• Volume should be descending as the triangle is being formed and should spike on the breakout to confirm
Ascending Triangle
Descending Triangle

Eurex – The International Derivatives Exchange
31
The Triangle Trade
Exit trade
Opening trade

Eurex – The International Derivatives Exchange
32
Wedges• Wedges are patterns which reverse the direction of the trend which forms them• The shape is similar to the triangle, but in the case of the wedge the trendlines are moving in the same trend direction, but towards each other.• There are two types of wedge – rising and falling• Wedges usually take quite a long time to form – usually between 3 and 6 months.• As always, breakouts should be on high volume, but since this pattern can be long-term in forming, multiple closes outside the break serve as confirmation as well
The rising wedge is bearish
As the price moves towards the apex of the pattern, momentum of the buyers is clearly weakening, while that of the sellers remains strong
The falling wedge is bullish
Support line is less steep than the resistance line, i.e. selling pressure is waning, as sellers are having trouble pushing the price down further
Eurex – The International Derivatives Exchange
33
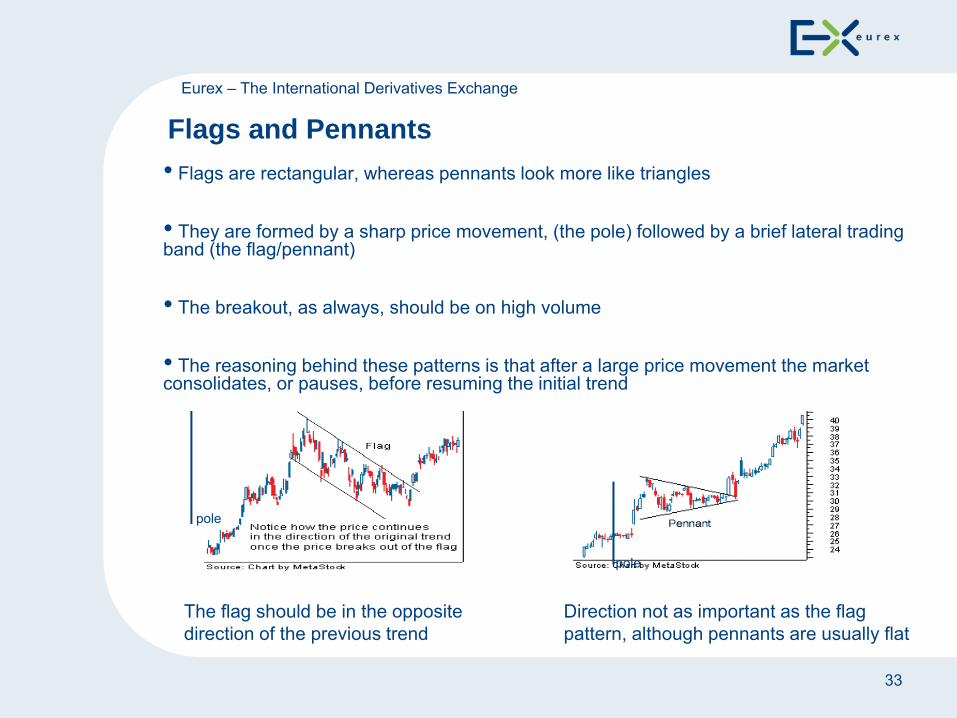
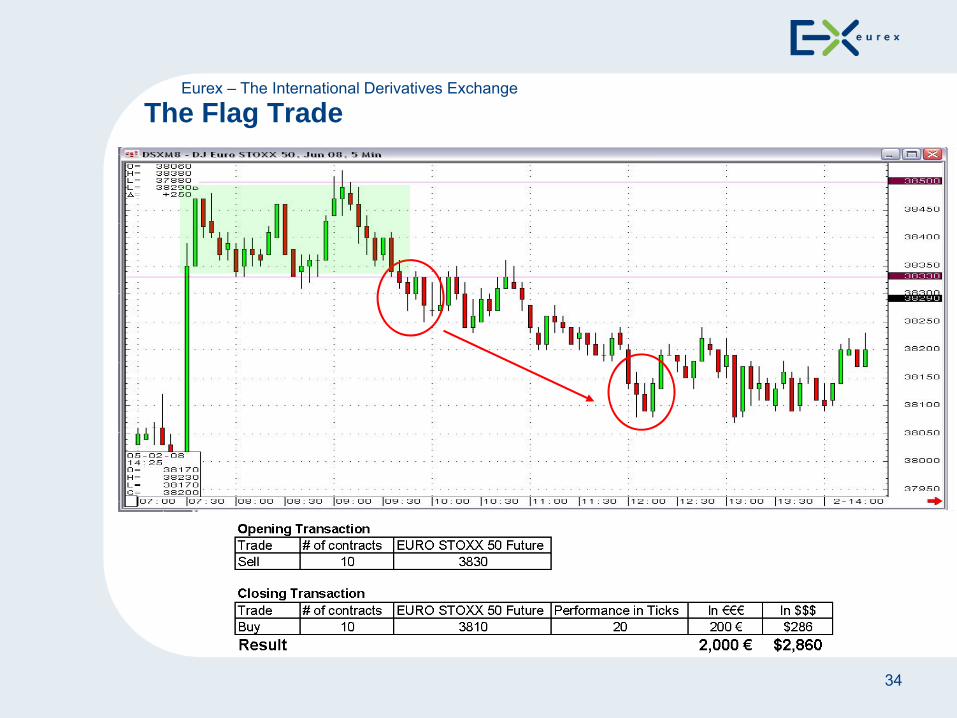
Flags and Pennants• Flags are rectangular, whereas pennants look more like triangles
• They are formed by a sharp price movement, (the pole) followed by a brief lateral trading band (the flag/pennant)
• The breakout, as always, should be on high volume
• The reasoning behind these patterns is that after a large price movement the market consolidates, or pauses, before resuming the initial trend
The flag should be in the opposite direction of the previous trend
Direction not as important as the flag pattern, although pennants are usually flat
pole
pole
Eurex – The International Derivatives Exchange
34
The Flag Trade

Eurex – The International Derivatives Exchange
35
The Pennant Trade

Eurex – The International Derivatives Exchange
36
Agenda
Chart Analysis & Trading Strategies
• Moving Averages
• Candlestick Formations
• Continuations and Reversals
Conclusions and Outlook
Overview of Charting Techniques
Brief Introduction to Eurex

Eurex – The International Derivatives Exchange
37
Overview & Conclusions
• An educated analysis of past data is NOT a guarantee for future development
• But can offer trading opportunities, and insight into subsequent trading patterns after signals are observed
Technical Indicator Description Merits Shortfalls
Moving Averages Simple Moving Average Price trends are visualized
Older prices are equally weighted, but do not affect current prices as strongly as more recent prices do
Weighted / Exponential MAs
Weighting of prices improves indicator reliability
Traders may enter positions too late, after all the action is over
Moving Average Convergence Divergence
Weighting of prices, an additional consideration of momentum of moving averages being observed
Traders may enter positions too late, after all the action is over
Candlestick Formations Technique designed to visualize market sentiment
high lows and daily direction can be easily read
A pattern is not a "guarantee" for a specific price movement, but more a signal, that a trend could be in trouble
Continuations and Reversals Continuations and Reversals
Can be used to observe trends and call a top or a bottom
Reversal indicators do not necessarily imply that the trend will switch, rather that the previous trend is in trouble, and it is quite possible that the market will enter into a lateral trading band. This should be confirmed by volume developments, and in relation to your own risk aversion, and by price moves confirming trends, or reversals

Eurex – The International Derivatives Exchange
38
European Market Outlook e-Newsletter
● Free weekly e-newsletter
● Produced by CRB (division of Barchart)
● Covers week ahead in European MarketsWhat’s driving marketsEconomic calendar
● Sign up under www.eurexchange.comStep 1 – Go to the ‘Education’ tabStep 2 – Click on ‘Investor Newsletter’ on the left panelStep 3 – Enter your e-mail address and confirmIf you sign up after Monday’s e-newsletter is sent out, you will receive first newsletter NEXT week!

Eurex – The International Derivatives Exchange
39
European Market Outlook e-Newsletter

Eurex – The International Derivatives Exchange
40
Contact Info
Stephanie Hammer
www.eurexchange.com
Thank you.

Eurex – The International Derivatives Exchange
41
Disclaimer© Eurex 2008Deutsche Börse AG (DBAG), Clearstream Banking AG (Clearstream), Eurex Bonds GmbH (Eurex Bonds), Eurex Repo GmbH (Eurex Repo), Eurex Clearing AG (EurexClearing) and Eurex Frankfurt AG are corporate entities and are registered under German law. Eurex Zürich AG is a corporate entity and is registered under Swiss law.Clearstream Banking S.A. (Clearstream) is a corporate entity and is registered under Luxembourg law. Eurex Frankfurt AG (Eurex) is the administrating and operatinginstitution of Eurex Deutschland. Eurex Deutschland and Eurex Zürich AG are in the following referred to as the “Eurex Exchanges”.All intellectual property, proprietary and other rights and interests in this publication and the subject matter hereof (other than certain trademarks and service markslisted below) are owned by DBAG and its affiliates and subsidiaries including, without limitation, all patent, registered design, copyright, trademark and service markrights. While reasonable care has been taken in the preparation of this publication to provide details that are accurate and not misleading at the time of publicationDBAG, Eurex, Eurex Bonds, Eurex Repo, the Eurex Exchanges, Eurex Clearing and Clearstream and their respective servants and agents (a) do not make anyrepresentations or warranties regarding the information contained herein, whether express or implied, including without limitation any implied warranty of merchantabilityor fitness for a particular purpose or any warranty with respect to the accuracy, correctness, quality, completeness or timeliness of such information, and (b) shall not beresponsible or liable for any third party’s use of any information contained herein under any circumstances, including, without limitation, in connection with actual tradingor otherwise or for any errors or omissions contained in this publication.This publication is published for information purposes only and shall not constitute investment advice respectively does not constitute an offer, solicitation orrecommendation to acquire or dispose of any investment or to engage in any other transaction. This publication is not intended for solicitation purposes but only for useas general information. All descriptions, examples and calculations contained in this publication are for illustrative purposes only.Eurex offers services directly to members of the Eurex exchanges. Those who desire to trade any products available on the Eurex market or who desire to offer and sellany such products to others, should consider legal and regulatory requirements of those jurisdictions relevant to them, as well as the risks associated with suchproducts, before doing so.Eurex derivatives (other than Dow Jones EURO STOXX 50® Index Futures contracts, Dow Jones STOXX 50® Index Futures contracts, Dow Jones STOXX® 600 IndexFutures contracts, Dow Jones STOXX® Mid 200 Index Futures contracts, Dow Jones EURO STOXX® Banks Sector Futures contracts, Dow Jones STOXX® 600 BanksSector Futures contracts, Dow Jones Global Titans 50SM Index Futures contracts, DAX® Futures contracts, MDAX® Futures contracts, and Eurex interest ratederivatives) are currently not available for offer, sale or trading in the United States or by United States persons.Trademarks and Service MarksBuxl®, DAX®, Eurex®, Eurex Bonds®, Eurex Repo®, Euro GC Pooling®, Eurex Strategy WizardSM, FDAX®, iNAV®, MDAX®, ODAX®, SDAX®, StatistiX®, TecDAX®, VDAX-NEW®, Xetra® and XTF Exchange Traded Funds® are registered trademarks of DBAG.Xemac® is a registered trademark of Clearstream Banking AG. Vestima® is a registered trademark of Clearstream International S.A.RDXxt® is a registered trademark of Wiener Börse AG (Vienna Stock Exchange).iTraxx® is a registered trademark of International Index Company Limited (IIC) and has been licensed for the use by Eurex. IIC does not approve, endorse orrecommend Eurex or iTraxx® Europe 5-year Index Futures, iTraxx® Europe HiVol 5-year Index Futures and iTraxx® Europe Crossover 5-year Index Futures. Eurex issolely responsible for the creation of the Eurex iTraxx® Credit Futures contracts, their trading and market surveillance. ISDA® neither sponsors nor endorses theproduct’s use. ISDA® is a registered trademark of the International Swaps and Derivatives Association, Inc.SMI®, SLI®, SMIM® and VSMI® are registered trademarks of SWX Swiss Exchange.STOXX®, Dow Jones STOXX® 600 Index, Dow Jones STOXX® Large 200 Index, Dow Jones STOXX® Mid 200 Index, Dow Jones STOXX® Small 200 Index, Dow JonesSTOXX® TMI Index, VSTOXX® Index, Dow Jones EURO STOXX® Select Dividend 30 Index, Dow Jones EURO STOXX®/STOXX® 600 Sector Indexes as well as theDow Jones EURO STOXX 50® Index and Dow Jones STOXX 50® Index are service marks of STOXX Ltd. and/or Dow Jones & Company, Inc.Dow Jones and Dow Jones Global Titans 50SM Index are service marks of Dow Jones & Company, Inc. The derivatives based on these indexes are not sponsored,endorsed, sold or promoted by STOXX Ltd. or Dow Jones & Company, Inc., and neither party makes any representation regarding the advisability of trading or ofinvesting in such products.The names of other companies and third party products may be trademarks or service marks of their respective owners.


