31
Madeline Stanley Geoffrey Gunn August 2018 © 2018 International Institute for Sustainable Development | IISD.org/ela Using Technology to Solve Today’s Water Challenges IISD-ELA REPORT
Madeline StanleyGeoffrey Gunn
August 2018
© 2018 International Institute for Sustainable Development | IISD.org/ela
Using Technology to Solve Today’s Water Challenges
IISD-ELA REPORT
IISD.org/ela ii
Using Technology to Solve Today’s Water Challenges
© 2018 International Institute for Sustainable Development Published by the International Institute for Sustainable Development
International Institute for Sustainable DevelopmentThe International Institute for Sustainable Development (IISD) is an independent think tank championing sustainable solutions to 21st–century problems. Our mission is to promote human development and environmental sustainability. We do this through research, analysis and knowledge products that support sound policymaking. Our big-picture view allows us to address the root causes of some of the greatest challenges facing our planet today: ecological destruction, social exclusion, unfair laws and economic rules, a changing climate. IISD’s staff of over 120 people, plus over 50 associates and 100 consultants, come from across the globe and from many disciplines. Our work affects lives in nearly 100 countries. Part scientist, part strategist—IISD delivers the knowledge to act.
IISD is registered as a charitable organization in Canada and has 501(c)(3) status in the United States. IISD receives core operating support from the Province of Manitoba and project funding from numerous governments inside and outside Canada, United Nations agencies, foundations, the private sector and individuals.
About IISD-ELAIISD Experimental Lakes Area (IISD-ELA) is the world’s freshwater laboratory. A series of 58 lakes and their watersheds in northwestern Ontario, Canada, IISD-ELA is a unique scientific site where researchers can experiment directly on freshwater lakes to discover the impacts of human activity and pollutants. Since 1968, IISD-ELA has helped us reveal everything from the impact of phosphorus on algal blooms, to the effects of mercury on freshwater systems, to how acid rain affects lakes. The site works with local and global researchers and with local communities, First Nations, schools and universities. It is funded by the governments of Canada, Ontario and Manitoba, and by many other generous partners and donors.
Using Technology to Solve Today’s Water Challenges
August 2018
Written by Madeline Stanley and Geoffrey Gunn
Acknowledgements
This work is supported by the RBC Foundation, who is working with partners like us to explore new and exciting technologies to solve the world’s pressing environmental challenges.
Thanks to Hannes Dekeyser from Copernicus EU, Marina Barnes from Farmers Edge, Chelsea Lobson Lake Winnipeg Foundation, Carolyn DuBois the Gordon Foundation, Lindsay Day the Gordon Foundation, Juhani Kettunen, and Jennifer Temmer from IISD.
Head Office
111 Lombard Avenue, Suite 325Winnipeg, ManitobaCanada R3B 0T4
Tel: +1 (204) 958-7700Website: www.iisd.orgTwitter: @IISD_news
IISD-ELA
111 Lombard Avenue, Suite 325Winnipeg, ManitobaCanada R3B 0T4
Tel: +1 (204) 958-7700Website: www.iisd.org/elaTwitter: @IISD_ELA
IISD.org/ela iii
Using Technology to Solve Today’s Water Challenges
Table of Contents
1.0 Introduction ............................................................................................................................................................................................1
2.0 The Jefferson Project, Lake George .......................................................................................................................................... 3
3.0 Copernicus, The European Union Earth Observation Programme ............................................................................. 6
4.0 Citizen Science Platforms ............................................................................................................................................................. 9
5.0 Farmers Edge ......................................................................................................................................................................................16
6.0 Smart Cities ........................................................................................................................................................................................ 19
7.0 Conclusions ..........................................................................................................................................................................................23
Reference List ............................................................................................................................................................................................25
Acronyms and Abbreviations4Vs volume, variety, velocity and veracity
AI artificial intelligence
DOHMH Department of Health and Mental Hygiene
ECCC Environment and Climate Change Canada
ESA European Space Agency
EU European Union
Fintech financial technology
GPS Global Positioning System
HAB harmful algal bloom
ICT information communication technology
IoT Internet of things
LWF Lake Winnipeg Foundation
RPI Rennselaer Polytechnic Institute
SYKE Finnish Environmental Institute
USGS United States Geological Survey
IISD.org/ela 1
Using Technology to Solve Today’s Water Challenges
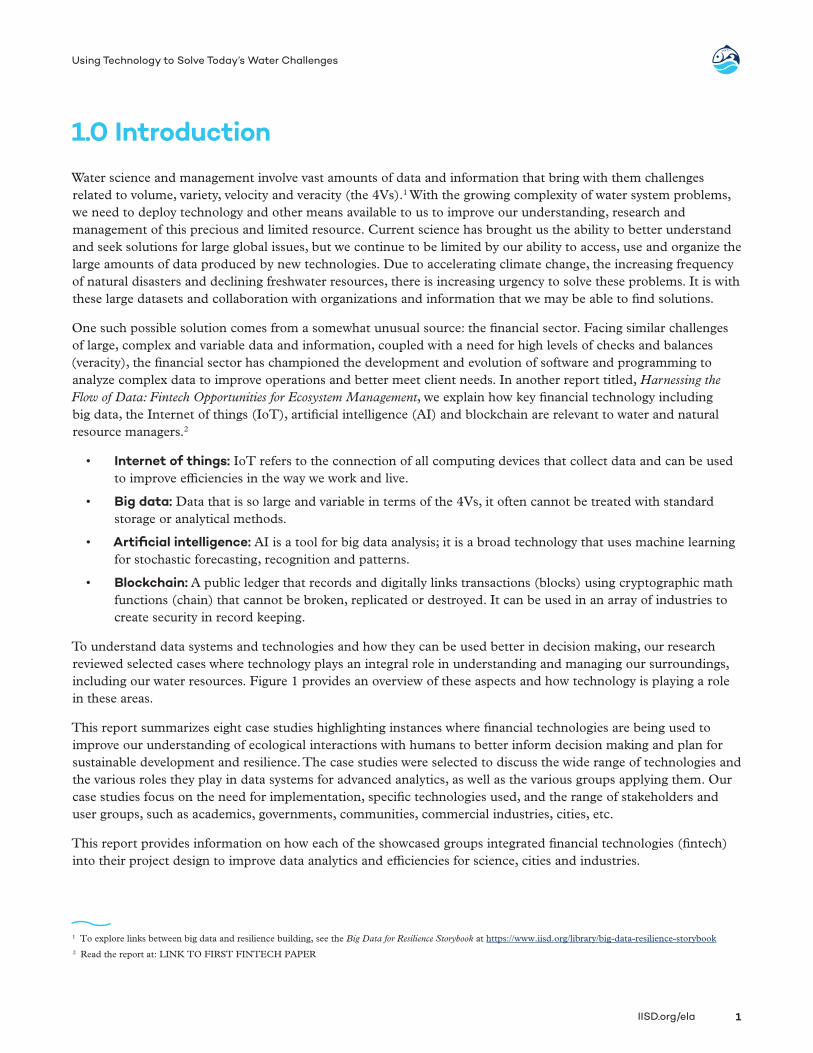
1.0 Introduction
Water science and management involve vast amounts of data and information that bring with them challenges related to volume, variety, velocity and veracity (the 4Vs).1 With the growing complexity of water system problems, we need to deploy technology and other means available to us to improve our understanding, research and management of this precious and limited resource. Current science has brought us the ability to better understand and seek solutions for large global issues, but we continue to be limited by our ability to access, use and organize the large amounts of data produced by new technologies. Due to accelerating climate change, the increasing frequency of natural disasters and declining freshwater resources, there is increasing urgency to solve these problems. It is with these large datasets and collaboration with organizations and information that we may be able to find solutions.
One such possible solution comes from a somewhat unusual source: the financial sector. Facing similar challenges of large, complex and variable data and information, coupled with a need for high levels of checks and balances (veracity), the financial sector has championed the development and evolution of software and programming to analyze complex data to improve operations and better meet client needs. In another report titled, Harnessing the Flow of Data: Fintech Opportunities for Ecosystem Management, we explain how key financial technology including big data, the Internet of things (IoT), artificial intelligence (AI) and blockchain are relevant to water and natural resource managers.2
• Internet of things: IoT refers to the connection of all computing devices that collect data and can be used to improve efficiencies in the way we work and live.
• Big data: Data that is so large and variable in terms of the 4Vs, it often cannot be treated with standard storage or analytical methods.
• Artificial intelligence: AI is a tool for big data analysis; it is a broad technology that uses machine learning for stochastic forecasting, recognition and patterns.
• Blockchain: A public ledger that records and digitally links transactions (blocks) using cryptographic math functions (chain) that cannot be broken, replicated or destroyed. It can be used in an array of industries to create security in record keeping.
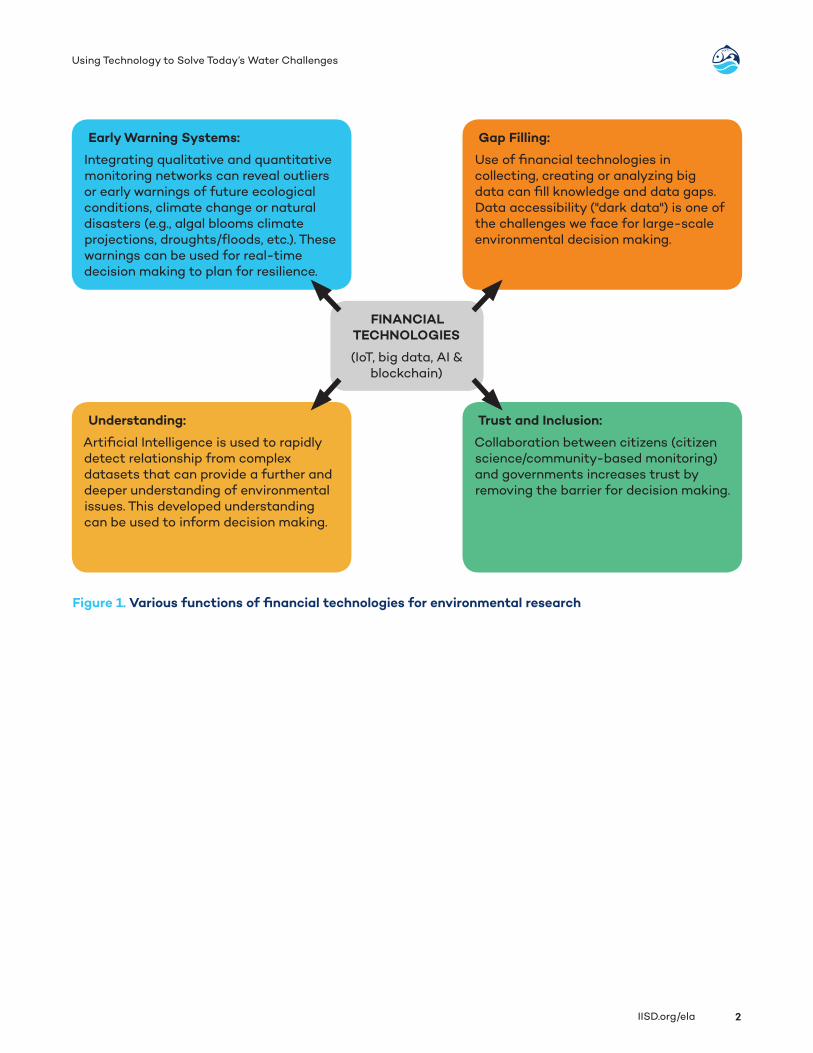
To understand data systems and technologies and how they can be used better in decision making, our research reviewed selected cases where technology plays an integral role in understanding and managing our surroundings, including our water resources. Figure 1 provides an overview of these aspects and how technology is playing a role in these areas.
This report summarizes eight case studies highlighting instances where financial technologies are being used to improve our understanding of ecological interactions with humans to better inform decision making and plan for sustainable development and resilience. The case studies were selected to discuss the wide range of technologies and the various roles they play in data systems for advanced analytics, as well as the various groups applying them. Our case studies focus on the need for implementation, specific technologies used, and the range of stakeholders and user groups, such as academics, governments, communities, commercial industries, cities, etc.
This report provides information on how each of the showcased groups integrated financial technologies (fintech) into their project design to improve data analytics and efficiencies for science, cities and industries.
1 To explore links between big data and resilience building, see the Big Data for Resilience Storybook at https://www.iisd.org/library/big-data-resilience-storybook2 Read the report at: LINK TO FIRST FINTECH PAPER
IISD.org/ela 2
Using Technology to Solve Today’s Water Challenges
Figure 1. Various functions of financial technologies for environmental research
Early Warning Systems:
Integrating qualitative and quantitative monitoring networks can reveal outliers or early warnings of future ecological conditions, climate change or natural disasters (e.g., algal blooms climate projections, droughts/floods, etc.). These warnings can be used for real-time decision making to plan for resilience.
Understanding:
Artificial Intelligence is used to rapidly detect relationship from complex datasets that can provide a further and deeper understanding of environmental issues. This developed understanding can be used to inform decision making.
Gap Filling:
Use of financial technologies in collecting, creating or analyzing big data can fill knowledge and data gaps. Data accessibility ("dark data") is one of the challenges we face for large-scale environmental decision making.
Trust and Inclusion:
Collaboration between citizens (citizen science/community-based monitoring) and governments increases trust by removing the barrier for decision making.
FINANCIAL TECHNOLOGIES
(IoT, big data, AI & blockchain)
Using Technology to Solve Today’s Water Challenges
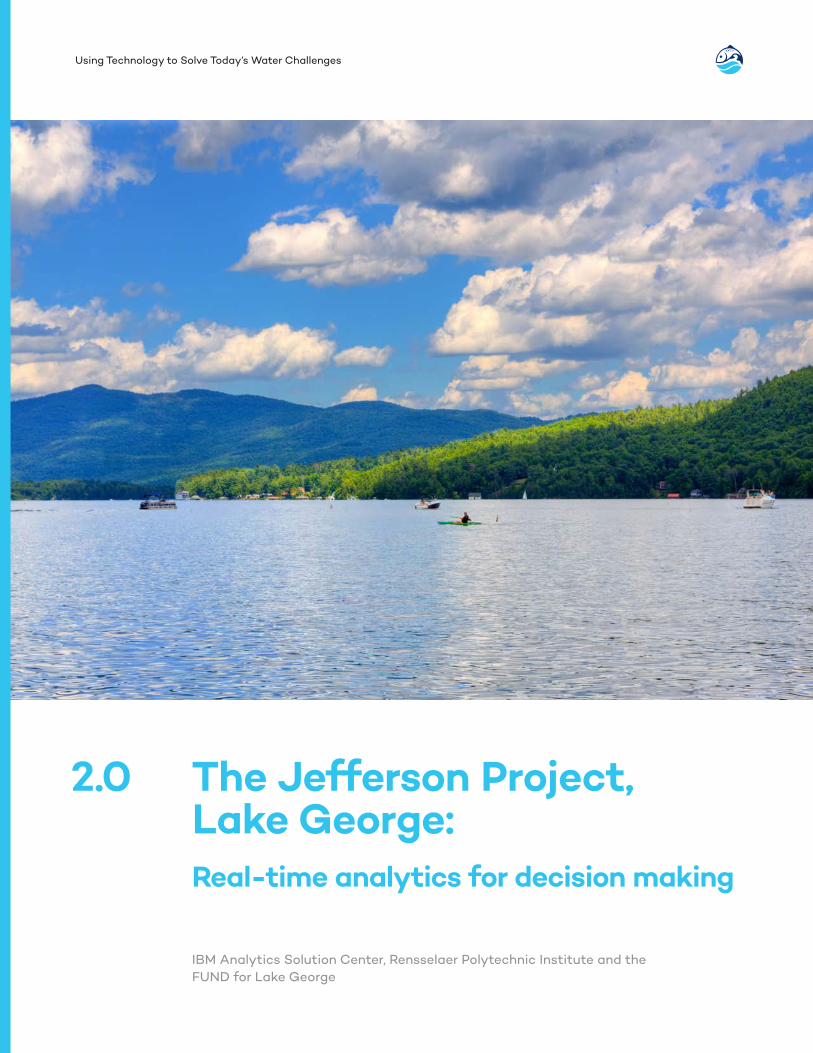
2.0 The Jefferson Project, Lake George: Real-time analytics for decision making
IBM Analytics Solution Center, Rensselaer Polytechnic Institute and the FUND for Lake George

IISD.org/ela 4
Using Technology to Solve Today’s Water Challenges
Background and IssuesThe freshwater basins we rely on for recreation and drinking water are complex systems influenced by actions and impacts of people, plants, animals and economies in their water catchment. Many groups around the world seek to develop policies and actions to improve water quality and to empower sustainability planning, but often data is insufficient, and there are limited resources to conduct in-depth analyses.
Lake George is a freshwater ecosystem located in New York State, United States, that has a 577 km2 watershed. Approximately 50 per cent is designated as protected land and 8.2 per cent is developed or disturbed, influencing the non-point source runoff downstream (Lake George Association, 2016).
Researchers from Rensselaer Polytechnic Institute (RPI) and the FUND for Lake George have spent over 30 years studying the effects of road salt, stormwater nutrient runoff and invasive species on aquatic health. Their results indicate that chloride concentrations have tripled due to road salt loads, algae have increased by 33 per cent and invasive species are becoming increasingly dominant (RPI, 2018). Water quality in Lake George is essential for recreation and drinking water. It is rated as Class AA-Special3 by the state, but it is also impaired by human activities (Lake George Association, n.d.). The RPI’s Jefferson Project aims to create a global model to study lake ecosystem function for improved management and protection. It is not only for the preservation of Lake George, considered the Queen of American Lakes, but for lakes around the world. Beyond its use for Lake George, the goal is to showcase how this lake network model can improve understanding and preservation of water quality globally as water resources are declining rapidly (RPI, 2013).
Technology and ManagementThe Jefferson Project was initiated amid concern over the health and future of Lake George. The project, a partnership between RPI, the FUND for Lake George and IBM Analytics Solution Center, aims to improve our understanding of the human impact on fresh water and develop mitigation strategies for the future of water security. The project, launched in 2013, was designed to create a high-resolution, real-time image of the lake through the addition of an IoT network to an existing environmental monitoring system. The goal is to understand, preserve and predict the future of the lake using data-based science and to gain knowledge to inform policy and decision making (RPI, 2018). Currently, there are over 42 sensor platforms deployed in the watershed and five models under development for weather, runoff, salt, circulation and food webs. The sensors monitor for vertical profiling of water quality (Figure 2), weather conditions, lake currents and temperature, as well as tributary flows and conditions. The operation systems use IoT nodes in the sensor network platform to collect and transmit data in real time back to the visualization computing facility that works to model and visualize the lake to track water quality and movement in real time. The design incorporates in-situ monitoring, laboratory experiments and computer modelling to prepare multidimensional visualization of the lake, tributaries and water quality. This process will improve understanding of the lake and watershed, inform decision making and future sampling, and plan for resilience strategies under climate change and human pressures (RPI, 2013, 2018).
Impacts and LessonsA key impact of the Jefferson Project is the ability to predict and to conduct analyses, such as looking at water quality trends over time. The real-time data accumulation paired with computer modelling allows researchers to project future scenarios and watershed responses that can be used for decision making (RPI, 2013).
3 Class AA Special indicates the best use classification by the New York Codes, Rules and Regulations (NYCRR), approved by the EPA. Class AA Special for Fresh Surface Waters are best used for drinking sources, recreation and fisheries, shall not be exposed to discharge, sewage or toxic wastes, and flows cannot be altered to impair conditions (U.S. Environmental Protection Agency, 2018 p. 1).
IISD.org/ela 5
Using Technology to Solve Today’s Water Challenges
The Jefferson Project provides us with lessons for similar water systems facing water quality and related challenges by providing a technology solution for the provision of good quality and quantity of real-time data to be able to understand specific problems, examine trends over time and even examine what management actions might be working from the quality response in the lake. The project is designed to create a model that can be applied to other global lake ecosystems in need of proper monitoring and management.
Researchers for the Jefferson Project want to make a model that can be applicable to lakes around the world, but what are the costs associated with implementing the IoT network, monitoring and visualization infrastructure, and does it make these systems exclusive for broad-scale adoption? As sensors and data visualization technologies and platforms are becoming less expensive and more approachable, will these types of lake systems and models be increasingly commercialized?
Using Technology to Solve Today’s Water Challenges
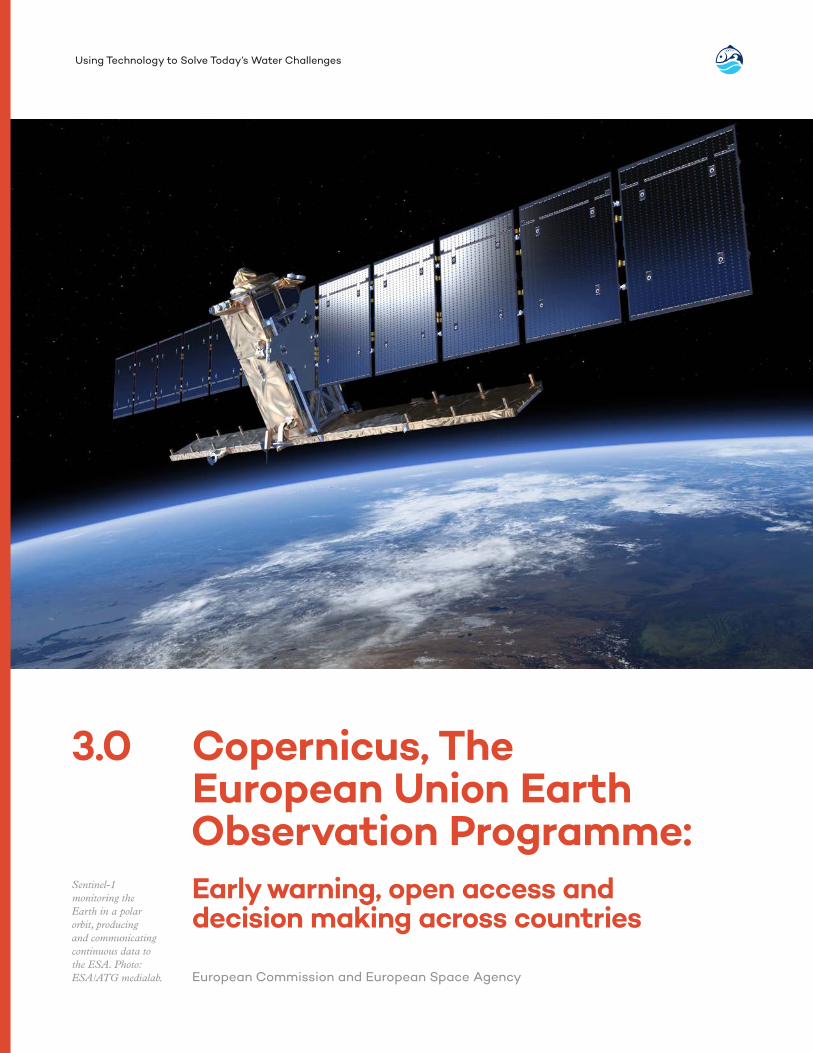
3.0 Copernicus, The European Union Earth Observation Programme: Early warning, open access and decision making across countries
European Commission and European Space Agency
Sentinel-1 monitoring the Earth in a polar orbit, producing and communicating continuous data to the ESA. Photo: ESA/ATG medialab.
IISD.org/ela 7
Using Technology to Solve Today’s Water Challenges
Background and IssuesSince 1972, a fleet of satellites managed by the United States Geological Survey (USGS) has been continuously monitoring the Earth’s surface for changes in land, vegetation and water. These Landsat platforms have since accumulated a 42-year record of images, the earliest of which were stored and distributed on tape drives or hardcopy maps to researchers. For the first few decades they provided imagery to scientists and resource managers at a much lower cost than air photos; however, considerable resources and expertise were needed to acquire, process and analyze the data into information and insight, limiting its value and strength (Wulder et al., 2008).
In 2008, the USGS changed its policy to enable free electronic retrieval of the complete Landsat archive, allowing scientists and planners to dive deeper into understanding changes over time and across space. This policy of free and open retrieval has been adopted by many other public satellite sensor operators, creating a space for both big and open data available for local and global analysis of events ranging from sudden disasters like forest fires to gradual changes in ecosystems due to climate change.
Copernicus, the European Earth Observation Programme, works to provide satellite imagery in real time to enable deep understanding about the Earth and inform decision making for free. Copernicus is implemented by the European Commission on behalf of the European Union (EU) member states, Norway and Iceland, and in partnership with space, meteorological and weather-related agencies. A goal of the program is to collect vast amounts of information from a satellite network and in-situ monitoring systems to create better forecasts and examine patterns and trends. It informs six targeted streams of knowledge—atmosphere, marine environment, land, climate change, emergency management and security—to help us understand the Earth, make decisions and prepare mitigation and resilience strategies (Copernicus EU, n.d.). Information provided by Copernicus is used in land use management, planning, forestry, fisheries management, health services, infrastructure planning, tourism and more.
Technology and ManagementThe Copernicus program uses satellite imagery to observe, collect and analyze Earth data in near real time. The network is made of six satellite families called Sentinels and other third-party satellites (contributing space missions). Each Sentinel is specifically tailored for various objectives and monitoring. Sentinel-1 monitors emergency response (e.g., volcanic activity or flooding); Sentinel-2 monitors land and vegetation; Sentinel-3 and Sentinel-6 are used to monitor and map the oceans and water; and Sentinel-4 and Sentinel-5 monitor the atmosphere. The six Sentinels collect data that is combined with in-situ, on-the-ground sensors and other third-party satellites to create big data that can be used to improve understanding of the Earth and climate change and help us make decisions (European Space Agency [ESA], 2016; Facchini, 2017).
The Copernicus program has created an IoT network, with satellites orbiting the Earth in real time that help us fill knowledge gaps and create early warning systems. It produces massive amounts of data annually (over 10 petabytes/year), making it the largest Earth observation data provider globally. This causes challenges with data management, communication and accessibility. The IoT network collects and stores Earth data, and the big data analytics generate statistical analyses, maps, indicators and trends of past, present and future conditions. Additionally, all products and generated information are accessible on a free public platform. The Copernicus program wants to encourage use of the data to harness the knowledge and strength of the massive dataset to
“The value of a data archive is not measured solely by the data it contains, but also by the ease with which the archive may be searched and data retrieved.”(Wulder et al., 2008)
IISD.org/ela 8
Using Technology to Solve Today’s Water Challenges
understand the Earth and its resources.
This information can be used to help target high-risk areas of global conflict, depleting natural resources and natural disaster events. The implementation of Copernicus into research platforms and decision-making processes has led to many successes, from improved air quality, to monitoring renewable solar energy, to reducing costs/financial loss (Copernicus EU, 2017). With the information produced through the Copernicus program, we can plan for resilience, prepare mitigation strategies, manage resources and plan for the future.
One example of a Copernicus initiative is the ASIMUTH project launched in 2009, which was designed to forecast harmful algal bloom (HAB) events on the European Atlantic coast. The project integrated chlorophyll imaging and water temperatures from the Copernicus Marine Environmental Service (ocean-monitoring Sentinels) and integrated them with in-situ biological data to create HAB warnings and forecasts.
Impacts and LessonsCopernicus successfully aided fish/shellfish farmers to detect HABs through ocean-monitoring satellites. HABs have a large impact on economic enterprises such as aquaculture and tourism/recreation. In the EU, approximately 1.25 million tonnes of fish are produced annually for aquaculture and approximately 8,000 tonnes of these fish die annually due to HABs, representing a loss of USD 36.2 million. Since implementation, HABs can be forecasted and predicted, which allows commercial fisheries managers to adjust their harvesting practices and develop mitigation strategies. Since the implementation of ASIMUTH, fish farmers have improved their harvesting schedules and installed aerators, improving productivity by 5 per cent. The ASIMUTH project has also implemented a forecasting system to reduce mussel industry losses from HABs by approximately 12.5 per cent in France, Spain, Ireland, Portugal and the United Kingdom, saving nearly USD 2.6 million. In addition to benefits to the aquaculture industry, HABs forecasting can also target areas of recreation, drinking water and tourism that have severe impacts on human health and public safety. Through forecasting efforts, decision-makers can detect where and when HABs will occur to develop proper mitigation and management strategies (European Commission, 2016a).
Copernicus has also been successful in developing irrigation management and cost savings in Lower Austria. Farmers in Marchfeld, Austria, were struggling to manage irrigation due to a precipitation shortage, causing intense irrigation practices that use 60 per cent of all fresh water in the region. Prior to the use of Copernicus data, the cost to irrigate the region of Marchfeld for one year ranged from USD 9 million to 23 million. Local farmers wanted to improve irrigation practices through enhancing irrigation distribution and requirements. Water efficiency was analyzed for Marchfeld crops with Copernicus Sentinel-2 and Landsat-8 imagery. Sentinel-2 imagery helped design more efficient irrigation practices through crop development maps, daily evapotranspiration maps and weather forecasts, and crop-specific irrigation strategies. In addition to aiding with improved precision of agricultural practices and reducing freshwater consumption, the open-access data and efficiency from Sentinel-2 enabled a cost reduction of 70 per cent for precision agriculture (European Commission, 2016b).
The critical lesson is the effort of Copernicus to produce, compile and manage massive amounts of big data from an IoT satellite sensor network and combine/validate it with other third-party satellites and in-situ monitors to prepare usable output using big data analytics for various themes to inform citizens and decision-makers about the Earth and large-scale global issues. As well, by making it freely available to all, Copernicus shows the value of shared data and its ability to inform decision making.
Using Technology to Solve Today’s Water Challenges
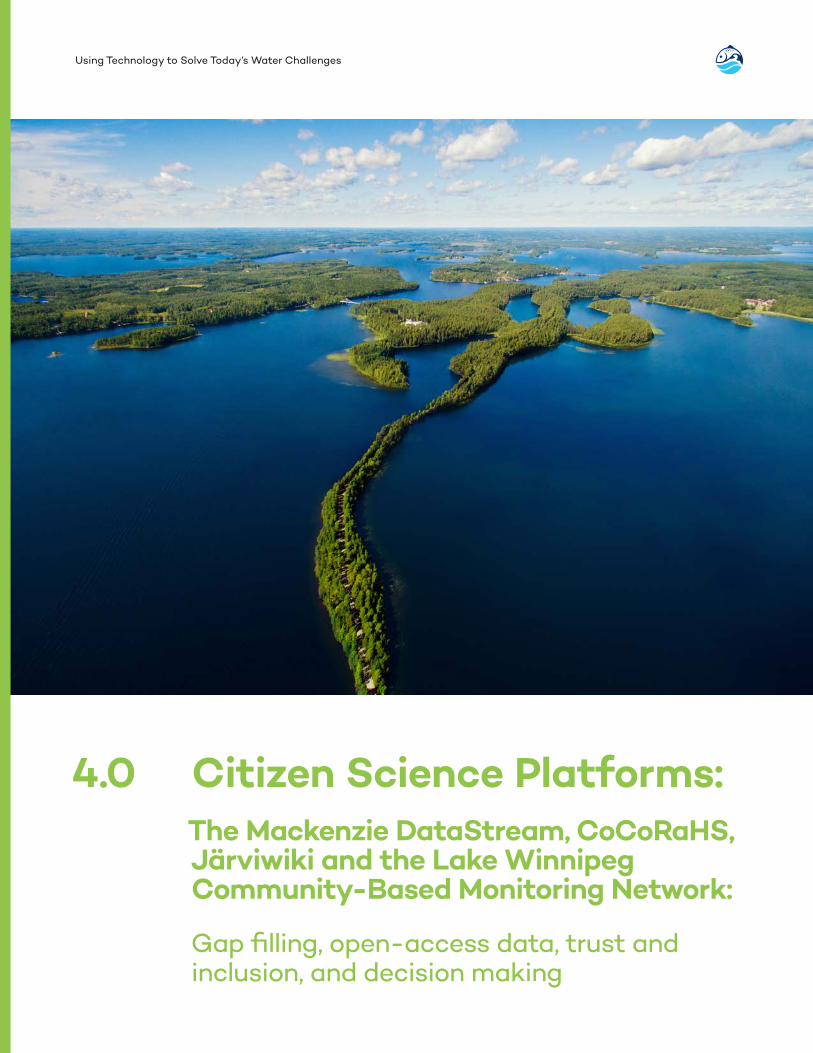
4.0 Citizen Science Platforms: The Mackenzie DataStream, CoCoRaHS, Järviwiki and the Lake Winnipeg Community-Based Monitoring Network:
Gap filling, open-access data, trust and inclusion, and decision making
IISD.org/ela 10
Using Technology to Solve Today’s Water Challenges
Understanding and managing complex and large-scale environmental issues such as climate change and water quality and quantity requires a lot of data that takes significant effort and time to collect and collate. Often, scientists, researchers and decision-makers have significant time, space and financial constraints that limit the amount of data that can be collected, ultimately limiting our understanding and our ability to make decisions.
An innovative approach to filling data gaps is through citizen science. Citizen science, also known as community-based monitoring, engages citizens and volunteers to collect data that is integrated into a large dataset. Not only do these networks generate data to fill gaps, they create public engagement opportunities that increase awareness and education for environmental issues as well as for the importance of monitoring, data and information. Additionally, the direct involvement of communities in data collection eliminates the barrier between citizens and decision-makers. While some community-based monitoring networks may not use financial technologies directly, the generated data enables big data production that can be coupled with the potential use of financial technologies, such as AI.
Mackenzie DataStreamThe Gordon Foundation, Government of Northwest Territories, and Tesera Systems Inc.
Background and Issues
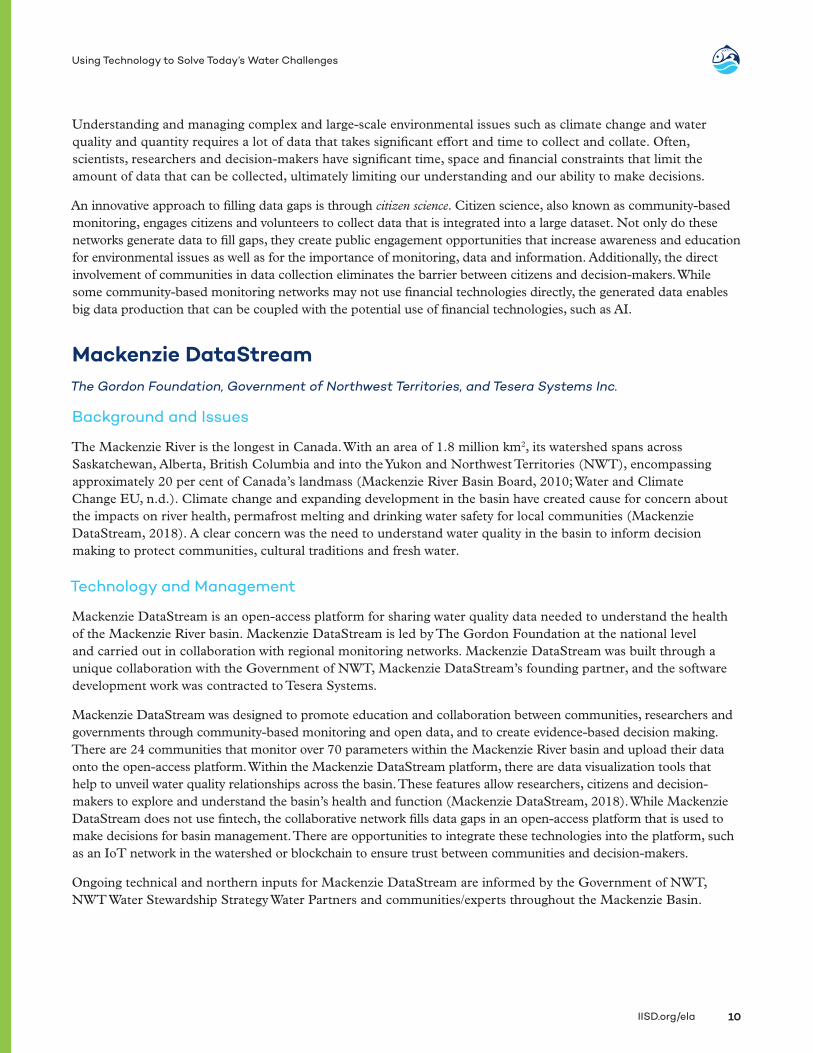
The Mackenzie River is the longest in Canada. With an area of 1.8 million km2, its watershed spans across Saskatchewan, Alberta, British Columbia and into the Yukon and Northwest Territories (NWT), encompassing approximately 20 per cent of Canada’s landmass (Mackenzie River Basin Board, 2010; Water and Climate Change EU, n.d.). Climate change and expanding development in the basin have created cause for concern about the impacts on river health, permafrost melting and drinking water safety for local communities (Mackenzie DataStream, 2018). A clear concern was the need to understand water quality in the basin to inform decision making to protect communities, cultural traditions and fresh water.
Technology and Management
Mackenzie DataStream is an open-access platform for sharing water quality data needed to understand the health of the Mackenzie River basin. Mackenzie DataStream is led by The Gordon Foundation at the national level and carried out in collaboration with regional monitoring networks. Mackenzie DataStream was built through a unique collaboration with the Government of NWT, Mackenzie DataStream’s founding partner, and the software development work was contracted to Tesera Systems.
Mackenzie DataStream was designed to promote education and collaboration between communities, researchers and governments through community-based monitoring and open data, and to create evidence-based decision making. There are 24 communities that monitor over 70 parameters within the Mackenzie River basin and upload their data onto the open-access platform. Within the Mackenzie DataStream platform, there are data visualization tools that help to unveil water quality relationships across the basin. These features allow researchers, citizens and decision-makers to explore and understand the basin’s health and function (Mackenzie DataStream, 2018). While Mackenzie DataStream does not use fintech, the collaborative network fills data gaps in an open-access platform that is used to make decisions for basin management. There are opportunities to integrate these technologies into the platform, such as an IoT network in the watershed or blockchain to ensure trust between communities and decision-makers.
Ongoing technical and northern inputs for Mackenzie DataStream are informed by the Government of NWT, NWT Water Stewardship Strategy Water Partners and communities/experts throughout the Mackenzie Basin.
IISD.org/ela 11
Using Technology to Solve Today’s Water Challenges
Impacts and Lessons
Mackenzie DataStream successfully shares data to enable scientists, communities and decision-makers in solving issues pertaining to the basin and its resources. Key principles for Mackenzie DataStream include: (1) open access, (2) data quality, (3) interoperability and (4) security and sustainability. All datasets include data collection techniques and methods (metadata) to allow other researchers and community members to properly assess the data. Mackenzie DataStream pushes past current barriers in science to allow the exchange of data between people and technology. The system ensures the data is in machine-readable formatting, is non-proprietary, and that its design allows for cooperation between researchers and communities to address the large-scale problems, such as climate change, water management and local development. And importantly, they have developed a preservation of baseline dataset management system (Mackenzie DataStream, 2018).
The key lesson learned through the Mackenzie DataStream is that it is powered by data. Collaborative efforts between citizens, researchers and decision-makers to collect data are improving understanding of their fresh water and informing important decisions. The datasets are paired with metadata and operation techniques to ensure proper use of the data for decision making. And finally, the open-access data promotes education on natural resources and encourages the use of data, ultimately increasing its value.
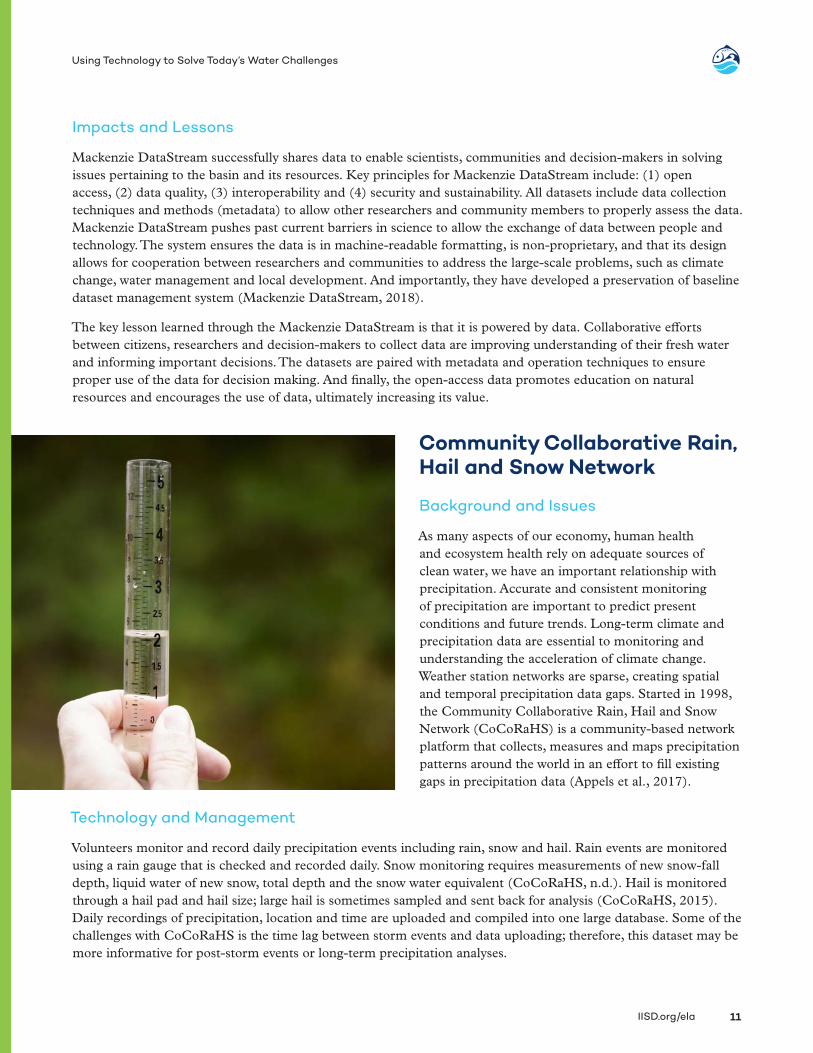
Community Collaborative Rain, Hail and Snow Network
Background and Issues
As many aspects of our economy, human health and ecosystem health rely on adequate sources of clean water, we have an important relationship with precipitation. Accurate and consistent monitoring of precipitation are important to predict present conditions and future trends. Long-term climate and precipitation data are essential to monitoring and understanding the acceleration of climate change. Weather station networks are sparse, creating spatial and temporal precipitation data gaps. Started in 1998, the Community Collaborative Rain, Hail and Snow Network (CoCoRaHS) is a community-based network platform that collects, measures and maps precipitation patterns around the world in an effort to fill existing gaps in precipitation data (Appels et al., 2017).
Technology and Management
Volunteers monitor and record daily precipitation events including rain, snow and hail. Rain events are monitored using a rain gauge that is checked and recorded daily. Snow monitoring requires measurements of new snow-fall depth, liquid water of new snow, total depth and the snow water equivalent (CoCoRaHS, n.d.). Hail is monitored through a hail pad and hail size; large hail is sometimes sampled and sent back for analysis (CoCoRaHS, 2015). Daily recordings of precipitation, location and time are uploaded and compiled into one large database. Some of the challenges with CoCoRaHS is the time lag between storm events and data uploading; therefore, this dataset may be more informative for post-storm events or long-term precipitation analyses.
IISD.org/ela 12
Using Technology to Solve Today’s Water Challenges
To ensure consistent and replicable monitoring among volunteers, CoCoRaHS has developed reporting forms for rain, snow, hail, significant weather events and yearly reporting. The data can immediately be used by organizations, researchers and citizens, such as meteorologists, hydrologists, scientists, city utilities, insurance companies, farmers, teachers and emergency managers. The platform is designed to provide accurate and timely data to users, increase and improve precipitation data across a large area and increase citizen engagement, education and awareness. To ensure trust and consistency in citizen science data for research and decision making, CoCoRaHS works to develop training and strict protocol for rain, snow and hail monitoring (CoCoRaHS, 2018).
Impacts and Lessons
Data accessibility is a challenge we face in the ecological world. Ecological research is often filled with dark data: data that is invaluable but remains inaccessible or unknown (Hampton et al., 2013). These types of data may help inform answers to our large-scale problems, but we are constrained by its availability. CoCoRaHS shows us the value of filling data gaps and sharing data to enrich our understanding of the environment. Environment and Climate Change Canada uses data collected from CoCoRaHS and social media to fill the gaps between provincial stations to improve dataset quality, verify weather warnings and create weather summaries. Other researchers use CoCoRaHS data to validate, ground truth and improve precipitation models (Kluver, 2016). To inform decision making through science, we must have a complete understanding of our world.
JärviwikiFinnish Environmental Institute (SYKE)
Background and Issues
Finland is taking charge to move forward into open data for innovative uses and to better inform decision making. The Finnish government has acknowledged the value of data for sharing, increasing knowledge and opportunities for research and education, and improving transparency between citizens and decision-makers. To encourage open data, the government has developed guidelines for best practices in sharing data for public services and innovation (Ministry of Finance, Government of Finland, n.d.). This commitment to open data platforms extends across various industries in Finland, including Järviwiki (Lakewiki), a platform for local lakes and restoration projects. Founded by SYKE, Järviwiki was created to share information and knowledge about lakes, rivers and marine environments across Finland while raising awareness and advocating for aquatic ecosystems (Järviwiki, 2012). There are over 317 municipalities in Finland with over 35,400 lakes that are monitored by citizens, researchers, academics and governments (Järviwiki, 2011).
Technology and Management
Järviwiki is a public platform that allows citizens and researchers to upload qualitative and quantitative data about lakes and waterways across Finland. Citizens collect information, data and photos from specified sites and upload them onto the platform. This information can include plants, animals, algae, temperature, ice cover, water level and other aquatic characteristics. The data can then be communicated through maps and time-series graphs for various lakes, seas and municipalities. While the data is mostly contributed through community-based efforts, the platform is maintained by SYKE, who acknowledges the value of collaborative efforts to increase data and fill knowledge gaps (Malve et al., 2016).
Data collected and uploaded to Järviwiki has been successful in improving decision making, validating models and improving understanding of local waterways. Järviwiki has been integrated into a cost-efficient model designed to improve monitoring and management of river basins in Finland. Like many other jurisdictions, SYKE lacked the information required to design management plans and make decisions for river ecosystems
IISD.org/ela 13
Using Technology to Solve Today’s Water Challenges
that consider the stresses of climate change. These models were designed to determine site-specific ecological status, nutrient loading and cost-effective management plans through integration of citizen observations, while enhancing stakeholder and citizen engagement, improving knowledge and data accessibility, creating transferable models and improving transparency (Malve et al., 2016).
Observations from Järviwiki have also been integrated into models for forecasting algal blooms in eutrophic lakes. Algal blooms caused by nutrient loading and climate change are a serious problem in waterways across Finland. GisBloom was developed to further understand the impacts of climate change and human stressors on severe algal production, and how algal blooms would respond to different management scenarios. Algal bloom forecasting through GisBloom integrates satellite imagery, in-situ monitoring stations and citizen observations from Järviwiki and is shared on the web-based platform. The model was designed to develop management strategies that resulted in decreased frequency and severity of algal bloom production while increasing awareness and education about Finnish lakes. The integration of various open data platforms into models and collaboration with citizen-based monitoring has improved management plans for Finnish lakes and rivers while striving to meet the EU’s environmental objective (Finnish Environmental Institute, 2013).
Impacts and Lessons
Järviwiki was initiated to engage community members to take action on lake health initiatives, to create an open-access platform from data collected by citizens, and to increase cooperation and trust between communities and governments (Observatory of Public Sector Innovation, 2014). The citizen-based science platform fills data and knowledge gaps for the lakes and basins and has been used to confirm and validate models that work to develop effective management plans to improve aquatic health in Finland. A key lesson from Järviwiki is encouragement from the government to create open data platforms for collaboration with citizens to improve knowledge-based decision making.
The Lake Winnipeg Community-Based Monitoring NetworkLake Winnipeg Foundation
Background and Issues
Lake Winnipeg, the world’s 10th largest freshwater lake, is located in south-central Manitoba, Canada. It receives water from a watershed that covers nearly 1 million km2 from the Rocky Mountains to the northern Ontario Boreal Shield. More than a century of urban and agricultural development within the watershed has created serious seasonal algal blooms caused by phosphorus runoff from sewage, livestock and fertilizer. During the summer months, these blooms, driven by excessive phosphorus loading from point and non-point sources, create hazardous conditions for swimming and increase the cost of drinking water treatment. Although less populated than other eutrophic lakes like Lake Erie, there are considerable economic and social costs to the residents and industries that rely on this water source.
Before the network was established, the local scientific community did not have enough data to be certain of the sources of phosphorus pollution, as there were no efficient resources to conduct monitoring throughout Manitoba’s expansive southern region. Most hydrometric stations—part of Canada’s National Hydrometric Program—are sparsely distributed compared to those located south of the Canada–United States border, and few have openly accessible water quality data. Understanding the geography and sources of the pollution—whether from septic tanks, livestock barns, crop production or other sources—is key to both effective policy development and finding fair and equitable solutions to improve the lake’s health.
To address existing data gaps, the Lake Winnipeg Foundation (LWF) stepped up. Founded as an environmental non-governmental organization, LWF advocates for cleaner and healthier water in Lake Winnipeg and in the many
IISD.org/ela 14
Using Technology to Solve Today’s Water Challenges
upstream lakes and rivers. LWF is guided by a nationally recognized science advisory council that has personal and professional interests in healthy water. Recognizing the data gaps and costs of traditional long-term monitoring programs, LWF devised a strategy to engage Manitobans and develop a scientifically rigorous program to increase understanding of where phosphorus is coming from (LWF, n.d.a).
Technology and Management
Citizen science has arguably existed for as long as science has been a discipline, counting among its participants Charles Darwin, who requested assistance confirming his theory of evolution from readers of the Gardiner’s Chronicle (Belknap, 2016). In the past decade, the practice of citizen science has begun shifting from “communications first, with some science” to a scientifically rigorous way to engage the public and collect valuable data, often using information communication technology (ICT) like smart phones and personal computers (Long, 2018).
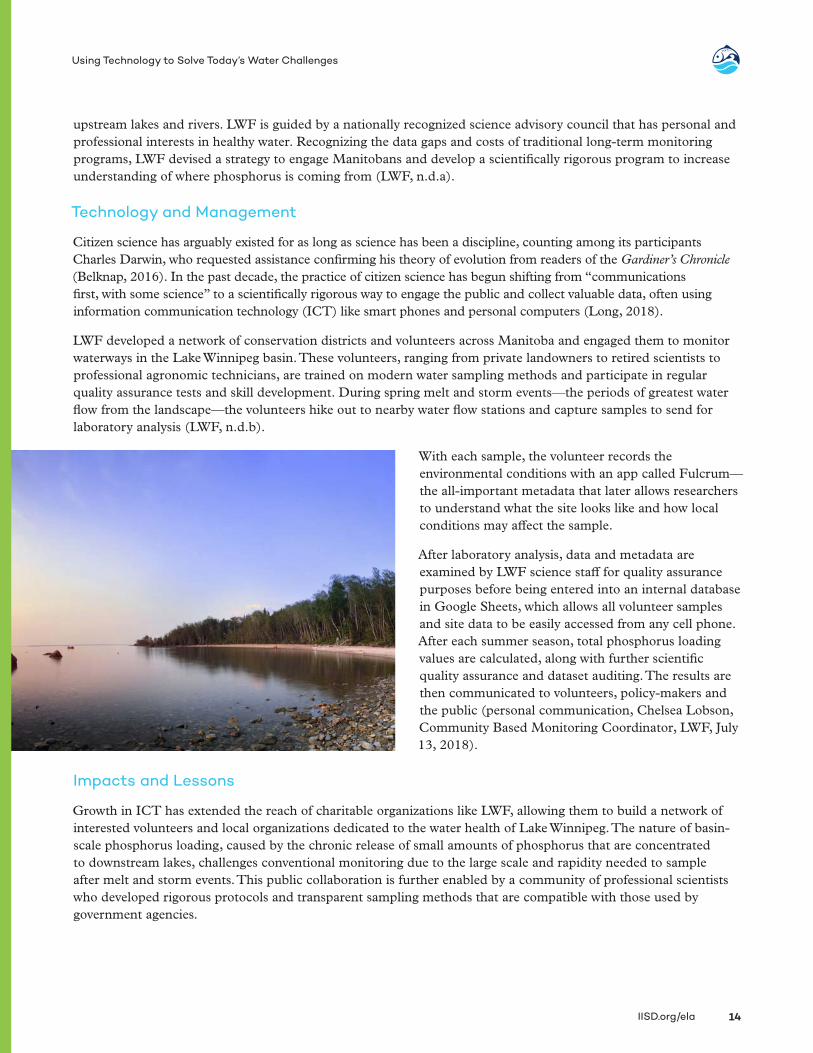
LWF developed a network of conservation districts and volunteers across Manitoba and engaged them to monitor waterways in the Lake Winnipeg basin. These volunteers, ranging from private landowners to retired scientists to professional agronomic technicians, are trained on modern water sampling methods and participate in regular quality assurance tests and skill development. During spring melt and storm events—the periods of greatest water flow from the landscape—the volunteers hike out to nearby water flow stations and capture samples to send for laboratory analysis (LWF, n.d.b).
With each sample, the volunteer records the environmental conditions with an app called Fulcrum—the all-important metadata that later allows researchers to understand what the site looks like and how local conditions may affect the sample.
After laboratory analysis, data and metadata are examined by LWF science staff for quality assurance purposes before being entered into an internal database in Google Sheets, which allows all volunteer samples and site data to be easily accessed from any cell phone. After each summer season, total phosphorus loading values are calculated, along with further scientific quality assurance and dataset auditing. The results are then communicated to volunteers, policy-makers and the public (personal communication, Chelsea Lobson, Community Based Monitoring Coordinator, LWF, July 13, 2018).
Impacts and Lessons
Growth in ICT has extended the reach of charitable organizations like LWF, allowing them to build a network of interested volunteers and local organizations dedicated to the water health of Lake Winnipeg. The nature of basin-scale phosphorus loading, caused by the chronic release of small amounts of phosphorus that are concentrated to downstream lakes, challenges conventional monitoring due to the large scale and rapidity needed to sample after melt and storm events. This public collaboration is further enabled by a community of professional scientists who developed rigorous protocols and transparent sampling methods that are compatible with those used by government agencies.
IISD.org/ela 15
Using Technology to Solve Today’s Water Challenges
As datasets grow and more volunteers participate, LWF is developing effective data management tools and protocols to ensure data is open and available to volunteers and the wider community. To continue this collaboration, they are developing the Lake Winnipeg DataStream, a new watershed platform building on concepts originated by The Gordon Foundation with the Mackenzie River and Atlantic DataStreams. These platforms provide a data model and service for archiving, visualization and analysis of data.
The growth and success of the Lake Winnipeg Community-Based Monitoring Network demonstrates how ICTs like smart phones and rural Internet connectivity make it possible to engage wider audiences to generate and archive valuable scientific data. Networks of people—in this case dedicated volunteers spread across Manitoba—are achieving a scientific goal that the public sector was unable reach to due to constrained resources. Filling this gap thanks to enabling technologies like the IoT allows an enthusiastic community foundation to find a new way to make a difference and help protect fresh water.
Impacts and Lessons from Citizen Science ApplicationsCitizen science programs are growing around the world and promise to generate growing amounts of data to feed into a world of big data systems. They are useful in engaging stakeholders, filling data gaps, and building more robust and validated data and information systems. Many of the citizen science networks are also open access, which means that anyone can access them at any time. However, a typical challenge of citizen science-based data is a lack of trust on both sides from scientists and public institutions who traditionally produce and hold the data, and the citizen scientists who hope to see their efforts make an impact.
Citizen science programs may not use financial technologies directly, but they work to enhance understanding of ecosystems, fill information gaps, create big data, strengthen relationships between decision-makers and the public, and help to improve ecosystem management plans. Key challenges in citizen science programs, such as a lack of trust, are and can be addressed using fintech such as blockchain. Citizen science is also enabled using IoT as a means for citizens to record environmental data, for example, through an app on their cell phone.
Using Technology to Solve Today’s Water Challenges
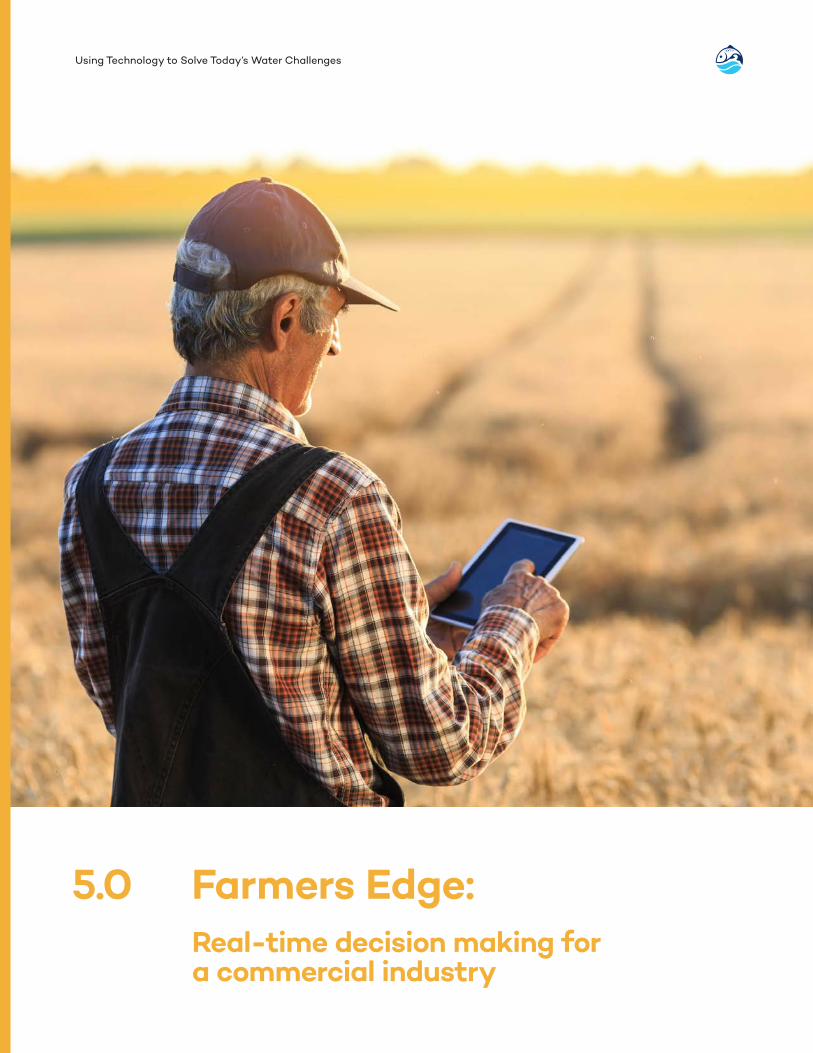
5.0 Farmers Edge: Real-time decision making for a commercial industry
IISD.org/ela 17
Using Technology to Solve Today’s Water Challenges
Background and IssuesCrop and forage agriculture is an industry deeply connected to and reliant on weather, climate and water. Each year, a producer makes countless decisions using the information available and limited resources to optimize production. These decisions are affected by forces far out of their control, like commodity prices, severe weather and a changing climate locally and in other parts of the world. Managing an agricultural landscape at the field scale is a delicate balancing act between resources and predictions. Recently, a more precise approach of data-driven farm management has been propelled by new technologies like the Global Positioning System (GPS), the IoT and, in the very recent past, AI.
Precision agriculture is a relatively new suite of farming techniques, originally enabled by high-resolution GPS and sensors, allowing some automation of implement steering (autosteer), and new developments in variable-rate treatments and decision support that have sped up uptake by farmers and agronomists (Pedersen & Lind, 2017). Until recently, a major problem was managing a rapidly growing amount of data generated for and by each farm. Through businesses’ development of farm management information systems, they have sought to reduce the burden of information management on agricultural producers and allowed them more time to run their operations.
One innovative system was developed by the private company Farmers Edge, which uses new technologies to assist with field and equipment monitoring and data management to reduce costs and improve yields. By integrating both IoT sensor networks and AI-supported analytics, they demonstrate how environmental decisions can be used commercially to improve financial success—by reducing input costs and more efficiently allocating resources like fertilizers and fuel—and promote environmental sustainability by informing decision-makers about the state of the systems they manage.
Technology and ManagementFarmers Edge collects real-time data from onsite weather stations, satellite imagery and telematic devices (vehicle/driving monitoring devices) attached to farm implements. Farmers Edge develops an on-farm personalized sensor network that collates data into the cloud-based platform, FarmCommand software. The platform integrates diverse types and forms of data, often one of the largest stumbling blocks to successful precision agriculture in crop production (Tsiropoulos, 2017). The program integrates data from the onsite networked sensors with satellite imagery into the data platform, providing the farmer with both the original data and forecasts generated by advanced data analytics and AI. Data visualizations are generated to communicate the location and extent of issues, like poor indications of crop development caused by pests or soil, along with equipment analytics and harvest and profit maps that all work to support on-farm decision making (Farmers Edge, n.d.a). Analytics can model more complex issues, like forecasts of crop growth, future pest conditions and future soil nutrient balances. By mapping fields, farmers can understand the extent and magnitude of their unique agronomic and agrological challenges and act accordingly (Figure 7) (Farmers Edge, n.d.b).
By collecting and storing data in a common format, models can be improved with actual yield maps to drive improved future capabilities with historical perspectives. Generating and storing big data at the individual field level will assist future analytics, particularly those driven by AI, by training with data reflecting field state, management actions and yield results. This data could reduce future observation needs as modelling techniques mature, allowing producers to forecast scenarios and make decisions to increase the resilience and efficiency of their operations.
IISD.org/ela 18
Using Technology to Solve Today’s Water Challenges
Impacts and LessonsOur increasingly data-rich world needs platforms and systems that produce information, so users can spend less time organizing and analyzing the data and more time implementing management actions. Better connections between data—and especially environmental data—can give managers the tools to understand the risks and benefits of potential decisions.
Use of these types of technologies and innovative platforms to support decisions can promote sustainability. Optimizing crop additions like pesticides or fertilizers by using precision agriculture techniques helps to reduce water pollution from overapplication and the amount of fossil fuels needed to power machinery. Connecting these decisions to estimated yields can give farmers a broader view of success and historical appreciation for past yields from specific areas, as well as assist them in making better crop marketing decisions. Farmers Edge and others developing innovative platforms for farm management are demonstrating how data can inform better decisions for an individual’s business and the environment. Beyond farming, the concepts developed within precision agriculture can serve as a model for landscape management in non-cropping areas or as a source of best practices for sustainable, data-informed farm management.
Using Technology to Solve Today’s Water Challenges
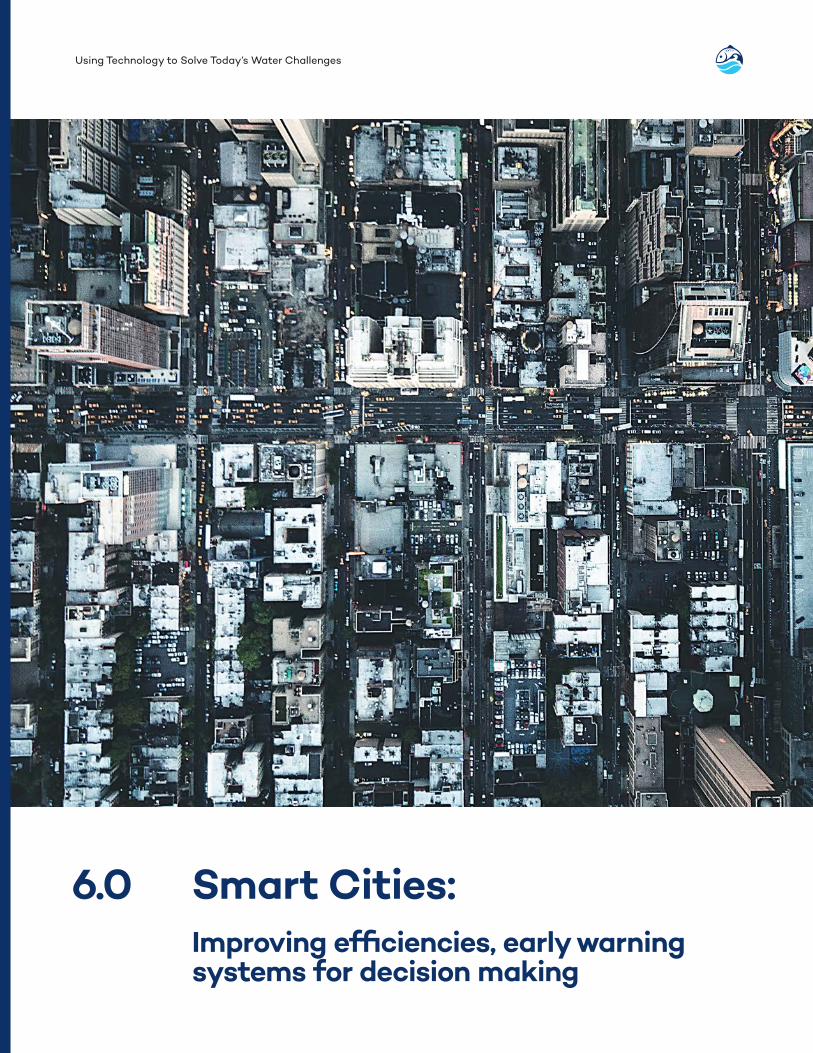
6.0 Smart Cities: Improving efficiencies, early warning systems for decision making
IISD.org/ela 20
Using Technology to Solve Today’s Water Challenges
Background and IssuesAs urban populations are growing at an extreme rate and cities are expanding, city design and services are no longer efficiently serving communities. Waste management, infrastructure, air and water quality, energy consumption and traffic are a few of the major issues facing cities globally. To increase efficiencies and address local issues, some governments/communities have integrated technologies into their city’s design to improve operations and environmental impact. Smart cities are designed by connecting sensors together to make a large network mesh (IoT) that can communicate and provide real-time information about city services, resources, environmental conditions and efficiencies.
The IoT network can be made of sensors monitoring technical in-situ variables, aerial and spatially based variables, social networks, mobile phones and other Internet-connected sensors (Ang et al., 2017). Challenges arise when trying to integrate, organize or manage data into city platforms/dashboards and analyze it for decision making and improving efficiencies. Some successful smart cities have compiled big data into a platform that is analyzed with technologies that drive them. This platform, otherwise known as a city dashboard, is analyzed to make real-time and long-term decisions about city function, infrastructure design, safety or environmental integrity.
Recently, there has been increasing interest in developing and implementing smart city technologies into city networks around the world; the top 10 include: New York City, London, Paris, Tokyo, Reykjavik, Singapore, Seoul, Toronto, Hong Kong and Amsterdam. These cities are ranked in the top 10 not only for environmental sustainability, but also for economy, operations, safety, employment, tourism, etc. These cities and other smart cities are encouraging and implementing the use of these technologies to improve city practices, operations, equality, innovation, sustainability and, ultimately, the lives of residents (IESE Business School, 2018).
Technology and Management Smart cities are using IoT to develop operations to reduce waste, create early warning signals and increase service value for cities and communities (Zanella et al., 2014). Its development depends on the connection of new technologies that perform data acquisition techniques, such as wireless sensor networks (Li, Xu, & Wang, 2013). Within the wireless sensors, nodes are used to monitor and record environmental data including water quality, temperature, pressure, air pollution, roads, noise pollution and waste management, etc. (Morgan, 2014). Data is transferred between the network, a “mesh” of nodes placed throughout a system to create the shortest route to conserve energy. The data is transmitted back to a management node/computer, allowing real-time interaction between environmental conditions and humans (Yinbiao et al., n.d.). One of the unique features of smart city IoT and AI networks is the multidirectional capability to collect and produce big data and then respond and communicate with sensor networks for decision making. For example, when networks collect traffic data and detect congestion and carbon emissions from a specific neighbourhood, the technology provides a real-time response back to the location to adjust signal timing to increase the flow of traffic. This technology has a lot of potential in early warning systems for environmental events, such as wastewater facility effluent release, poor drinking water quality or poor air quality.
New York City, United States
Traffic is a major issue for citizens in New York City, with congested and delayed buses, reduced traffic flows and high-carbon emissions. The city has responded by installing an IoT system in traffic lights, buses, traffic cameras, sensors and other sources to create a traffic management network. The network of sensors identifies real-time issues through IoT sensors and responds by adjusting traffic signal timing to alleviate congestion, improving flows and ultimately reducing greenhouse gas emissions from idling vehicles (Government of New York, 2015).
New York City, which was named the Best Smart City in 2016 by the Smart City Expo World Congress, is working to integrate technology into its city’s design to solve urban challenges and benefit citizens. Rather than focusing
IISD.org/ela 21
Using Technology to Solve Today’s Water Challenges
on one target in the city’s challenges, they are working to integrate all sensor networks to interact with one another though IoT networks to increase efficiencies, improve safety, create an early warning system and reduce energy use (Rosencrance, 2017).
New York City acknowledged that air pollution is a major cause of illnesses and deaths in the urban areas of the city. Since 2008, observations were made at 75 sites for two weeks each season, monitoring fine particulates, nitrogen oxides, sulphur dioxide, elemental carbon and ozone levels. To enhance the existing research, the Department of Health and Mental Hygiene (DOHMH) integrated a small-scale IoT network at eight sites around the city that reports real-time air-quality data to target large polluters and develops regulations for large sources of pollution (Government of New York, 2015).
One of the major targets of the IoT network was buildings (approximately 10,000 units) that burned heating oil that produced and released significant levels of sulphur dioxide and soot into the atmosphere. While these account for only 1 per cent of all buildings in New York, together these units released more pollution than all vehicles in the city in 2010. The real-time data collected by the IoT network and the annual surveys caused city officials to act and ban the use of these oils. Since regulation, atmospheric sulphur dioxide has decreased by approximately 70 per cent (Government of New York, 2015). While the major target of the smart air-quality network was for human health (lung function and eye irritation) and safety, there are also positive environmental implications for the implemented regulations. Sulphur dioxide released into the atmosphere mixes with air and water, producing sulphuric acid, resulting in acid rain. Acid rain can cause deforestation, and building corrosion, and it can acidify aquatic ecosystems, impacting aquatic life (Queensland Government, 2017).
The regulation of burning oils in New York City through smart networks has had a significantly positive impact on human health and the environment. Even small IoT sensor networks can have big impacts on decision making.
Stockholm, Sweden
Concerned about the future of water quality, the environment and climate change, the City of Stockholm collaborated with academics and Ericsson, an ICT company, to develop a water quality monitoring system to provide early warning systems for poor water quality and to prepare mitigation strategies and minimize operational costs (Ericsson, 2017).
The collaborative team designed a real-time water quality monitoring, wireless sensor network using IoT sensors throughout the water system in Stockholm. The network monitors for changes in pH, temperature, conductivity, dissolved oxygen and oxygen-reduction potential. The network platform collects data that is analyzed with big data analytics, such as AI, that informs the city about issues such as discharge of wastewater downstream, algal blooms or bacteria contaminating drinking water and its location.
The program is divided into three phases to develop a solution for water quality from source to sewage (Paska, 2017): (1) source water, to monitor changes in drinking water quality and composition, and to detect pollution in water sources for the city; (2) distribution network, to monitor for bacteria proxies in fresh water; and (3) sewage water network, to monitor wastewater and stormwater effluent systems to detect for pollution that may have downstream impacts. Ericsson is in the first phase of the project, using cellular networks to connect their IoT to the cloud network; however, they expect to expand to larger coverage with a narrowband IoT (Ericsson, 2017; Paska, 2017). One of the challenges faced by Ericsson during the first phase of the project is reliable sensors that remain connected to the IoT network when underwater or underground (Paska, 2017).
The IoT network within the source-to-sewage system in Stockholm can provide real-time data and locations for quick decision making related to water issues for human health and environmental integrity.
IISD.org/ela 22
Using Technology to Solve Today’s Water Challenges
Impacts and Lessons The integration of smart technologies such as IoT, AI or big data analytics into a city’s platform can have immediate and significant impacts. The IoT sensor mesh network works to provide real-time data on environmental variables, urban centres and various systems to detect early warnings or increase understanding of conditions that can affect human health and environmental integrity and improve city efficiencies. AI or other analytical platforms can work to detect trends and relationships within the city network that can improve efficiencies (e.g., traffic) and help to make decisions to reduce environmental impacts.
The impacts of adopting smart technologies can be incredibly significant at various scales: a small air-quality network of eight sensors reduced sulphur dioxide emissions from New York by 70 per cent and a large sensor network across the source to sewage pathway can provide important early warning signals for poor quality drinking water, inefficiencies and downstream pollution.
While these smart city examples appear simple to implement, there are existing challenges that occur when dealing with massive amounts of data. Smart city networks require extensive data management and organization into the data platform/city dashboard. We can collect massive amounts of data, but without proper integration we cannot harness its potential for decision making. In addition, while sensors may exist around the city, there are significant costs associated with developing an IoT network, city dashboard and analytical services. The Smart Cities Challenge in the City of Toronto has a competition for up to CAD 50 million in funding for smart city program development (City of Toronto, n.d.). The Government of Canada has announced 20 finalists from various cities and First Nations communities, competing for CAD 300 million split into different tiers for smart city programming (Greenwood, 2018). About one in 10 representatives indicated that the ability to develop smart city networks is limited by budget, infrastructure, short-term planning and leadership (Open Access Government, 2018). While initial costs may be high, the question remains: can the annual savings in city efficiencies repay initial costs in a reasonable amount of time?
While there may be challenges in adopting smart city technologies, the outcomes for improved infrastructure, operation efficiencies, safety and environmental sustainability are essential for the growing population. Smart city challenges and programs are excellent tools for smaller cities and countries to get started in developing their own city network to inform data-based decision making.
IISD.org/ela 23
Using Technology to Solve Today’s Water Challenges
7.0 Conclusions
As climate change accelerates and water resources are getting depleted and more polluted, we rely more and more on data and information to understand current conditions, predict future trends for early warnings and apply real-time analytics to increase our knowledge and understanding of complex problems. Our case studies showed us that fintech applications can help environmental management in multiple and diverse ways. Internet of things, for example, as shown through cases on the Jefferson Project, Copernicus EU, Farmers Edge and smart cities, can help collect massive amounts of real-time data about our environmental systems.
Big data was produced or enabled by all case studies. The Jefferson Project, Copernicus EU, Farmers Edge and smart cities produce big data through IoT sensor networks and some help to produce and fill gaps in big data to inform important decisions about the environment. Ultimately, our understanding of the environment is limited by the data we have available to us.
Artificial intelligence or similar big data analytics were implemented in the Jefferson Project, Copernicus EU, Farmers Edge and in smart cities as early warning systems and to detect the complicated relationships and trends within big datasets. It is with big data and analytical platforms that we increase our understanding of our Earth and environment to help make decisions and plan for resilience. The case studies revealed that AI and other technologies do not have to be performed on a large scale; in fact, small-scale research can have a significant impact on decision making, such as the eight-sensor air-quality IoT network in New York City.
And finally, while none of these case studies specifically implemented blockchain, it has an important function moving forward, especially with citizen science networks. Blockchain is more than just the technology for Bitcoin; it creates multidirectional trust between citizens and decision-makers.
The adoption of these key technologies (IoT, big data, AI and blockchain) can help us progress into a data-driven world. While all case studies have various drivers and functions of fintech applications, the integration of these technologies into their data platforms has increased understanding and knowledge of their systems at various scales (Table 1).
There are big revolutions of fintech happening globally, and we are now starting to see it expand and mature at various scales. Integrating fintech into a data platform is becoming easier, at a lower cost for increased services and less risk. The rise in commercial interest has increased services: there are data and software management platforms such as Amazon Web Services, IBM Watson or Microsoft Azure that provide software as a service. The resource costs of hardware to produce data and software to analyze it are also declining. As we sit at the confluence of technologies and data-driven science, these case studies display the various scales and opportunities to improve environmental management and decision making through data-based science and technologies.
IISD.org/ela 24
Using Technology to Solve Today’s Water Challenges
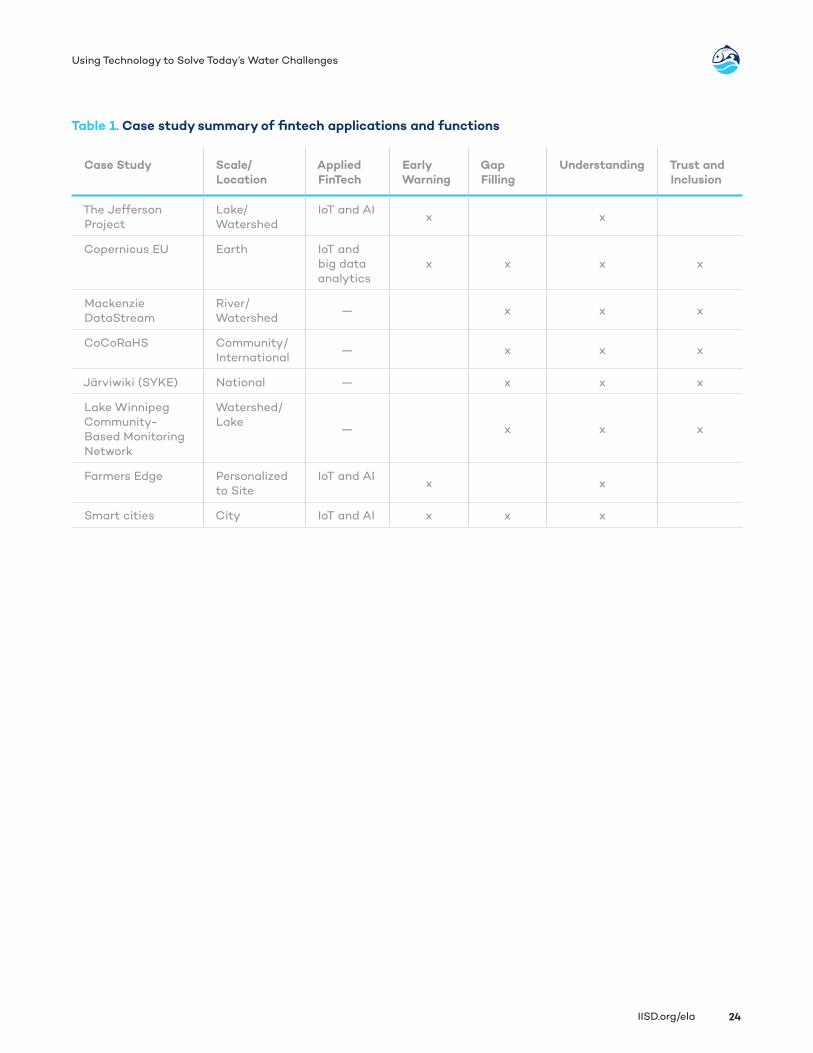
Table 1. Case study summary of fintech applications and functions
Case Study Scale/Location
Applied FinTech
Early Warning
Gap Filling
Understanding Trust and Inclusion
The Jefferson Project
Lake/ Watershed
IoT and AIx x
Copernicus EU Earth IoT and big data analytics
x x x x
Mackenzie DataStream
River/Watershed
— x x x
CoCoRaHS Community/ International
— x x x
Järviwiki (SYKE) National — x x x
Lake Winnipeg Community-Based Monitoring Network
Watershed/Lake
— x x x
Farmers Edge Personalized to Site
IoT and AIx x
Smart cities City IoT and AI x x x
IISD.org/ela 25
Using Technology to Solve Today’s Water Challenges
Reference List
Ang, L-M., Seng, K. P., Zungeru, A. M., & Ijemaru, G. K. (2017). Big sensor data systems for smart cities. IEEE Internet of Things Journal, 4(5), 1259–1271. Doi: 10.1109/JIOT.2017.2695535.
Appels, W. M., Bradford, L., Chun, K. P., Coles, A. E., & Strickert, G. (2017). DIY meteorology: Use of citizen science to monitor snow dynamics in a data-sparse city. Facets. Retrieved from www.facetsjournal.com/doi/10.1139/facets-2017-0030
Belknap, G. (2016). People power: How citizen science could change historical research. Retrieved from https://www.theguardian.com/science/the-h-word/2016/apr/26/how-citizen-science-could-change-historical-research-crowdsourcing
City of Toronto. (n.d.). Smart Cities Challenge. Retrieved from https://www.toronto.ca/city-government/accountability-operations-customer-service/city-administration/city-managers-office/key-intiatives/smart-cities-challenge-2/.
CoCoRaHS HQ. (2015). Measuring hail. Retrieved from https://www.youtube.com/watch?v=QHvRGa09_ug
Community Collaborative Rain, Hail and Snow Network. (n.d.). “In depth” snow measuring training slide show. Retrieved from https://www.cocorahs.org/Content.aspx?page=training_slideshows
Community Collaborative Rain, Hail and Snow Network. (2018). Home. Retrieved from https://www.cocorahs.org/
Copernicus EU. (n.d.). Copernicus in brief. Retrieved from http://www.copernicus.eu/main/copernicus-brief
Copernicus EU. (2017). Success stories. Retrieved from http://www.copernicus.eu/library/detail/260
Ericsson. (2017). Using smart technology to monitor Stockholm’s water systems: An Ericsson case study. Retrieved from https://ceowatermandate.org/wp-content/uploads/2017/11/BAFWAC_-_Ericcson_11.2.pdf
European Commission. (2016a, November). Copernicus helps fish and shellfish farmers monitoring toxic algal blooms. Copernicus Market Report, 1. Retrieved from http://www.copernicus.eu/sites/default/files/library/MarketReport2016_SuccessStory_Ocean.pdf
European Commission. (2016b, November). Improving irrigation management via EO data in Lower Austria with the help of Copernicus. Copernicus Market Report, 1. Retrieved from http://www.copernicus.eu/sites/default/files/library/MarketReport2016_SuccessStory_Agriculture.pdf
European Space Agency. (2016). Sentinels for Copernicus (Video Presentation). Retrieved from https://www.youtube.com/watch?v=xcflQZJ5n88
Facchini, M. (2017). Copernicus general overview (Video Presentation). Copernicus EU. Retrieved from https://www.youtube.com/watch?v=lLygi0XhJ0E
Farmers Edge. (n.d.a). About Farmer’s Edge. The global leader in decision agriculture. Retrieved from https://www.farmersedge.ca/about-us/
Farmers Edge. (n.d.b). FarmCommand. Retrieved from https://www.farmersedge.ca/farmcommand/
Finnish Environmental Institute (SYKE). (2013). Tools for evaluation and management of eutrophication – GisBloom. Retrieved from http://www.syke.fi/projects/gisbloom
IISD.org/ela 26
Using Technology to Solve Today’s Water Challenges
Government of New York. (2015). Building a smart and equitable city. Retrieved from http://www1.nyc.gov/assets/forward/documents/NYC-Smart-Equitable-City-Final.pdf
Greenwood. M. (2018). Canada’s $300 million smart city challenge finalists unveiled. Retrieved from https://techvibes.com/2018/06/01/canadas-300-million-smart-city-challenge-finalists-unveiled
Hampton, S. E., Strasser, C. A., Tewksbury, J. J., Budden, A. E., Batcheller, A. L., & Porter, J. J. (2013). Big data and the future of ecology. Frontiers in Ecology and the Environment, 11(3), 156–162. Retrieved from http://doi.org/10.1890/120103
IESE Business School. (2018). The smartest cities in the world in 2018. Forbes. Retrieved from https://www.forbes.com/sites/iese/2018/07/13/the-smartest-cities-in-the-world-in-2018/#4aaf97b32efc
Järviwiki. (2011). Municipalities of Finland. Retrieved from www.jarviwiki.fi/wiki/Municipalities_of_Finland
Järviwiki. (2012). About Jarviwiki. Retrieved from http://www.jarviwiki.fi/wiki/Järviwiki:About
Kluver, D., Mote, T., Leathers, D., Henderson, G. R., Chan, W., & Robinson, D. A. (2016). Creation and validation of a comprehensive 1 by 1 daily gridded North American dataset for 1900–2009: Snowfall. Journal of Atmospheric and Oceanic Technology, 33, 857–871. Doi:10.1175/JTECH-D-15-0027.1
Lake George Association. (n.d.). Lake George water quality. Retrieved from https://www.lakegeorgeassociation.org/educate/science/lake-george-water-quality/
Lake George Association. (2016, December). Lake George Watershed Data Atlas. Lake George, New York. Retrieved from https://www.lakegeorgeassociation.org/wpcontent/uploads/2017/ 04/20161213LGADataAtlasOptimized.pdf.
Lake Winnipeg Foundation. (n.d.a). About us. Retrieved from https://www.lakewinnipegfoundation.org/about-us
Lake Winnipeg Foundation. (n.d.b). Monitoring our waterways. Retrieved from https://www.lakewinnipegfoundation.org/monitoring-our-waterways
Li, S., Xu, L. D., & Wang, X. (2013). Compressed sensing signal and data acquisition in wireless sensor networks and Internet of things. IEEE Transactions on Industrial Informatics, 9(4), 2177–2186. Doi: 10.1109/TII.2012.2189222
Long, A. (2018). AAAS Colloquium on citizen science: A panel and call to arms. Retrieved from https://www.wilsoncenter.org/blog-post/aaas-colloquium-citizen-science-panel-and-call-to-arms
Mackenzie DataStream. (2018). Home. Retrieved from https://mackenziedatastream.ca/
Mackenzie River Basin Board. (2010). Understanding the basin. Retrieved from http://www.mrbb.ca/information/9/index.html
Malve, O., Hjerppe, T.., Tattari, S., Väisänen, S., Huttunen, I. … Kauppila, P. (2016). Participatory operations model for cost-efficient monitoring and modeling of river basins: A systematic approach. Science of the Total Environment, 520, 79–89. Doi: 10.1016/j.scitotenv.2015.06.105.
Ministry of Finance, Government of Finland. (n.d.). Open data. Retrieved from https://vm.fi/en/opendata
Morgan, J. (2014). A simple explanation of ‘The Internet of Things.’ Forbes. Retrieved from https://www.forbes.com/sites/jacobmorgan/2014/05/13/simple-explanation-internet-things-that-anyone-can-understand/#7a3532eb1d09
IISD.org/ela 27
Using Technology to Solve Today’s Water Challenges
Open Access Government. (2018). Singapore, London and Barcelona named top global smart cities. Retrieved from https://www.openaccessgovernment.org/singapore-london-and-barcelona-named-top-global-smart-cities/42527/
Paska, D. (2017). Connecting water quality sensors to the cloud. Retrieved from https://www.ericsson.com/thecompany/sustainability_corporateresponsibility/technology-for-good-blog/2017/02/08/connecting-water-quality-sensors-to-the-cloud/
Pedersen, S. M. & Lind, K. M. (2017). Precision agriculture: From mapping to site-specific application. In S. M. Pedersen & K. M. Lind (Eds.), Precision agriculture: Technology and economic perspectives (pp. 1–20). Switzerland: Springer.
Queensland Government. (2017). Sulfur dioxide. Retrieved from https://www.qld.gov.au/environment/pollution/monitoring/air-pollution/sulfur-dioxide
Rensselaer Polytechnic Institute. (2013). The Jefferson Project at Lake George. Retrieved from https://www.youtube.com/watch?v=uARKFSw4ofc.
Rensselaer Polytechnic Institute. (2018). Jefferson Project at Lake George. Retrieved from http://jeffersonproject.rpi.edu/
Rosencrance, L. (2017). NYC smart city projects focus on user experience, transportation. Retrieved from https://internetofthingsagenda.techtarget.com/feature/NYC-smart-city-projects-focus-on-user-experience-transportation
Tsiropoulos, Z., Carli, G., Pignatti, E. & Fountas, S. (2017). Future perspectives of farm management information systems. In S. M. Pedersen & K. M. Lind (Eds.), Precision agriculture: Technology and economic perspectives (pp. 181–200). Switzerland: Springer.
U.S. Environmental Protection Agency. (2018, June 7). Article 2: Classifications and Standards of Quality and Purity. Title 6 New York Codes, Rules and Regulations (NYCRR). In Compilation of Codes, Rules and Regulations of the State of New York. Retrieved from https://www.epa.gov/sites/production/files/2014-12/documents/nywqs-section1.pdf
Water and Climate Change EU. (n.d.). Mackenzie River Basin. Retrieved from http://www.waterandclimatechange.eu/river-basin/mackenzie
Wulder, M. A., White, J. C., Goward, S. N., Masek, J. G., Irons, J. R., Herold, M., … Woodcock, C. E. (2008). Landsat continuity: Issues and opportunities for land cover monitoring. Remote Sensing of Environment, 112(3), 955–969. Retrieved from https://doi.org/10.1016/j.rse.2007.07.004
Yinbiao, S., Lee, K., Lanctot, P., Jianbin, F., Hao, H., … Qin, W. (2014). Internet of Things: Wireless Sensor Network. White Paper. International Electrotechnical Commission. Retreived from http://www.iec.ch/whitepaper/pdf/iecWP-internetofthings-LR-en.pdf
Zanella, A., Bui, N., Castellani, A., Vangelista, L., & Zorzi, M. (2014). Internet of things for smart cities. IEEE Internet of Things Journal, 1(1), 22-32. Doi:10.1109/JIOT/2014.2306328.

©2018 The International Institute for Sustainable Development Published by the International Institute for Sustainable Development.
Head Office
111 Lombard Avenue, Suite 325 Winnipeg, Manitoba Canada R3B 0T4
Tel: +1 (204) 958-7700 Website: www.iisd.org Twitter: @IISD_news
iisd.org


