Using the Cretaceous Impact Event to Teach Science Process Sixty five million years ago, a 10 km wide meteorite crashed into what is now Mexico’s Yucatan Peninsula, creating a 177 km wide crater and a mass extinction across the globe. People are familiar with the fossil evidence of the dinosaurs’ demise but an equally exciting and important source of data comes from deep sea ocean cores that can be easily explored in the classroom! The following activity encourages students to make observations and generate questions about a deep sea core from Leg 171B which contains evidence from the impact event and resulting changes in the ocean community. Students will collect information about the core through asking questions then useing their critical thinking skills to explain the patterns they see in the core data. Students will then reflect upon the science process they participated in by using the Science Flow Chart and discuss common aspects of how science is done. Grades 6-10 Connections to the Next Generation Science Standards Disciplinary Core Ideas • MS/HS-ESS1C The history of planet Earth • MS/HS-ESS2 Earth materials and systems • MS-LS4A Evidence of common ancestry and diversity Science & Engineering Practices • Asking questions and defining problems • Analyzing and interpreting data • Constructing explanations and designing solutions • Engaging in argument from evidence Crosscutting Concepts • Patterns • Cause and effect • Scale, proportion and quantity • System and System Models • Stability and Change Materials • Images from Cretaceous Impact Kit at: joidesresolution.org/node/3306 o Lab Book: Core Description Card o Maps – Drill Site and Changing Continents o Microscopic Images – Cretaceous & Tertiary Forams, Microtektite o Ocean Images – Cretaceous and Present Day o Extinction Event – Meteorite, Acid Rain and Dead Dino! • Cretaceous Impact core model or print out (see above link) • Simple Science Flow Chart at appropriate grade level (1 per student) See below or visit: http://undsci.berkeley.edu/teaching/teachingtools.php Author: Jennifer Collins - Consortium for Ocean Leadership, Deep Earth Academy, 2013
Transcript
Using the Cretaceous Impact Event to Teach Science Process
Sixty five million years ago, a 10 km wide meteorite crashed into what is now Mexico’s Yucatan Peninsula, creating a 177 km wide crater and a mass extinction across the globe. People are familiar with the fossil evidence of the dinosaurs’ demise but an equally exciting and important source of data comes from deep sea ocean cores that can be easily explored in the classroom! The following activity encourages students to make observations and generate questions about a deep sea core from Leg 171B which contains evidence from the impact event and resulting changes in the ocean community. Students will collect information about the core through asking questions then useing their critical thinking skills to explain the patterns they see in the core data. Students will then reflect upon the science process they participated in by using the Science Flow Chart and discuss common aspects of how science is done. Grades 6-10 Connections to the Next Generation Science Standards Disciplinary Core Ideas
• MS/HS-ESS1C The history of planet Earth • MS/HS-ESS2 Earth materials and systems • MS-LS4A Evidence of common ancestry and diversity
Science & Engineering Practices
• Asking questions and defining problems • Analyzing and interpreting data • Constructing explanations and designing solutions • Engaging in argument from evidence
Crosscutting Concepts
• Patterns • Cause and effect • Scale, proportion and quantity • System and System Models • Stability and Change
Materials
• Images from Cretaceous Impact Kit at: joidesresolution.org/node/3306 o Lab Book: Core Description Card o Maps – Drill Site and Changing Continents o Microscopic Images – Cretaceous & Tertiary Forams, Microtektite o Ocean Images – Cretaceous and Present Day o Extinction Event – Meteorite, Acid Rain and Dead Dino!
• Cretaceous Impact core model or print out (see above link) • Simple Science Flow Chart at appropriate grade level (1 per student) See
below or visit: http://undsci.berkeley.edu/teaching/teachingtools.php Author: Jennifer Collins - Consortium for Ocean Leadership, Deep Earth Academy, 2013
Background Information See below and visit joidesresolution.org/node/3306 Directions
1. Pass out the Cretaceous Impact (171B) core model, photograph, or mock core to each group.
2. Explain to students that this is a sediment core from the ocean and it holds evidence of past events on earth. Their job is to analyze the core to make inferences that explain what they observe.
3. Give students time to make individual and group observations, recording them in a way that can be shared with the class. Discuss what it means to make scientific observations (http://undsci.berkeley.edu/article/0_0_0/howscienceworks_05) and how observations are used to make inferences that can be tested. Undoubtedly, students will include inference statements in their initial observations of the core. Have them identify these and discuss why they are not observations. Then students can revisit their observations and enhance them with more detail using their different senses and available tools (e.g. ruler).
4. Discuss the patterns students see in the core. For example, they should notice very abrupt transitions between layers and that the top and the bottom layers look similar in color and texture.
5. Ask students to generate ideas to explain the patterns they see. Their ability to do this should be limited since important information has not been provided.
6. Have students identify missing information that they need to proceed.
Note: Students can also record who, what, when, where, why, and how questions about scientific ocean drilling and the people and processes behind core retrieval. www.joidesresolution.org contains useful information for addressing such questions.
7. Invite students to request the information that they need. Respond to these requests using materials from the Cretaceous-Impact kit or other sources. Distribution of the information can be either piece-meal as requests are made or together as a packet.
Examples of information students should identify as important • Which end of the core is up? • Which end is most recent? • What is the age of the different core layers? • Where was the core drilled? • What is each layer made of? • What else was happening on earth during that time? • Where were the continents located during that time?
8. As a whole class or in small groups, students should begin to connect what they see in the core with the extinction event that killed the dinosaurs. Give them an opportunity to construct an argument from their evidence that they can share in written or oral format.
9. Have students reflect back on and list all of the aspects of science they
participated in e.g. gathered information, made inferences, made observations, talked to each other, etc.
10. Pass out the simple Science Flow Chart. Have students analyze the model and explain what it shows about how science is done.
11. Have students plot the science actions they participated in from their list
onto the Science Flow Chart where they think they most belong, then reveal the more complex age appropriate flow chart.
12. Discuss any similarities and differences between what they plotted and what is found on the model. It is OK if students have differences. This is a model and models can be adapted, but encourage students to talk about their choices.
13. Using the Science Flow Chart: Have students trace the pathway they took during their investigation including connections to what they would want to do next in the process.
EXTENSION: Have students use additional resources to explore alternative hypotheses and/or different lines of evidence about the extinction event that took place 65 million years ago.
Important observations and inferences to discuss: • There was a loss of diversity and size in the microfossils after the
meteor impact. • Though the size of the different layers is similar, the time they
represent is very different. The middle, dark layer (ejecta and fireball layers) were deposited very quickly, in a matter of days or months, compared to approximately 100,000 years it took to deposit the microfossil layers.
• The size of the ejecta layer in cores from this time period, decreases with distance from the impact size.
Key elements of the Science Flow Chart as a model: • Science is non-linear. • Investigations can start in any number of places and go in many
directions. • Testing ideas is central to science, but there are other important
aspects such as benefits and outcomes. • Science does not have an ending point. • Collaboration and community is an important aspect of science.
More information can be found at: undsci.berkeley.edu.
Cretaceous/Tertiary Boundary Core Replica
Integrated Ocean Drilling Program - Leg 171B-1049A-17X-2
This replica of a sediment core recovered by the Ocean Drilling Program records the cataclysmic event that changed life on Earth 65 million years ago. The drill ship JOIDES Resolution obtained this core 350 miles east of Florida at a depth of 427 ft (128 meters) below the ocean floor. On that day, an asteroid nearly 10km wide slammed into what is now Mexico’s Yucatan Peninsula and blasted debris into the atmosphere. When the dust cloud settled, a 177km wide crater scarred the Earth. A large number of marine and terrestrial creatures became extinct. The following description is printed on the backside of the replica: 1. After the Impact: Sediment is laminated and slightly bioturbated. Only tiny, less ornate foraminifera microfossils are found in this layer;
a few new species have evolved. 2. Fireball Layer: This layer is stained orange due to oxidization of
the upper part of the spherule layer. Contains dust and ash fallout from the asteroid impact.
3. Tektite Layer: Ejecta, including tektites – glassy spherules condensed from the hot vapor cloud produced by the asteroid impact – are found in this layer of the core. Debris thrown into the atmosphere
by the impact rained down on the Earth for days to months after the event. The impact and ensuing global climatic changes devastated life. In the ocean, 95 percent of the free-floating foraminifera died out.
Grades from coarser to finer particles from the bottom to top of layer. 4. Moment of Impact: The irregular surface is the K/T
(Cretaceous/Tertiary) Boundary. 5. Before the Impact: The sequence immediately below the K/T
unconformity displays microfaults and slump. This layer contains microfossils of the large and ornate foraminifera that flourished in the oceans during the time of the dinosaurs.
Above wording taken from the ODP (Ocean Drilling Program) and
JOI (Joint Oceanographic Institutions) sponsored poster on the Leg
171B (1049A-17X-2) core now on display at the Smithsonian
Institution, Washington, D.C., USA. This core is part of the
ODP/Bremen Core Repository collection, University of Bremen,
Germany.
Comparison of real core (left) and replica (right).
Moment of Impact
CRET
ACE
OU
STE
RTIA
RY
IMPACT EJECTADebris from the impact consistsof a layer of graded, green, glassy globules, called tektites, as wellas mineral grains and rock debrisapparently derived from the Yucatan impact structure.
CRETACEOUS MICROORGANISMSThis layer contains signs of slumping perhaps caused by intense shock waves from the Chicxulub meteorite impact.
FALLOUT BEDDevoid of almost all life. Evidence of a few surviving microorganisms.Contains iridium anomaly and remains of the meteorite.
FIRST REPOPULATION OF THE “EMPTY SEAS”New life evolves from survivors.
TERTIARY MICROORGANISMSReturn to “normal” conditions.
45 cm
55
65
75
Cretaceous/Tertiary Boundary meteorite impactODP Leg 171B, Site 1049, Core 1049A, Section 17X-2
ODP results from the Atlantic Ocean, 300 miles off
northeastern Florida, provide dramatic support for the
long-standing theory that a large extraterrestrial object
slammed into Earth about 65 million years ago at the
Cretaceous-Tertiary (K/T) boundary. This event caused
widespread extinctions of perhaps 70 percent of all
species, including the dinosaurs. By drilling multiple
holes at Site 1049 in 1997, ODP Leg 171B recovered
three cores containing sedimentary layers that reveal —
in beautiful detail — a cataclysmic story of destruction
and biotic upheaval (see photograph). The lowermost
impact layer contains a graded bed (6 to 17 cm thick) of
green, silica-rich globules produced by the large
meteorite impact. This spherule layer, which contains
Cretaceous planktic foraminifera, forms a sharp contact
with underlying nannofossil ooze (soft, microfossil-rich
sediment) that was deposited before the catastrophe.
The spherule layer also contains mineral grains and rock
debris from the Chicxulub crater on Mexico’s Yucatan
Peninsula, the site of the presumed meteorite impact,
over 1500 km away from Site 1049. The thin, rusty brown
layer and the dark gray layer of bioturbated nannofossil
ooze above it passes upwards into white nannofossil
ooze of early Tertiary age, when survivors of the fireball
repopulated the oceans. Notably, the dark gray ooze
atop the rusty horizon contains only a few species of
Flowchart for K-2 – the E&D and CA&F bubbles should be bolder than the others as that is where most students will be working. The text should be modified to read:
E&D: Making observations Asking questions Sharing observations and ideas
Testing: Recording observations Interpreting observations – What is different? What is the same? Using observations to tell what made me think that… Changing what I thought after more observations
CA&F Talking about our observations and ideas Listening to classmates Having others try your investigation Recording in science notebooks Coming up with new questions and ideasB&O Learning more Answering questions
Anna:No arrowsChange to “Explaining what my observations make me think”Change to “Discussing with classmates”
Using observations to tell what mademe think that …
This science flowchart has been modified for grades K–2
Recordingobservations
Satisfyingcuriosity
Answeringquestions
Learningmore
Changing what Ithought after more
observations
Interpretingobservations—
What is different?What is the same?
Makingobservations
Askingquestions
Sharingobservations
and ideas
Explaining what myobservations make
me think
Talking aboutour ideas
Listening toclassmates
Having otherstry your
investigation
Coming up withnew questions
and ideas
DRAFT: Please do not distribute.www.understandingscience.org
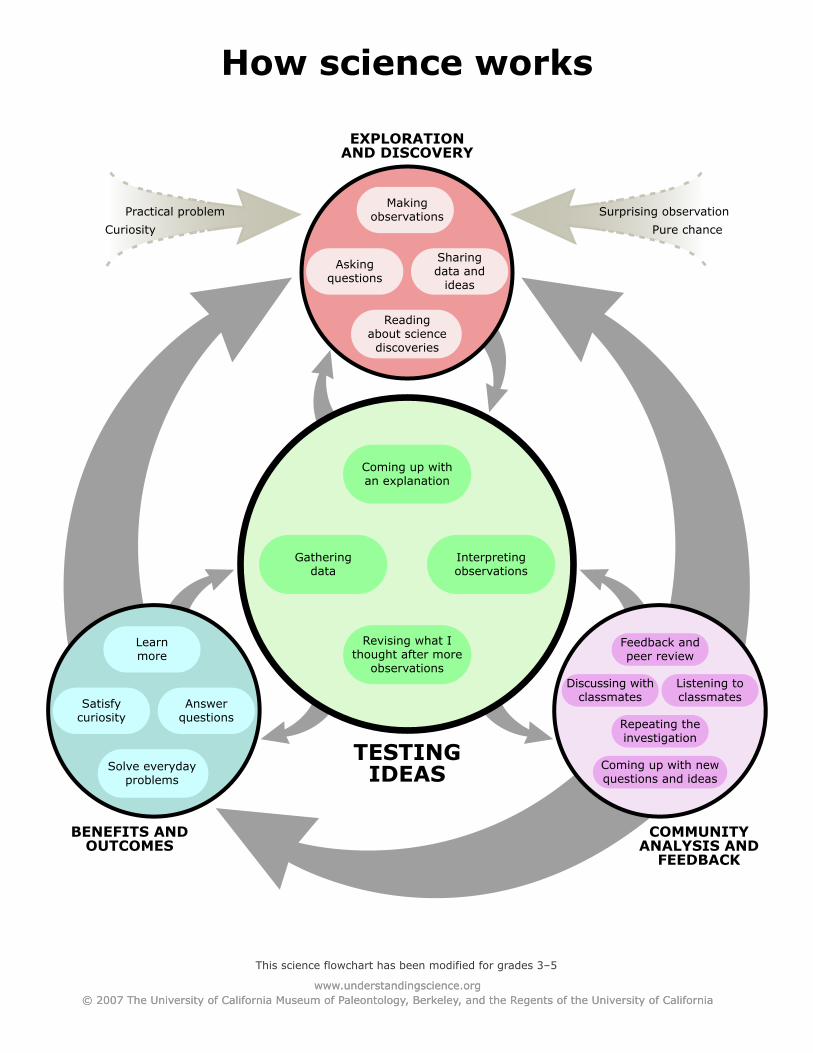
Flowchart for 3-5 – the text should be modified to read:
E&D: Making observations Asking questions Sharing data and ideas Reading about science discoveries Testing: Making a hypothesis Gathering data Interpreting observations Revising what I thought after more observations Revising hypothesis or making a new one
CA&F Feedback and peer review Discussion with classmates Listening to classmates Repeating the investigation Coming up with new questions and ideasB&O Learn more Answer questions Satisfy curiosity Solve everyday problems
Flowchart for K-2 – the E&D and CA&F bubbles should be bolder than the others as that is where most students will be working. The text should be modified to read:
E&D: Making observations Asking questions Sharing observations and ideas
Testing: Recording observations Interpreting observations – What is different? What is the same? Using observations to tell what made me think that… Changing what I thought after more observations
CA&F Talking about our observations and ideas Listening to classmates Having others try your investigation Recording in science notebooks Coming up with new questions and ideasB&O Learning more Answering questions
Using observations to tell what mademe think that …
3-5:arrows into the process: we might want to get rid of new technology(covered by surprising observation here) and personal motivation (coveredby curiosity here). Might also consider replacing serendipity with"chance" or "an accident." Or we could get rid of them completely
top circle: the placement of the bubbles within the circle looks a littlelike there is an order to them or a reason for their placement. could youarrange the mini-bubbles as in Benefits and Outcomes?
middle circle: revising hypothesis and revising what i thought seemredundant. If we're ok with using the word hypothesis at this level,maybe we could replace those two with: deciding how good a hypothesis is(or evaluating hypothesis), revising hypothesis, making a new hypothesis. If we don't want to use the word hypothesis, we could say instead:supporting ideas, changing my mind, coming up with a new idea.
lower right circle: could you arrange the mini-bubbles as in Benefits andOutcomes? Also, to parallel the others, could we phrase the discussionbubble "discussing with classmates?"
K-2:Arrows in: may not be necessary at all here, but if we do keep them, Ithink we should simplify as in the 3-5 chart suggestion.
middle circle: I like the sentiment of all these bubbles, but maybe alittle rewording would make their meaning clearer: how about replacingthe rightmost bubble with "explaining what my observations make me think." Might also consider simplifying the bottom one to "changing my mind"--butmaybe not, I am also ok with this one as is. Also, the spacing of thebubbles in the vertical direction is not even here.
lower right circle: could you arrange the mini-bubbles as in Benefits andOutcomes? Also, to parallel the others, could we phrase the discussionbubble "discussing with classmates?"
This science flowchart has been modified for grades 3–5
Coming up withan explanation
Answerquestions
Satisfycuriosity
Learnmore
Solve everydayproblems
Feedback andpeer review
Discussing withclassmates
Listening toclassmates
Repeating theinvestigation
Coming up with newquestions and ideas
Revising what Ithought after more
observations
Gatheringdata
Makingobservations
Askingquestions
Sharingdata and
ideas
Readingabout sciencediscoveries
Interpretingobservations
Curiosity
Practical problem Surprising observation
Pure chance
Supportive, contradictory, surprisingor inconclusive data may...