Page 1
ABSTRACT
Using the Health Belief Model to Understand Cholesterol and Blood Pressure Screenings
in Rural Populations in Central Texas
Tiffany A. Rose, M.P.H.
Thesis Chairperson: M. Renée Umstattd Meyer, Ph.D.
The purpose of this research was to develop and test Health Belief Model (HBM)
construct scales to understand cholesterol screening behavior in rural communities in
central Texas. A survey was developed using modified verisons of cancer screening
surveys. The resulting 67-item survey instrument was disseminated to three rural
communities through school districts, churches, and community programs. Of the 1,125
survey dissemenated, 170 were returned (15.1%). Exploratory Factor Analysis
confirmed the following scales: susceptibility (7 items), severity (3 items), benefits (4
items), barriers (6 items), and self-efficacy (6 items). Logistic regression was conducted
for meeting cholesterol guidelines and intention to screen using HBM constructs and
demographic and health variables. The final model for meeting cholesterol guidelines
included perceived barriers, insurance, age, disease index, and BMI. The final model for
intention included race/ethnicity, age, and BMI. This study supports the use of HBM
constructs to understand cholesterol screening behavior in rural communities.
Page 2
Page bearing signatures is kept on file in the Graduate School.
Using the Health Belief Model to Understand Cholesterol and Blood Pressure Screening
in Rural Communities in Central Texas
by
Tiffany A. Rose, B.S.
A Thesis
Approved by the Department of Health, Human Performance, and Recreation
___________________________________
W. Dale Connally Ph.D., Chairperson
Submitted to the Graduate Faculty of
Baylor University in Partial Fulfillment of the
Requirements for the Degree
of
Master of Public Health
Approved by the Thesis Committee
___________________________________
M. Renee Umstattd Meyer, Ph.D., Chairperson
___________________________________
Eva I. Doyle, Ph.D.
___________________________________
Mark F. Taylor, Ph.D.
Accepted by the Graduate School
May 2012
___________________________________
J. Larry Lyon, Ph.D., Dean
Page 3
Copyright © 2012 by Tiffany A. Rose
All rights reserved
Page 4
iii
TABLE OF CONTENTS
LIST OF FIGURES v
LIST OF TABLES vi
LIST OF ABBREVIATIONS viii
LIST OF TERMS x
ACKNOWLEDGMENTS xi
Chapters
I. INTRODCUTION 1
Purpose and Significance
Research Questions
Study Overview
Assumptions
Limitations
Public Health Benefits
II. LITERATURE REVIEW 6
Cholesterol Levels
Importance of Theory
Cholesterol Screening
General Screening Behaviors
Assessment Battery
Conclusion
III. METHODOLOGY 37
Introduction
Purpose
Research Questions
Participants
Procedures
Statistical Analysis
IV. RESULTS 58
Research Questions
Demographic Variables
Page 5
iv
V. DISCUSSION AND CONCLUSION 93
Introduction
Research Questions
Discussion
Implications
Future Research
Conclusions
APPENDICES 122
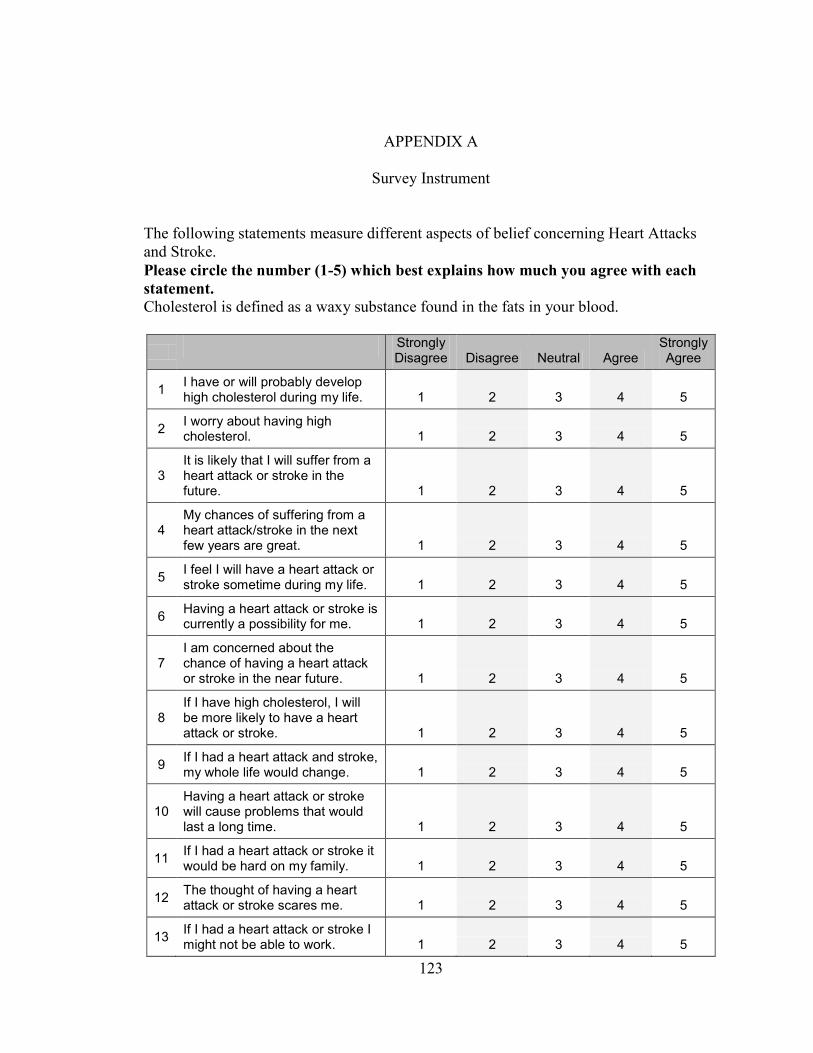
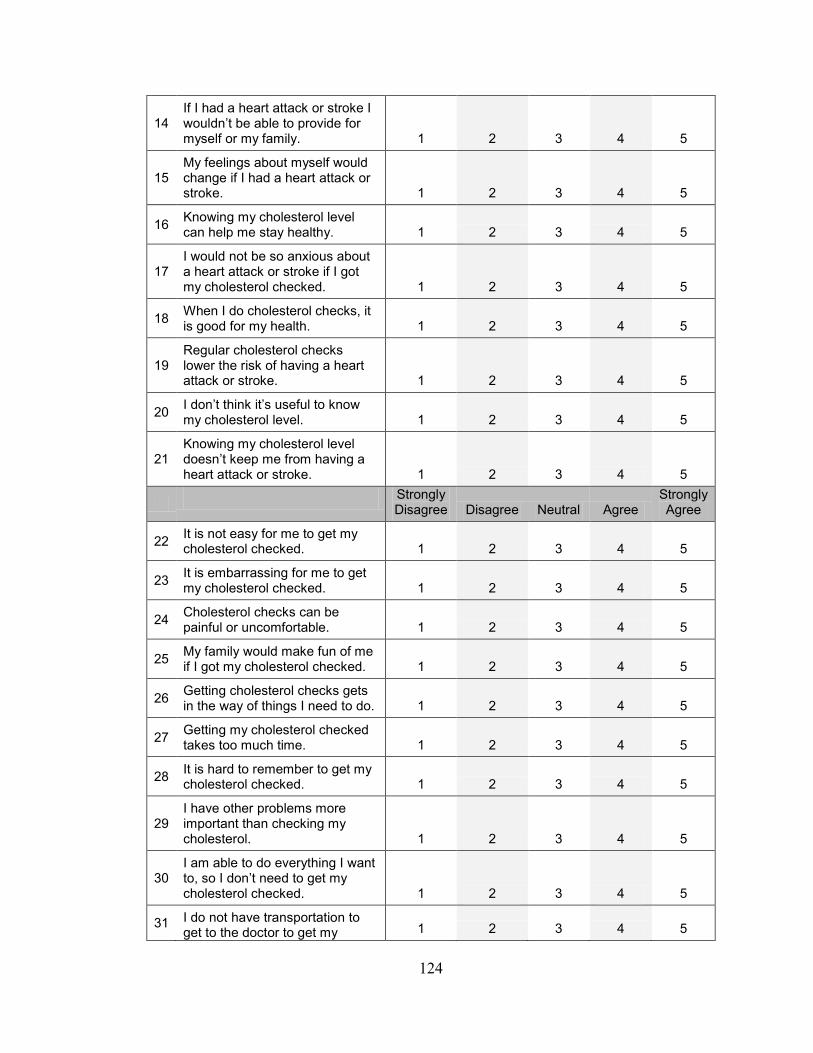
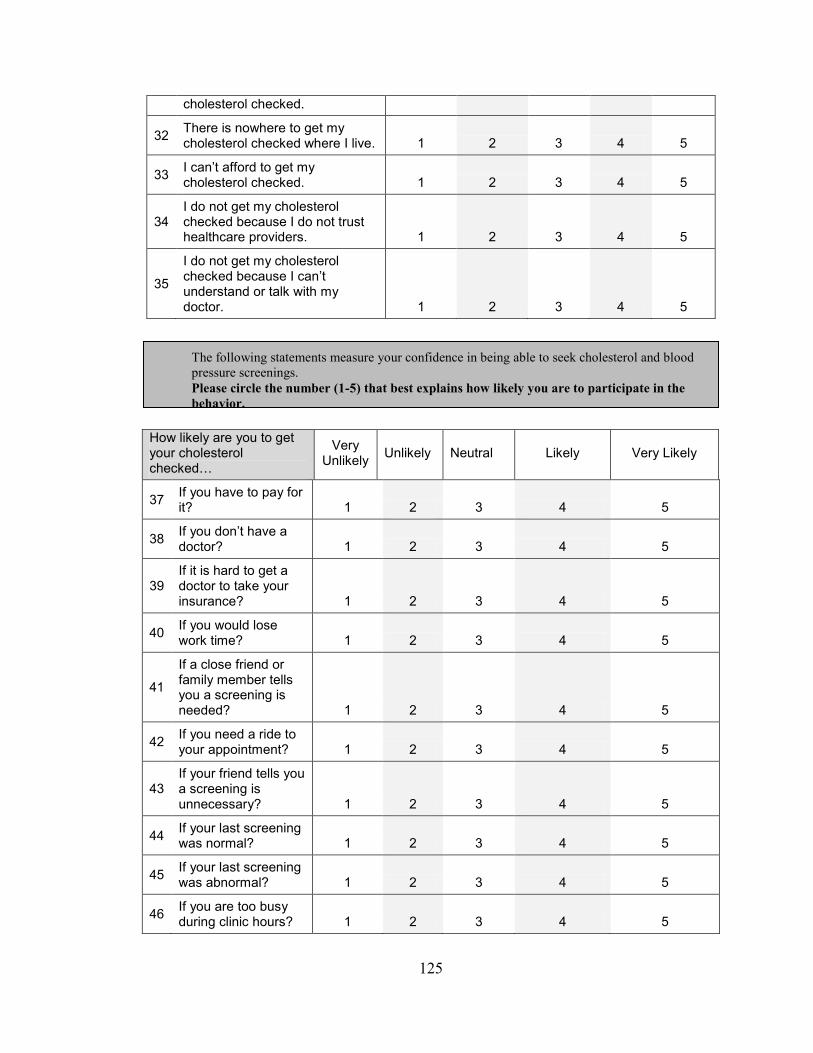
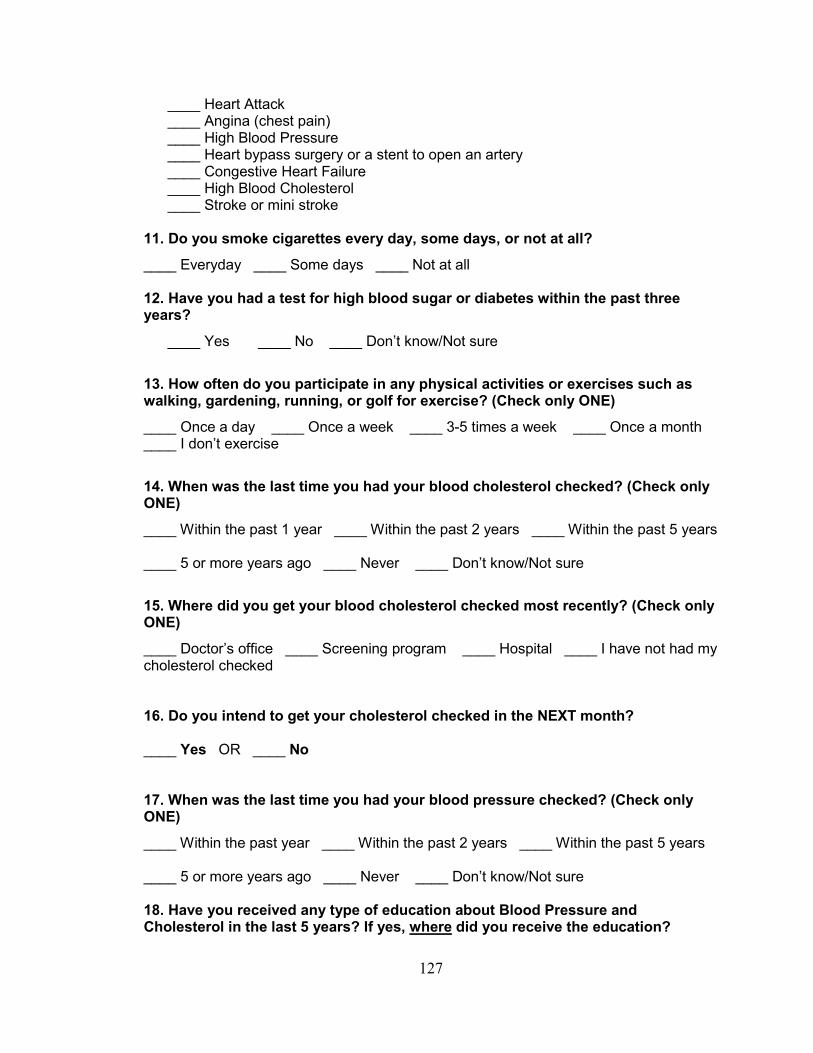
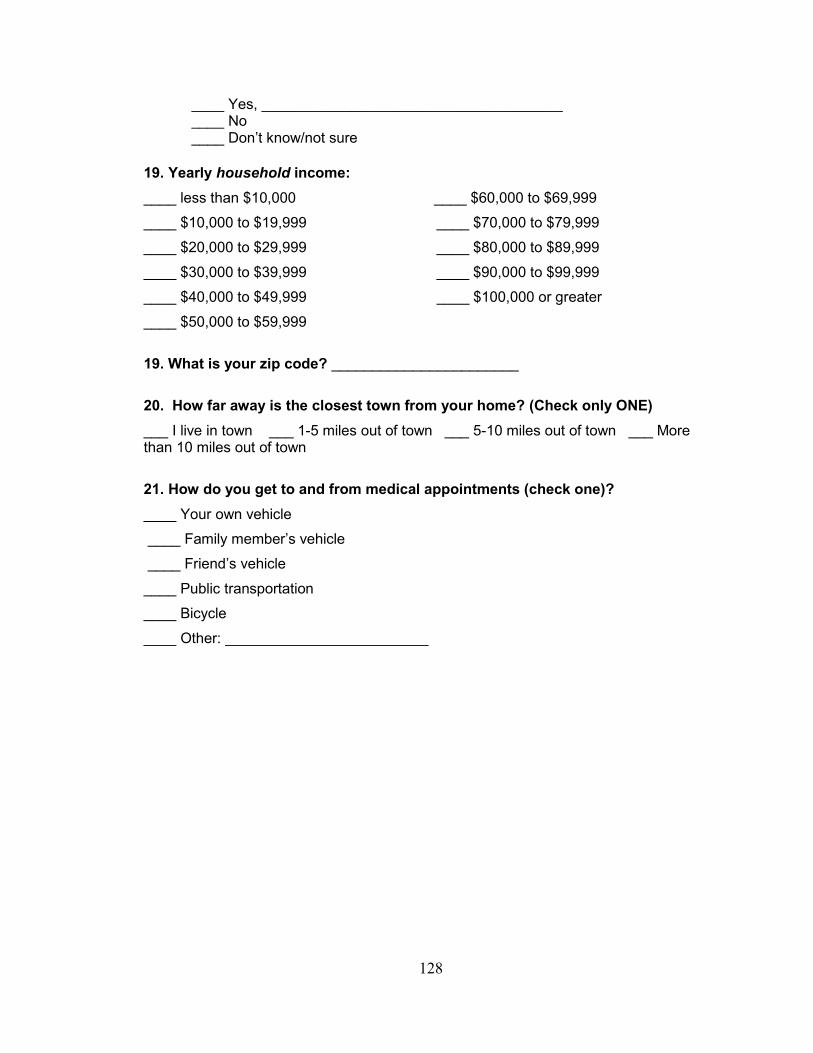
APPENDIX A: Survey Instrument 123
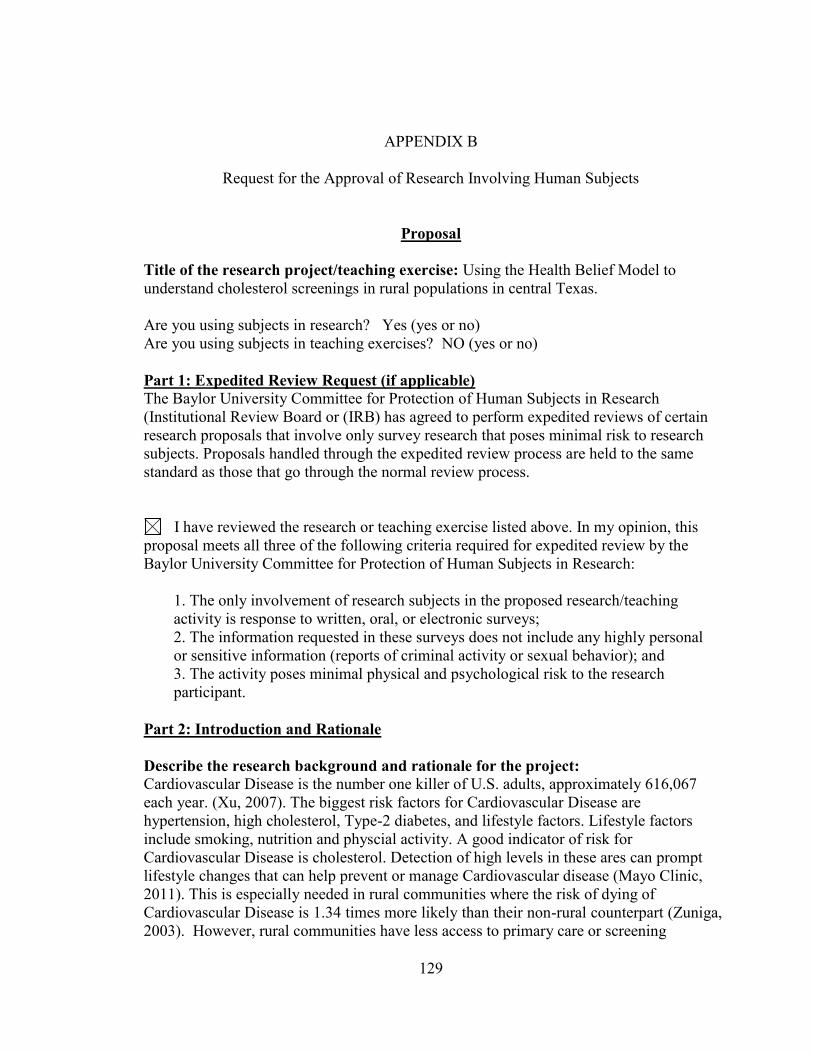
APPENDIX B: Requests for the approval of 129
research involving human subjects
APPENDIX C: Waiver of informed consent 139
BIBLIOGRAPHY 142
Page 6
v
LIST OF FIGURES
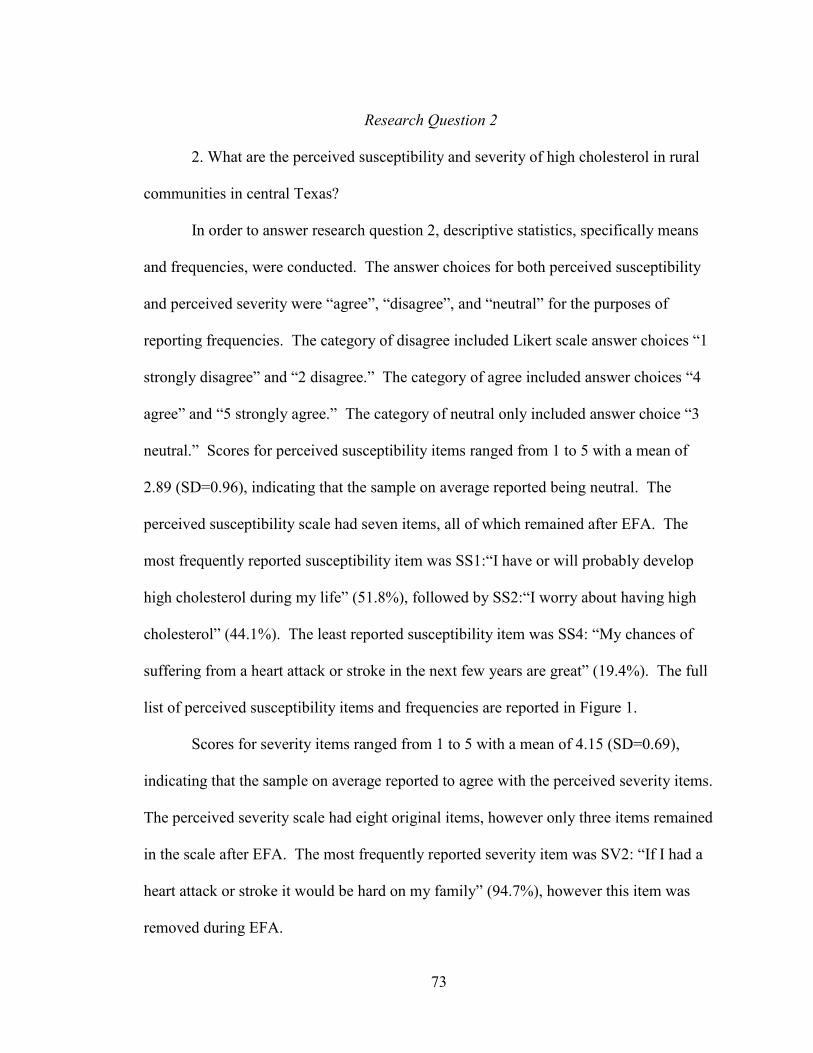
Figure 1: Original Perceived Susceptibility Items and Frequencies 74
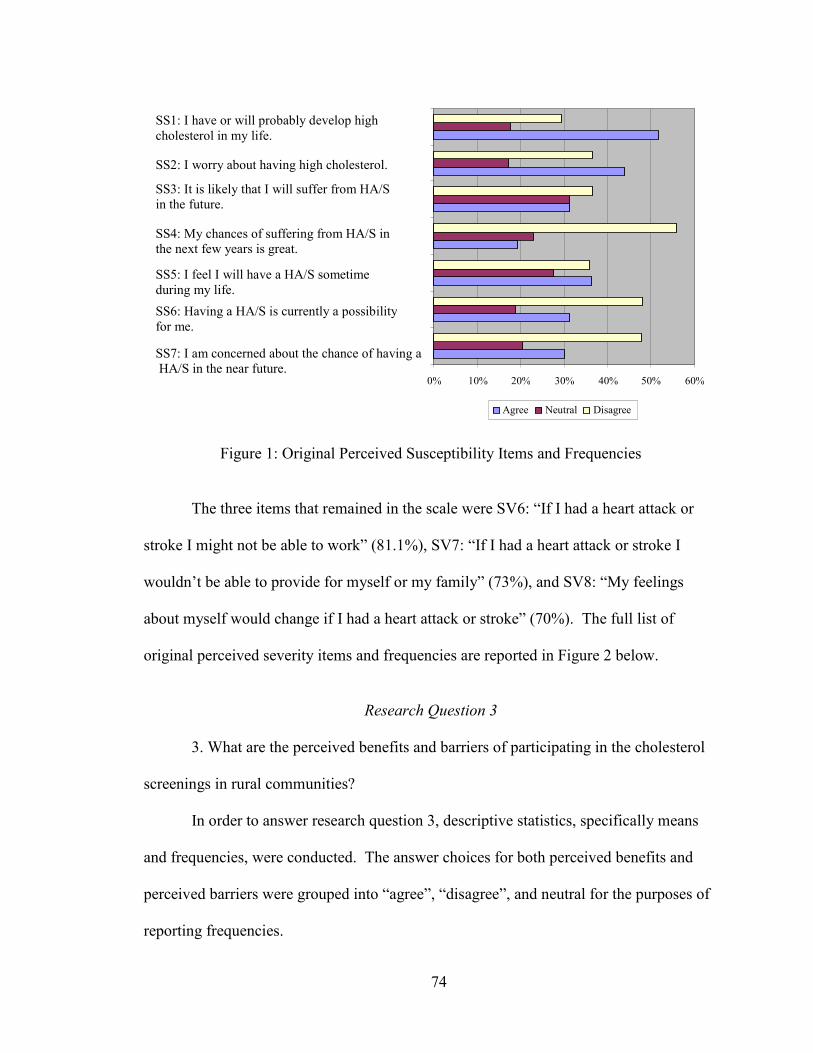
Figure 2: Original Perceived Severity Items and Frequencies 75
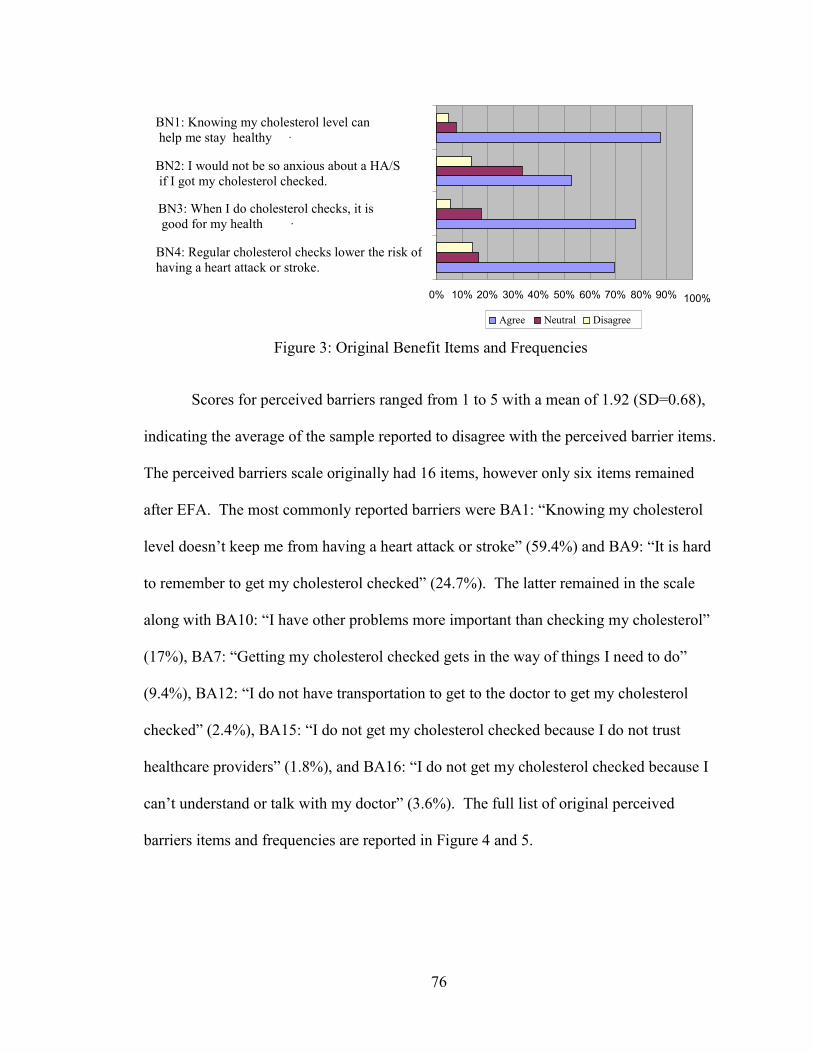
Figure 3: Original Perceived Benefits Items and Frequencies 76
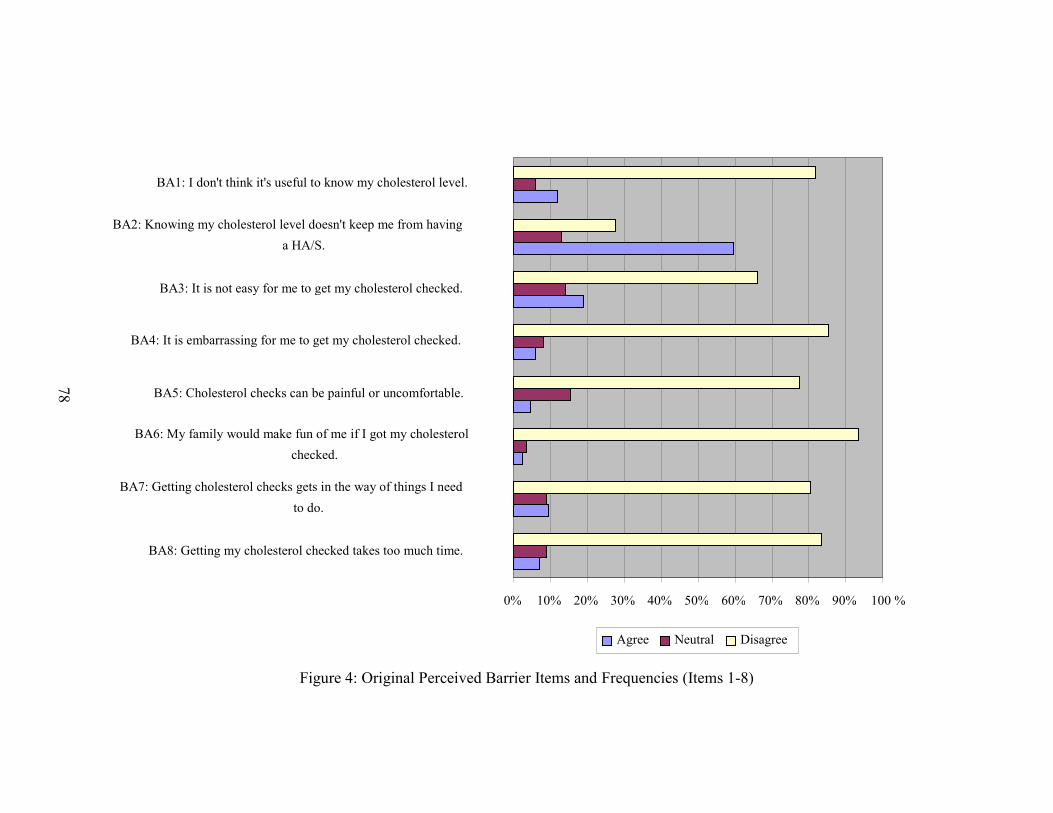
Figure 4: Original Perceived Barriers Items and Frequencies 78
(Items 1-8)
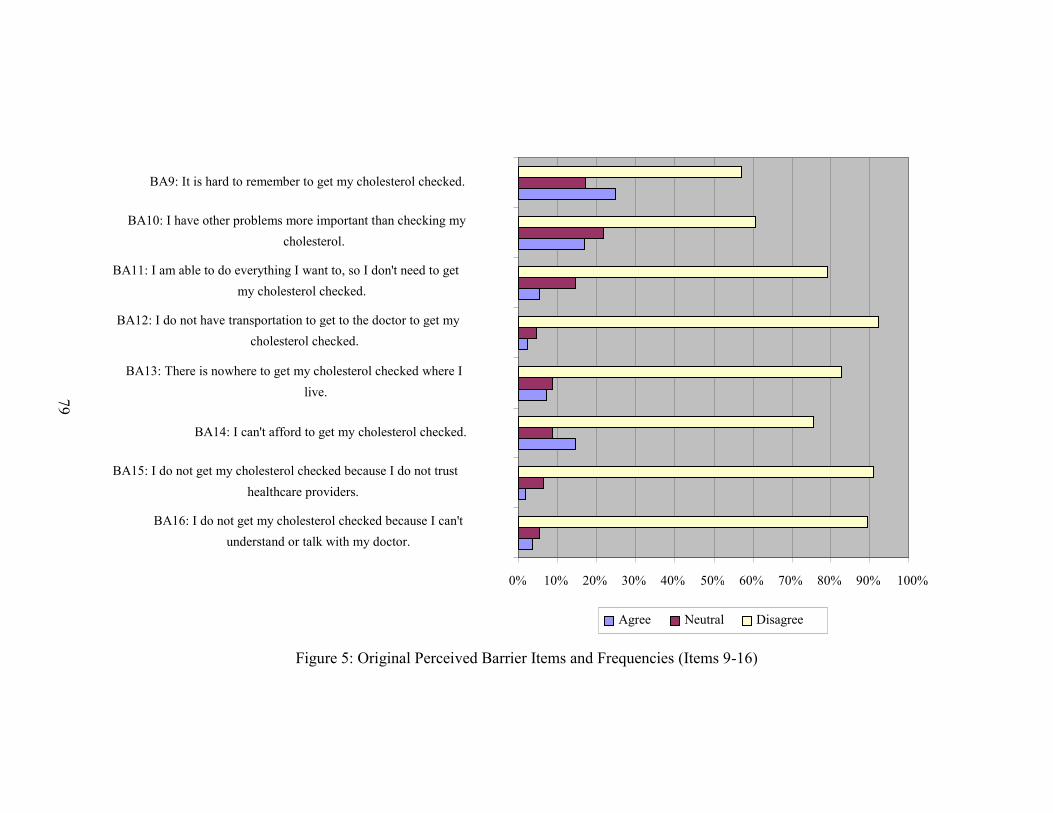
Figure 5: Original Perceived Barriers Items and Frequencies 79
(Items 9-16)
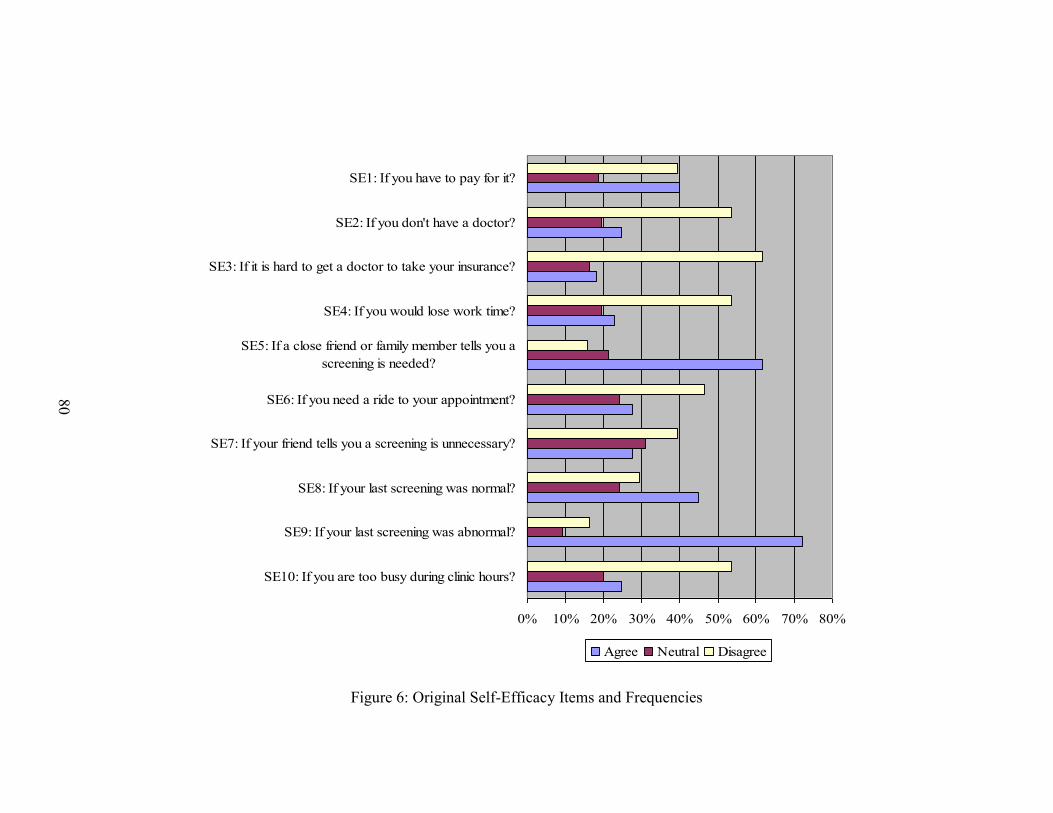
Figure 6: Original Perceived Self-Efficacy Items and Frequencies 80
Page 7
vi
LIST OF TABLES
Table 1: Available HBM Construct Measures for Heart 35
Disease and Screening Behaviors
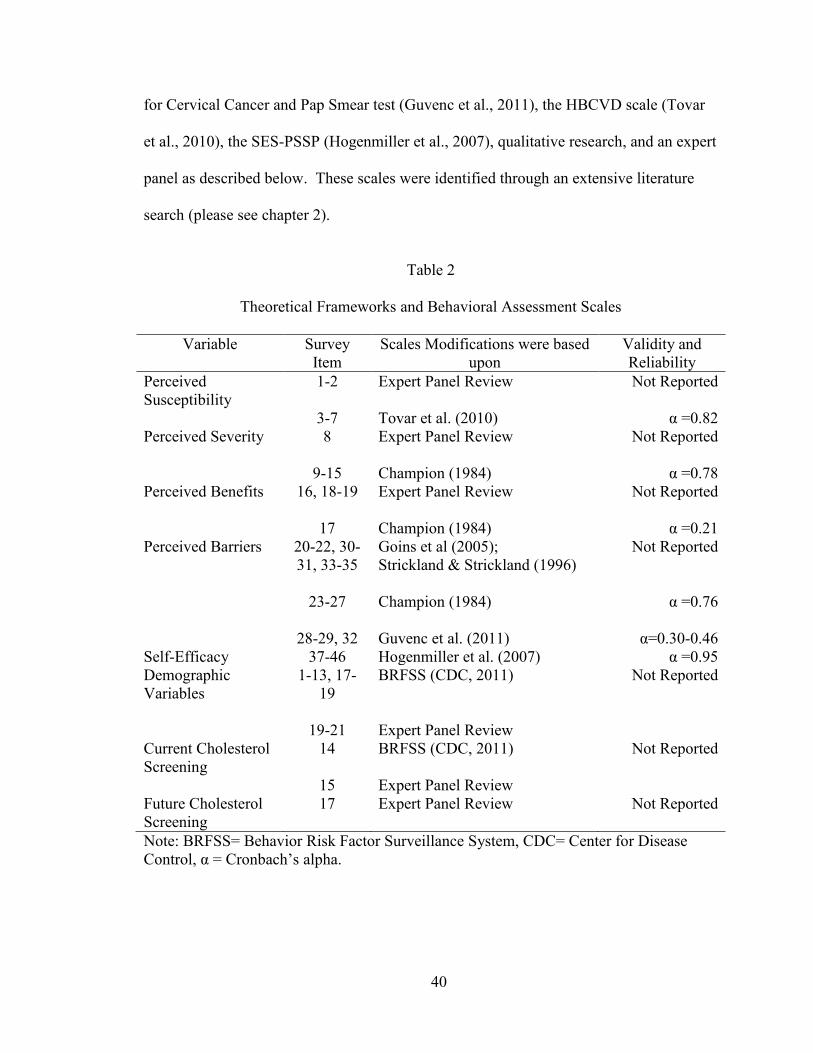
Table 2: Theoretical Framework and Behavioral Assessment 38
Subscales
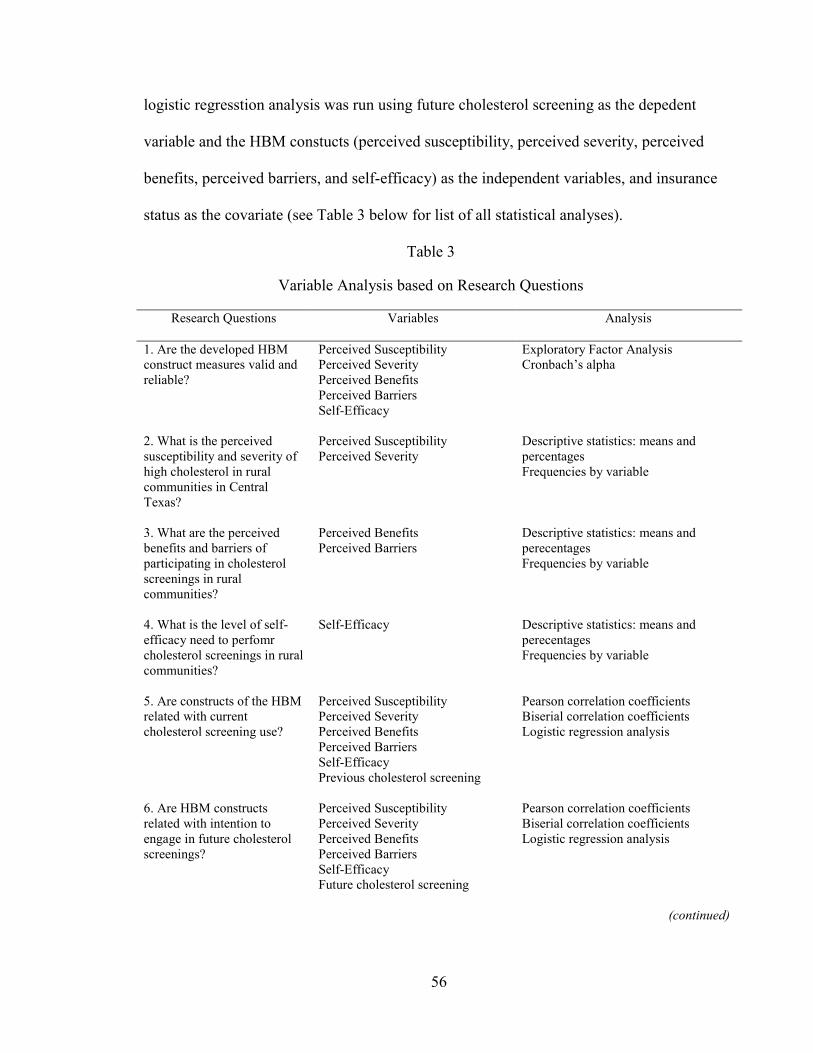
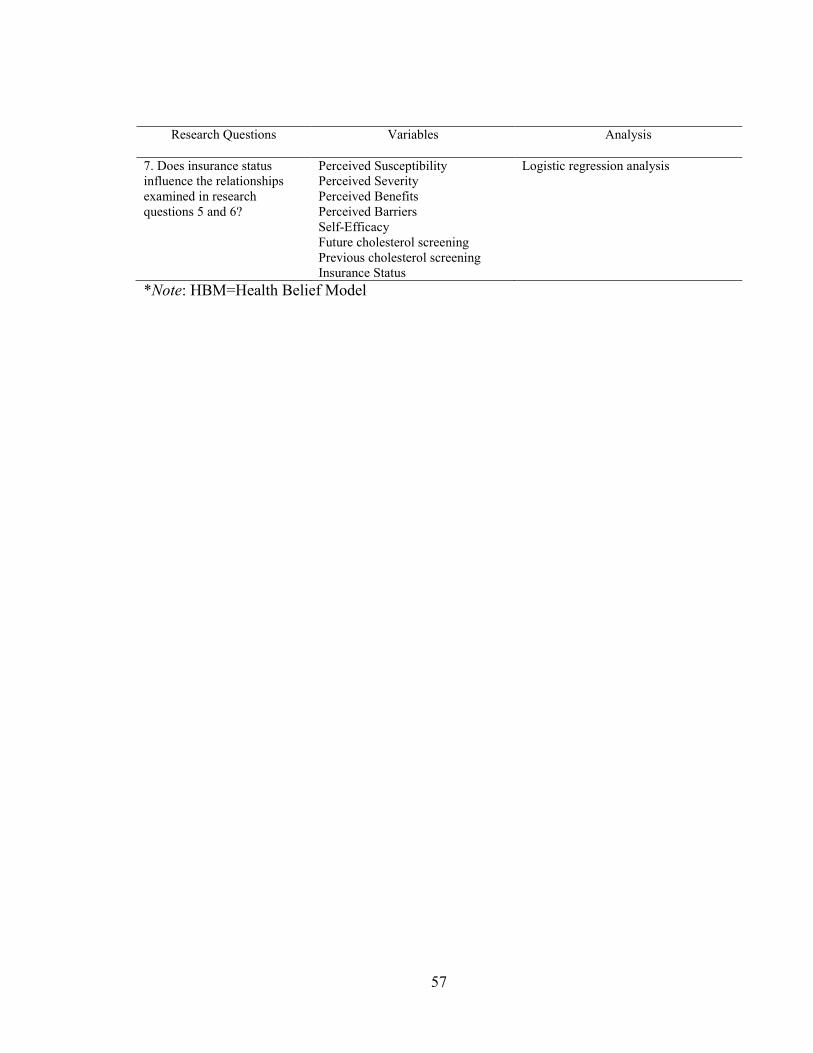
Table 3: Variable Analysis based on Research Questions 56
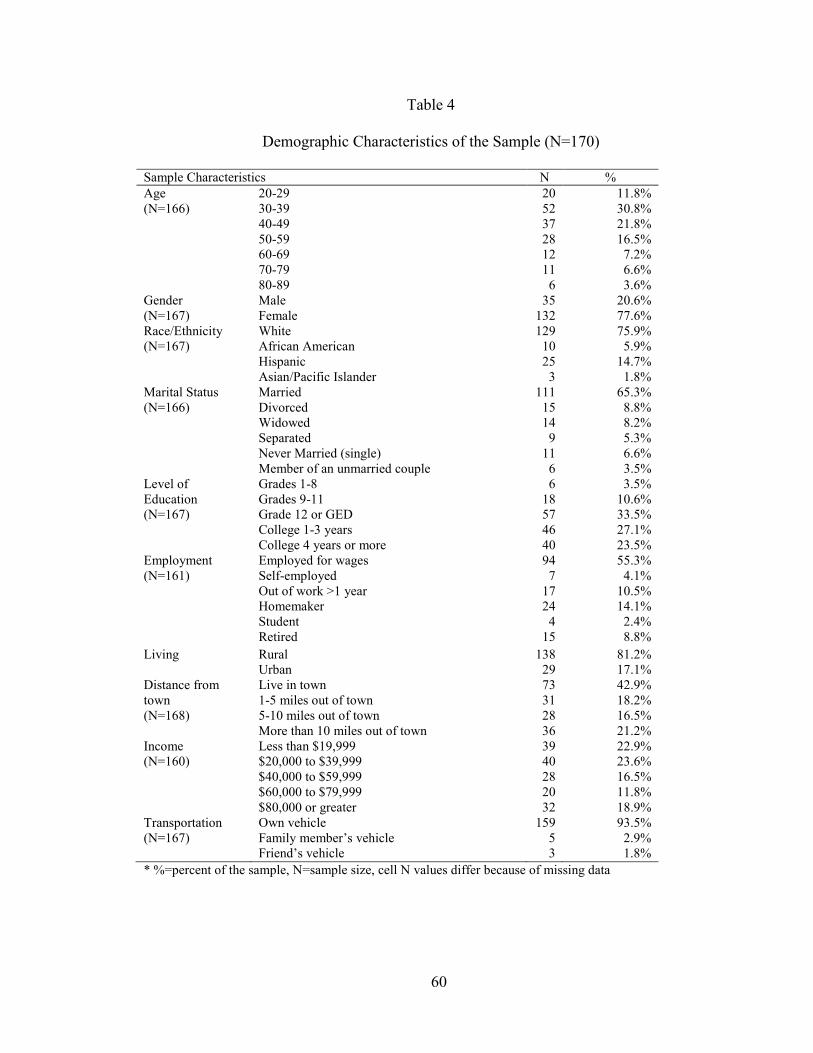
Table 4: Demographic Characteristics of the Sample 60
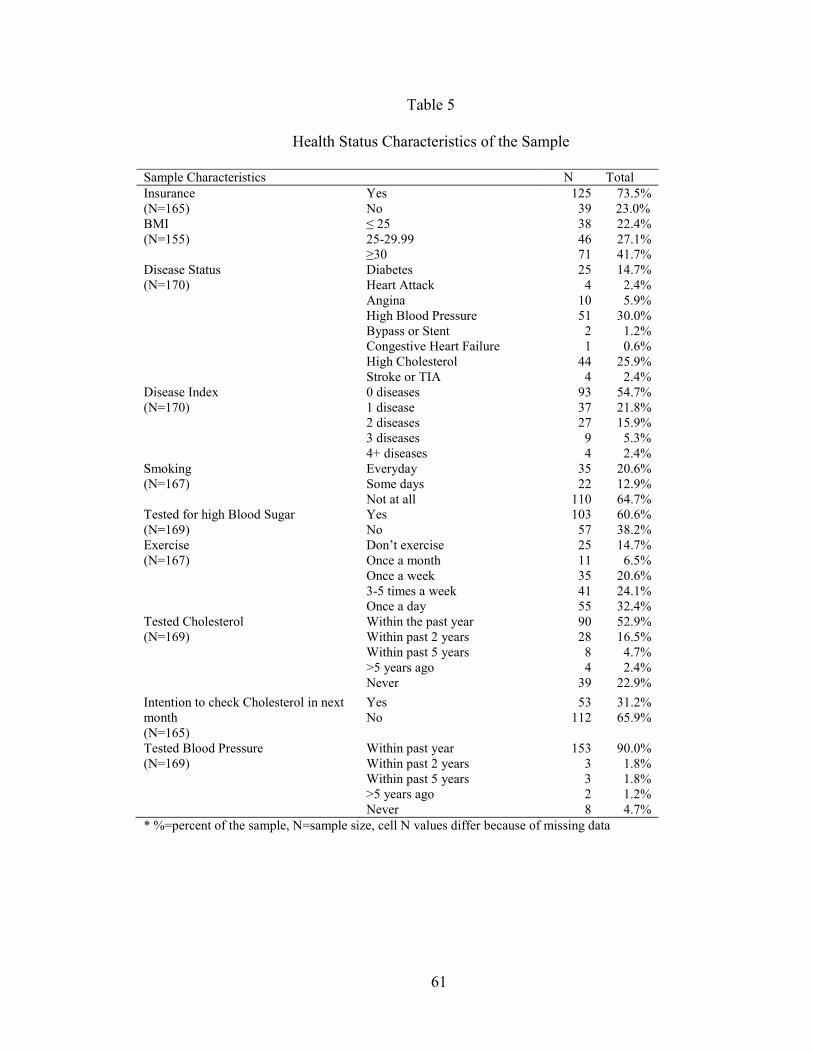
Table 5: Health Status Characteristics of the Sample 61
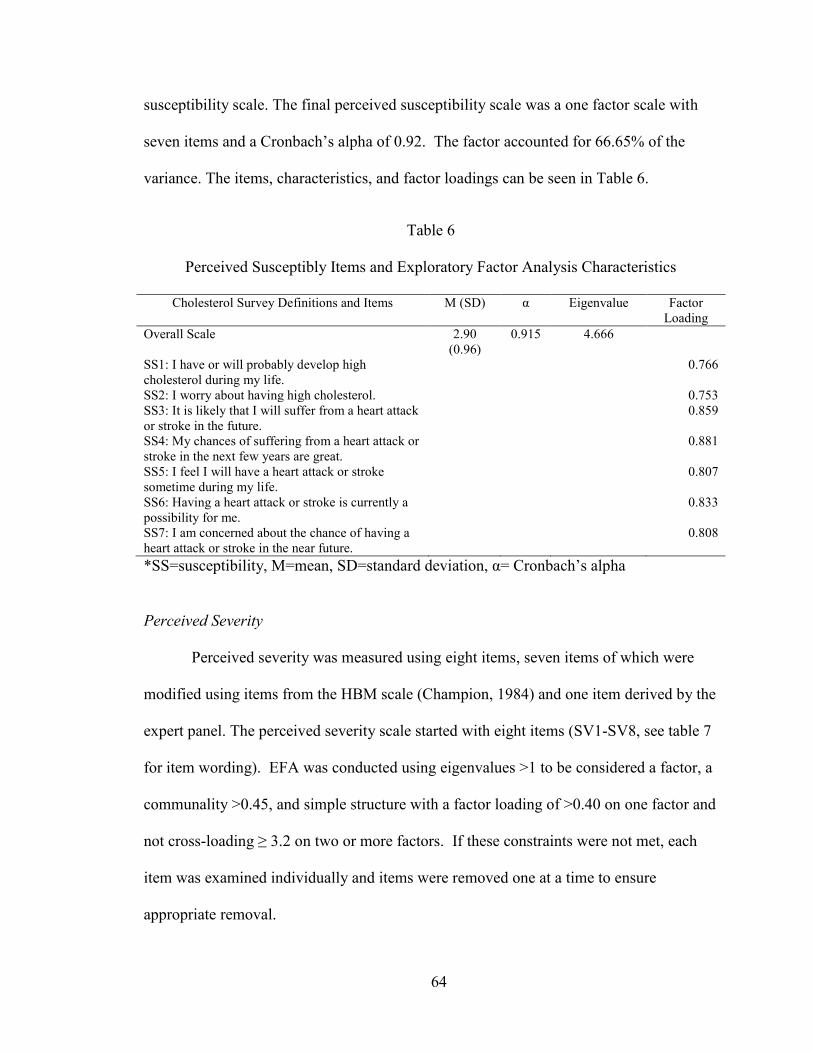
Table 6: Perceived Susceptibility Items and Exploratory 64
Factor Analysis Characteristics
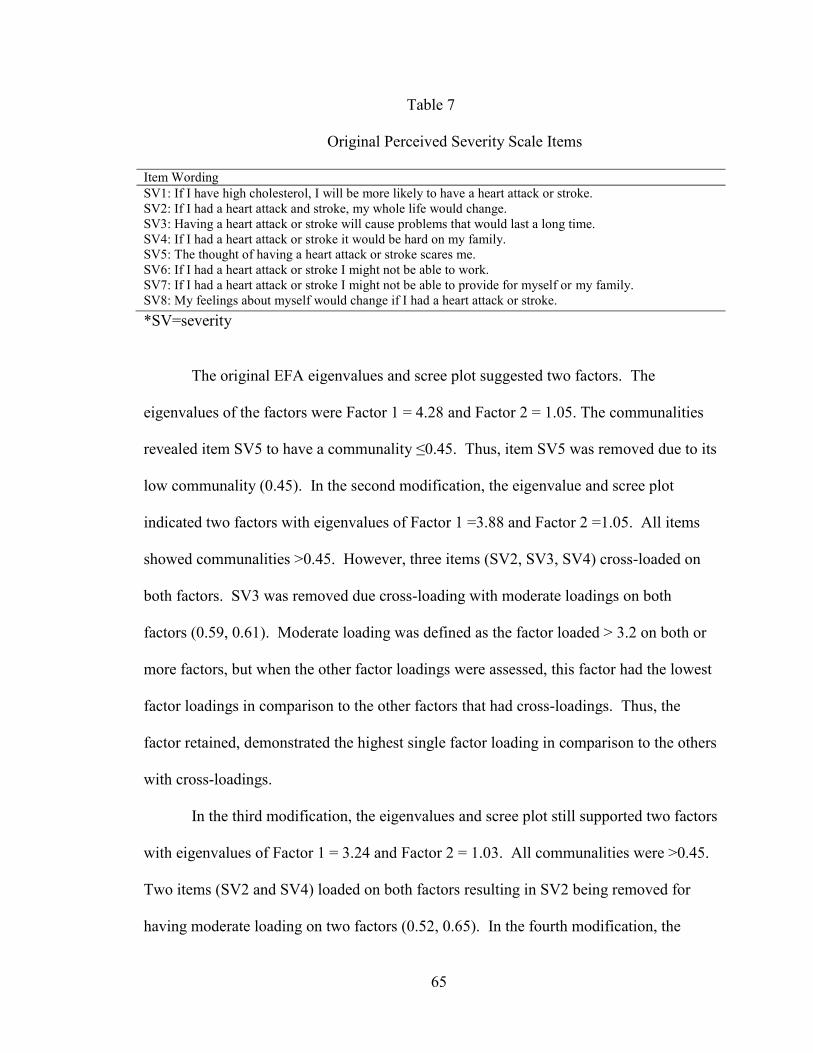
Table 7: Original Perceived Severity Scale Items 65
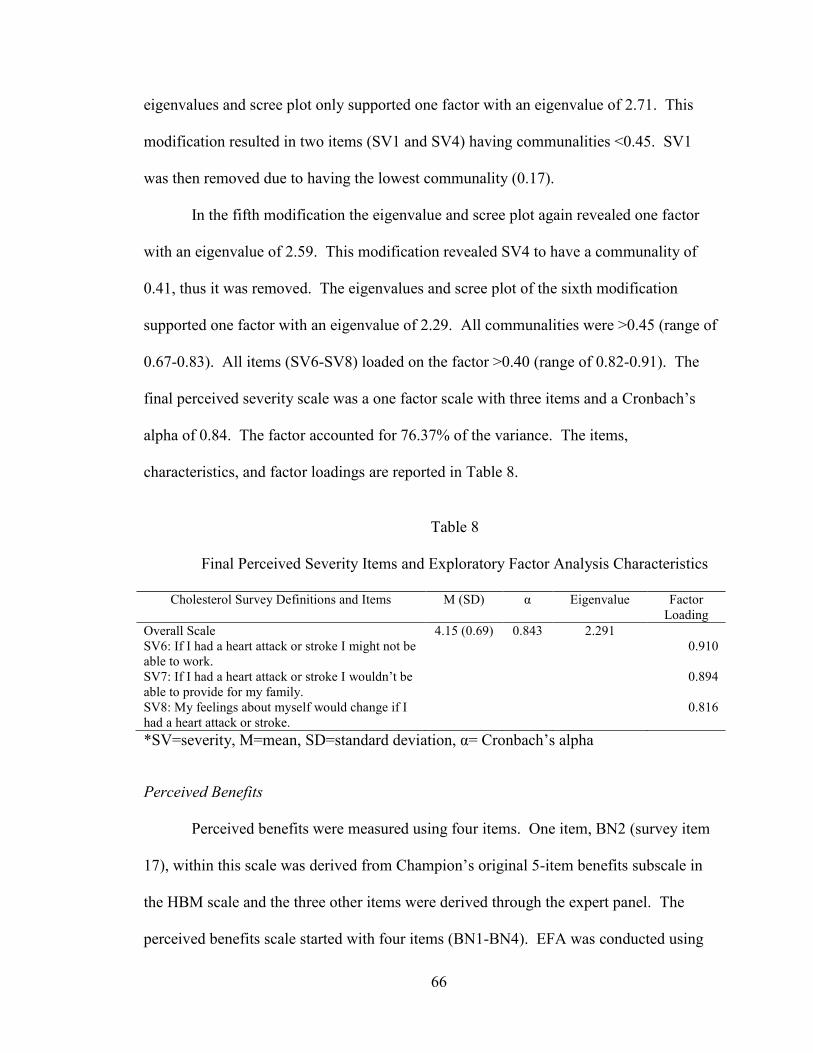
Table 8: Final Perceived Severity Scale Items and Exploratory 66
Factor Analysis Characteristics
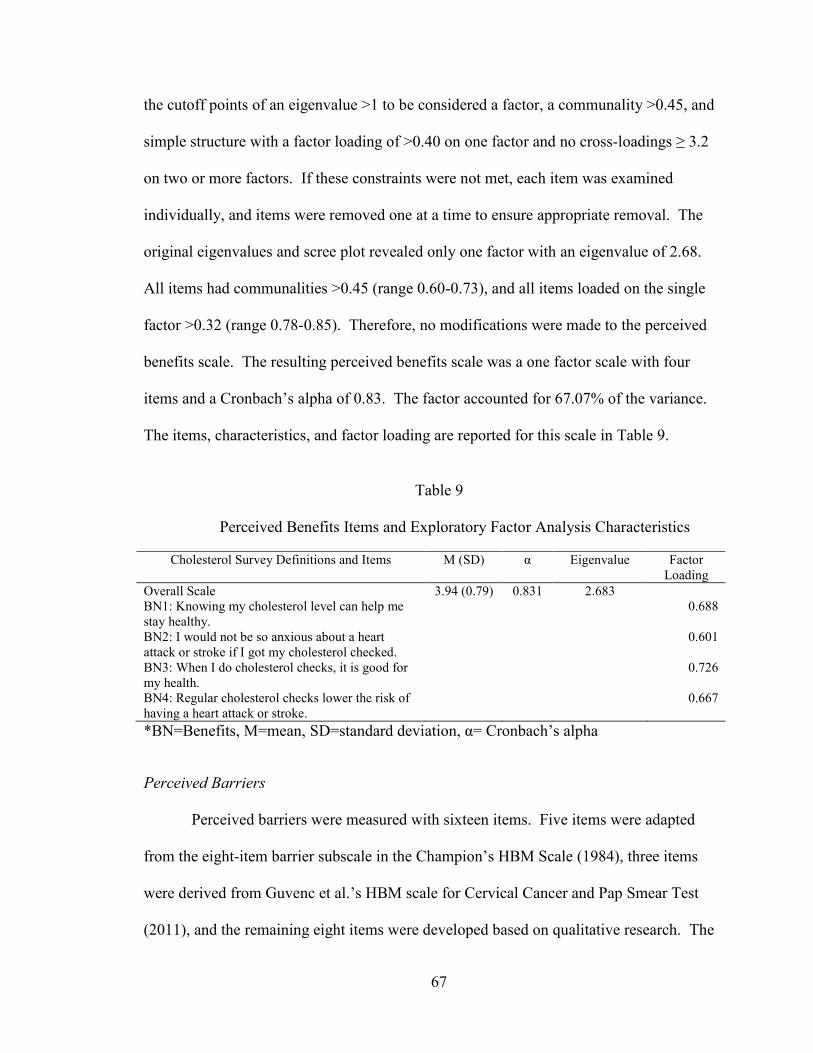
Table 9: Perceived Benefits Items and Exploratory Factor 67
Analysis Characteristics
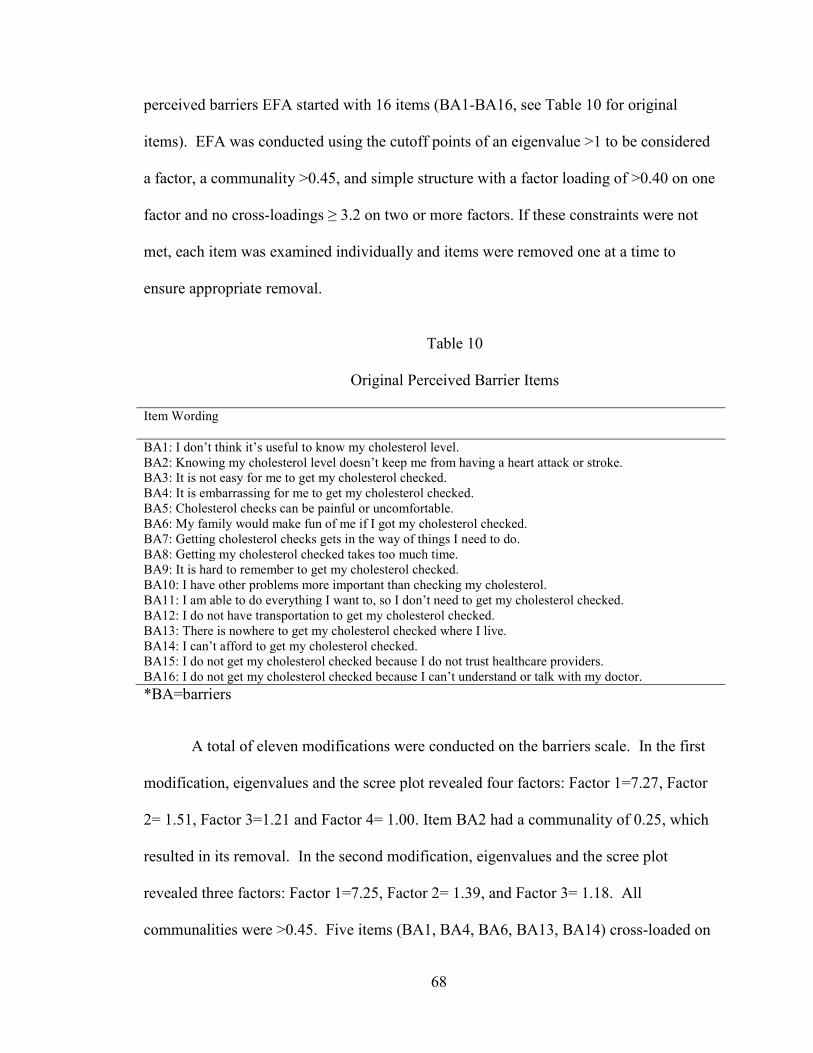
Table 10: Original Perceived Barrier Items 68
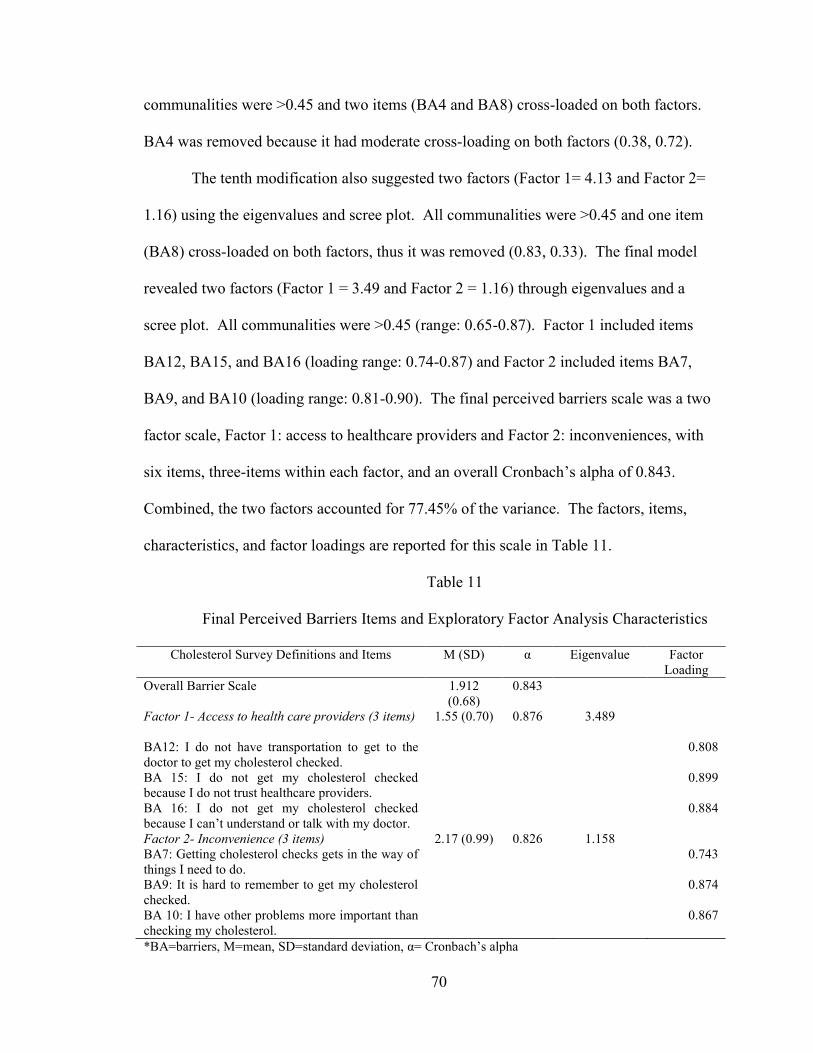
Table 11: Final Perceived Barrier Items and Exploratory
Factor Analysis Characteristics 70
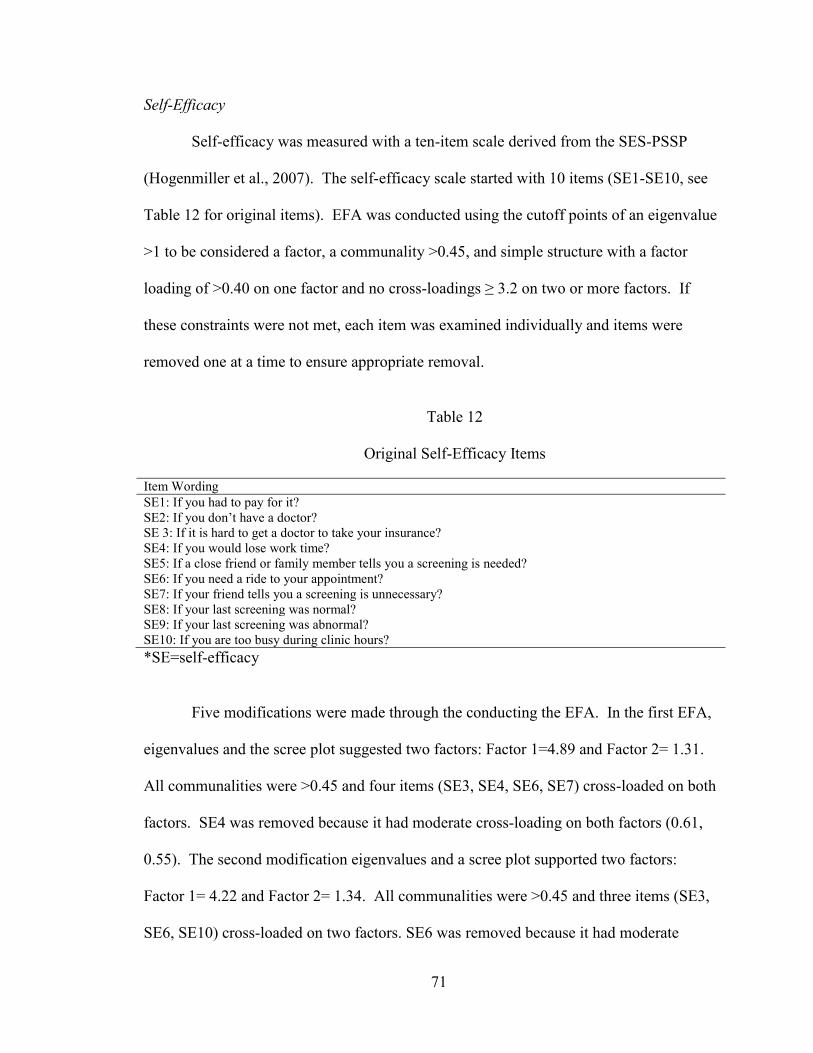
Table 12: Original Self-Efficacy Items 71
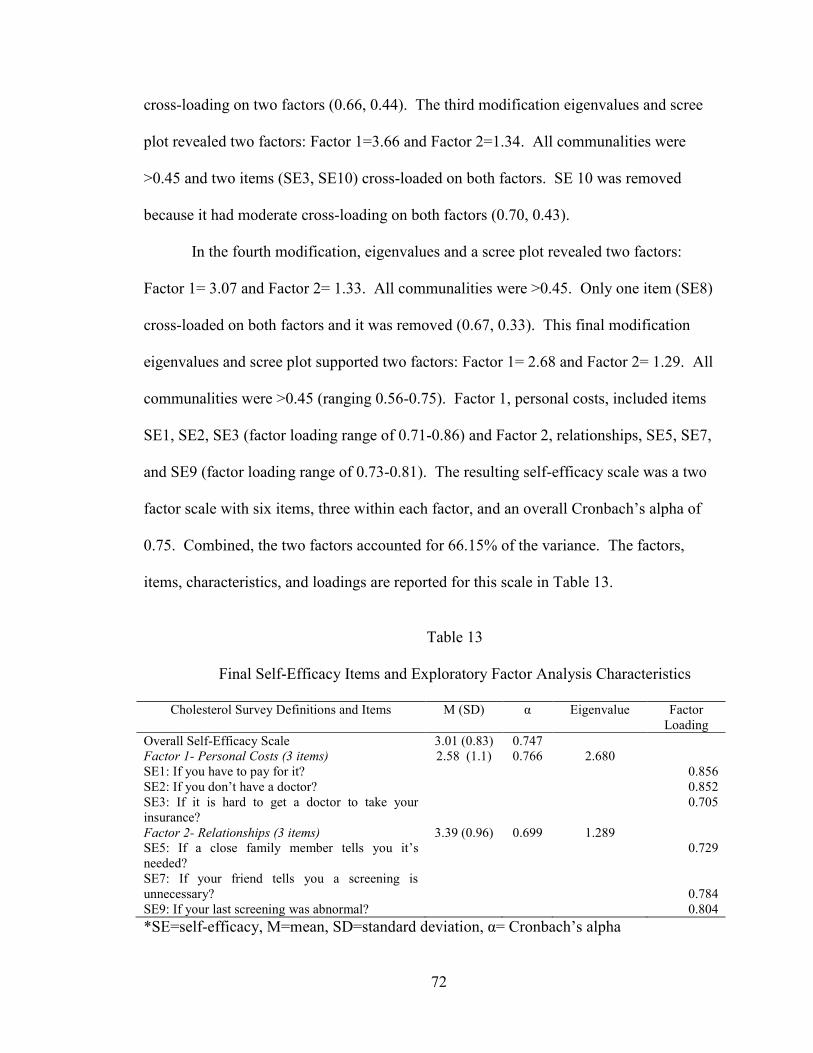
Table 13: Final Self-Efficacy Items and Exploratory 72
Factor Analysis Characteristics
Table 14: Pearson's and Point Biserial Correlations 82
For Current Cholesterol Screening Behavior
Table 15: Logistic Regression Model Examining the 83
Relationship Between HBM Constructs and
Current Cholesterol Screening Behavior
Page 8
vii
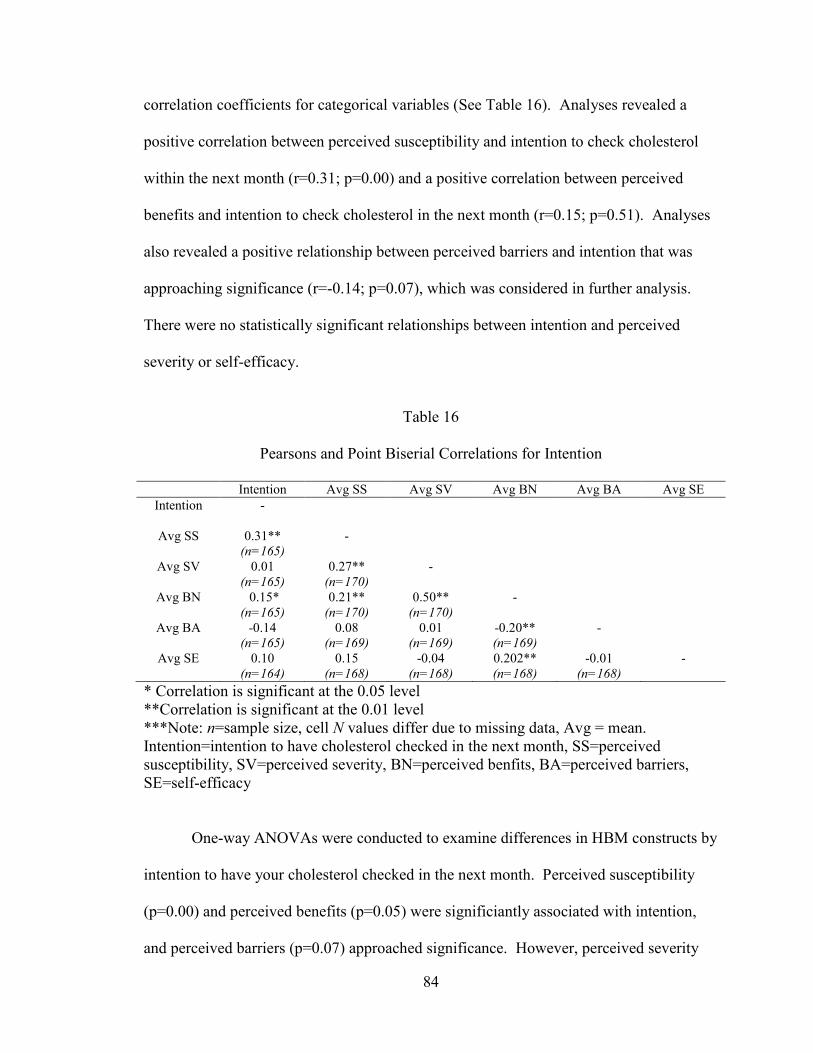
Table 16: Pearson and Point Biserial Correlations 84
For Current Cholesterol Screening Behavior
Table 17: Logistic Regression Model Examining the 86
Relationship Between HBM Constructs and
Intention
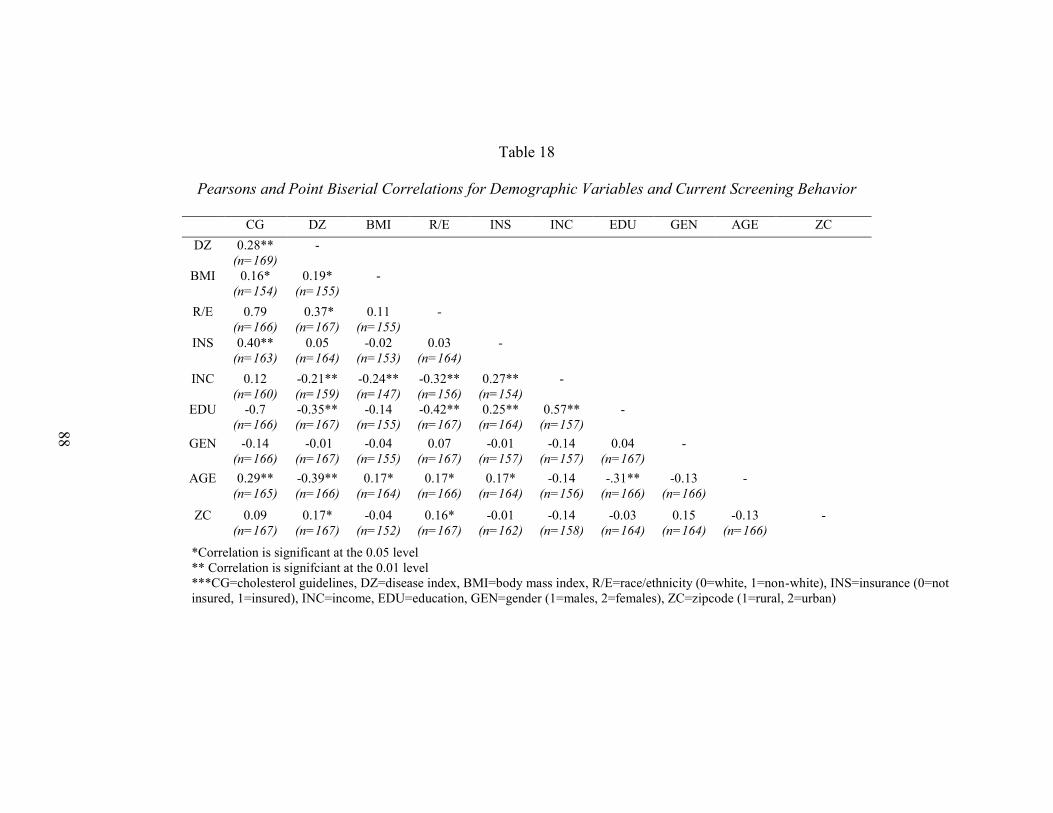
Table 18: Pearson’s and Point Biserial Correlations for 88
Demographic Variables and Current Cholesterol
Screening Behaviors
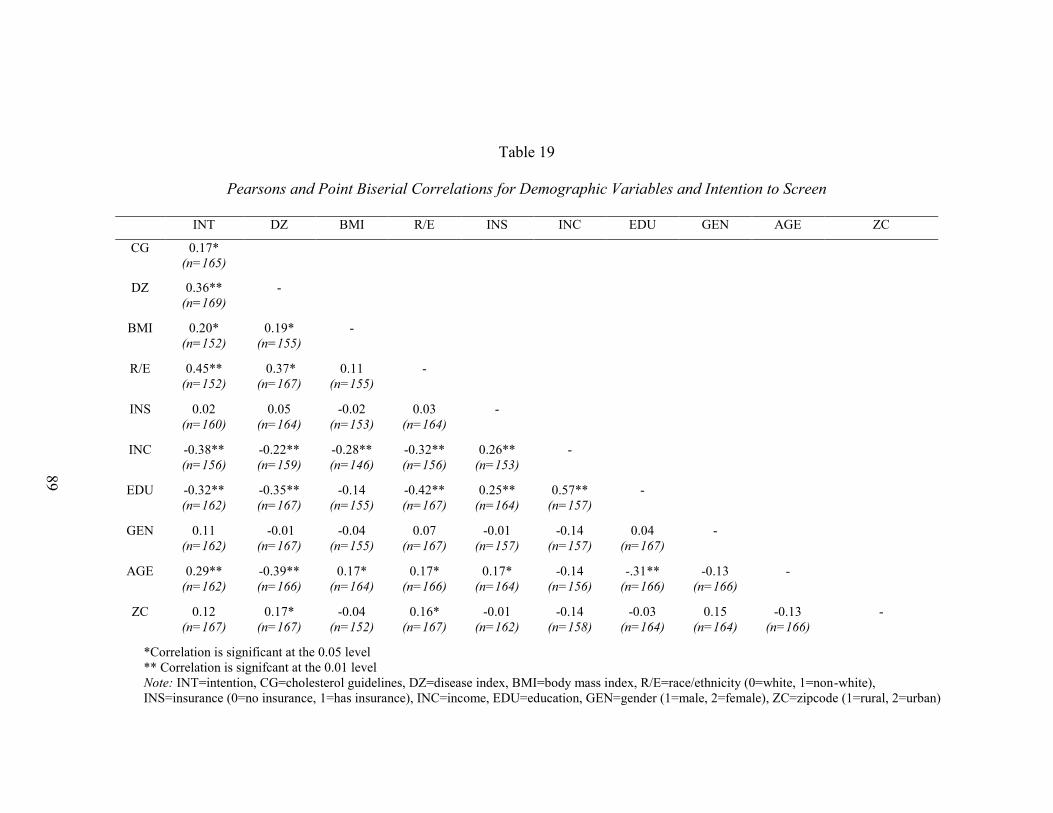
Table 19: Pearson’s and Point Biserial Correlations for 89
Demographic Variables and Intention to Screen
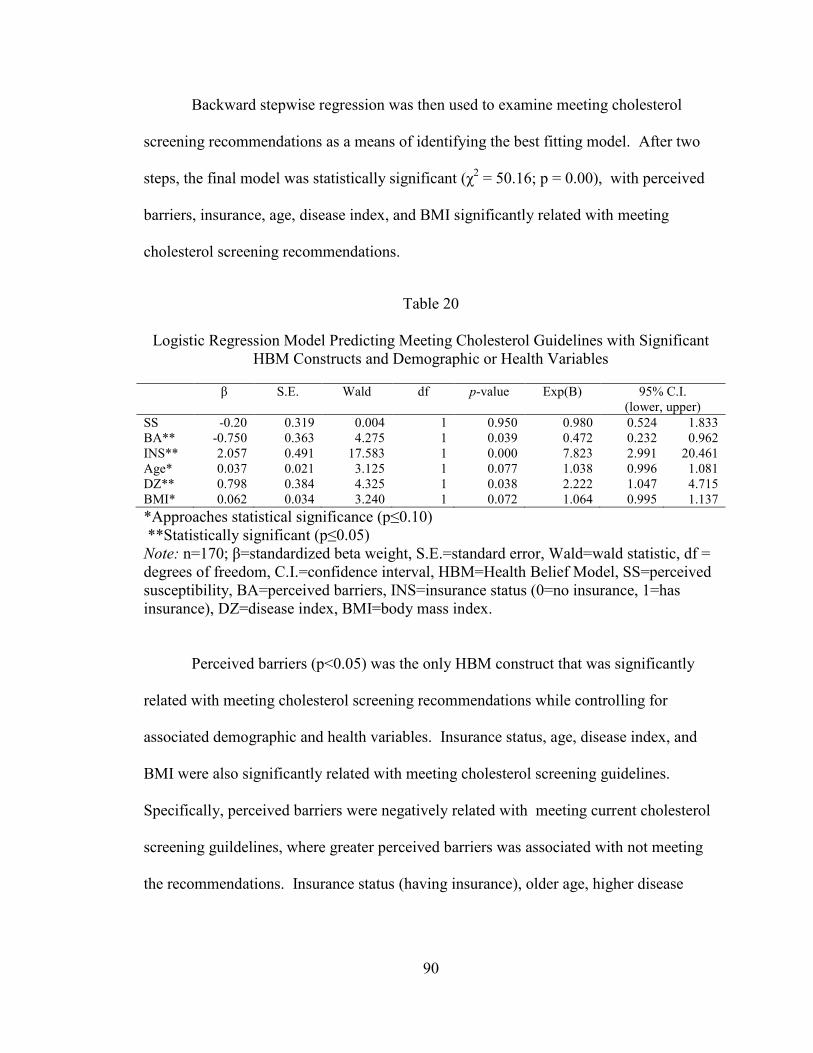
Table 20: Logistic Regression Model Predicting Meeting 90
Cholesterol Guidelines with Significant HBM
Constructs and Demographic and Health Variables
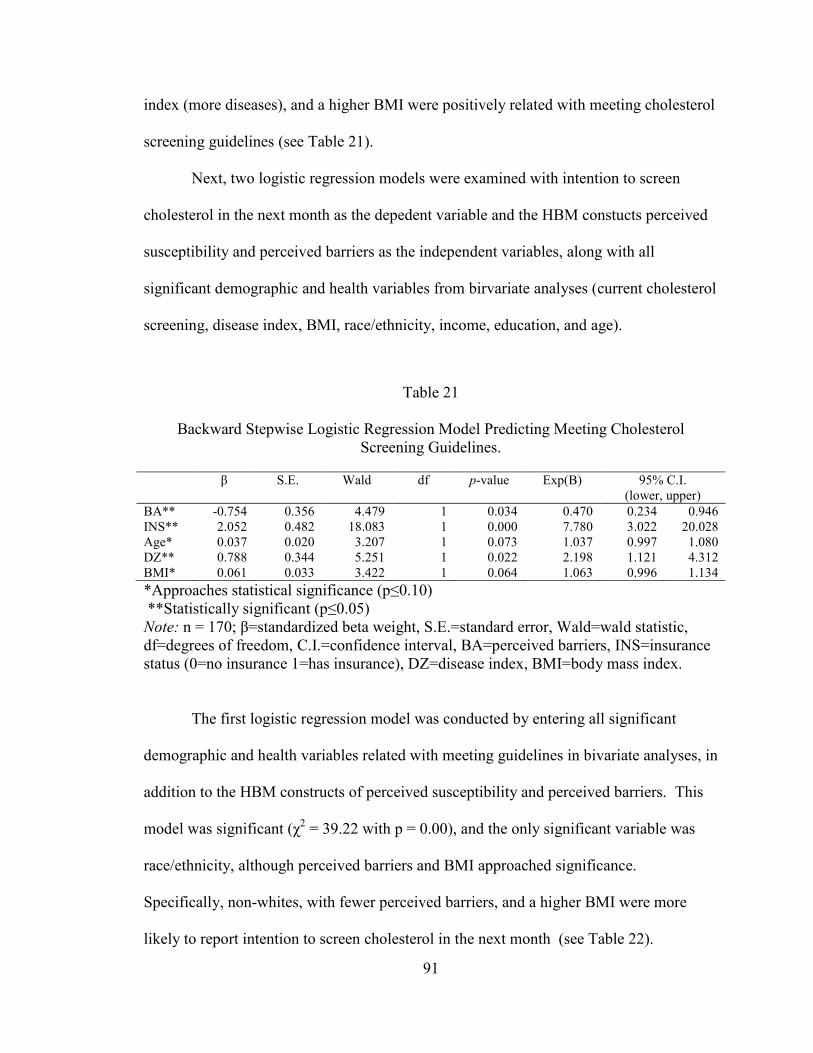
Table 21: Backward Stepwise Logistic Regression Model 91
Predicting Meeting Cholesterol Screening Guidelines
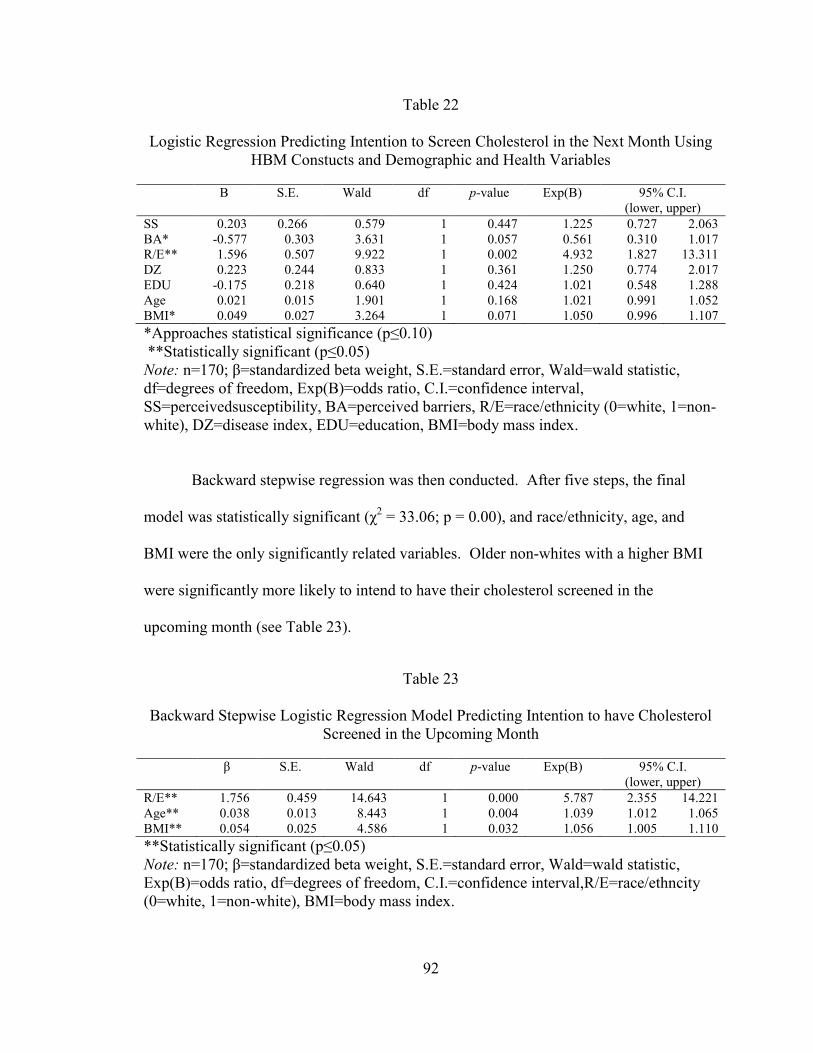
Table 22: Logistic Regression Predicting Intention to Screen 91
Cholesterol in the Next Month with HBM Constructs
and Demographic and Health Variables
Table 23: Backward Stepwise Logistic Regression Model 92
Predicting Intention to have Cholesterol Screened
in Upcoming Month
Page 9
viii
LIST OF ABBREVIATIONS
AHA American Heart Association
BA Barriers
BN Benefits
BRFSS Behavioral Risk Factor Surveillance System
CAROSS Carotid plaque screening on Smoking
CDC Center for Disease Control
CHD Coronary Heart Disease
CRC Colorectal Cancer
CVD Cardiovascular Disease
FHQ Food Habits Questionnaire
HA/S Heart Attack or Stroke
HBCVD Health Beliefs related to Cardiovascular Disease
HBM Health Belief Model
HDL High-Density Lipoprotein
HINTS Health Information National Trends Survey
HPV Human Papillomavirus
HONU Heart of New Ulm
LDL Low-Density Lipoprotein
MEPS Medical Expenditure Panel Survey
PAPM Precaution Adoption Process Model
PCP Primary Care Physician
Page 10
ix
SE Self-Efficacy
SS Susceptibility
SV Severity
TC Total Cholesterol
TG Triglycerides
TPB Theory of Planned Behavior
TTM Transtheoretical Model
UMMHC UMass Memorial Health Care System
Page 11
x
LIST OF TERMS
Behavioral Risk Factor Surveillance System (BRFSS): is an annual, state-based
system of telephone surveys that was developed by the Center for Disease Control (CDC)
in 1984 to collect information on health risk behaviors, preventative health practices and
healthcare access primarily related to chronic disease and injury from all 50 states (CDC,
2011).
Health Belief Model (HBM): is a theoretical model developed by Rosenstock and
Hochbaum established in the 1950s to understand why people were not participating in
available programs to detect disease (Champion * Skinner, 2008).
High-Density Lipoprotein (HDL): a complex lipoprotein whose function is
associated with reverse cholesterol transport, blocking inflammation, blocking oxidation
of lipoproteins, as well as plaque stabilization (Sanossian et al., 2006).
Low-Density Lipoprotein (LDL): a lipoprotein that builds up slowly in the arteries
as plaque (AHA, 2011).
Total Cholesterol (TC): composed of both LDL and HDL lipoproteins (Sullivan,
2001).
Triglycerides (TG): fats in the blood stream that can also contribute to plaque if
there are high levels circulating in the blood (AHA, 2011).
Page 12
xi
ACKNOWLEDGMENTS
This thesis would not have been possible without the help and encouragement of
my thesis committee. First and foremost, I want to thank my thesis advisor Dr. M. Renée
Umstattd Meyer, without whom this thesis would not have happened. Second, I would
like to thank my thesis committee members Dr. Eva Doyle and Dr. Mark Taylor who
gave of their time to edit my thesis and attend both my proposal and oral defense. Third,
I would like to thank the Department of Health, Human Performance, and Recreation
which provided me with funding to complete this project. Fourth, I would like to thank
my expert panel for editing my survey instrument. Last, I would like to thank the
community members of Holland, Granger, and Bartlett for participating in this study.
Page 13
1
CHAPTER ONE
Introduction
Purpose and Significance
Cardiovascular disease (CVD) is the number one killer of U.S. adults; there are
approximately 616,067 deaths each year (Xu, Kochanek, Murphy, & Tejada-Verda,
2010). The biggest risk factors for CVD are hypertension, high cholesterol, Type-2
diabetes, and lifestyle factors, including smoking, nutrition, and physical activity. A
good indicator of risk for CVD is cholesterol (AHA, 2011). Cholesterol consists of four
components: total cholesterol (TC), high-density lipoproteins (HDL), low-density
lipoprotein (LDL), and triglycerides (TRG). All four have been identified as potential
predictors of CVD risk (Cromwell, 2007; Natarajan et al., 2003).
Detection of high levels in these components can prompt lifestyle changes that
can help prevent or manage CVD (Mayo Clinic, 2011). This is especially needed in rural
communities where the risk of dying of CVD is 1.34 times more likely than their non-
rural counterparts (Zuniga, Anderson, & Alexander, 2003). However, rural communities
have reduced access to primary care and/or screening facilities in which to check their
cholesterol. Additionally, rural residents have reduced access to treatment or medication
if a diagnosis of CVD is reached (Goins, Williams, Courter, Spencer, & Solovienva,
2005; Strickland & Strickland, 1996).
Application of health behavior theory is useful for better understanding behavior
and is important for understanding why a member of a rural community may or may not
participate in a cholesterol screening. The Health Belief Model (HBM) is a theoretical
Page 14
2
model that has been frequently used to help understand participation in health screenings,
particularly for breast cancer and cervical cancer (Champion, 1987; Champion & Skinner,
2008; Guvnec, Akyuz, &Acikel, 2010; Tavafian, Hasani, Aghamolaei, Zare & Gregory,
2009). The HBM has also been used qualitatively to understand rural risk for CVD;
however, quantitative measures for most HBM constructs have not been developed to
understand cholesterol screening behavior (Hamner & Wilder, 2010; Homko et al., 2008;
Tovar, Rayens, Clark & Nguyen, 2010). The purpose of this study was to develop HBM
construct scales to better understand the use of cholesterol screenings in rural
communities in central Texas, and to subsequently examine relationships among HBM
constructs, current cholesterol screening behavior (meeting current cholesterol screening
recommendations), and intention to participate in a future cholesterol screening.
Research Questions
Question 1: Are the developed HBM measures valid and reliable?
Question 2: What are the perceived susceptibility and severity of high cholesterol
in rural communities in Central Texas?
Question 3: What are the perceived benefits and barriers of participating in
cholesterol screenings in rural communities?
Question 4: What is the level of self-efficacy to perform cholesterol screenings in
rural communities?
Question 5: Are constructs of the HBM related to current cholesterol screening
use?
Question 6: Are HBM constructs associated with intention to engage in future
cholesterol screenings?
Page 15
3
Question 7: Does insurance status (and other demographic and health variables) influence
the relationships examined in research questions 5 and 6?
Study Overview
The parameters of this study consist of members of rural communities in central
Texas. Surveys, including measures of HBM constructs, cholesterol screening, health,
and socio-demographic factors, were completed by rural residents who were either
parents or guardians of students or staff at Holland or Granger Independent School
District, members or regular attenders at the Granger Catholic church, participants in the
HeartAware Program, or participated in community events (e.g. Bingo). Participants had
to complete the survey and be over 18 years of age to be included in this study.
Assumptions
The assumption was made that participants answered the survey completely and
honestly. Aside from that assumption, the following assumptions were made in
relationship to the proposed research questions:
Assumptions of Question 1: Assumptions were made that wording of the original
valid and reliable scales provided a foundation for the development of items within the
new scales.
Assumptions of Question 2: It was assumed that the constructs of perceived
susceptibility and severity among rural communities would be low.
Assumptions of Question 3: It was assumed that the construct of perceived barriers
of cholesterol screening would be high among rural communities and that perceived
benefits of cholesterol screening would be low among rural communities.
Page 16
4
Assumptions of Question 4: It was assumed that the construct of self-efficacy
would be low among rural communities.
Assumptions of Question 5: It was assumed that the various constructs within the
HBM would be correlated with current cholesterol screening use.
Assumptions of Question 6: It was assumed that the various constructs within the
HBM would be correlated with future cholesterol screening.
Assumptions of Question 7: It was assumed that insurance status would positvely
influence the relationship between HBM constructs and cholesterol screening use.
Limitations
There were multiple limitations to this study. The first limitation was that the
results of the survey instrument were self-reported. Secondly, there was a lack of
generalizability due to the use of a convenience sample. The convenience sample
included members of three rural communities in central Texas. Third, this study aimed to
use theory to quantitatively understand cholesterol screening behavior, which had not
previously been done. Fourth, the survey instrument was developed through the
modification of scales unrelated to cholesterol screening. However, this research study
determined validity and reliablity of these scale. Fifth, there was a small sample size
(n=170) which can influence the relationships seen making it a possible limitation to this
study. Lastly, the study was a cross-sectional research study design meaning that a cause-
and-effect relationship could not be determined.
Page 17
5
Public Health Benefits
Findings from this research have several implications for health educators,
physicians, and public health researchers and practitioners. First, the developed scales
helped to identify perceived susceptibility, perceived severity, perceived benefits,
perceived barriers, and self-efficacy related to cholesterol screening behavior.
Researchers can use the results and resulting measures of this study to help identify
factors that explain why rural populations, particulary those in central Texas, do not
participate in available screening programs. Health educators will be able to use this
information to design better programs to educate rural communities on the importance of
understanding their cholesterol levels. Second, these results will help physicians
understand rural communities better and hopefully allow physicians to better meet the
needs of rural communities through addressing the communities biggest barriers. Third,
the researcher piloted and reported the validity and reliability of HBM-specific scales that
can be used by behavioral researchers in other rural communities or in other populations.
Fourth, the researcher gained insight into the role of insurance status on cholesterol
screening behaviors and HBM constructs, which could be effectively used in the
development of new programs to target populations that are in greater need of screening
options.
Page 18
6
CHAPTER TWO
Literature Review
Introduction
Coronary Heart Disease (CHD) and stroke account for 18% of total disease burden in
affluent countries (Sullivan, 2002). It was estimated that by 2020, CHD will be the
leading cause of death worldwide and stroke will be the fourth leading cause of death
(Sullivan, 2002). The U.S. currently has an estimated 616,067 deaths related to heart
disease each year (CDC, 2007). In rural communities the risk of dying of CVD is 1.34
times more likely than for residents of non-rural communities (Zuniga et al., 2003).
Various factors influence the risk for heart disease and stroke including smoking,
homocysteine, type II diabetes, high blood pressure, physical inactivity, obesity, and
cholesterol levels (Sullivan, 2002).
Cholesterol Levels
Cholesterol levels are seen as an important risk factor for heart disease because
cholesterol metabolism plays a very distinct and important role in the pathophysiology of
the process that builds plaque in various CVD. It is important to note that cholesterol
screenings give an indication of the risk for CVD, not a diagnosis of CVD (Sullivan,
2002). The use of cholesterol to predict CVD, particularly CHD, has been consistently
supported as a practical risk factor assessment in the literature. However, the main
determinant of CVD risk is contested (Sullivan, 2002). Cholesterol can be broken down
into four main components: total cholesterol (TC), high-density lipoproteins (HDL), low-
Page 19
7
density lipoproteins (LDL), and triglycerides (TGs). All four components are measured
when a person’s cholesterol levels are measured. However, each component has a
distinct role and function within the body. Total cholesterol is a composed of both LDL
and HDL lipoproteins (Sullivan, 2002). LDL is a lipoprotein that builds up slowly in the
arteries as plaque (AHA, 2011). HDL is a complex lipoprotein whose function is
associated with reverse cholesterol transport, blocking inflammation, blocking oxidation
of lipoproteins, as well as plaque stabilization (Sanossian, Saver, Kim, Razinia &
Ovbiagele, 2006). TGs are fats in the blood stream that can also contribute to plaque if
there are high levels circulating in the blood.
When estimating the CVD risk related to cholesterol levels, “the measurement of TC
alone cannot adequately reflect inter-individual risk of CVD, but the addition of HDL
[and if necessary, fasting TG], provides a clearer assessment of the lipoprotein
component of CVD risk” (Sullivan, 2002). Each component has a different level of
predictive power, but the risk for CHD is affected by the interaction of the lipoproteins
with the arterial wall (Cromwell, 2007). However, other research has demonstrated that
the ratios, more than the individual components, may be the bigger risk factors for CHD
(Natarajan et al., 2003). These ratios compare the levels of LDLs to the levels of HDLs
(LDL/HDL) or levels of HDLs to the levels of total cholesterol (HDL/TC). The
argument for using cholesterol screening to determine risk is that, at the population level,
abnormal cholesterol levels are related to atherosclerosis and adverse CHD events, which
allow for prediction of CVD risk (Cromwell, 2007; Sullivan, 2002).
Page 20
8
Importance of Theory
Application of health behavior theory is useful for better understanding behavior
and behavior change. Theory has been previously applied to understand mutliple
screening behaviors, such as HIV screening (Grispen, Ronda, Dinant, de Vries & van der
Weijden, 2011), hepatitis C screening (Lu, Huang, & Chu, 2010), cervical cancer
screening (Guvenc et al., 2011; Fernandez et al., 2009; Hogenmiller et al., 2007) and
breast cancer screening (Champion, 1984; Parsa, Kandiah, Mohd Nasir, Hejar, & Nor
Afiah, 2008; Tavafian et al., 2009). Theory has shown predictive power for
understanding screening behaviors which is why it should be used to understand
cholesterol screening in rural communities (Champion,1984; Tovaret al., 2010).
Cholesterol Screening
Cholesterol screening behavior is not a commonly researched area of CVD
prevention. Two rounds of literature searches were conducted. The first involved
searching the literature using Pubmed, EBSCOhost, and ScienceDirect databases for
studies directly examining cholesterol screening behavior (search terms: “cholesterol
screening”, “theory”, “model”), only two studies were identified. The second literature
search was for cholesterol related studies using Pubmed, EBSCOhost, and ScienceDirect
databases with the same search terms. The second literature search expanded the first by
evaluating results more openly, this time including studies that involved cholesterol
screenings in any way. This search identified seven additional studies. The aims of these
identified studies included aspects that influenced screening behavior (Deskins et al.,
2006; Stimpson & Wilson, 2009), understanding outcomes of cholesterol screening
(Ammerman et al., 2003; Gans, Burkholder, Risica, Lasater, 2003; Rodondi, Bovet,
Page 21
9
Hayoz, & Cornuz, 2008; Spoon, Benedict, & Buonamici, 1997;), treatment adherence
behaviors (Anderson, Camacho, Iaconi, Tegeler, & Balkrishnan, 2011; Burke, Dunbar-
Jacob, Sereika, & Ewart, 2003; Guibert, Leduc, Fournier, & Tetreault, 1999), or
satisfaction related to cholesterol screenings (Bekwelem, VanWormer, Boucher, &
Pereira, 2011). The most common theoretical frameworks used in understanding aspects
of cholesterol screening have been the theory of planned behavior (TPB, n=1), self-
efficacy (n=1), and the HBM (n=3). However, theoretical frameworks have often not
been used in trying to understand cholesterol screenings (n=4).
Cholesterol Screening Studies
Through the literature search described above, two studies were identified that
described actual cholesterol screening behavior. In one of these studies, Deskins et al.
(2006) described research using a theoretical framework, the TPB. In the second study,
Stimpson and Wilson (2009) described an atheoretical approach to cholesterol screening
research. Each is described below.
Theory of Planned Behavior. TPB was adapted from the theory of reasoned
action by Fishbein and Ajzen in 1975 to understand individual motivational factors that
influence the likelihood of performing a specific behavior. The constructs of TPB are
attitude, social norm, perceived behavioral control, and intention (Montaño & Kasprzyk,
2008).
The state of West Virginia is known for its high risk of CVD, especially within
rural communities. A qualitative study implemented by Deskins et al. (2006) used the
TPB to understand the barriers to rural residents’ participation in cholesterol screenings.
Page 22
10
The study conducted semi-structured interviews in rural West Virginia counties. The
sample consisted of 14 community leaders, 36 parents and 92 fifth-grade students from
six counties. Each interview was approximately 30-45 minutes in length for children and
45-60 minutes for adults. The themes presented in the interviews were broken down by
construct, attitude included the concerns about outcomes (n=9 transcripts), lack of
knowledge about cholesterol and heart disease (n=9 transcripts), lack of community
knowledge (n=11 transcripts) and the fear of needles (n=7 transcripts). The most noted
aspect (n=14 transcripts) was the traditional Appalachian cultural beliefs which have a
resistance to preventive health and to new peoples or ideas. Children’s attitude toward
behavior was similar with the fear of needles (n=26 transcripts). The children also
showed a fear of the outcomes (n=11 transcripts), a lack of concern about health and
cholesterol (n=8 transcripts), and felt an invasion of privacy (n=9 transcripts).
Adult interviews addressed perceived behavioral control of the respondents. The
major components mentioned were cost (n=10 transcripts), availability (n=6 transcripts),
and time (n=7 transcripts). Subjective norm was addressed through the children’s
interviews. However, the children did not feel social pressure to participate in
preventative services and most of the children’s beliefs about participation stemmed from
their parents’ beliefs or the parents would not allow their children to participate (n=22
transcripts). The most significant limitation of this study was the lack of generalizability
due to the distinctness of Appalachian culture. However, TPB did provide a helpful
theoretical framework for understanding barriers faced in this population (Deskins et al.,
2006).
Page 23
11
Atheoretical Research. In April 2009, Stimpson and Wilson published a study
looking at the relationship between marital status and cholesterol screenings. They used
data from the Medical Expenditure Panel Survey (MEPS) which consists of two years of
data that interviewed the public on health service use, health conditions, and behavior
(n=36,594). Results of the study revealed that widowed men and women were the most
likely to be screened, while single men and women were the least likely to be screened.
Of the variables measured, marital status was the strongest predictor of cholesterol
screening behavior for women and the second strongest predictor for men. Other
significant predictors of cholesterol screening behavior were access to care, health
conditions, socioeconomic factors, and health behaviors. Screening also increased with
age; people over age 50 reported more screenings than those under age 35 (Stimpson &
Wilson, 2009).
Cholesterol Related Studies
Eight studies related to cholesterol screening behaviors and one study related to
cardiovascular outcomes were identified in the literature search. However, these studies
focused on outcomes of screenings, such as participant satisfaction or treatment
adherence behaviors (Ammerman et al., 2003; Anderson et al., 2011; Bekwelem et al.,
2011; Burke et al., 2003; Gans et al., 2003; Guibert et al., 1999; Rodondi et al., 2008;
Spoon et al., 1997; Tovar et al., 2010). The researchers, in five of the nine studies, used a
theoretical framework: self-efficacy (Burke et al., 2003) and HBM (Anderson et al.,
2011; Guibert et al., 1999; Spoon et al., 1997; Tovar et al., 2010).
Page 24
12
Self-efficacy. Self-efficacy is defined as a person’s confidence that they can
perform a behavior that produces desired outcomes (Champion & Skinner, 2008). Self-
Efficacy was originally developed by Bandura (1977) but has since become a fixture in a
variety of theories such as Social Cognitive Theory (SCT), Transtheoretical Model
(TTM), HBM, and has also become a construct that is measured independently.
Burke et al. (2003) used self-efficacy to understand adherence behavior. In this
study, a self-efficacy scale was developed in order measure cholesterol-lowering diet
self-efficacy in people who had been diagnosed with elevated cholesterol at a screening.
The study consisted of two parts. The first examined 12-day test-retest reliability
(r=0.86) and internal consistency (α=0.93). The second part of the study used the scale to
measure self-efficacy (n=228). The results indicated that the mean level of perceived
self-efficacy was 78.42 (on a scale of 1-100). The study found the survey to be a good
measure of self-efficacy related to cholesterol-lowering diet self-efficacy (Burke et al.,
2003).
Health Belief Model. The HBM was established in the 1950s to understand why
people were not participating in available programs to detect disease (Champion &
Skinner, 2008). HBM has six constructs: perceived susceptibility, perceived severity,
perceived benefits, perceived barriers, cues to action, and self-efficacy.
Spoon et al. (1997) used HBM to develop the “Change of Heart Education
Program.” Through this program, adult participants (n=285) received newsletters
containing information regarding heart health, particularly ways to lower cholesterol
consumption and strategies to overcome related barriers. HBM construct scales were
developed to evaluate program effectiveness over 1-month and 6-month exposures to the
Page 25
13
newsletters. At the end of the evaluation, the program offered a follow-up screening, of
which only 10% of participants partook. Results revealed significant changes in
overcoming barriers to adopting low fat diets, dietary habits, and decreases in fat
consumption (Spoon et al., 1997).
In Quebec, Canada a study was conducted to understand whether or not
participants diagnosed with hypercholesterolemia at mass health screenings in rural areas
saw their primary physician after the screening (Guibert et al., 1999). The survey
analyzed 1,334 participants between 24-64 years old in 54 worksites and 29 public areas
in rural Quebec. Participants were contacted two to six months after being screened for a
telephone interview. The interview used HBM constructs of perceived threat (perceived
susceptibility and perceived severity), perceived self-efficacy, and cues to action to
understand compliance in regards to seeing a physician after being told he or she had
elevated cholesterol levels. The results of the study showed that overall compliance rates
were about 58%. Compliance rates differed by gender, age, awareness of cholesterol
levels prior to being screened, and prior treatment for cholesterolemia. Results also
supported self-efficacy as an indicator for compliance and suggested that perceived threat
and cues to action may modify compliance behavior (Guibert et al., 1999).
Anderson et al. (2011) also used HBM to motivate compliance to seek healthcare
services after community stroke risk screenings. Screenings included major risk factors
for stroke: elevated total cholesterol, elevated non-fasting blood glucose, hypertension,
Transient Ischemic Attack (TIA) symptoms, and smoking status. Participants who
completed the study were randomized into one of two groups, with 227 completing the
study (n=126 intervention; n=101 control). The intervention group received a HBM
Page 26
14
based motivational intervention in the month following the screening, and both groups
received a 1-month and 3-month follow-up phone interview. Through the use of the
HBM based intervention, the intervention group was 1.85 times more likely to seek
healthcare services than the control group, with 69% reporting a visit to a primary care
physician as opposed to 52% of the control group (Anderson et al., 2011).
Lastly, a study by Tovar et al. (2010) was used that looked at health beliefs
concerning CVD risk, diet, and exercise within diabetic patients. Tovar et al. (2010
developed the Health Beliefs Related to Cardiovascular Disease scale (HBCVD). The
scale was developed using current literature as well as the authors’ expertise in the
diabetes population. The HBCVD consisted of a 25-item scale which had four subscales:
susceptibility (n=5), severity (n=5), benefits (n=6), and barriers (n=9). The scale was
reviewed by both an expert panel and by a group of 10 diabetic patients. The scale was
then pilot tested with 68 patients from outpatient cardiovascular and diabetes clinics.
Exploratory factor analysis was conducted and the results showed an overall Cronbach’s
alpha of 0.76 for the scale and 0.82 for the susceptibility subscale, 0.61 for the severity
subscale, 0.93 for the benefits subscale, and 0.70 for the barriers subscale. A larger study
was conducted after the pilot test with 178 participants that had diabetes. Confirmatory
factor analysis was done of the second phase of data which showed an overall Cronbach’s
alpha of 0.77 with subscale scores of 0.91 for susceptibility, 0.71 for severity, 0.91 for
benefits, and 0.62 for barriers. The main limitations for this study were the convenience
sample of both the pilot study and larger study and also the homogeneity of both samples
which will limit the HBCVD’s generalizability (Tovar et al., 2010).
Page 27
15
Atheoretical studies. Use of a theoretical framework was not evident in any of the
remaining identified research studies of cholesterol screening. Bekwelem et al. (2011)
studied the satisfaction of participants in the Heart of New Ulm (HONU) Project in rural
Minnesota. The HONU Project was a screening project to understand the cardiovascular
risk factors, including total cholesterol and HDL levels, of rural residents at no cost to the
participants. This was a cross-sectional research study design using a self-reported
survey to understand participants’ satisfaction with the HONU project. The survey was
consisted of two stages of data collection (1) seven closed-ended questions with 5-pt
answer choices and (2) three qualitative interview questions. Based on the responses to
the first seven questions, participants were separated into “satisfied” and “not satisfied”
groups for interview. There were 118 participants, of which 90% were satisfied with the
program. The results associated with this study indicated that community screening
programs, like HONU, were valuable resources to the community and could provide
necessary health screenings for rural communities (Bekwelem et al., 2011).
In 2008, a pilot study of the CAROtid plaque screening on Smoking (CAROSS)
cessation and control of other CVD risk factors was conducted with 30 regular smokers
between 40 and 70 years of age. The first part of the study was to understand the
behavior of smoking cessation, while the second part of the study aimed to understand if
carotid plaque screening, including LDL cholesterol screenings, would decrease smoking
behavior and decrease overall CVD risk. The study consisted of a 2-month observation
pre-pilot study, smoking cessation counseling and therapy, detection and education of
CVD risk, baseline and 2-month psychological and motivational assessments, and 2-
month cessation and atherosclerosis knowledge assessments. The pilot study showed an
Page 28
16
increase in motivation to change smoking behavior, particularly in the 22 smokers who
had notable carotid plaque. The 2-month assessments showed a decrease in smoking
rates by 63%, and an increase in knowledge in 96% of participants, thus supporting the
effectiveness of carotid plaque screenings in eliciting behavior change among smokers
(Rodondi et al., 2008).
Gans et al. (2003) aimed to use cholesterol screening programs to change
nutritional habits in white, Hispanic, and Black participants in a New England screening
program (n=9,803). Participants were recruited across 144 sites (public, medical,
religious, or work sites) and incorporated screenings at baseline, three, and twelve
months throughout the program. The program also included the Food Habits
Questionnaire (FHQ). Results supported differences between eating habits for those of
different ethnicities (Gans et al., 2003).
Another dietary intervention based on elevated cholesterol levels was conducted
by Ammerman et al. (2003). Seventeen health departments were randomized into either
a special intervention group or a minimal intervention. Participants had their cholesterol
screened at the health departments to determine eligibility and then again at three, six,
and twelve months. The special intervention consisted of the Food for Heart Program,
referral to local nutritionist if lipids were elevated at the 3-month follow-up and a
reinforcement program including a phone call and two newsletters. The minimal
interventions only included nurses providing counseling for the elevated cholesterol
levels. Through the intervention, both groups had statistically significant changes in total
cholesterol and LDL. However, there were no differences in the treatment groups for
total cholesterol and LDL. Although there were small changes between the groups with
Page 29
17
triglycerides and HDL, but these were not statistically significant. Statistically
significant changes in diet were reported for both interventions (Ammerman et al., 2003).
Although various studies have been conducted to understand outcomes related to
cholesterol screenings, including adherence, satisfaction, or dietary interventions, very
few studies have been conducted with the aim to understand actual screening behavior in
regards to cholesterol. Given the current dearth of research in this area, other screening
behaviors using theoretical frameworks were examined to better understand screening
behaviors at large.
General Screening Behaviors
Because there was a lack of behavioral research in connection with cholesterol
screening behavior, attention was turned to general screening behaviors. A significant
amount of behavioral research aimed at understanding screening behavior exists,
particularly for HIV screening (Grispen et al., 2011), hepatitis C screening (Lu et al.,
2010), and cancer screening behaviors (Costanza et al., 2005; Duffett-Leger, Letourneau
& Croll, 2008; DuHamel, Li, Rakowski, Samimi & Jandorf, 2011; Fernandez et al., 2009;
Ferrer et al., 2011; Guvenc et al., 2011; Hogenmiller et al., 2007; Mason & White, 2008;
Oliver, Grindel, DeCoster, Ford, & Martin, 2011; Parsa et al., 2008; Sieverding, Matterne,
& Ciccarello, 2010; Tavafian et al., 2009;Tu et al., 2002; Tung, Lu & Cook, 2010;
Wagner, Semmler, Good & Wardel, 2009). A literature search was conducted using
Pubmed, EBSCOhost, and ScienceDirect databases for studies directly examining
screening behavior (search terms: “screening”, “theory”, and “model”). A second
approach was then completed using the same databases with specific theory names (e.g.,
“Health Belief Model”). Five predominant theories were identified that had been used to
Page 30
18
understand cancer screening behavior: precaution adoption process model (PAPM; n=2),
TPB (n=3), TTM (n=3), self-efficacy (n=3), and the HBM (n=7).
Precaution Adoption Process Model
PAPM was established in 1992 by Weinstein and Sandman to understand the
stages of change involved when a person chooses to begin a health-protective behavior.
The model includes seven stages of change: stage 1 unaware of the issue, stage 2
unengaged by the issue, stage 3 undecided about acting, stage 4 decided not to act, stage
5 decided to act, stage 6 acting, and stage 7 maintenance (Weinstein, Sandman, &
Blalock, 2008). Two studies identified used PAPM to understand screening behavior for
colorectal cancer (CRC).
One study was conducted through UMass Memorial Health Care System
(UMMHC) to promote CRC screenings among patients who saw a primary healthcare
provider (PCP) within the UMMHC (Costanza et al., 2005). Surveys were sent to
eligible patients (n=2,934), and 2,027 were returned. The survey measured CRC
screening history, PAPM stage and knowledge as well as the participants’ beliefs,
attitudes, and knowledge regarding CRC screenings. The results of this study showed
that 36% of the participants were in the Action/Maintenance stages (stages 6 and 7), 26%
of participants were in the decided to act stage (stage 5), and the other 38% were spread
over stages 1-4. The analysis revealed that the main factors that influenced screening
between the stages were provider recommendations for screenings and family history of
CRC. Overall, this study found that the PAPM was useful to understand attitudinal
variables related to CRC screenings. The limitations of this study were the possibility for
non-response bias, due to it being mailed survey, self-report of CRC screening behaviors,
Page 31
19
and the homogenous nature of the sample which may limit generalizability (Costanza et
al., 2005).
Another study using PAPM for understanding CRC screening was conducted by
Ferrer et al. (2011) to understand stage differences of perceived vulnerability, ambiguity,
preventive behavior, fatalistic beliefs, and the relationships of health perceptions by stage.
The study used the National Cancer Institute’s Health Information National Trends
Survey 2003 (HINTS) to obtain access to a data set of 2,470 individuals over the age of
50. Ferrer et al. used the U.S. Preventive Services Task Force guidelines for CRC
screening to stage individuals in the HINTS data. Results suggested that the individuals
in the not engaged stage (stage 2) had lower levels or worry and lower perceptions of
absolute risk. Those in the unaware stage (stage 1) had the highest levels of fatalism.
Ambiguity did not vary significantly across all stages. However, health perceptions did
vary significantly across all stages with worry and relative risk being the highest in the
decided to act stage (stage 5), as was the correlation between worry and family history.
The limitations of this study were the cross-sectional research study design, because it did
not allow insight on changing the stage of the behavior, and a lack of examination of the
relationship between stages, health perceptions, and socio-demographic factors. This
study concluded that due to differences in health perceptions across the different stages,
using a stage model like PAPM was effective in understanding screening behavior (Ferrer
et al., 2011).
Page 32
20
Theory of Planned Behavior
TPB was used in three studies to understand cancer screening behaviors specific
to breast cancer (Mason & White, 2008), cervical cancer (Duffett-Leger et al; 2008), and
prostate/colorectal cancer (Sieverding et al., 2010).
A study was conducted in Australia (Mason & White, 2008) to understand breast
self-examinations as a screening method for breast cancer in female college students
under age 50. Two hundred and fifty-three women were surveyed as part of an
undergraduate psychology course; 92.5% completed the one-month follow-up survey.
The survey used an extended-model of TPB including constructs of intention, attitude,
subjective norm, perceived behavioral control, self-identity, group norm, knowledge, past
behavior, and self-reported behavior. The researchers concluded that the TPB constructs
of attitude, subjective norm, and perceived behavioral control predicted intention while
intention and perceived behavioral control predicted breast self-exam behavior. Among
the extended constructs, only group norm and past behavior showed any predictive power.
The researchers recommended using TPB to understand likelihood of participating in
screening behavior, particularly breast self-exams in young women (Mason & White,
2008).
TPB has also been used to understand cervical cancer screening of university
women in a Canadian study conducted by Duffett-Leger et al. (2008). This study was a
web-based, cross-sectional survey of 904 female students under the age of 25. The study
used Armstrong’s 77-item Student Pap Test Survey and added three perceived behavioral
control questions. The revised scale had face validity based on an expert panel review.
The results of this study showed that 72% of female students reported having a Pap smear.
Page 33
21
The TPB variables of attitude and subjective norms were high among the students, while
knowledge about Human Papillomavirus (HPV) was low. Subjective norm was the
biggest predictor of intention in this study, which differs from other literature, and may
be due to the age range of the surveyed population. Perceived behavioral control and age
of learning about Pap smears were also significant predictors of intention to get a Pap
smear. The limitations of this study were the self-reported behavior and cross-sectional
research study design. (Duffett-Leger et al., 2008).
Lastly, an extended TPB model was used to understand prostate and CRC
screening in men (Sieverding et al., 2010). This study measured TPB constructs and
added descriptive norm to increase prediction of intention and actual behavior. This
study consisted of two parts: in the first study 2,426 German men were surveyed about
their past cancer screening behavior and intention for future screening, and in the second
study 1,218 German men were mailed a follow-up questionnaire to see if they actually
followed-up with getting a cancer screening. The results from the first study indicated
that relationships between TPB variables and intention were significantly higher than the
relationships between TPB variables and past behaviors. The results of the second study
showed that only 20% of men who were surveyed actually participated in a cancer
screening. The TPB variables of attitude, subjective norm, and perceived behavioral
control were all predictive of intention; however, the added variable of descriptive norm
was not predictive of intention except when subjective norm was low. In conclusion, this
study exemplified a need for more research to be conducted using TPB (Sieverding et al.,
2010).
Page 34
22
Transtheoretical Model
The TTM was developed by Prochaska and DiClemente in 1982 to understand
stages of change using different process of change and other principles to facilitate
change. TTM consists of stages of change, processes of change, decisional balance, and
self-efficacy (Prochaska, Redding, & Evers, 2008). The following three studies use TTM
to understand breast cancer, cervical cancer, and colorectal cancer screening behaviors.
Tu et al. (2002) used TTM to study stages of change (referred to in the study as
stages of adoption) in breast cancer screenings among Cambodian American women
(n=400). These women were asked interview questions related to demographics,
screening behavior, intentions, health beliefs, and access to health services. The results
of this study showed that 26% of Cambodian American women were in maintenance for
clinical breast exam screenings, while 23% were in maintenance for mammography
screenings, which was lower than other studies done in the U.S. that show maintenance
stages to be 47-50% for most young, white American women. This study did not show
any significant associations between health beliefs and stages of change however, seeing
a female physician did have a significant association with the maintenance stage. This
study recommends further studies to determine whether TTM is an effective framework
to understand cancer screening behavior (Tu et al., 2002).
TTM has also been used to understand cervical cancer screening as seen in the
study by Tung et al. (2010), which surveyed 222 female employees of a Taiwanese
hospital. The survey included demographic questions, the cervical cancer screening stage
questionnaire, the Self-Efficacy Scale, and a 12-item barriers subscale. Respondents were
categorized into the stages as follows: 17% in precontemplation, 10% in contemplation,
Page 35
23
0% in preparation, 3% in action, 53% in maintenance, and 17% in relapse. Demographic
variables were significantly related to stages of change including age, where 77% of
women over 50 were in maintenance, while only 56% of women between 30-50 years old
and no one below age 30 were in the maintenance stage. The study showed that women
who were in the action or maintenance stages had higher self-efficacy, while the women
in the precontemplation stages faced more barriers and fewer benefits than other women.
The limitations of this study may be its generalizability since it was aimed at a
particularly culture, however other studies regarding TTM and cervical cancer have been
done in other populations that show similar predictive effectiveness. Study results
support future use of TTM theories for cervical cancer screening behaviors (Tung et al.,
2010).
Lastly, TTM has been used to understand CRC screening behavior. A study by
DuHamel et al. (2011) used TTM to understand CRC in African Americans. This study
used the constructs of stages of adoption and processes of change, which were
consolidated into four factors: commitment, information, beyond, and avoids.
Participants were recruited through Mount Sinai Hospital and North General Hospital on
the basis of being African American men and women over the age of 50. The
participants had to already have a primary care physician as well as a need for CRC
screening, which resulted in 158 participants. Interviews were conducted using questions
to understand stages of adoption and processes of change. The results of this study
showed that processes of change were significantly different across different stages
indicating a means to facilitate movement across stages. This study also identified factor
validity among the processes of change. The limitation of this study was the
Page 36
24
homogeneity of the sample which may make it hard to establish generalizability.
However, based on this study, using processes of change can be helpful to understand
stages of change within TTM and CRC screening behaviors (DuHamel et al., 2011).
Self-Efficacy
The following three studies measured the construct of self-efficacy and examined
its ability to predict cancer screening behaviors. Self-efficacy was applied to CRC
(Wagner et al., 2009) and Pap smears for cervical cancer (Fernandez et al., 2009;
Hogenmiller et al., 2007).
A study was conducted by Wagner et al. (2009) to understand health literacy and
self-efficacy among 96 participants ages 50-69. The study was composed of
demographic questions, a web-based information-seeking session in which participants
received internet information and could access additional information by clicking on
different links, a four-item self-efficacy questionnaire, and a modified version of the Test
of Functional Health Literacy in Adults (TOFHLA). The results of this study showed
that there was no association between health literacy and CRC knowledge; however, self-
efficacy had a significant association with health literacy and showed predictive power on
accessing information regarding CRC screenings (Wagner et al., 2009).
Another study using self-efficacy validated a self-efficacy scale for Pap smear
screenings in sheltered inner-city women (Hogenmiller et al., 2007). Study participants
were recruited from one of three inner city shelters based on the criteria of being over 19
years of age and the ability to read and write in English. Over the year of recruitment,
161 participants were surveyed. Each participant attended a study informational session
in which the study and its components were explained and informed consent forms were
Page 37
25
signed. The participants each completed the 20-item self-efficacy scale which had strong
internal consistency (Cronbach’s alpha of 0.95). Self-efficacy had predictive power for
stages of change and Pap smear screening intention. The scale was also noted for its
readability and established validity within a vulnerable population (Hogenmiller et al.,
2007).
The third study using self-efficacy was conducted by Fernandez et al. (2009) to
develop and validate a self-efficacy scale for pap smears among low-income Mexican
American women that would be more generalizable to the population than the scale
developed by Hogenmiller et al. (2007). The data used to compile questions of Pap
smear self-efficacy was derived from two different samples that had been previously
collected through a study that determined the effectiveness of breast and cervical cancer
screening education for Hispanic women. The original data collection involved a 276-
item questionnaire. From the information collected in the original samples, a survey was
constructed that used Bandura’s scale guidelines. The survey underwent an expert panel
review and a pilot study to determine the most appropriate scale items. The final scale,
validated through a pilot study (n=678), used eight items to measure self-efficacy
(α=0.95). The researchers found that this self-efficacy scale was significantly associated
with knowledge, intention, and prior experience (Fernandez et al., 2009).
Health Belief Model
Nine studies were identified that demonstrated the effectiveness of HBM in
understanding screening behaviors. Five of the studies focused on using HBM to
understand cancer screening behaviors (Champion, 1984; Guvenc, et al, 2011; Oliver et
al., 2011; Parsa et al., 2008; Tavafian et al., 2009). Two studies focused on the use of
Page 38
26
HBM to understand health care screening utilization in rural communities (Goins et al.,
2005; Strickland and Strickland, 1996). One study used HBM to understand glucose and
HIV screening behaviors (Grispen et al., 2011) and the other looked at HBM to
understand hepatitis C screening (Lu, Huang, & Chu, 2010).
In 1984, Dr. Victoria Champion developed and validated the HBM scale for
breast self-examination. The developed survey consisted of 39-items with five subscales:
susceptibility, seriousness, benefits, barriers, and health motivation, which were piloted
on a convenience sample of 301 women. Construct validity (α=0.62) and reliability
(r=0.70) were established for the scale. The development and validation of this scale
provided a basis for understanding cancer screening behaviors and contributed to the
planning of interventions. The scale was revised by Champion in 1987, 1993, 1997, and
1999. This scale was the most well-known and predominantly used scale for measuring
HBM constructs within cancer screening behaviors, it has been translated and used in
over seven countries (Champion, 1984; Champion & Skinner, 2008).
HBM has been used to understand prostate cancer screening in men in a study by
Oliver et al. (2011). This study aimed to understand HBM constructs and source of
influence for prostate cancer screening among rural men. Rural men were conveniently
recruited through businesses and churches in a southeastern U.S. state (n=95). The scales
used to measure the constructs were adapted from Champion’s HBM scales to address
prostate cancer screenings; the final scale included 17-items which was piloted with 20
rural men to establish validity (α =0.95). The main findings of this research study were
that the strongest source of influence on rural men was healthcare providers, and
participants’ beliefs about prostate cancer (perceived susceptibility and perceived
Page 39
27
severity) were predictors for screening behavior. The limitations of this study were its
lack of generalizability due to its focus on rural populations and the use of a cross-
sectional research study design which limited the researchers’ ability to see actual
behavior change. Overall, the researchers concluded that HBM constructs, specifically
perceived susceptibility and perceived severity, were effective predictors of prostate
cancer screening behavior (Oliver et al., 2011).
A modified version of Champion’s HBM scale has also been used to understand
cervical cancer screening behavior in a study conducted by Guvenc et al. (2011). This
study was conducted using 237 Turkish women who received a survey that measured
HBM constructs and cervical cancer screening behaviors. The survey had been modified
to include language regarding Pap smear tests and cervical cancer. This study had
acceptable validity and reliability for all items in the modified scales, except one item
related to barriers. A final version of the scale resulted from this study that included 36
items which loaded on five factors (susceptibility, severity, benefits, barriers, and health
motivation). The biggest limitation to this scale was its use among one culture of women
in Turkey which may make it less generalizable to other cultures or countries (Guvenc et
al., 2011).
Champion’s HBM scale has been commonly used to understand breast cancer and
related screening behaviors. In 2008, the scale was applied to Malaysian women by
Parsa et al. (2008). This application of the scale allowed for examination of three types
of screening behaviors: self-breast exam, clinical breast exam, and mammography and
resulted in a 63-item survey in order to measure benefits, barriers, and confidence for
each of the screening behaviors. The survey was disseminated in a cross-sectional
Page 40
28
research study design and included 425 teachers from different secondary schools within
Selangor, Malaysia. The modified scale was determined to be valid and reliable with
items having acceptable internal consistency (Cronbach’s alpha: 0.77-0.94). In this study,
Malaysian women had higher barriers and lower susceptibility to breast cancer than what
has been reported in other countries; however, this difference may be due to different
cultural and religious beliefs. HBM appeared to be an appropriate framework for
understanding breast cancer screening behaviors within Malaysian women in this study
(Parsa et al., 2008).
Another example of Champion’s HBM scale can be seen in a study with Iranian
women conducted by Tavafian et al. (2009). This was a cross-sectional research study
design that surveyed 240 Iranian women recruited through eight health centers in Iran.
The survey was a modified version of Champion’s HBM scale (excluding health
motivation) which consisted of 31 items all relating to the use of breast self-exams as a
screening behavior for breast cancer. Perceived benefits and self-efficacy were found to
be higher among those who performed breast self-exams in Tavafian’s study; while those
who did not perform breast self-exams had higher perceived barriers. The study also
concluded that the participants who had higher self-efficacy were more likely to engage
in breast self-exams. (Tavafian et al., 2009).
Aside from cancer screening behaviors, other screening behaviors and access to
those screenings have been studied. Goins et al. (2005) conducted research in six rural
West Virginia communities to understand utilization of healthcare in rural communities.
Thirteen 90-minute focus groups with adults over age 60 were conducted and used four
main questions: 1) “Do you believe your health care needs are being met? If no, why
Page 41
29
not?” 2) “What kind of help do you need to address these problems?” 3) “What are the
barriers/ problems that you experience in getting the care you need?” 4) “How do you
cope with the high cost of prescription medication?” The major themes that arose from
these focus groups were transportation difficulties, limited health care supply, lack of
quality healthcare, social isolation, financial constraints, and coping with the cost of
prescription medications (Goins et al., 2005).
Strickland and Strickland (1996) conducted a study, similar to Goins et al. (2005),
with minority households in the rural south. This study was looking at barriers to
preventative health, such as general health screenings or dental screenings. Strickland
and Strickland conducted household interviews (n=281), community leader interviews
(n=51), and focus group interviews (n=6). The identified reasons for why preventives
services were not received were inability to pay, which was possibly attributed to lack of
coverage or lack of awareness of agencies that may be able to provide support in this
manner; health service availability; accessing the system; and coping with prejudice and
discrimination due to being poor. There was also a perception that health services were
not needed, which was a large contributor to the populations not taking part in available
preventative services (Strickland & Strickland, 1996).
Other screening behaviors that have been studied are self-testing of glucose,
cholesterol, and HIV (Grispen et al., 2011). A Netherlands-based study aimed to
understand the psychosocial determinants of self-testing using HBM, TPB, and the
protection motivation theory. The study was an online cross-sectional research study that
aimed to understand self-testing behaviors of three diseases: cholesterol, glucose, and
HIV. The initial survey was sent to 12,529 panelists to determine which type of self-test
Page 42
30
the participant had used. Based on how the participant answered the first questionnaire,
they were sent another test specific questionnaire. The questionnaires measured
perceived susceptibility, perceived severity, cues to action, perceived benefits, perceived
barriers, self-efficacy, subjective norm, anticipated regret, moral obligation, and response
efficacy. The questionnaire was completed by 513 self-testers and 600 non-testers,
distributed across the three test types. Based on the questionnaires, cholesterol test takers
were more impacted by perceived susceptibility, perceived benefits, self-efficacy, and
moral obligation. Glucose self-testers were influenced by cues to action, self-efficacy,
and perceived benefits. While HIV testers were most affected by perceived susceptibility,
cues to action, perceived benefits, self-efficacy, and subjective norm. The researchers
supported the use of this theoretical framework to understand the psychosocial
determinants of self-testing behaviors in the future (Grispen et al., 2011).
Lastly, another area of screening behavior that has been studied is hepatitis C (Lu,
Huang, & Chu, 2010). This study aimed to understand healthcare-seeking behaviors for
hepatitis C patients using HBM. The 390 participants were hepatitis C patients who
frequented hospital clinics for screenings of their hepatitis C. The biggest HBM
predictors were perceived susceptibility and severity to disease, particularly among those
who visited the clinic between one and six months. Perceived benefits and barriers did
not differ significantly among the participants (Lu, Huang, & Chu, 2010).
Although HBM has been used to understand self-testing behaviors (glucose and
HIV) as well as hepatitis C screening behavior, HBM has been more consistently used to
understand cancer screening behaviors. Cancer screening behaviors also provide a better
Page 43
31
basis for this study since cancer screening shows risk whereas HIV screening and
hepatitis C screening indicate actual presence of a disease.
While current literature has examined outcomes related with cholesterol screening,
quantitative research aimed at understanding cholesterol screening behavior does not
exist. Understanding utilization of cholesterol screenings is especially important in rural
communities, given increased CVD risk. Due to the effectiveness of HBM to understand
cancer screening behaviors, HBM should give insight into other screening behaviors,
such as cholesterol screening. Therefore, the purpose of this study was to use the HBM
to better understand cholesterol screening behaviors of rural residents in central Texas.
The HBM consists of six constructs: perceived susceptibility, perceived severity,
perceived benefits, perceived barriers, cues to action, and self-efficacy (Champion &
Skinner, 2008). Perceived susceptibility is the likelihood of contracting a certain
condition within a specified time frame. Perceived severity is the perceived degree of
threat a condition or its consequences present to a person. Perceived benefits are the
positive consequences associated with a specific behavior. Perceived barriers are the
negative consequences associated with a specific behavior. Cues to action are strategies
or concepts that trigger action toward a certain behavior. Self-efficacy is the confidence
in one’s ability to perform a specific behavior when confronted by challenges to
performing the behavior (Champion & Skinner, 2008). There is a case made in the
literature for the use of perceived susceptibility, perceived severity, perceived benefits,
perceived barriers (Costanza et al., 2005; Duffett-Leger, Letourneau & Croll, 2008;
DuHamel et al., 2011; Ferrer et al., 2011; Guvenc, Akyuz & Acikel, 2011; Mason &
White, 2008; Oliver et al., 2011; Parsa et al., 2008;Sieverding, Matterne, & Ciccarello,
Page 44
32
2010; Tavafian et al., 2009;Tu et al., 2002; Tung, Lu & Cook, 2010), and self-efficacy
(Fernandez et al., 2009; Hogenmiller et al., 2007; Wagner et al., 2009) to effectively
understand cancer screening behavior. Cues to action was not commonly used in cancer
screening studies and, thus, was not included in the current study because of the lack of
valid and reliable items related to this construct.
Assessment Battery
While the current literature provides HBM scales for cancer screening behaviors,
scales to measure cholesterol screening behavior did not currently exist. Thus, there was
a need to develop valid and reliable scales to understand cholesterol screening behavior.
A literature review was conducted using Pubmed, EBSCOhost, and ScienceDirect
databases to identify current measures of HBM constructs for cholesterol screening. In
this search, only one previously established HBM measure was identified, susceptibility,
as it pertains to the outcomes of cholesterol build-up and heart disease (Tovar et al,
2010). Validity (α=0.82) and reliability (r=0.43) were reported for this 5-item
susceptibility scale (Tovar et al., 2010). Since previous scales have not been established
for the remaining HBM constructs (perceived severity, perceived benefits, perceived
barriers, and self-efficacy), the literature was reviewed to identify scales currently being
used to measure HBM constructs as they relate with other screening behaviors to guide
development of HBM scales for cholesterol screening.
HBM has been used to understand screening behaviors for glucose, HIV (Grispen
et al., 2011), and hepatitis C (Lu, Huang, & Chu, 2010). The most expansive and well-
researched screening behavior found in the literature was cancer screenings, specifically,
breast cancer (Champion, 1987; Parsa et al., 2008; Tavafian et al., 2009), prostate cancer
Page 45
33
(Oliver et al., 2011), colorectal cancer (Wagner et al, 2009), and cervical cancer (Guvenc
et al., 2011; Fernandez et al., 2009; Hogenmiller et al, 2007). Using literature that
described the use of HBM to understand cancer screening behaviors, scales were
developed for perceived susceptibility, perceived severity, perceived benefits, perceived
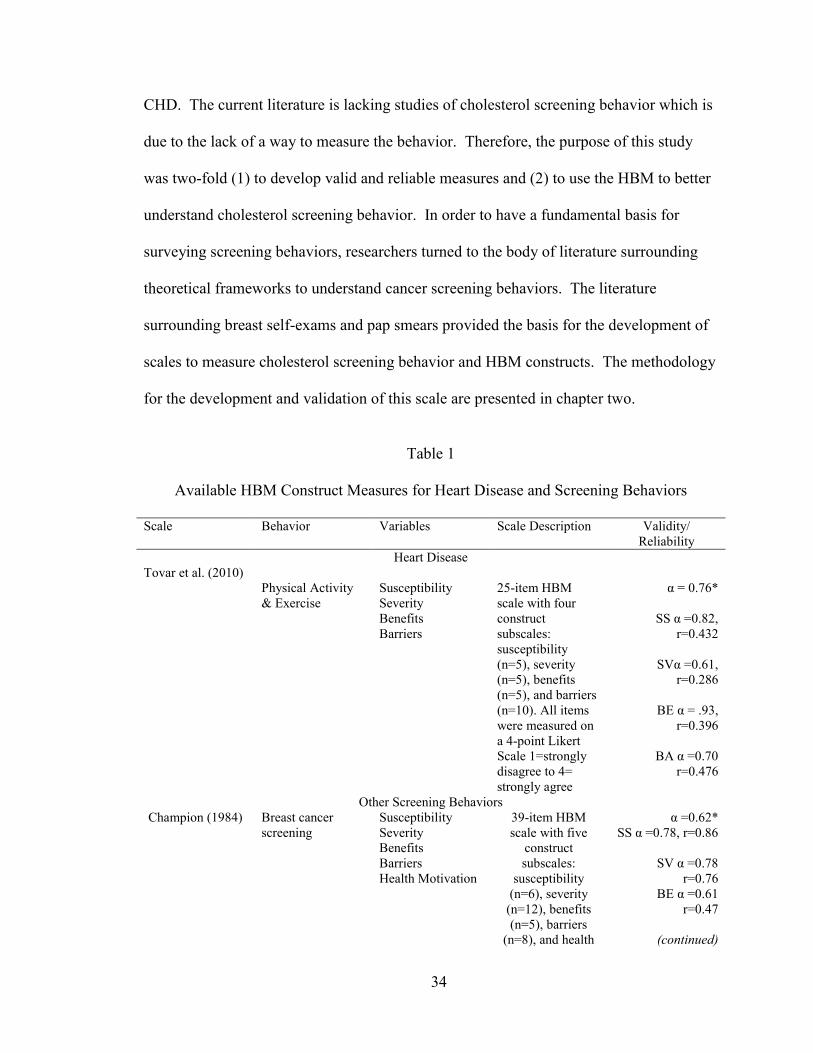
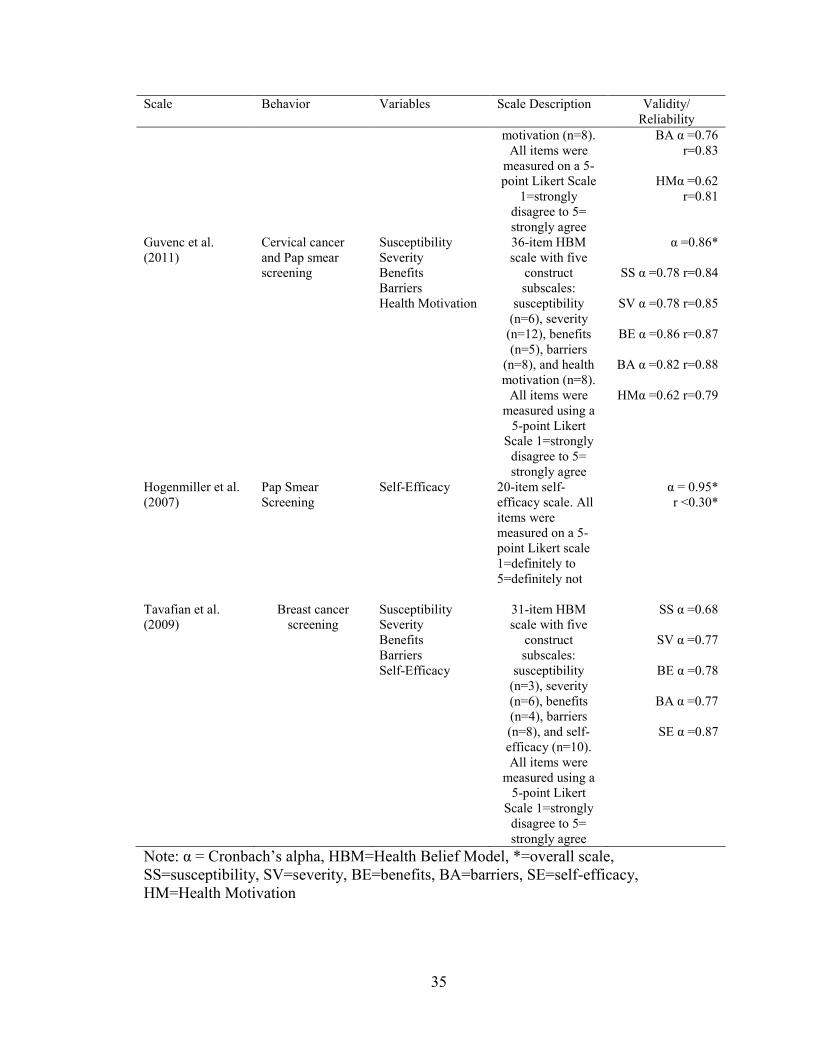
barriers, and self-efficacy, using guidance from existing scales (see Table 1). The
following pre-existing scales were used to develop cholesterol screening behavior HBM
construct scales: the HBM scale (Champion, 1984), the HBM scale adapted for use with
Iranian women (Tavafian et al., 2009), the HBM scale for Cervical Cancer and Pap
Smear test (Guvenc et al., 2011), the HBCVD scale (Tovar et al., 2010), and the Self-
Efficacy scale for Pap Smear Screening Participation (Hogenmiller et al., 2007). Other
items were generated through previously reported qualitative research with rural
communities (Goins et al., 2005; Strickland & Strickland, 1996).
Conclusion
Cardiovascular risk is influenced by a variety of factors, with cholesterol being a
significant predictor, particularly of CHD. High rates of CVD risk and mortality are
prevalent in the U.S., specifically in rural populations. Risk due to elevated cholesterol
levels can be easily measured in a routine cholesterol screening. While some of the
literature has aimed to understand the outcomes of cholesterol screening, such as
participant satisfaction or adherence to medical advice regarding diet change, there has
not been quantitative research conducted to understand actual cholesterol screening
behavior.
There was a need to examine and better understand cholesterol screening behavior,
as cholesterol is a significant predictor of risk for the development of CVD, specifically
Page 46
34
CHD. The current literature is lacking studies of cholesterol screening behavior which is
due to the lack of a way to measure the behavior. Therefore, the purpose of this study
was two-fold (1) to develop valid and reliable measures and (2) to use the HBM to better
understand cholesterol screening behavior. In order to have a fundamental basis for
surveying screening behaviors, researchers turned to the body of literature surrounding
theoretical frameworks to understand cancer screening behaviors. The literature
surrounding breast self-exams and pap smears provided the basis for the development of
scales to measure cholesterol screening behavior and HBM constructs. The methodology
for the development and validation of this scale are presented in chapter two.
Table 1
Available HBM Construct Measures for Heart Disease and Screening Behaviors
Scale Behavior Variables Scale Description Validity/
Reliability
Heart Disease
Tovar et al. (2010)
Physical Activity
& Exercise
Susceptibility
Severity
Benefits
Barriers
25-item HBM
scale with four
construct
subscales:
susceptibility
(n=5), severity
(n=5), benefits
(n=5), and barriers
(n=10). All items
were measured on
a 4-point Likert
Scale 1=strongly
disagree to 4=
strongly agree
α = 0.76*
SS α =0.82,
r=0.432
SVα =0.61,
r=0.286
BE α = .93,
r=0.396
BA α =0.70
r=0.476
Other Screening Behaviors
Champion (1984) Breast cancer
screening
Susceptibility
Severity
Benefits
Barriers
Health Motivation
39-item HBM
scale with five
construct
subscales:
susceptibility
(n=6), severity
(n=12), benefits
(n=5), barriers
(n=8), and health
α =0.62*
SS α =0.78, r=0.86
SV α =0.78
r=0.76
BE α =0.61
r=0.47
(continued)
Page 47
35
Scale Behavior Variables Scale Description Validity/
Reliability
motivation (n=8).
All items were
measured on a 5-
point Likert Scale
1=strongly
disagree to 5=
strongly agree
BA α =0.76
r=0.83
HMα =0.62
r=0.81
Guvenc et al.
(2011)
Cervical cancer
and Pap smear
screening
Susceptibility
Severity
Benefits
Barriers
Health Motivation
36-item HBM
scale with five
construct
subscales:
susceptibility
(n=6), severity
(n=12), benefits
(n=5), barriers
(n=8), and health
motivation (n=8).
All items were
measured using a
5-point Likert
Scale 1=strongly
disagree to 5=
strongly agree
α =0.86*
SS α =0.78 r=0.84
SV α =0.78 r=0.85
BE α =0.86 r=0.87
BA α =0.82 r=0.88
HMα =0.62 r=0.79
Hogenmiller et al.
(2007)
Pap Smear
Screening
Self-Efficacy
20-item self-
efficacy scale. All
items were
measured on a 5-
point Likert scale
1=definitely to
5=definitely not
α = 0.95*
r <0.30*
Tavafian et al.
(2009)
Breast cancer
screening
Susceptibility
Severity
Benefits
Barriers
Self-Efficacy
31-item HBM
scale with five
construct
subscales:
susceptibility
(n=3), severity
(n=6), benefits
(n=4), barriers
(n=8), and self-
efficacy (n=10).
All items were
measured using a
5-point Likert
Scale 1=strongly
disagree to 5=
strongly agree
SS α =0.68
SV α =0.77
BE α =0.78
BA α =0.77
SE α =0.87
Note: α = Cronbach’s alpha, HBM=Health Belief Model, *=overall scale,
SS=susceptibility, SV=severity, BE=benefits, BA=barriers, SE=self-efficacy,
HM=Health Motivation
Page 48
36
CHAPTER THREE
Methodology
Introduction
This study was designed to measure and understand factors that influence
utilization of cholesterol screenings in rural communities in central Texas using the HBM
as a conceptual framework. To understand these factors, a questionnaire was constructed
and distributed to 1,125 members of three rural communities in central Texas: Holland,
Bartlett, and Granger. The questionnaire consisted of questions pertaining to socio-
demographic and health factors, cholesterol screening behavior, and questions to measure
HBM constructs including perceived susceptibility, perceived severity, perceived benefits,
perceived barriers, and self-efficacy.
Purpose
The purpose of this study was to develop HBM construct scales to better
understand the use of cholesterol screenings in rural communities in central Texas, and to
subsequently examine relationships among HBM constructs, current cholesterol
screening behavior, and intention to participate in a future cholesterol screening.
Research Questions
To examine the validity and reliability of the HBM construct scales and to
understand the use of cholesterol screening in rural communities in central Texas, the
following research questions were examined:
Question 1: Are the developed HBM construct measures valid and reliable?
Page 49
37
Question 2: What is the perceived susceptibility and severity of high cholesterol
in rural communities in Central Texas?
Question 3: What are the perceived benefits and barriers of participating in
cholesterol screenings in rural communities?
Question 4: What is the level of self-efficacy to perform cholesterol screenings in
rural communities?
Quesition 5: Are HBM constructs related with current cholesterol screening use?
Question 6: Are HBM constructs related with intention to engage in future
cholesterol screenings?
Question 7: Does insurance status (and other demographic and health variables)
influence the relationships examined in research questions 5 and 6?
Participants
Sample
A convenience sample of community members over 18 years of age who lived or
worked within zip codes for Holland, Granger, or Bartlett, TX were recruited to complete
the questionnaire. Questionnaires were disseminated to 1,125 adults through the
following community partnerships: the Holland and Granger Independent School
Districts (n= 535, 460), the Granger Catholic Church (n=10), the HeartAware Reaching
Rural Populations Program (n=15), as well as other community events (e.g. Bingo)
(n=105).
The sample population was a convenience sample based on previously established
relationships with both communities through the HeartAware Program, where there is
Page 50
38
only one school district within each community. The researcher contacted all
superintendents and gained permission to send surveys home through the school. Bartlett
ISD did not return calls or emails, so surveys were not sent home through that ISD. In
Holland, the researcher was given permission to send home surveys with all grade levels
of the school district and school staff. Within Granger, the researcher was given
permission to send home surveys with all grade levels as well as the staff of the school.
The Catholic Church in Granger was asked to participate in the distribution of surveys
because of a previously established relationship and also due to the high volume of
community members that attend the Catholic Church as opposed to one of the other three
churches in Granger. Churches were contacted in Holland but no response was received.
The HeartAware program was also used to disseminate surveys since it is the only
established health program in any of the communities and there was a previously
established relationship with the HeartAware program.
Sample Size
The desired sample size to establish validity and reliability of the HBM scales
was five times the number of total items (Garson, 2008). Because there were 46 total
survey items for all HBM constructs, a minimum of 230 completed surveys were needed
to ensure sufficient power to examine validity to address research question 1 (Garson,
2008).
To ensure adequate power and validity in the survey, a power of 0.80 (α=0.05)
was desired. Based on perceived variance of 0.05 and 1 degree of freedom, 373 surveys
were needed (Murphy & Myors, 2004). To receive 373 completed surveys, response
rates of the communities needed to be considered. Previous research conducted by rural
Page 51
39
health service departments in various states, such as Montana and Pennsylvania, report an
average response rates of 42-48% in rural communities when conducting health related
research using surveys or questionnaires (Seninger & Bainbridge, 2004; Pennsylvania
General Assembly, 2005). The first round of data collection included the dissemination
of 800 questionnaires. This number allowed for a 42-48% response rate and accounted
for missing data in the Granger, Bartlett, and Holland communities. Of the original 800
surveys disseminated only 115 surveys were returned (response rate of 14.5%). Because
the response rate was low, it was decided to do a second round of data collection. In the
second round of data collection 325 surveys were disseminated (making the total 1,125).
Fifty five more surveys were returned, which made the total number of surveys returned
170 (response rate of 15.1%).
Procedures
Survey Development
To assess the use of cholesterol screenings in participants, a questionnaire was
used that consisted of scales and items that measured socio-demographic variables, health
variables, HBM constructs, and cholesterol screening behavior (See Table 2 for the
distribution of items and Appendix I for the complete survey instrument).
This research was approved by the Institutional Review Board (IRB) at Baylor
University (IRB # 288751-1). Survey items were developed through a four step process.
The first step consisted of reviewing existing scales for items that could be used to
understand HBM constructs in relation to cholesterol screening behavior. The scales
identified to have usable items were the HBM scale (Champion, 1984), the HBM scale
Page 52
40
for Cervical Cancer and Pap Smear test (Guvenc et al., 2011), the HBCVD scale (Tovar
et al., 2010), the SES-PSSP (Hogenmiller et al., 2007), qualitative research, and an expert
panel as described below. These scales were identified through an extensive literature
search (please see chapter 2).
Table 2
Theoretical Frameworks and Behavioral Assessment Scales
Variable Survey
Item
Scales Modifications were based
upon
Validity and
Reliability
Perceived
Susceptibility
1-2
3-7
Expert Panel Review
Tovar et al. (2010)
Not Reported
α =0.82
Perceived Severity 8
9-15
Expert Panel Review
Champion (1984)
Not Reported
α =0.78
Perceived Benefits 16, 18-19
17
Expert Panel Review
Champion (1984)
Not Reported
α =0.21
Perceived Barriers 20-22, 30-
31, 33-35
23-27
28-29, 32
Goins et al (2005);
Strickland & Strickland (1996)
Champion (1984)
Guvenc et al. (2011)
Not Reported
α =0.76
α=0.30-0.46
Self-Efficacy 37-46 Hogenmiller et al. (2007) α =0.95
Demographic
Variables
1-13, 17-
19
19-21
BRFSS (CDC, 2011)
Expert Panel Review
Not Reported
Current Cholesterol
Screening
14
15
BRFSS (CDC, 2011)
Expert Panel Review
Not Reported
Future Cholesterol
Screening
17 Expert Panel Review Not Reported
Note: BRFSS= Behavior Risk Factor Surveillance System, CDC= Center for Disease
Control, α = Cronbach’s alpha.
Page 53
41
Once these scales were identified, items that were deemed usable by the author
were arranged into a draft of the survey instrument by HBM construct and the wording of
items was adjusted to reflect cholesterol screening. The second step consisted of
developing survey items from the existing qualitative data that suggest various barriers to
accessing healthcare in rural populations.
Once the complete questionnaire was compiled, it was submitted to an expert
panel, which consisted of one expert in qualitative research, one expert in behavioral
research, one expert in internal medicine and cardiology, and one expert in rural public
health, for review. The expert panel reviewed the instrument as a whole to determine
whether its scope and sequence were appropriate, as well as wording, appropriateness for
the target population, and appropriateness for the construct the item should be measuring.
Once the suggestions from each member of the expert panel were received, the
instrument was edited. The editing process involved deleting items, adding new items,
and changing the wording of items. After the instrument was edited, it was submitted
back to two members of the expert panel for final review of item wording and to establish
face validity. The Flesch-Kincaid Readability test was then conducted to determine
readability level. The resulting survey had a Flesch-Kincaid reading score of 6.1, which
falls within the recommended reading level for the general population, between fifth and
seventh grade (DeVellis, 2003). Although the reading level may be high for the intended
rural population, a lower reading score was unattainable. The Flesch-Kincaid reading
score takes into account various criteria when assessing the reading level of the document,
one of those criteria is the number of syllables in words, thus the use of four syllable
words raises the reading level of the document. The reading level of the scale was high
Page 54
42
in part due to the word “cholesterol,” which is a four syllable word. The survey uses
“cholesterol” in most survey items which contributed to a relatively high Flesch-Kincaid
reading score that could not be lowered.
Socio-demographic and Health Variables
The majority of the questions regarding demographic variables were derived from
questions included in the 2011 BRFSS (CDC, 2011). The BRFSS is an annual, state-
based system of telephone surveys that was developed by the CDC in 1984. The BRFSS
includes questions pertaining to health risk behaviors, preventative health practices, and
healthcare access primarily related to chronic disease and injury prevalence and
prevention. The BRFSS includes data monthly from all 50 states and publishes regional
and national data analyses. The BRFSS is a public domain scale. This research study
used sixteen variables from the BRFSS (CDC, 2011). The questions included age,
gender, self-reported height and weight, race/ethnicity, marital status, education level,
employment status, health care insurance status, disease status, cigarette smoking,
diabetes status, physical activity status, blood pressure screening, and income.
Other variables, zip code, distance to the nearest town, and mode of transportation
to and from medical appointments were developed by the expert panel. Zip codes were
used to identify residence in the communities of Holland, Granger, and Bartlett or
another surrounding rural community. Two more variables, BMI and disease index, were
based on answers to previous questions. BMI was created using participants’ height and
weight. The disease index was constructed using the results of the disease statuses, in
order to understand how many diseases each individual participants had.
Page 55
43
Cholesterol Screening Behavior
In order to understand cholesterol screening behavior, three questions were
included in the demographic portion of the survey instrument to understand past
screening behaviors and intention to participate in cholesterol screening behavior. Two
questions were used to understand previous cholesterol behavior, one of which was
adapted from the 2011 BRFSS questionnaire (CDC, 2011). The original question was
stated as “About how long has it been since you last had your blood cholesterol
checked?” with answer choices consisting of “Within the past year, within the past two
years, within the past 5 years, 5 or more years ago, and don’t know/not sure.” The
question was adapted to “when was the last time you had your blood cholesterol
checked?” for clarity and readability purposes, with answer choices being changed to
“within the past year, within the past two years, within the past 5 years, 5 or more years
ago, never, and don’t know/not sure” to allow for the possibility of a participant never
having their cholesterol checked. For the statistical analysis of this item, answer
responses were dichotomized into 2 groups. The first group included screenings within
the American Heart Association’s (AHA) recommendation for cholesterol of every 5
years, which included answer choices “within the past year, within the past two years,
and within the past 5 years” (AHA, 2010). The second group included any respondents
reporting screening outside of this recommendation, which would include the answer
choices “5 or more years ago, never, and don’t know/not sure.”
A second question used to understand past behavior was developed by the expert
panel to understand where cholesterol screening is taking place. The question was
phrased as “Where did you get your blood cholesterol checked most recently?” with the
Page 56
44
answer choices of “doctor’s office, screening program, hospital, or I have not had my
cholesterol checked.”
A third question was included by the expert panel to measure intention for future
behavior which was phrased as “Do you intend to get your cholesterol checked in the
next month?” with answer choices of “yes” or “no”. The phrase “next month” was used
instead of “next 30 days” to allow for a general estimation, instead of a finite number of
days, when they will next screen their cholesterol. This measure of intention allowed the
relationship between HBM constructs and intention to be screened to be examined in this
study.
Health Belief Model
Perceived susceptibility. Perceived susceptibility is the likelihood of contracting
a certain condition within a specified time frame (Champion & Skinner, 2008). A seven-
item scale was constructed to measure perceived susceptibility; five of the items were
from the HBCVD scale (Tovar et al., 2010). The HBCVD scale was developed by Tovar
et al. to understand beliefs surrounding CVD in type-II diabetes patients. The original
Cronbach’s alpha for Tovar’s 5-item susceptibility subscale was 0.82. The five items
SS3-SS7 (survey items 3-7) that appeared in the current scale were from Tovar et al.’s
susceptibility subscale including the original wording of the items. The remaining two
items SS1-SS2 (survey items 1-2) derived through the expert panel review were “I have
or will probably develop high cholesterol during my life” and “I worry about having high
cholesterol”. These items were added to ascertain whether participants saw themselves
as susceptible to high cholesterol, which was not measured by existing items. The
Page 57
45
validity and reliability of the developed items were evaluated through this research (see
research question 1). Participants were asked to rank the seven items using a 5-point
Likert scale. The points of the Likert scale were as follows: 1=strongly disagree to
5=strongly agree. Possible perceived susceptibility scores were calculated by averaging
the Likert scale responses for all items, in accordance with methods used in Tavafian et al.
(2009), thus the scores can range from 1 to 5, with higher scores indicating greater
perceived susceptibility. Scores were reported as a mean for each item and the overall
scale.
Perceived severity. Perceived severity is the perceived degree of threat a
condition or its consequences presents to a person (Champion & Skinner, 2008). An
eight-item scale was developed to measure perceived severity, seven items (items 9-15)
were items modified from Champion’s HBM Scale (Champion, 1984). The HBM Scale
was developed by Victoria Lee Champion at Indiana University to understand HBM
constructs as they relate to breast self-examinations and breast cancer. The seven severity
items used in the current scale were taken from the original twelve item subscale in
Champion’s HBM Scale which reported a Cronbach’s alpha of 0.78 (Champion, 1984).
The remaining five items in the original scale did not translate to cholesterol screening
behaviors according to members of the expert panel. The terminology of five items SV2-
SV3, SV5-SV6, SV8 (survey items 9, 10, 12, 13, 15) from Champion’s scale were
adjusted to cholesterol screenings and CVD. For example, the Champion’s item read “If
I had breast cancer, my whole life would change”, which was changed to “If I had a heart
attack or stroke, my whole life would change.” The other two items SV4 and SV7
(survey items 11, 14) from Champion’s scale were edited by the expert panel to include
Page 58
46
statements regarding cholesterol screenings and CVD as well as a more appropriate
reading level, increasing understandability for the target population. For example, SV4
(survey item 11) in the original scale read “Breast cancer would endanger my marriage
(or a significant relationship)” which the expert panel changed to “If I had a heart attack
or stroke, it would be hard on my family.” The expert panel felt that this question better
fit the understanding that CVD affected all familial relationships, not just marriages, and
the change of wording showed consistency with other items which would be more easily
understood for the target population. The remaining item SV1 (survey item 8), which
states “If I have high cholesterol, I will be more likely to have a heart attack or stroke,”
was derived from the expert panel in order to understand if participants linked high
cholesterol levels to the severe outcomes of heart attack or stroke. In accordance with
methods used in Tavafian et al. (2009), participants were asked to respond to each of the
eight items using a 5-point Likert Scale. The points of the Likert Scale ranged from
1=strongly disagree to 5=strongly agree. Perceived severity scores ranged from 1 to 5,
with higher scores relating to higher perceived severity. Perceived severity was reported
as a mean for each item and the overall scale.
Perceived benefits. Perceived benefits are the positive consequences associated
with a specific behavior (Champion & Skinner, 2008). Perceived benefits were measured
using a four-item scale. One item BN2 (survey item 17) within this scale was derived
from Champion’s original 5-item benefits subscale in the HBM scale with modifications
in the terminology to fit the concept of cholesterol screenings and CVD. The item
previously read “I would not be so anxious about breast cancer if I did monthly exams”
and was changed to “I would not be so anxious about a heart attack or stroke if I got my
Page 59
47
cholesterol checked.” This was the only item retained from Champion’s original
subscale after review by the expert panel; whereby the expert panel concluded that the
other benefit items did not translate to cholesterol screening behaviors. The remaining
three items SV1, SV3, and SV4 (survey items 16, 18, 19) were derived through the expert
panel to better grasp benefits that were related to cholesterol screening that were not
examined in the cancer screening scales. These items were SV1: “Knowing my
cholesterol level can help me stay healthy”, SV3: “When I do cholesterol checks, it is
good for my health”, and SV4: “Regular cholesterol checks lower the risk of having a
heart attack or stroke.” In accordance with methods used in Tavafian et al. (2009),
participants were asked to respond to each of the four items using a 5-point Likert Scale.
The points of the Likert Scale ranged from 1=strongly disagree to 5=strongly agree. The
average perceived benefits scores ranged from 1 to 5, with higher scores indicating higher
perceived benefits. Perceived benefits were reported as a mean for each item and an
overall mean score.
Perceived barriers. Perceived barriers are negative consequences associated with
a specific behavior (Champion & Skinner, 2008). Perceived barriers were measured with
a sixteen-item scale. Five items BA4-BA8 (survey items 23-27) were adapted from the
eight-item barrier subscale in the Champion’s HBM Scale (1984) which had a
Cronbach’s alpha of 0.76. Only five items were taken from the original eight-item
subscale because the expert panel decided that three of the items were not easily
understood or were not applicable to cholesterol screenings and CVD. Of five items that
were used, BA4 and BA6 (survey items 23, 25) were modified to depict cholesterol
screenings and CVD, such as “It is embarrassing for me to do monthly breast exams”
Page 60
48
being changed to “It is embarrassing for me to get my cholesterol checked.” The other
three items BA5, BA7, and BA8 (survey items 24, 26, 27) were modified for readability
and clarity; such as “Self breast exams are time consuming” being modified to read as
“Getting my cholesterol checked takes too much time.”
Three items BA9, BA10, and BA13 (survey items 28, 29, 32) were derived from
Guvenc et al.’s HBM Scale for Cervical Cancer and Pap Smear Test (2011). The HBM
scale for Cervical Cancer and Pap smear test was developed by Guvenc et al. (2011).
This scale was adapted from Champion’s HBM scale in order to directly address Cervical
Cancer and Pap smear testing. Most of the items are similar to those that exist in the
original scale aside from the adaptation to Cervical Cancer and Pap smear test
terminology. Of the three items, wording of one item, BA10 (survey item 29), was
modified from pap smear to cholesterol screening: “I have other problems more
important than having Pap Smear Test in my life” to “I have other problems more
important than having my cholesterol checked.” The other two items BA9 and BA13
(survey items 28, 32) were modified to reflect cholesterol screening, and further
modifications in wording were made to increase readability and clarity. For example,
BA9 (survey item 28) originally read “I neglect or cannot remember to have a Pap Smear
test regularly.” This item was modified to read “It is hard to remember to get my
cholesterol checked.” The remaining eight items BA1-BA3, BA11-BA12, and BA14-
BA16 (survey items 20-22, 30-31, 33-35) were developed based on qualitative research
that defined barriers faced by rural community members in the access and utilization of
healthcare, the barriers addressed included transportation difficulties, limited health care
supply, lack of quality healthcare, social isolation, financial constraints, and lack of trust
Page 61
49
in healthcare providers (Goins et al., 2005; Strickland & Strickland, 1996). The validity
and reliability of this newly developed barriers scale was examined through the proposed
research (see research question 1). All items were adapted to fit the terminology
associated with cholesterol screenings and CVD. In accordance with methods used in
Tavafian et al. (2009), participants were asked to respond to the four items using a 5-
point Likert Scale. The points of the Likert Scale ranged from 1=strongly disagree to
5=strongly agree. The average perceived barriers scores ranged from 1 to 5, with higher
scores equating to higher perceived barriers. Perceived barriers were reported as a mean
for each item and an overall mean score.
Self-Efficacy. Self-efficacy is the confidence in one’s ability to perform a specific
behavior when confronted by challenges to performing the behavior (Bandura, 1977).
Self-efficacy was measured with a ten-item scale derived from the Self-Efficacy Scale for
Pap Smear Screening Participation, where wording was modified to reflect cholesterol
screenings (SES-PSSP; Hogenmiller et al., 2007). SES-PSSP was developed by
Hogenmiller et al. (2007) to understand Pap smear screening self-efficacy in the face of
barriers. The SES-PSSP was piloted in 2007 using women in inner-city shelters
(Hogenmiller et al., 2007). The original scale had 20-items (Cronbach’s alpha=0.95);
however, some items were not selected for adaptation in this study because they were not
applicable to all members of the population being measured, such as questions related to
living in drug treatment centers or heavy alcohol drinking behaviors. All items in the
original scale were preceded by the statement “How likely are you to get a Pap smear…”,
which was modified to “How likely are you to get your cholesterol checked” for the
current research purposes. Additional item wording was not changed. Participants were
Page 62
50
asked to respond to the items using a 5-point Likert Scale as originally developed by
Hogenmiller et al. (2007). Response options for the self-efficacy scale differed from the
rest of the HBM scales. The points of the Likert Scale were as follows 1=very unlikely,
2= unlikely, 3=neutral, 4=likely, 5=very likely. Average self-efficacy scores ranged from
1 to 5, with higher scores indicating greater self-efficacy. Self-efficacy scores were
reported as an overall mean score.
Data Collection
The first round of data collection consisted of questionnaire packets containing a
completion checklist, informed consent form, and survey, which was sent home with
students of both Holland and Granger schools on December 1, 2011. The potential
participants were supplied with an IRB approved informed consent form (see Appendix
C), which detailed the process of data collection and participant risk. The consent form
also informed the participants that the survey was completely anonymous, that they could
withdraw from the study at any point, and their eligibility for the incentive. In Holland,
surveys were sent home to parents through children in the elementary school, middle
school, the high school, and also to the school staff (n= 535). In Granger, the surveys
were sent home to parents through the elementary school students (n=175) and were
given to all teachers and staff (n=60) through their mailboxes in the staff lounge. Ten
surveys were sent out through the Granger Catholic Church’s office to staff and the
deacon board members. Fifteen surveys were distributed to participants of the
HeartAware program in Granger when they came to participate in the program on
December 7, 2011. All participants were asked to return the surveys to the school nurses,
church secretary, or representatives of the Heart Aware program by December 9, 2011.
Page 63
51
Due to a low response rate, a second round of data collection was conducted at the
beginning of January 2012. Granger Independent School District was contacted again to
send surveys home with middle school and high school students (n=225). The third
school district, Bartlett, did not return phone calls regarding participation. The
researchers contacted other community organizations in Holland and Granger, such as
Bingo, to find other means of data collection. Researchers attended Bingo on January 19,
2012.
Upon completion of a survey, the name of each participant who completed and
returned an informed consent and survey form was entered into a drawing for one of ten
prizes. The participants selected in the drawing had a choice of a prize (e.g., a portable
DVD player, MP4 player, or video MP3 player) or a check for $100. Survey packets
were returned to the school nurses, the church secretary, a research assistant, and the
nurse who works for the HeartAware program. When the nurse, secretary, or research
assistant received the survey packets, they removed the informed consent form from the
survey and stored the consent forms in one envelope and the surveys in a second
envelope. When the researcher picked up the surveys the informed consent forms were
no longer associated with each survey, preserving anonymity. The surveys and informed
consent forms were stored separately in a locked filing cabinet. The drawing was
conducted using the information on the informed consent forms which had been
previously removed from the survey, by the nurses, church secretary, or research
assistant. Once the names were drawn for the prizes, the participants whose names were
drawn were contacted using the information on the informed consent form. After the
drawing, the consent forms were returned to a locked filing cabinet.
Page 64
52
Study Design
This study used a cross-sectional research study design. Each participant was
given the survey one time during the period of data collection. There was not a
comparison or control group.
Timeline
The literature review and the development of the survey occurred over the months
of August and September, 2011. On October 10, 2011 the developed survey instrument
was sent to the expert panel for review. Feedback from the expert panel was received on
October 13, 2011. Updates to the survey were made and a final version of the survey
instrument was established on November 7, 2011. The internal Institutional Review
Board (IRB) proposal for the research study was submitted to the Department of HHPR
on November 8, 2011. Internal IRB approval was granted on November 14, 2011.
Changes were made and the University IRB application was submitted November 18,
2011. On November 21, 2011, the IRB was approved by Baylor University as exempt.
On November 22, 2011, the surveys were printed and packets were assembled into
envelopes for distribution. On November 30, 2011, the surveys were delivered to the
Holland and Granger school districts, the Granger Catholic Church, and the HeartAware
program for distribution on December 1, 2011. The first round of data collection was
completed on December 9, 2011. The thesis proposal occurred on December 13, 2011.
The second round of data collection was conducted January 11-25, 2012. The drawing
for incentives occurred at the end of February. The remainder of January and February
2012 was devoted to entering and analyzing data.
Page 65
53
Statistical Analysis
Once the questionnaires were returned, data was entered, cleaned, and analyzed
using SPSS 19. One hundred percent of the data was checked, by a second research
assistant, for data entry error prior to the commencement of analysis. Descriptive
statistics, such as means and standard deviations, were used to examine demographic
characteristics of the sample and responses to HBM subscales.
Research Question 1
In order to determine the validity and reliability of the HBM measures,
Exploratory Factor Analysis (EFA) was conducted for each HBM scale (perceived
susceptibility, perceived severity, perceived benefits, and perceived barriers).
Cronbach’s alpha was also used to examine the internal consistency of the items for each
HBM construct scales (perceived susceptibility, perceived severity, perceived benefits,
perceived barriers, and self-efficacy).
Research Question 2
In order to understand perceived susceptibility and perceived severity of high
cholesterol in rural communities in central Texas descriptive statistics were used.
Specifically, means and standard deviations of each overall construct score were reported,
and frequencies related to each perceived susceptibility and perceived severity item were
reported in order to better understand which aspects of perceived susceptibility and
perceived severity were most commonly noted among these rural populations.
Page 66
54
Research Question 3
In order to understand the perceived benefits and perceived barriers of
participating in cholesterol screenings in rural communities descriptive statistics were
used. Specifically, means and standard deviations of each overall construct were reported,
and frequencies related to each perceived benfit and perceived barrier item were reported
in order to examine which perceived benefits and perceived barriers were most
commonly faced in these rural communities.
Research Question 4
In order to understand the level of self-efficacy for participating in cholesterol
screenings in rural communities descriptive statistics were used. Specifically, means and
standard deviations of each overall construct were reported, and frequencies related to
each self-efficacy item were reported in order to undestand which aspects of self-efficacy
were more commonly faced in these rural communities
Research Question 5
In order to determine if the constructs of the HBM were related with current
cholesterol screening utilization, both bivariate and multivariate analyses were conducted.
The average score variables for each HBM constructs and meeting current guidelines for
cholesterol screening behavior were used to construct a correlation matrix. Pearsons
correlation coefficients were calculated for continuous variables and point biserial
correlation coefficients for categorical variables. One-way ANOVAs were also
conducted to further examine potential differences in HBM constructs for meeting or not
meeting current cholesterol screening guidelines. Logistic regression analysis was then
Page 67
55
conducted using meeting cholesterol screening guidelines as the depedent variable and
the HBM constucts (perceived susceptibility, perceived severity, perceived benefits,
perceived barriers, and self-efficacy) as the independent variables.
Research Question 6
To determine the relationship between HBM constructs and intention to engage in
future cholesterol screenings, both bivariate and multivariate analyses were conducted.
The average score variables for each HBM constructs and future cholesterol screening
were used to construct a correlation matrix. Pearson correlation coefficients were
calculated for continuous variables and point biserial correlation coefficients for
categorical variables. One-way ANOVAs were also conducted to further examine
potential differences in HBM constructs for intention or the lack of intention to engage in
cholesterol screeening. Logistic regression analysis was then conducted using future
cholesterol screening as the depedent variable and the HBM constucts (perceived
susceptibility, perceived severity, perceived benefits, perceived barriers, and self-
efficacy) as the independent variables.
Research Question 7
Multivariate analyses were used to examine if these relationships were impacted
when controlling for insurance coverage and other demographic variables (e.g. age,
gender, and ethnicity). Specifically, logistic regression analysis was run, first, using
meeting cholesterol screening guidelines as the depedent variable and the HBM constucts
(perceived susceptibility, perceived severity, perceived benefits, perceived barriers, and
self-efficacy) as the independent variables, and insurance status as the covariate. Then
Page 68
56
logistic regresstion analysis was run using future cholesterol screening as the depedent
variable and the HBM constucts (perceived susceptibility, perceived severity, perceived
benefits, perceived barriers, and self-efficacy) as the independent variables, and insurance
status as the covariate (see Table 3 below for list of all statistical analyses).
Table 3
Variable Analysis based on Research Questions
Research Questions Variables Analysis
1. Are the developed HBM
construct measures valid and
reliable?
Perceived Susceptibility
Perceived Severity
Perceived Benefits
Perceived Barriers
Self-Efficacy
Exploratory Factor Analysis
Cronbach’s alpha
2. What is the perceived
susceptibility and severity of
high cholesterol in rural
communities in Central
Texas?
Perceived Susceptibility
Perceived Severity
Descriptive statistics: means and
percentages
Frequencies by variable
3. What are the perceived
benefits and barriers of
participating in cholesterol
screenings in rural
communities?
Perceived Benefits
Perceived Barriers
Descriptive statistics: means and
perecentages
Frequencies by variable
4. What is the level of self-
efficacy need to perfomr
cholesterol screenings in rural
communities?
Self-Efficacy Descriptive statistics: means and
perecentages
Frequencies by variable
5. Are constructs of the HBM
related with current
cholesterol screening use?
Perceived Susceptibility
Perceived Severity
Perceived Benefits
Perceived Barriers
Self-Efficacy
Previous cholesterol screening
Pearson correlation coefficients
Biserial correlation coefficients
Logistic regression analysis
6. Are HBM constructs
related with intention to
engage in future cholesterol
screenings?
Perceived Susceptibility
Perceived Severity
Perceived Benefits
Perceived Barriers
Self-Efficacy
Future cholesterol screening
Pearson correlation coefficients
Biserial correlation coefficients
Logistic regression analysis
(continued)
Page 69
57
Research Questions Variables Analysis
7. Does insurance status
influence the relationships
examined in research
questions 5 and 6?
Perceived Susceptibility
Perceived Severity
Perceived Benefits
Perceived Barriers
Self-Efficacy
Future cholesterol screening
Previous cholesterol screening
Insurance Status
Logistic regression analysis
*Note: HBM=Health Belief Model
Page 70
58
CHAPTER FOUR
Results
The purpose of this study was to develop HBM construct scales to better
understand the use of cholesterol screenings in rural communities in central Texas, and to
subsequently examine relationships among HBM constructs, current cholesterol
screening behavior, and intention to participate in a future cholesterol screening. Data
was collected in two rounds. The first round of data collection returned 115 surveys by
mid-December. Because the quantity of returned surveys was so small, the researchers
decided to conduct another round of data collection. The second round of data collection
yielded an additional 55 completed surveys, making the total completed 170. Of the
1,125 cholesterol screening behavior surveys distributed, 170 were completed and
returned (15.1%). The data was entered into an excel document and 100% of the entered
data was verified by a second researcher. Data was then transferred into SPSS 19 and
was cleaned and analyzed. New variable measures were created for BMI using the height
and weight variables collected in the survey (BMI= [weight (lb.)/height (in)2 x 703] ) and
other variables were dichotomized in order to conduct analyses of interest (BMI,
insurance, race/ethnicity, income, and cholesterol screening).
Demographic Variables
A total of 21 demographic and health variables were asked in the survey. Please
see table 4 for demographic characteristics. Participants were predominantly white
(75.9%) and female (77.6%), with an average age of 45.3 years (SD=15.26). On average
Page 71
59
participants had completed the 12th
grade or equivalent. Over 65% percent of the
participants were married and 55.3% were employed for wages. The average income was
below $50,000 (58%) and 81.2% reported living within a rural community.
Please see table 5 for health-related characteristics of the sample. Over 73% of
participants reported having some kind of healthcare insurance (including Medicare and
Medicaid), and 93.5% reported having their own vehicle that could be used to get to a
medical appointment. Over 33% admitted to smoking at least some days during the week.
Around 77% reported exercising at least once a week. The average BMI of the sample
population was 30.34 (SD=7.62), indicating the average person is considered obese (BMI
≥ 30.0). Disease statuses related to CVD were asked as a part of the demographic
variables of the survey, the main conditions reported were high blood pressure (30%),
high cholesterol (25.9%), and diabetes (14.7%). Disease was also reported as an index
for how many diseases were identified by each participant, 45.4% reported having at least
one of the listed diseases, and the average number of diseases for the sample was 0.76
(SD=0.98). Screening for blood pressure, blood sugar, and cholesterol were also reported
(see table 5 below). A variable was created to further dichotomize cholesterol screenings
into those who met the AHA’s recommendation for being screened at least once in the
last five years (74.6%) and those who did not (25.4%).
Page 72
60
Table 4
Demographic Characteristics of the Sample (N=170)
Sample Characteristics N %
Age
(N=166)
20-29
30-39
40-49
50-59
60-69
70-79
80-89
20
52
37
28
12
11
6
11.8%
30.8%
21.8%
16.5%
7.2%
6.6%
3.6%
Gender
(N=167)
Male
Female
35
132
20.6%
77.6%
Race/Ethnicity
(N=167)
White
African American
Hispanic
Asian/Pacific Islander
129
10
25
3
75.9%
5.9%
14.7%
1.8%
Marital Status
(N=166)
Married
Divorced
Widowed
Separated
Never Married (single)
Member of an unmarried couple
111
15
14
9
11
6
65.3%
8.8%
8.2%
5.3%
6.6%
3.5%
Level of
Education
(N=167)
Grades 1-8
Grades 9-11
Grade 12 or GED
College 1-3 years
College 4 years or more
6
18
57
46
40
3.5%
10.6%
33.5%
27.1%
23.5%
Employment
(N=161)
Employed for wages
Self-employed
Out of work >1 year
Homemaker
Student
Retired
94
7
17
24
4
15
55.3%
4.1%
10.5%
14.1%
2.4%
8.8%
Living Rural
Urban
138
29
81.2%
17.1%
Distance from
town
(N=168)
Live in town
1-5 miles out of town
5-10 miles out of town
More than 10 miles out of town
73
31
28
36
42.9%
18.2%
16.5%
21.2%
Income
(N=160)
Less than $19,999
$20,000 to $39,999
$40,000 to $59,999
$60,000 to $79,999
$80,000 or greater
39
40
28
20
32
22.9%
23.6%
16.5%
11.8%
18.9%
Transportation
(N=167)
Own vehicle
Family member’s vehicle
Friend’s vehicle
159
5
3
93.5%
2.9%
1.8%
* %=percent of the sample, N=sample size, cell N values differ because of missing data
Page 73
61
Table 5
Health Status Characteristics of the Sample
Sample Characteristics N Total
Insurance
(N=165)
Yes
No
125
39
73.5%
23.0%
BMI
(N=155)
≤ 25
25-29.99
≥30
38
46
71
22.4%
27.1%
41.7%
Disease Status
(N=170)
Diabetes
Heart Attack
Angina
High Blood Pressure
Bypass or Stent
Congestive Heart Failure
High Cholesterol
Stroke or TIA
25
4
10
51
2
1
44
4
14.7%
2.4%
5.9%
30.0%
1.2%
0.6%
25.9%
2.4%
Disease Index
(N=170)
0 diseases
1 disease
2 diseases
3 diseases
4+ diseases
93
37
27
9
4
54.7%
21.8%
15.9%
5.3%
2.4%
Smoking
(N=167)
Everyday
Some days
Not at all
35
22
110
20.6%
12.9%
64.7%
Tested for high Blood Sugar
(N=169)
Yes
No
103
57
60.6%
38.2%
Exercise
(N=167)
Don’t exercise
Once a month
Once a week
3-5 times a week
Once a day
25
11
35
41
55
14.7%
6.5%
20.6%
24.1%
32.4%
Tested Cholesterol
(N=169)
Within the past year
Within past 2 years
Within past 5 years
>5 years ago
Never
90
28
8
4
39
52.9%
16.5%
4.7%
2.4%
22.9%
Intention to check Cholesterol in next
month
(N=165)
Yes
No
53
112
31.2%
65.9%
Tested Blood Pressure
(N=169)
Within past year
Within past 2 years
Within past 5 years
>5 years ago
Never
153
3
3
2
8
90.0%
1.8%
1.8%
1.2%
4.7%
* %=percent of the sample, N=sample size, cell N values differ because of missing data
Page 74
62
Research Questions
To examine the validity and reliability of the HBM construct scales and to
understand the use of cholesterol screening in rural communities in central Texas, the
following research questions were examined:
Question 1: Are the developed HBM measures valid and reliable?
Question 2: What are the perceived susceptibility and severity of high cholesterol
in rural communities in Central Texas?
Question 3: What are the perceived benefits and barriers of participating in
cholesterol screenings in rural communities?
Question 4: What is the level of self-efficacy to perform cholesterol screenings in
rural communities?
Question 5: Are constructs of the HBM related to current cholesterol screening
use?
Question 6: Are HBM constructs associated with intention to engage in future
cholesterol screenings?
Question 7: Does insurance status (and other demographic and health variables)
influence the relationships examined in research questions 5 and 6?
Research Question 1
1. Are the developed HBM measures valid and reliable?
Exploratory Factor Analysis (EFA) was conducted in order to answer research
question 1. Items were examined for logical model fit using the following guidelines:
eigenvalues ≥1.0 and scree plots for the factor(s), a communality >0.45 (Stevens, 2002),
Page 75
63
and simple structure loading on at least one factor ≥ 0.40 to be retained and no cross-
loadings ≥ 3.2 for two or more factors (Tabachnick & Fidell, 2001).
If an item had communality ≤0.45, it was further reviewed and in the case of
multiple items having communalities ≤0.45, the item with the lowest communality ≤0.45
was removed (Stevens, 2002). After ensuring communalities >0.45, all items with cross-
loadings were examined and removed one at a time. This decision was based on
examining all factors with cross-loadings and retaining the factor(s) that demonstrated the
highest single loading on one of the factors for which it cross-loaded. Items were
examined and removed one at a time to ensure logical model fit. At least three items
were retained for every factor (or scale if it only had one factor), even if the cross-loading
was a slightly above 3.2 (Costello & Osbourne, 2005).
Perceived Susceptibility
Perceived susceptibility was measured using seven items; five of the items were
from the HBCVD scale (Tovar et al., 2010) and two items were derived by an expert
panel. The perceived susceptibility scale started with seven items (SS1-SS7). EFA was
conducted using the cutoff points of an eigenvalue >1 to be considered a factor, a
communality >0.45, and simple structure with a factor loading of >0.40 on one factor and
not cross-loading ≥ 3.2 on two or more factors. If these constraints were not met, each
item was examined individually and items were removed one at a time to ensure
appropriate removal.
An eigenvalue of 4.67 and a scree plot revealed one factor. All items had
communalities of >0.45 (range: 0.57-0.78), all factors loaded on only one factor and each
loaded above 0.40 (range: 0.75-0.88). Therefore, there was no modification of the
Page 76
64
susceptibility scale. The final perceived susceptibility scale was a one factor scale with
seven items and a Cronbach’s alpha of 0.92. The factor accounted for 66.65% of the
variance. The items, characteristics, and factor loadings can be seen in Table 6.
Table 6
Perceived Susceptibly Items and Exploratory Factor Analysis Characteristics
Cholesterol Survey Definitions and Items M (SD) α Eigenvalue Factor
Loading
Overall Scale 2.90
(0.96)
0.915 4.666
SS1: I have or will probably develop high
cholesterol during my life.
0.766
SS2: I worry about having high cholesterol. 0.753
SS3: It is likely that I will suffer from a heart attack
or stroke in the future.
0.859
SS4: My chances of suffering from a heart attack or
stroke in the next few years are great.
0.881
SS5: I feel I will have a heart attack or stroke
sometime during my life.
0.807
SS6: Having a heart attack or stroke is currently a
possibility for me.
0.833
SS7: I am concerned about the chance of having a
heart attack or stroke in the near future.
0.808
*SS=susceptibility, M=mean, SD=standard deviation, α= Cronbach’s alpha
Perceived Severity
Perceived severity was measured using eight items, seven items of which were
modified using items from the HBM scale (Champion, 1984) and one item derived by the
expert panel. The perceived severity scale started with eight items (SV1-SV8, see table 7
for item wording). EFA was conducted using eigenvalues >1 to be considered a factor, a
communality >0.45, and simple structure with a factor loading of >0.40 on one factor and
not cross-loading ≥ 3.2 on two or more factors. If these constraints were not met, each
item was examined individually and items were removed one at a time to ensure
appropriate removal.
Page 77
65
Table 7
Original Perceived Severity Scale Items
Item Wording
SV1: If I have high cholesterol, I will be more likely to have a heart attack or stroke.
SV2: If I had a heart attack and stroke, my whole life would change.
SV3: Having a heart attack or stroke will cause problems that would last a long time.
SV4: If I had a heart attack or stroke it would be hard on my family.
SV5: The thought of having a heart attack or stroke scares me.
SV6: If I had a heart attack or stroke I might not be able to work.
SV7: If I had a heart attack or stroke I might not be able to provide for myself or my family.
SV8: My feelings about myself would change if I had a heart attack or stroke.
*SV=severity
The original EFA eigenvalues and scree plot suggested two factors. The
eigenvalues of the factors were Factor 1 = 4.28 and Factor 2 = 1.05. The communalities
revealed item SV5 to have a communality ≤0.45. Thus, item SV5 was removed due to its
low communality (0.45). In the second modification, the eigenvalue and scree plot
indicated two factors with eigenvalues of Factor 1 =3.88 and Factor 2 =1.05. All items
showed communalities >0.45. However, three items (SV2, SV3, SV4) cross-loaded on
both factors. SV3 was removed due cross-loading with moderate loadings on both
factors (0.59, 0.61). Moderate loading was defined as the factor loaded > 3.2 on both or
more factors, but when the other factor loadings were assessed, this factor had the lowest
factor loadings in comparison to the other factors that had cross-loadings. Thus, the
factor retained, demonstrated the highest single factor loading in comparison to the others
with cross-loadings.
In the third modification, the eigenvalues and scree plot still supported two factors
with eigenvalues of Factor 1 = 3.24 and Factor 2 = 1.03. All communalities were >0.45.
Two items (SV2 and SV4) loaded on both factors resulting in SV2 being removed for
having moderate loading on two factors (0.52, 0.65). In the fourth modification, the
Page 78
66
eigenvalues and scree plot only supported one factor with an eigenvalue of 2.71. This
modification resulted in two items (SV1 and SV4) having communalities <0.45. SV1
was then removed due to having the lowest communality (0.17).
In the fifth modification the eigenvalue and scree plot again revealed one factor
with an eigenvalue of 2.59. This modification revealed SV4 to have a communality of
0.41, thus it was removed. The eigenvalues and scree plot of the sixth modification
supported one factor with an eigenvalue of 2.29. All communalities were >0.45 (range of
0.67-0.83). All items (SV6-SV8) loaded on the factor >0.40 (range of 0.82-0.91). The
final perceived severity scale was a one factor scale with three items and a Cronbach’s
alpha of 0.84. The factor accounted for 76.37% of the variance. The items,
characteristics, and factor loadings are reported in Table 8.
Table 8
Final Perceived Severity Items and Exploratory Factor Analysis Characteristics
Cholesterol Survey Definitions and Items M (SD) α Eigenvalue Factor
Loading
Overall Scale 4.15 (0.69) 0.843 2.291
SV6: If I had a heart attack or stroke I might not be
able to work.
0.910
SV7: If I had a heart attack or stroke I wouldn’t be
able to provide for my family.
0.894
SV8: My feelings about myself would change if I
had a heart attack or stroke.
0.816
*SV=severity, M=mean, SD=standard deviation, α= Cronbach’s alpha
Perceived Benefits
Perceived benefits were measured using four items. One item, BN2 (survey item
17), within this scale was derived from Champion’s original 5-item benefits subscale in
the HBM scale and the three other items were derived through the expert panel. The
perceived benefits scale started with four items (BN1-BN4). EFA was conducted using
Page 79
67
the cutoff points of an eigenvalue >1 to be considered a factor, a communality >0.45, and
simple structure with a factor loading of >0.40 on one factor and no cross-loadings ≥ 3.2
on two or more factors. If these constraints were not met, each item was examined
individually, and items were removed one at a time to ensure appropriate removal. The
original eigenvalues and scree plot revealed only one factor with an eigenvalue of 2.68.
All items had communalities >0.45 (range 0.60-0.73), and all items loaded on the single
factor >0.32 (range 0.78-0.85). Therefore, no modifications were made to the perceived
benefits scale. The resulting perceived benefits scale was a one factor scale with four
items and a Cronbach’s alpha of 0.83. The factor accounted for 67.07% of the variance.
The items, characteristics, and factor loading are reported for this scale in Table 9.
Table 9
Perceived Benefits Items and Exploratory Factor Analysis Characteristics
Cholesterol Survey Definitions and Items M (SD) α Eigenvalue Factor
Loading
Overall Scale 3.94 (0.79) 0.831 2.683
BN1: Knowing my cholesterol level can help me
stay healthy.
0.688
BN2: I would not be so anxious about a heart
attack or stroke if I got my cholesterol checked.
0.601
BN3: When I do cholesterol checks, it is good for
my health.
0.726
BN4: Regular cholesterol checks lower the risk of
having a heart attack or stroke.
0.667
*BN=Benefits, M=mean, SD=standard deviation, α= Cronbach’s alpha
Perceived Barriers
Perceived barriers were measured with sixteen items. Five items were adapted
from the eight-item barrier subscale in the Champion’s HBM Scale (1984), three items
were derived from Guvenc et al.’s HBM scale for Cervical Cancer and Pap Smear Test
(2011), and the remaining eight items were developed based on qualitative research. The
Page 80
68
perceived barriers EFA started with 16 items (BA1-BA16, see Table 10 for original
items). EFA was conducted using the cutoff points of an eigenvalue >1 to be considered
a factor, a communality >0.45, and simple structure with a factor loading of >0.40 on one
factor and no cross-loadings ≥ 3.2 on two or more factors. If these constraints were not
met, each item was examined individually and items were removed one at a time to
ensure appropriate removal.
Table 10
Original Perceived Barrier Items
Item Wording
BA1: I don’t think it’s useful to know my cholesterol level.
BA2: Knowing my cholesterol level doesn’t keep me from having a heart attack or stroke.
BA3: It is not easy for me to get my cholesterol checked.
BA4: It is embarrassing for me to get my cholesterol checked.
BA5: Cholesterol checks can be painful or uncomfortable.
BA6: My family would make fun of me if I got my cholesterol checked.
BA7: Getting cholesterol checks gets in the way of things I need to do.
BA8: Getting my cholesterol checked takes too much time.
BA9: It is hard to remember to get my cholesterol checked.
BA10: I have other problems more important than checking my cholesterol.
BA11: I am able to do everything I want to, so I don’t need to get my cholesterol checked.
BA12: I do not have transportation to get my cholesterol checked.
BA13: There is nowhere to get my cholesterol checked where I live.
BA14: I can’t afford to get my cholesterol checked.
BA15: I do not get my cholesterol checked because I do not trust healthcare providers.
BA16: I do not get my cholesterol checked because I can’t understand or talk with my doctor.
*BA=barriers
A total of eleven modifications were conducted on the barriers scale. In the first
modification, eigenvalues and the scree plot revealed four factors: Factor 1=7.27, Factor
2= 1.51, Factor 3=1.21 and Factor 4= 1.00. Item BA2 had a communality of 0.25, which
resulted in its removal. In the second modification, eigenvalues and the scree plot
revealed three factors: Factor 1=7.25, Factor 2= 1.39, and Factor 3= 1.18. All
communalities were >0.45. Five items (BA1, BA4, BA6, BA13, BA14) cross-loaded on
Page 81
69
at least two factors. BA13 was removed due to having moderate cross-loading on two
factors (0.58, 0.44). In the third modification the eigenvalues and scree plot revealed
three factors: Factor 1= 6.90, Factor 2= 1.39, Factor 3= 1.15. All communalities were
>0.45 and three items (BA1, BA6, BA14) cross-loaded on at least two factors. BA14
was removed due to having moderate cross-loading on two factors (0.41, 0.69).
In the fourth modification, eigenvalues and the scree plot supported two factors:
Factor 1=6.63 and Factor 2= 1.38. Items BA1 and BA3 had communalities <0.45, which
was the basis for removing item BA3 with the lowest communality (0.25). The fifth
modification eigenvalues and scree plot revealed two factors: Factor 1= 6.45 and Factor
2= 1.36. BA1 also had a low communality of 0.29, thus it was removed.
The sixth modification eigenvalues and scree plot supported two factors: Factor
1= 6.22 and Factor 2= 1.35. All communalities were >0.45. Two items (BA5, BA6)
cross-loaded on both factors, and BA5 was removed due to moderate cross-loading on
both factors (0.57, 0.43). The seventh modification eigenvalues and scree plot suggested
two factors: Factor 1= 5.75 and Factor 2= 1.35. All communalities were >0.45 and five
items (BA4, BA6, BA7, BA8, BA11) cross-loaded on both factors. BA11 was removed
because it had moderate cross-loading on two factors (0.36, 0.70).
In the eighth modification, eigenvalues and the scree plot suggested two factors:
Factor 1= 5.24 and Factor 2= 1.31. All communalities were >0.45 and four items (BA4,
BA6, BA7, BA8) cross-loaded on both factors. BA6 was removed because it had
moderate cross-loading on both factors (0.71, 0.39). The ninth modification eigenvalues
and scree plot revealed two factors: Factor 1= 4.67 and Factor 2= 1.28. All
Page 82
70
communalities were >0.45 and two items (BA4 and BA8) cross-loaded on both factors.
BA4 was removed because it had moderate cross-loading on both factors (0.38, 0.72).
The tenth modification also suggested two factors (Factor 1= 4.13 and Factor 2=
1.16) using the eigenvalues and scree plot. All communalities were >0.45 and one item
(BA8) cross-loaded on both factors, thus it was removed (0.83, 0.33). The final model
revealed two factors (Factor 1 = 3.49 and Factor 2 = 1.16) through eigenvalues and a
scree plot. All communalities were >0.45 (range: 0.65-0.87). Factor 1 included items
BA12, BA15, and BA16 (loading range: 0.74-0.87) and Factor 2 included items BA7,
BA9, and BA10 (loading range: 0.81-0.90). The final perceived barriers scale was a two
factor scale, Factor 1: access to healthcare providers and Factor 2: inconveniences, with
six items, three-items within each factor, and an overall Cronbach’s alpha of 0.843.
Combined, the two factors accounted for 77.45% of the variance. The factors, items,
characteristics, and factor loadings are reported for this scale in Table 11.
Table 11
Final Perceived Barriers Items and Exploratory Factor Analysis Characteristics
Cholesterol Survey Definitions and Items M (SD) α Eigenvalue Factor
Loading
Overall Barrier Scale 1.912
(0.68)
0.843
Factor 1- Access to health care providers (3 items)
1.55 (0.70) 0.876 3.489
BA12: I do not have transportation to get to the
doctor to get my cholesterol checked.
0.808
BA 15: I do not get my cholesterol checked
because I do not trust healthcare providers.
0.899
BA 16: I do not get my cholesterol checked
because I can’t understand or talk with my doctor.
0.884
Factor 2- Inconvenience (3 items) 2.17 (0.99) 0.826 1.158
BA7: Getting cholesterol checks gets in the way of
things I need to do.
0.743
BA9: It is hard to remember to get my cholesterol
checked.
0.874
BA 10: I have other problems more important than
checking my cholesterol.
0.867
*BA=barriers, M=mean, SD=standard deviation, α= Cronbach’s alpha
Page 83
71
Self-Efficacy
Self-efficacy was measured with a ten-item scale derived from the SES-PSSP
(Hogenmiller et al., 2007). The self-efficacy scale started with 10 items (SE1-SE10, see
Table 12 for original items). EFA was conducted using the cutoff points of an eigenvalue
>1 to be considered a factor, a communality >0.45, and simple structure with a factor
loading of >0.40 on one factor and no cross-loadings ≥ 3.2 on two or more factors. If
these constraints were not met, each item was examined individually and items were
removed one at a time to ensure appropriate removal.
Table 12
Original Self-Efficacy Items
Item Wording
SE1: If you had to pay for it?
SE2: If you don’t have a doctor?
SE 3: If it is hard to get a doctor to take your insurance?
SE4: If you would lose work time?
SE5: If a close friend or family member tells you a screening is needed?
SE6: If you need a ride to your appointment?
SE7: If your friend tells you a screening is unnecessary?
SE8: If your last screening was normal?
SE9: If your last screening was abnormal?
SE10: If you are too busy during clinic hours?
*SE=self-efficacy
Five modifications were made through the conducting the EFA. In the first EFA,
eigenvalues and the scree plot suggested two factors: Factor 1=4.89 and Factor 2= 1.31.
All communalities were >0.45 and four items (SE3, SE4, SE6, SE7) cross-loaded on both
factors. SE4 was removed because it had moderate cross-loading on both factors (0.61,
0.55). The second modification eigenvalues and a scree plot supported two factors:
Factor 1= 4.22 and Factor 2= 1.34. All communalities were >0.45 and three items (SE3,
SE6, SE10) cross-loaded on two factors. SE6 was removed because it had moderate
Page 84
72
cross-loading on two factors (0.66, 0.44). The third modification eigenvalues and scree
plot revealed two factors: Factor 1=3.66 and Factor 2=1.34. All communalities were
>0.45 and two items (SE3, SE10) cross-loaded on both factors. SE 10 was removed
because it had moderate cross-loading on both factors (0.70, 0.43).
In the fourth modification, eigenvalues and a scree plot revealed two factors:
Factor 1= 3.07 and Factor 2= 1.33. All communalities were >0.45. Only one item (SE8)
cross-loaded on both factors and it was removed (0.67, 0.33). This final modification
eigenvalues and scree plot supported two factors: Factor 1= 2.68 and Factor 2= 1.29. All
communalities were >0.45 (ranging 0.56-0.75). Factor 1, personal costs, included items
SE1, SE2, SE3 (factor loading range of 0.71-0.86) and Factor 2, relationships, SE5, SE7,
and SE9 (factor loading range of 0.73-0.81). The resulting self-efficacy scale was a two
factor scale with six items, three within each factor, and an overall Cronbach’s alpha of
0.75. Combined, the two factors accounted for 66.15% of the variance. The factors,
items, characteristics, and loadings are reported for this scale in Table 13.
Table 13
Final Self-Efficacy Items and Exploratory Factor Analysis Characteristics
Cholesterol Survey Definitions and Items M (SD) α Eigenvalue Factor
Loading
Overall Self-Efficacy Scale 3.01 (0.83) 0.747
Factor 1- Personal Costs (3 items) 2.58 (1.1) 0.766 2.680
SE1: If you have to pay for it? 0.856
SE2: If you don’t have a doctor? 0.852
SE3: If it is hard to get a doctor to take your
insurance?
0.705
Factor 2- Relationships (3 items) 3.39 (0.96) 0.699 1.289
SE5: If a close family member tells you it’s
needed?
0.729
SE7: If your friend tells you a screening is
unnecessary?
0.784
SE9: If your last screening was abnormal? 0.804
*SE=self-efficacy, M=mean, SD=standard deviation, α= Cronbach’s alpha
Page 85
73
Research Question 2
2. What are the perceived susceptibility and severity of high cholesterol in rural
communities in central Texas?
In order to answer research question 2, descriptive statistics, specifically means
and frequencies, were conducted. The answer choices for both perceived susceptibility
and perceived severity were “agree”, “disagree”, and “neutral” for the purposes of
reporting frequencies. The category of disagree included Likert scale answer choices “1
strongly disagree” and “2 disagree.” The category of agree included answer choices “4
agree” and “5 strongly agree.” The category of neutral only included answer choice “3
neutral.” Scores for perceived susceptibility items ranged from 1 to 5 with a mean of
2.89 (SD=0.96), indicating that the sample on average reported being neutral. The
perceived susceptibility scale had seven items, all of which remained after EFA. The
most frequently reported susceptibility item was SS1:“I have or will probably develop
high cholesterol during my life” (51.8%), followed by SS2:“I worry about having high
cholesterol” (44.1%). The least reported susceptibility item was SS4: “My chances of
suffering from a heart attack or stroke in the next few years are great” (19.4%). The full
list of perceived susceptibility items and frequencies are reported in Figure 1.
Scores for severity items ranged from 1 to 5 with a mean of 4.15 (SD=0.69),
indicating that the sample on average reported to agree with the perceived severity items.
The perceived severity scale had eight original items, however only three items remained
in the scale after EFA. The most frequently reported severity item was SV2: “If I had a
heart attack or stroke it would be hard on my family” (94.7%), however this item was
removed during EFA.
Page 86
74
Figure 1: Original Perceived Susceptibility Items and Frequencies
The three items that remained in the scale were SV6: “If I had a heart attack or
stroke I might not be able to work” (81.1%), SV7: “If I had a heart attack or stroke I
wouldn’t be able to provide for myself or my family” (73%), and SV8: “My feelings
about myself would change if I had a heart attack or stroke” (70%). The full list of
original perceived severity items and frequencies are reported in Figure 2 below.
Research Question 3
3. What are the perceived benefits and barriers of participating in the cholesterol
screenings in rural communities?
In order to answer research question 3, descriptive statistics, specifically means
and frequencies, were conducted. The answer choices for both perceived benefits and
perceived barriers were grouped into “agree”, “disagree”, and neutral for the purposes of
reporting frequencies.
0% 10% 20% 30% 40% 50% 60%
SS7: I am concerned about the chance of having a
HA/S in the near future.
SS6: Having a HA/S is currently a possibility
for me.
SS4: My chances of suffering from HA/S in
the next few years is great.
SS3: It is likely that I will suffer from HA/S
in the future.
SS1: I have or will probably develop high
cholesterol in my life.
Agree Neutral Disagree
SS2: I worry about having high cholesterol.
SS5: I feel I will have a HA/S sometime
during my life.
Page 87
75
Figure 2: Original Perceived Severity Items and Frequencies
The category of disagree included Likert scale answer choices “1 strongly
disagree” and “2 disagree.” The category of agree included answer choices “4 agree” and
“5 strongly agree.” The category of neutral included the answer choice “3 neutral.”
Scores for perceived benefits items ranged from 1 to 5 with a mean of 3.94 (SD=0.79),
indicating the sample on average to agree with the perceived benefits items. The
perceived benefits scale had four items, all of which remained after the EFA. The most
reported benefit to cholesterol screening was BN1: “Knowing my cholesterol can help me
stay healthy” (87.6%), while the least reported benefit was BN2: “I wouldn’t be anxious
if I knew my cholesterol” (53%). The full list of items and frequencies for perceived
benefits are reported in Figure 3.
0% 20% 40% 60% 80% 100%
SV8: My feelings about myself would change if I
had a heart attack or stroke
SV7: If I had a HA/S I wouldn't be able to provide
for myself or my family.
SV6: If I had a HA/S I might not be able to work.
SV5: The thought of having a HA/S scares me.
SV4: If I had a HA/S it would be hard on my
family.
SV3: Having a HA/S will cause problems that
would last a long time.
SV2: If I had a HA/S, my whole life would change.
SV1: If I had high cholesterol, I will be more likely
to have heart attack or stroke.
Agree Neutral Disagree
Page 88
76
Figure 3: Original Benefit Items and Frequencies
Scores for perceived barriers ranged from 1 to 5 with a mean of 1.92 (SD=0.68),
indicating the average of the sample reported to disagree with the perceived barrier items.
The perceived barriers scale originally had 16 items, however only six items remained
after EFA. The most commonly reported barriers were BA1: “Knowing my cholesterol
level doesn’t keep me from having a heart attack or stroke” (59.4%) and BA9: “It is hard
to remember to get my cholesterol checked” (24.7%). The latter remained in the scale
along with BA10: “I have other problems more important than checking my cholesterol”
(17%), BA7: “Getting my cholesterol checked gets in the way of things I need to do”
(9.4%), BA12: “I do not have transportation to get to the doctor to get my cholesterol
checked” (2.4%), BA15: “I do not get my cholesterol checked because I do not trust
healthcare providers” (1.8%), and BA16: “I do not get my cholesterol checked because I
can’t understand or talk with my doctor” (3.6%). The full list of original perceived
barriers items and frequencies are reported in Figure 4 and 5.
0% 10% 20% 30% 40% 50% 60% 70% 80% 90% 100%
BN4: Regular cholesterol checks lower the risk of
having a heart attack or stroke.
BN3: When I do cholesterol checks, it is
good for my health .
BN2: I would not be so anxious about a HA/S
if I got my cholesterol checked.
BN1: Knowing my cholesterol level can
help me stay healthy .
Agree Neutral Disagree
Page 89
77
Research Question 4
4. What was the level of self-efficacy to perform cholesterol screenings in rural
communities?
In order to answer research question 4, descriptive statistics, specifically means
and frequencies, were recorded. The answer choices for self-efficacy were categorized
into likely, unlikely, and neutral for the purposes of reporting frequencies. The category
of “unlikely” included Likert scale answer choices “1 very unlikely” and “2 unlikely.”
The category of “likely” included answer choices “4 likely” and “5 very likely.” The
category of neutral only included the answer choice “3 neutral.” Scores for self-efficacy
items ranged from 1 to 5 with a mean of 3.01 (SD=0.83), indicating the average of the
sample reported being neutral. The items that were the least likely were SE3: “if it is
hard to get a doctor to take your insurance” (61.7%) and SE2: “if you don’t have a
doctor” (53.5%). Both of the aforementioned items were retained within the scale along
with SE1: “if you have to pay for it” (39.4%), SE5: “if a close family member tells you
it’s needed” (15.8%), SE7: “if your friend tells you a screening is unnecessary” (39.4%),
and SE9: “if your last screening was abnormal” (16.5%). Original self-efficacy items and
frequencies are reported in Figure 6.
Research Question 5
5. Are HBM constructs related to current cholesterol screening utilization?
In order answer research question 5, both bivariate and multivariate analyses were
conducted.
Page 90
Figure 4: Original Perceived Barrier Items and Frequencies (Items 1-8)
0% 10% 20% 30% 40% 50% 60% 70% 80% 90% 100 %
BA8: Getting my cholesterol checked takes too much time.
BA7: Getting cholesterol checks gets in the way of things I need
to do.
BA6: My family would make fun of me if I got my cholesterol
checked.
BA5: Cholesterol checks can be painful or uncomfortable.
BA4: It is embarrassing for me to get my cholesterol checked.
BA3: It is not easy for me to get my cholesterol checked.
BA2: Knowing my cholesterol level doesn't keep me from having
a HA/S.
BA1: I don't think it's useful to know my cholesterol level.
Agree Neutral Disagree
78
Page 91
Figure 5: Original Perceived Barrier Items and Frequencies (Items 9-16)
0% 10% 20% 30% 40% 50% 60% 70% 80% 90% 100%
BA16: I do not get my cholesterol checked because I can't
understand or talk with my doctor.
BA15: I do not get my cholesterol checked because I do not trust
healthcare providers.
BA14: I can't afford to get my cholesterol checked.
BA13: There is nowhere to get my cholesterol checked where I
live.
BA12: I do not have transportation to get to the doctor to get my
cholesterol checked.
BA11: I am able to do everything I want to, so I don't need to get
my cholesterol checked.
BA10: I have other problems more important than checking my
cholesterol.
BA9: It is hard to remember to get my cholesterol checked.
Agree Neutral Disagree
79
Page 92
0% 10% 20% 30% 40% 50% 60% 70% 80%
SE10: If you are too busy during clinic hours?
SE9: If your last screening was abnormal?
SE8: If your last screening was normal?
SE7: If your friend tells you a screening is unnecessary?
SE6: If you need a ride to your appointment?
SE5: If a close friend or family member tells you a
screening is needed?
SE4: If you would lose work time?
SE3: If it is hard to get a doctor to take your insurance?
SE2: If you don't have a doctor?
SE1: If you have to pay for it?
Agree Neutral Disagree
Figure 6: Original Self-Efficacy Items and Frequencies
80
Page 93
81
The average score variables for each HBM construct and meeting cholesterol
screening recommendations (answer options dichotomized into 0=not meeing
recommendations for cholesterol screening which included answer choices “ more than 5
years”, “never,” and “don’t know/not sure” and 1=meeting guidelines for cholesterol
screening behavior including answer choices “within the past year,” “within the past two
years,” and “within the past five years”) were used to construct a correlation matrix.
Pearsons correlation coefficients were calculated for continuous variables and point
biserial correlation coefficients for categorical variables (see Table14). Analysis revelaed
a significant positive correlation between current cholesterol behavior and perceived
susceptibility (r=0.24; p<0.01), meaning that the higher a person’s perceived
susceptibility the more likely he/she had checked his/her cholesterol in the previous five
years. A negative relationship between periceived barriers and current cholesterol
behavior ( r=-0.17; p<0.05) was also observed, meaning that the greater barriers
perceived by a person, the less likely it was that he/she had checked his/her cholesterol.
The relationships between current cholesterol screening and severity, benefits, and self-
efficacy were not statistically significant (p>.05).
One-way ANOVAs were conducted to examine differences in HBM constructs by
current cholesterol screening behavior (screening within the past 5 years or not).
ANOVAs indicated that susceptibility and barriers were significiantly associated with
current cholesterol screening behavior. However, severity, benefits, and self-efficacy
were not. For this sample, those who had been screened within the last year (M=3.11,
SD=0.97) had significantly higher susceptibility scores (F=9.75; p=0.002) than those who
did not have a screening within the last year (M=2.66, SD=0.90). In regards to barriers,
Page 94
82
those who did not have a screening within the last year (M=2.04, SD=0.59) had
significantly more perceived barriers (F=4.75; p=0.031) than those who did have a
screening within the last year (M=1.82, SD=0.74).
Table 14
Pearsons and Point Biserial Correlations for Current Cholesterol Behavior
Cholesterol
checked
Avg SS Avg SV Avg BN Avg BA Avg SE
Cholesterol
Checked
-
Avg SS 0.22**
(n=169)
-
Avg SV -0.07
(n=169)
0.27**
(n=170)
-
Avg BN 0.12
(n=169)
0.21**
(n=170)
0.50**
(n=170)
-
Avg BA -0.18*
(n=168)
0.08
(n=169)
0.01
(n=169)
-0.20**
(n=169)
-
Avg SE 0.10
(n=167)
0.15
(n=168)
-0.04
(n=168)
0.20**
(n=168)
-0.01
(n=168)
-
* Correlation is significant at the 0.05 level
**Correlation is significant at the 0.01 level
***Note: n=sample size, Cell n values differ due to missing data, Avg=mean,
SS=perceived susceptibility, SV=perceived severity, BN=perceived benfits,
BA=perceived barriers, SE=self-efficacy.
Logistic regression analysis was conducted using current cholesterol screening
behavior as the depedent variable and the HBM constucts of perceived susceptibility and
perceived barriers as the independent variables, due to the established significant
bivariate relationships with current cholesterol screening behavior for each. The other
HBM constructs were not included as they were not significantly related with current
cholesterol screening in bivariate analyses. The resulting model was significant (χ2 =
16.340; p = 0.000). Backward Stepwise Regression indicated that both perceived
susceptibility (p<0.01) and perceived barriers (p<0.01) were significantly related with
current cholesterol screening behavior in this multivariate model. Specifically, perceived
Page 95
83
suceptibility was positively related with meeting current guidelines for cholesterol
screening and perceived barriers were negatively related with meeting those same
guidelines, while controlling for the other HBM construct respectively (see Table 15).
For every one unit increase in perceived susceptibility score, the odds of meeting the
current guidelines for cholesterol screening increased by 1.974 [CI (95%) = 1.296, 3.008],
while accounting for perceived barriers. However, for every one unit increase in
perceived barriers score, the odds of meeting the current guidelines for cholesterol
screening decreased by 0.458 [CI (95%) = 0.260, 0.806], while controlling for perceived
susceptibility.
Table 15
Logistic Regression Model Examining the Relationship Between HBM Constructs and
Current Cholesterol Screening Behavior
β S.E. Wald df p-value Exp(B) 95% C.I.
(lower, upper)
BA -0.780 0.288 7.328 1 0.007 0.458 0.260 0.806
SS 0.680 0.215 10.018 1 0.002 1.974 1.296 3.008
*Note: n=170; β=standardized beta weight, S.E.=standard error, Wald=wald statistic,
df=degrees of freedom, Exp(B)=odds ratio, C.I.=confidence interval, HBM=Health
Belief Model, BA=perceived barriers, SS=perceived susceptibility.
Research Question 6
6. Are HBM constructs associated with intention to engage in cholesterol
screenings in the next month?
In order to answer research question 6, both bivariate and multivariate analyses
were conducted. The average score variables for each HBM constructs and future
cholesterol screening intention were used to construct a correlation matrix. Pearson
correlation coefficients were calculated for continuous variables and point biserial
Page 96
84
correlation coefficients for categorical variables (See Table 16). Analyses revealed a
positive correlation between perceived susceptibility and intention to check cholesterol
within the next month (r=0.31; p=0.00) and a positive correlation between perceived
benefits and intention to check cholesterol in the next month (r=0.15; p=0.51). Analyses
also revealed a positive relationship between perceived barriers and intention that was
approaching significance (r=-0.14; p=0.07), which was considered in further analysis.
There were no statistically significant relationships between intention and perceived
severity or self-efficacy.
Table 16
Pearsons and Point Biserial Correlations for Intention
Intention Avg SS Avg SV Avg BN Avg BA Avg SE
Intention -
Avg SS 0.31**
(n=165)
-
Avg SV 0.01
(n=165)
0.27**
(n=170)
-
Avg BN 0.15*
(n=165)
0.21**
(n=170)
0.50**
(n=170)
-
Avg BA -0.14
(n=165)
0.08
(n=169)
0.01
(n=169)
-0.20**
(n=169)
-
Avg SE 0.10
(n=164)
0.15
(n=168)
-0.04
(n=168)
0.202**
(n=168)
-0.01
(n=168)
-
* Correlation is significant at the 0.05 level
**Correlation is significant at the 0.01 level
***Note: n=sample size, cell N values differ due to missing data, Avg = mean.
Intention=intention to have cholesterol checked in the next month, SS=perceived
susceptibility, SV=perceived severity, BN=perceived benfits, BA=perceived barriers,
SE=self-efficacy
One-way ANOVAs were conducted to examine differences in HBM constructs by
intention to have your cholesterol checked in the next month. Perceived susceptibility
(p=0.00) and perceived benefits (p=0.05) were significiantly associated with intention,
and perceived barriers (p=0.07) approached significance. However, perceived severity
Page 97
85
and self-efficacy were not related with intention. For this sample, those who intended to
be screened in the next month (M=3.34, SD=0.99) had significantly higher perceived
susceptibility scores (F=17.42; p=0.00) than those who did not have an intetion to get
screened in the next month (M=2.71, SD=0.87). In addition, those who intended to be
screened in the next month (M=4.12, SD=0.77) reported greater perceived benefits
(F=3.87; p=0.05) than those who did not have an intention to be screened in the next
month (M=3.87, SD=0.75). In regards to barriers, those who did not have an intention to
be screened in the next month (M=1.99, SD=0.63) reported significantly greater barriers
(F=3.31; p=0.07) than those who intended to be screened in the next month (M=1.78,
SD=0.78).
Logistic regression was conducted using intention to screen cholesterol as the
depedent variable and the HBM constucts of perceived susceptibility, perceived benefits,
and perceived barriers as the independent variables given the established significant
bivariate relationships of each with intention. Due to the strength of the relationship
between perceived barriers (r=-0.14 p<0.71) and intention, although not significant at the
α≤.05 level, perceived barriers were also included in logistic regression analyses.
Perceived severity and self-efficacy were not included as they were not significantly
related with intention in bivariate analyses. The resulting model was signifant (χ2 =
21.33; p = 0.00). Backward stepwise regression indicated that both perceived
susceptibility (p<0.01) and perceived barriers (p<0.05) were significantly related with
intention to have cholesterol checked in the next month. Specifically, perceived
susceptibility was postively related to intention and perceived barriers were negatively
associtaed with intention (see Table 17). The table below explains that for every one unit
Page 98
86
increase in perceived susceptibility score, the odds of intending to get cholesterol
screened in the next month increased by 2.22 [CI (95%) = 1.50, 3.29]. It also shows that
for every one unit increase in the perceived barriers score, the odds of intending to get
cholesterol screened in the next month decreased by 0.57 [CI (95%) = 0.34, 0.95].
Table 17
Logistic Regression Model Examining the Relationship Between HBM Constructs and
Intention
β S.E. Wald df p value Exp(B) 95% C.I.
(lower, upper)
BA -0.560 0.261 4.603 1 0.032 0.571 0.342 0.953
SS 0.798 0.201 15.729 1 0.000 2.220 1.497 3.293
Note: n=170; β=standardized beta weight, S.E.=standard error, Wald=wald statistic,
df=degrees of freedom, C.I.=confidence interval, HBM=Health Belief Model,
BA=perceived barriers, SS=perceived susceptibility.
Research Question 7
7. Does insurance status (and other demographic and health variables) influence
the relationships examined in research questions 5 and 6?
In order to answer research question 7, pearson correlation coefficients were
calculated for continuous demographic variables and point biserial correlation
coefficients for categorical demographic variables, including insurance status. Current
cholesterol screening behavior was significantly related with insurance status, disease
index, BMI, and age (see Table 18). Intention to screen in the next month was
significantly related with BMI, ethnicity, income, education, and age, but not insurance
status (see Table 19).
Logistic regression analyses were used to examine whether relationships between
HBM constructs and cholesterol screening behavior (current or future intention) were
Page 99
87
impacted when controlling for insurance status and other significantly related
demographic variables identified in bivariate analyses (e.g., age, race/ethnicity, disease
index, BMI, income, and education). For current cholesterol screening behavior
insurance coverage was examined as a potential correlate. However, since insurance
status was not related with intention to screen in the next month in bivariate analyses, it
was not included in the logistic regression analysis for intention. Two logistic regression
models were conducted for each dependent variable. First, all HBM constructs
significantly related with the dependent variable of interest in previous multivariate
analyses and all demographic and health variables significantly related in bivariate
analyses were entered into a logistic regression model. Subsequently, a backwards
stepwise logistic regression model was conducted to further examine significance and the
best fitting model.
The first logistic regression model examining current cholesterol screening
(meeting AHA recommendations) was conducted by entering all significant demographic
and health variables related with meeting guidelines in bivariate analyses in addition to
the HBM constructs of perceived susceptibility and perceived barriers. This model was
significant (χ2 = 50.16, p = 0.00), where the only significant variables were perceived
barriers, insurance, age, disease index, and BMI. Specifically, perceived barriers were
negatively related with meeting current cholesterol screening guidelines, while insurance
status (having insurance), older age, a higher disease index (more diseases), and higher
BMI were all positively related with meeting current guidelines for cholesterol screening
(see Table 20).
Page 100
Table 18
Pearsons and Point Biserial Correlations for Demographic Variables and Current Screening Behavior
CG DZ BMI R/E INS INC EDU GEN AGE ZC
DZ 0.28**
(n=169)
-
BMI 0.16*
(n=154)
0.19*
(n=155)
-
R/E 0.79
(n=166)
0.37*
(n=167)
0.11
(n=155)
-
INS 0.40**
(n=163)
0.05
(n=164)
-0.02
(n=153)
0.03
(n=164)
-
INC 0.12
(n=160)
-0.21**
(n=159)
-0.24**
(n=147)
-0.32**
(n=156)
0.27**
(n=154)
-
EDU -0.7
(n=166)
-0.35**
(n=167)
-0.14
(n=155)
-0.42**
(n=167)
0.25**
(n=164)
0.57**
(n=157)
-
GEN -0.14
(n=166)
-0.01
(n=167)
-0.04
(n=155)
0.07
(n=167)
-0.01
(n=157)
-0.14
(n=157)
0.04
(n=167)
-
AGE 0.29**
(n=165)
-0.39**
(n=166)
0.17*
(n=164)
0.17*
(n=166)
0.17*
(n=164)
-0.14
(n=156)
-.31**
(n=166)
-0.13
(n=166)
-
ZC 0.09
(n=167)
0.17*
(n=167)
-0.04
(n=152)
0.16*
(n=167)
-0.01
(n=162)
-0.14
(n=158)
-0.03
(n=164)
0.15
(n=164)
-0.13
(n=166)
-
*Correlation is significant at the 0.05 level
** Correlation is signifciant at the 0.01 level
***CG=cholesterol guidelines, DZ=disease index, BMI=body mass index, R/E=race/ethnicity (0=white, 1=non-white), INS=insurance (0=not
insured, 1=insured), INC=income, EDU=education, GEN=gender (1=males, 2=females), ZC=zipcode (1=rural, 2=urban)
88
Page 101
Table 19
Pearsons and Point Biserial Correlations for Demographic Variables and Intention to Screen
INT DZ BMI R/E INS INC EDU GEN AGE ZC
CG 0.17*
(n=165)
DZ 0.36**
(n=169)
-
BMI 0.20*
(n=152)
0.19*
(n=155)
-
R/E 0.45**
(n=152)
0.37*
(n=167)
0.11
(n=155)
-
INS 0.02
(n=160)
0.05
(n=164)
-0.02
(n=153)
0.03
(n=164)
-
INC -0.38**
(n=156)
-0.22**
(n=159)
-0.28**
(n=146)
-0.32**
(n=156)
0.26**
(n=153)
-
EDU -0.32**
(n=162)
-0.35**
(n=167)
-0.14
(n=155)
-0.42**
(n=167)
0.25**
(n=164)
0.57**
(n=157)
-
GEN 0.11
(n=162)
-0.01
(n=167)
-0.04
(n=155)
0.07
(n=167)
-0.01
(n=157)
-0.14
(n=157)
0.04
(n=167)
-
AGE 0.29**
(n=162)
-0.39**
(n=166)
0.17*
(n=164)
0.17*
(n=166)
0.17*
(n=164)
-0.14
(n=156)
-.31**
(n=166)
-0.13
(n=166)
-
ZC 0.12
(n=167)
0.17*
(n=167)
-0.04
(n=152)
0.16*
(n=167)
-0.01
(n=162)
-0.14
(n=158)
-0.03
(n=164)
0.15
(n=164)
-0.13
(n=166)
-
*Correlation is significant at the 0.05 level
** Correlation is signifcant at the 0.01 level
Note: INT=intention, CG=cholesterol guidelines, DZ=disease index, BMI=body mass index, R/E=race/ethnicity (0=white, 1=non-white),
INS=insurance (0=no insurance, 1=has insurance), INC=income, EDU=education, GEN=gender (1=male, 2=female), ZC=zipcode (1=rural, 2=urban)
89
Page 102
90
Backward stepwise regression was then used to examine meeting cholesterol
screening recommendations as a means of identifying the best fitting model. After two
steps, the final model was statistically significant (χ2 = 50.16; p = 0.00), with perceived
barriers, insurance, age, disease index, and BMI significantly related with meeting
cholesterol screening recommendations.
Table 20
Logistic Regression Model Predicting Meeting Cholesterol Guidelines with Significant
HBM Constructs and Demographic or Health Variables
β S.E. Wald df p-value Exp(B) 95% C.I.
(lower, upper)
SS -0.20 0.319 0.004 1 0.950 0.980 0.524 1.833
BA** -0.750 0.363 4.275 1 0.039 0.472 0.232 0.962
INS** 2.057 0.491 17.583 1 0.000 7.823 2.991 20.461
Age* 0.037 0.021 3.125 1 0.077 1.038 0.996 1.081
DZ** 0.798 0.384 4.325 1 0.038 2.222 1.047 4.715
BMI* 0.062 0.034 3.240 1 0.072 1.064 0.995 1.137
*Approaches statistical significance (p≤0.10)
**Statistically significant (p≤0.05)
Note: n=170; β=standardized beta weight, S.E.=standard error, Wald=wald statistic, df =
degrees of freedom, C.I.=confidence interval, HBM=Health Belief Model, SS=perceived
susceptibility, BA=perceived barriers, INS=insurance status (0=no insurance, 1=has
insurance), DZ=disease index, BMI=body mass index.
Perceived barriers (p<0.05) was the only HBM construct that was significantly
related with meeting cholesterol screening recommendations while controlling for
associated demographic and health variables. Insurance status, age, disease index, and
BMI were also significantly related with meeting cholesterol screening guidelines.
Specifically, perceived barriers were negatively related with meeting current cholesterol
screening guildelines, where greater perceived barriers was associated with not meeting
the recommendations. Insurance status (having insurance), older age, higher disease
Page 103
91
index (more diseases), and a higher BMI were positively related with meeting cholesterol
screening guidelines (see Table 21).
Next, two logistic regression models were examined with intention to screen
cholesterol in the next month as the depedent variable and the HBM constucts perceived
susceptibility and perceived barriers as the independent variables, along with all
significant demographic and health variables from birvariate analyses (current cholesterol
screening, disease index, BMI, race/ethnicity, income, education, and age).
Table 21
Backward Stepwise Logistic Regression Model Predicting Meeting Cholesterol
Screening Guidelines.
β S.E. Wald df p-value Exp(B) 95% C.I.
(lower, upper)
BA** -0.754 0.356 4.479 1 0.034 0.470 0.234 0.946
INS** 2.052 0.482 18.083 1 0.000 7.780 3.022 20.028
Age* 0.037 0.020 3.207 1 0.073 1.037 0.997 1.080
DZ** 0.788 0.344 5.251 1 0.022 2.198 1.121 4.312
BMI* 0.061 0.033 3.422 1 0.064 1.063 0.996 1.134
*Approaches statistical significance (p≤0.10)
**Statistically significant (p≤0.05)
Note: n = 170; β=standardized beta weight, S.E.=standard error, Wald=wald statistic,
df=degrees of freedom, C.I.=confidence interval, BA=perceived barriers, INS=insurance
status (0=no insurance 1=has insurance), DZ=disease index, BMI=body mass index.
The first logistic regression model was conducted by entering all significant
demographic and health variables related with meeting guidelines in bivariate analyses, in
addition to the HBM constructs of perceived susceptibility and perceived barriers. This
model was significant (χ2 = 39.22 with p = 0.00), and the only significant variable was
race/ethnicity, although perceived barriers and BMI approached significance.
Specifically, non-whites, with fewer perceived barriers, and a higher BMI were more
likely to report intention to screen cholesterol in the next month (see Table 22).
Page 104
92
Table 22
Logistic Regression Predicting Intention to Screen Cholesterol in the Next Month Using
HBM Constucts and Demographic and Health Variables
Β S.E. Wald df p-value Exp(B) 95% C.I.
(lower, upper)
SS 0.203 0.266 0.579 1 0.447 1.225 0.727 2.063
BA* -0.577 0.303 3.631 1 0.057 0.561 0.310 1.017
R/E** 1.596 0.507 9.922 1 0.002 4.932 1.827 13.311
DZ 0.223 0.244 0.833 1 0.361 1.250 0.774 2.017
EDU -0.175 0.218 0.640 1 0.424 1.021 0.548 1.288
Age 0.021 0.015 1.901 1 0.168 1.021 0.991 1.052
BMI* 0.049 0.027 3.264 1 0.071 1.050 0.996 1.107
*Approaches statistical significance (p≤0.10)
**Statistically significant (p≤0.05)
Note: n=170; β=standardized beta weight, S.E.=standard error, Wald=wald statistic,
df=degrees of freedom, Exp(B)=odds ratio, C.I.=confidence interval,
SS=perceivedsusceptibility, BA=perceived barriers, R/E=race/ethnicity (0=white, 1=non-
white), DZ=disease index, EDU=education, BMI=body mass index.
Backward stepwise regression was then conducted. After five steps, the final
model was statistically significant (χ2 = 33.06; p = 0.00), and race/ethnicity, age, and
BMI were the only significantly related variables. Older non-whites with a higher BMI
were significantly more likely to intend to have their cholesterol screened in the
upcoming month (see Table 23).
Table 23
Backward Stepwise Logistic Regression Model Predicting Intention to have Cholesterol
Screened in the Upcoming Month
β S.E. Wald df p-value Exp(B) 95% C.I.
(lower, upper)
R/E** 1.756 0.459 14.643 1 0.000 5.787 2.355 14.221
Age** 0.038 0.013 8.443 1 0.004 1.039 1.012 1.065
BMI** 0.054 0.025 4.586 1 0.032 1.056 1.005 1.110
**Statistically significant (p≤0.05)
Note: n=170; β=standardized beta weight, S.E.=standard error, Wald=wald statistic,
Exp(B)=odds ratio, df=degrees of freedom, C.I.=confidence interval,R/E=race/ethncity
(0=white, 1=non-white), BMI=body mass index.
Page 105
93
CHAPTER FIVE
Discussion
Introduction
The purpose of this study was was to develop HBM construct scales to better
understand the use of cholesterol screenings in rural communities in central Texas, and to
subsequently examine relationships among HBM constructs, current cholesterol
screening behavior, and intention to participate in a future cholesterol screening. The
sample included members (N=170) of three rural communities in central Texas. Data
were collected using the cholesterol screening behavior scales developed for this study,
which measured HBM constructs (perceived susceptibility, perceived severity, perceived
benefits, perceived barriers, and self-efficacy). In addition, current cholesterol screening
behavior, intention to screen cholesterol, and demographic and health variables were also
included. The survey was dissemeniated through various aspects of the community (e.g.,
school system, churches, Bingo, etc).
The theoretical framework for this study was the HBM, which was developed to
understand why people failed to participate in disease prevention programs (Champion &
Skinner, 2008). HBM has six main constucts, five of which were used in this study:
perceived susceptibility, perceived severity, perceived benefits, perceived barriers, and
self-efficacy. A crticial review was conducted by Janz and Becker (1984) of all HBM
studies conducted between 1979 and 1984, which is the most current review of HBM
studies (Champion & Skinner, 2008). This review found perceived barriers to be the
single strongest predictor of behavior in the model with 21 out of 23 studies showing
Page 106
94
significance. Perceived susceptibility (significance in 20 out of 24 studies) and perceived
benefits (significance in 21 out of 26 studies) remained important overall, perceived
susceptibility specifically with regards to preventative behaviors. Perceived severity was
found to be the weakest predictor within the HBM; significance was detected in 16 out of
26 studies (Janz & Becker, 1984). The Janz & Becker (1984) study was conducted
before self-efficacy was added to HBM, thus there was no report of self-efficacy within
this study.
Research Questions
To examine the validity and reliability of the HBM construct scales and to
understand the use of cholesterol screening in rural communities in central Texas, the
following research questions were examined:
Question 1: Are the developed HBM measures valid and reliable?
Question 2: Are were the perceived susceptibility and severity of high cholesterol
in rural communities in Central Texas?
Question 3: What are the perceived benefits and barriers of participating in
cholesterol screenings in rural communities?
Question 4: What is the level of self-efficacy to perform cholesterol screenings in
rural communities?
Question 5: Are constructs of the HBM related to current cholesterol screening
use?
Question 6: Are HBM constructs associated with intention to engage in future
cholesterol screenings?
Page 107
95
Question 7: Does insurance status (or other demographic variables) influence the
relationships examined in research questions 5 and 6?
Discussion
Research Question 1
1. Are the developed HBM measures valid and reliable?
Perceived susceptibility. Perceived susceptibility was measured using seven
items. Of those seven items measured, five items (SS3-SS7) were taken directly from the
HBCVD scale (Tovar et al., 2010) and maintained the exact wording as the original scale.
The remaining two perceived susceptibility items (SS1-SS2) were developed through an
expert panel review. EFA revealed all seven items to be appropriate for the scale with
factor loadings ranging from 0.75 to 0.88 and a Cronbach’s alpha of 0.92. This finding is
consistent with, or even stronger than, the original scale from which five of the seven
items for the scale derived. Tovar et al. (2010) found the factor loadings to range from
0.62 to 0.79 and a Cronbach’s alpha of 0.91 for the scale. Differences in factor loading in
comparing this study with Tovar’s were seen in the five items which ranged, in the
current study, from 0.81 to 0.88 and were higher than Tovar et al’s (2010) loadings for
the same items. The discrepancies within factor loadings may be due to the differences
between the sample participants. Tovar’s sample was adults with type 2 diabetes from a
cardiovascular and diabetes clinic in Texas which may have different factors that could
influence perceived susceptibility compared to rural adults that may or may not possess
diabetes or CVD. The Cronbach’s alphas were comparable between the two scales.
Page 108
96
Perceived severity. Perceived Severity was measured using eight items, seven
(SV2-SV8) of which were developed using items from the HBM scale for breast self-
exams (Champion, 1984). The remaining item (SV1) was developed through the expert
panel review. EFA retained three items (SV6-SV8) within the scale. Two of these items
(SV6, SV7) were taken from Champion’s HBM scale and modified to use language
surrounding cholesterol screenings and heart disease. The EFA analysis revealed the
three items to have factor loadings ranging from 0.82-0.91 with a Cronbach’s alpha of
0.84. Items SV6 and SV7 were adapted from two of Champion’s items which had
original factor loadings ranging from 0.36 to 0.66 within a severity scale that reported a
Cronbach’s alpha of 0.78. These adapted items reported factor loadings of 0.91 and 0.89
in the current study. In other uses of Champion’s scale, the severity scale has actually
been removed due to low factor loadings (0.36-0.66) and low predictability within the
model (Champion & Skinner, 2008). The higher factor loadings in the current study may
be due to using fewer items to understand the construct of severity (three instead of
twelve). It is also possible that the three identified items are the most important as
indicated by strong factor loadings on a single-factor. The Cronbach’s alpha of the
current scale does fit within the range of Champion’s scale and other adaptations of her
severity scale which have alphas that range 0.75 to 0.85 (Champion & Skinner, 2008).
The construct of perceived severity consistently fails to predict behavior, even
when perceived severity was high among the sample population. This has been seen with
self-breast exams, (Champion, 1984; Champion, 1987; Gray, 1990; Janz & Becker, 1984;
Trotta, 1980), CHD (Ali, 2002), Tay-Sachs disease (Becker et al., 1974), and chest x-rays
for Tuberculosis (Hochbaum, 1958). In recent studies using HBM, severity scales were
Page 109
97
left out altogether due to this inability to predict behavior (Champion & Menton, 1997;
Champion et al., 2008; Oliver et al., 2011). The removal of a severity scale in the present
study conflicted with the theoretical premise that all six HBM constructs collectively
predict behavior (Champion, 1987). However, the high level of severity not predicting
behavior is consistent with theoretical intention which supposes that severity was related
to not partaking in a preventive screening (Champion, 1987).
Perceived benefits. Perceived benefits were measured using a four-item scale.
One item (BN2) within this scale was derived from Champion’s original 5-item benefits
subscale in the HBM scale (Cronbach’s alpha=0.61) with modifications in the
terminology to fit the concept of cholesterol screenings and CVD. The remaining three
items (BN1, BN3, BN4) were derived through the expert panel. EFA was conducted on
this scale and all items were retained in the scale. All factor loadings were within the
range of 0.60-0.73, where Champion’s original benefits factor loadings ranged from 0.40
to 0.66. The Cronbach’s alpha within the current study (0.83) is acceptable and similar,
if not stronger than the Cronbach’s alpha scores reported by Champion (0.61-0.87).
Previous literature support benefits as significant with respect to behavior, although in
most studies benefits has not been strongly related (Champion, 1987).
Perceived barriers. Perceived barriers were measured using 16 items. Five items
(BA4-BA8) were adapted from the barrier subscale in the Champion’s HBM scale (1984),
which had eight items and a Cronbach’s alpha of 0.76. Three items (BA9, BA10, BA13)
were derived from Guvenc et al.’s barrier scale within the HBM scale for Cervical
Cancer and Pap Smear Test (2011), which had 14 items and a Cronbach’s of 0.82. The
Page 110
98
remaining eight items (BA1-BA3, BA11-BA12, BA14-BA16) were developed based on
qualitative research that defined barriers faced by rural community members in the access
and utilization of healthcare (Goins et al., 2005; Strickland & Strickland, 1996).
EFA was conducted with the barriers items. Six items within two factors
remained in the scale (Factor1: BA12, BA15, BA16 and Factor 2: BA7, BA9, BA10).
Factor 1 (access to healthcare professionals) had factor loadings ranging between 0.81
and 0.88. The items within Factor 1 were all developed based off of the qualitative
research conducted with rural populations; however, only one of these (transportation)
has been identified consistently as a strong barrier in the current literature (Goins et al.,
2005; Strickland & Strickland, 1996). Although trust and the ability to talk with and
understand healthcare professionals have been identified as barriers within qualitative
research, they have not been identified as strong barriers within quantitative barrier
research.
The most common barriers derived from previous qualitative data were
transportation difficulties, financial constraints (cost), thought of services not being
needed, and lack of insurance coverage (Casey, Thiede, & Klingner, 2001; Goins et al.,
2005; Strickland & Strickland, 1996). The items that addressed other qualitatively
identified barriers were not retained in the model (e.g., cost and availability of
screenings). It is possible that the similar wording used within items BA12, BA15, and
BA16 around healthcare providers allowed them to have stronger factor loadings, while
other barriers were removed. The wording of these items should also be considered due
to the distinctiveness of the way they were worded in respect to the other items. For
example the items stated the participant did not participate in the screening “because”
Page 111
99
followed by a reason. However, factor loadings for these three items were greater than
the acceptable 0.40 for factor loading and were retained within factor 1.
Factor 2 (inconveniences) had factor loadings ranging from 0.74 to 0.87. Item
BA7 (0.74), which was adapted from Champion’s scale, was higher than the factor
loading range of Champion’s scale which was 0.43 to 0.71. Items BA9 (0.87) and BA10
(0.87) were adapted from Guvenc’s scale. The items in this study had factor loadings
greater than the original items which had factor loadings of 0.30 and 0.55. Again, the
higher factor loadings may be due to using fewer, more similar items to understand the
entire construct. The model in the current scale used two-factors and six items to
understand barriers. Champion’s scale used eight items and Guvenc’s scale used 14
items. The Cronbach’s alphas were 0.76 for Champion’s barriers scale and 0.82 for
Guvenc’s barriers scale, where the current study’s Cronbach’s alpha was strong (α=0.84).
Self-Efficacy. Self-efficacy was measured with ten items derived from the SES-
PSSP (Hogenmiller et al., 2007). The original scale had 20-items (Cronbach’s
alpha=0.95), but some were not selected for adaptation for this study because they were
not applicable to all members of the population being measured (e.g. living in a drug
treatment center or on street drugs).
EFA was conducted for the self-efficacy items, which resulted in a two-factor
scale with three items within each factor. This was consistent with Hogenmiller et al.’s
(2007) study in which two factors were revealed: Factor 1: personal costs and Factor 2:
relationships. Interestingly, the items in this study fell within the same factors as the
original items in Hogenmiller’s study. In this study, Factor 1: personal costs included
items SE1, SE2, and SE3, which had factor loadings of 0.86, 0.85, and 0.71 respectively.
Page 112
100
These were slightly lower than the factor loadings in Hogenmiller’s study of 0.87, 0.86,
and 0.80, but were still very strong and well above the inclusion criteria. In
Hogenmiller’s study the factors were measured individually, and factor 1 reported a
Cronbach’s alpha of 0.93 (for a total of 10 items).
In this study, Factor 2 (relationships) included items SE5, SE7, and SE9, which
had strong factor loadings of 0.73, 0.78, and 0.80, respectively, compared to
Hogenmiller’s factor loadings of 0.83, 0.73, and 0.60 for the same items. Hogenmiller et
al. reported a Cronbach’s alpha for factor 2 of 0.90 (which included eight total items).
The current study measured factors 1 and 2 as the same construct and reported a
Cronbach’s alpha of 0.75. The higher Cronbach’s alpha in Hogenmiller’s scale might
have been due to inclusion of more items that were strongly related to understand self-
efficacy within a given population. Another point to note is that Hogenmiller used the
factors as separate sub-scales to predict behavior, unlike the current study which used the
factors together within the construct of self-efficacy.
Research Question 2
2. What are the perceived susceptibility and severity of high cholesterol in rural
communities in Central Texas?
The most frequently reported susceptibility items were SS1: “I have or will
probably develop high cholesterol during my life” and SS2: “I worry about having high
cholesterol”. This is interesting considering these two items refer to susceptibility of high
cholesterol versus items SS3-SS7 which refer to susceptibility of Heart Attack or Stroke
(HA/S). Items SS1 and SS2 were reported at least 10% more than the other items. The
least reported susceptibility item was SS4: “My chances of suffering from HA/S in the
Page 113
101
nest few years is great.” This indicates that there is a low perception of having a HA/S
now (19.4%), but according to the reported frequency of item SS5 there is a somewhat
higher percentage of the sample population who think they will have a HA/S in their life
(31.2%).
There seems to be a disconnect between susceptibility to high cholesterol and the
relationship between high cholesterol and having a HA/S. Since cholesterol screening
behavior has not been previously been studied, there are no previous frequencies to
compare to the frequencies of this study. However, the lower perceived suceptibility to
HA/S in this studywas consistnent with studies that have been conducted using rural
communities in West Virginia (Krummel, Humphries & Tessaro, 2002) and Alabama
(Hamner & Wilder, 2010). Hamner and Wilder (2010) discovered that only 30% of
women identified heart disease/heart attack as a serious illness faced by women, but 83%
of the women indentified their risk of developing any form of CVD to be between 41-
80%. The qulatitaive work conducted by Krummel et al. (2002) revealed women had
higher perceived susceptibility to breast cancer although their susceptibility to HA/S
increased only if there was a family history of CVD events.
The severity of HA/S seemed to resonate more with the rural communities than
susceptibility. The most frequently reported severity items included SV2 “If I had a
HA/S it would be hard on my family,” SV6: “If I had a HA/S I might not be able to
work,” and SV7: “If I had a HA/S I wouldn’t be able to provide for myself or my
family.” The most frequently reported severity items were consistent with Krummel et
al.’s (2002) work with rural women. Krummel’s found that younger women with
children had higher perceived severity out of concern for who would provide for their
Page 114
102
children if they were to experience a cardiac event. Older women were more likely to
change behavior based on their perceived severity. The difference between ages supports
our findings (see research question 7 below). While severity frequencies were high, they
were not significantly related with meeting cholesterol screening behaviors or intention to
screen in bivariate analyses. Nor were they related after controlling for the other HBM
constructs (please see research questions 5 and 6 below).
Research Question 3
3. What are the perceived benefits and barriers of participating in cholesterol
screenings in rural communities?
The four benefit items were all reported by at least 53% of participants. The
most frequently reported benefit was BN1: “Knowing my cholesterol level can help me
stay healthy,” and the least frequent was BN2: “I wouldn’t be anxious if I knew my
cholesterol.” Given these results, most participants associated the benefits of cholesterol
screening to being healthier, reducing their risk of HA/S, and being less anxious. This
reflected the outcomes of breast cancer screening studies, particularly those looking at
self-breast exams (Champion, 1984; Champion, 1987; Gray, 1990). Gray (1990)
conducted a study using HBM with rural women to understand the practice of breast self-
examinations. She found that women must believe there is a benefit to be gained by
participating in the behavior, the most common benefit noted was reducing the severity of
breast cancer through early detection. Champion’s (1987) study showed benefits to have
low correlations with behavior however, thus benefits were removed from Champion’s
final model due to low account for variance.
Page 115
103
Barrier items were gathered and modified from various soucres, such as
Champion’s HBM scale (1984), Guvenc’s HBM scale (2011), and qualitative data from
rural studies by Strickland and Strickland (1996) and Goins et al. (2005). The most
commonly reported barriers were BA1: “Knowing my cholesterol level doesn’t keep me
from having a heart attack or stroke” and BA9: “It is hard for me to remember to get my
cholesterol checked.” BA1 presents a similar issue to what was identified with the
susceptibility items, there seems to be a lack of connection between cholesterol levels and
HA/S for the participants (Ali, 2002; Deskins et al., 2006; Krummel et al, 2002). This
conclusion was supported by Krummel and colleagues’ focus groups with rural women in
West Virginia, who when asked about behaviors they could change to lower their risk of
CVD did not believe changing their eating behaviors contributed to their risk. While this
was not a direct support for cholesterol levels, there was a picture of the lack of
knowledge in the relationship between food and risk for HA/S. The missing link between
food and that risk was the cholesterol build-up due to food intake (Krummel et al., 2002).
Ali’s (2002) study of CHD in women revealed similar results in that only half of the
sample identified high fat diets, high cholesterol levels, or hypertension as risk factors for
CHD and even fewer identfied diabetes or obesity as risk factors.
While barriers were significantly related with behavior (discussed later in research
questions 5, 6, and 7), lower frequencies for barriers does not quite match literature on
rural communities. Qualitative literature identifies high barriers to health care access as
one of the largest indicators for healthcare disparities among rural populations, in
comparison to their non-rural counterparts (Goins et al., 2005). The most commonly
identified barriers to utilization were transportation difficulties, limited healthcare supply,
Page 116
104
lack of quality health care, financial constraints, and social isolation. However in this
study, only transportation remained in the scale. The results show that some barriers
have higher frequencies which supports barriers identified in qualitative research (Casey
et al., 2001; Goins et al., 2005; Strickland & Strickland, 1996). The differences in
population could be one reason that the barriers retained in the current scale differ from
the qualitative research. Goins et al. (2005) studied rural older adult populations and
Strickland and Strickland (1996) studied rural minority populations. The current study
sample was unique in that the population was predominantly white (75%) with an
average age was 45 years. There was also the probablity (addressed above) that the
wording of items may have caused certain items to stay within the scale, and others to be
removed.
Research Question 4
4. What is the level of self-efficacy to perform cholesterol screenings in rural
communities?
Self-efficacy scores ranged from one to five, with one being low self-efficacy
(very unlikely to be screened) and five being high self-efficacy (very likely to be
screened). The mean score for this scale was 3.01 (SD=0.83) which corresponded with
the sample being neutral within the range of self-efficacy. The items with the lowest
likelihood in the scale were SE1: “if it is hard to get a doctor to take your insurance” and
SE2: “if you don’t have a doctor.” The items which revealed the highest likelihood were
SE5: “If a close friend or family member tells you a screening is needed” and SS9: “If
your last screening was abnormal.” Although this is the first self-efficacy scale for
cholesterol screening behavior, in comparing these results with other self-efficacy
Page 117
105
measures, the current study’s self-efficacy scale was lacking in that it was not related
with behavior. Self-efficacy has been consistent in its relationship with and prediction of
preventative health behaviors and intention (Fernandez et al., 2009; Hogenmiller et al.,
2007; Sol, Graaf, Petersen, & Visseren, 2010).
Research Question 5
5. Are HBM constructs related to current cholesterol screening utilization?
The basis for measuring current cholesterol screening was the AHA’s current
guidelines for having cholesterol screened within the last five years (AHA, 2011). Based
on the correlation matrix and one-way ANOVAs, the HBM constructs of susceptibility
(p<0.01) and barriers (p<0.05) were the only constructs significantly related with meeting
current guidelines. It is not surprising that perceived severity was not related with
behavior; as that was consistent with literature surrounding HBM and preventive health
screenings (Ali, 2002; Champion, 1984; Champion & Skinner, 2008). Perceived severity
has consistently not predicted or been related with behavior (Janz & Becker, 1984). The
lack of correlations among benefits, self-efficacy, and meeting cholesterol guidelines
were more interesting. When the Pearson’s and point biserial correlations were examined
further we saw that benefits were significantly related (p<0.01) with perceived
susceptibility and perceived barriers (p<0.01), which could explain why it did not
correlate with behavior. This was consistent with Champion’s (1987) study of breast
self-exams in which benefits was removed from the model after multiple regression
analysis because its clinical significance, if assessed with barriers, was too low and
benefits did not account for additional variance. Self-efficacy also had a significant
relationship with barriers (p<0.01) which may explain the lack of a significant
Page 118
106
relationship with behavior. This finding was consistent with some of the results in the
original self-efficacy scale by Hogenmiller et al (2007). Hogenmiller et al. conducted a
logistic regression using each factor separately to predict behavior, and found that that
self-efficacy Factor 1 (relationships) was not significantly related with behavior. In this
current study, self-efficacy was used as one construct with two factors, resulting in the
construct as a whole not being significantly related (Hogenmiller et al., 2007). Future
research should examine these relationships using the two self-efficacy factors separately
to see if each of the factors might individually be significantly related with behavior.
The relationship between perceived susceptibility and meeting guidelines was
positive, while the relationship between perceived barriers and meeting guidelines was
negative. The relationships seen in this correlation matrix were consistent with the
relationships seen between HBM constructs and other behaviors such as breast self-
exams and healthcare utilization in rural communities. Higher barriers are negatively
related with behavior, thus the more barriers faced by a person, the less likely the person
was to participate in the behavior (Champion, 1984; Champion, 1987; Trotta, 1980). The
positive relationship between perceived susceptibility and current screening behavior was
consistent within some research using HBM to predict behavior (Champion et al., 2008;
Champion & Skinner, 2008; Janz & Becker, 1984). However, the predictability of
perceived susceptibility has not been constant throughout its use. Some studies,
particularly within breast self-exams, have found the relationship between perceived
susceptibility and behavior to be insignificant (Champion, 1987; Trotta, 1980).
The subsequent logistic regression analysis was conducted using the meeting
current cholesterol screening behaviors as the dependent variable, and significant HBM
Page 119
107
constructs, perceived susceptibility and perceived barriers, as the independent variables.
Based on the results of the logistic regression both perceived susceptibility and barriers
remained significantly related with current behavior. Participants were 1.97 times more
likely to meet cholesterol guidelines for every increase of their susceptibility score.
While the more barriers a participant had, the less likely (0.46 times less likely) they were
to meet the current guidelines for cholesterol screening.
Research Question 6
6. Are HBM constructs associated with intention to engage in future cholesterol
screenings?
Based on the Pearson's correlations and one-way ANOVAs, the HBM constructs
of perceived susceptibility (p<0.01) and perceived benefits (p<0.05) were significantly
and positively related to intention to screen cholesterol in the next month. Also based on
these results there was a negative relationship between perceived barriers and intention
that approached significance (p=0.07). However, perceived severity and self-efficacy
were not related with intention to perform the behavior. Perceived severity was
significantly related to perceived susceptibility (p<0.01) and perceived benefits (p<0.01)
while self-efficacy was significantly related to perceived benefits (p<0.01). As discussed
previously, in the current literature perceived severity has not shown to have the ability to
predict behavior or intention (Ali, 2002; Champion, 1984; Champion & Skinner, 2008;
Janz & Becker, 1984).
A subsequent logistic regression showed that the only HBM constructs
significantly related with intention were perceived susceptibility and perceived barriers,
when controlling for the other HBM constructs found to be significantly related with
Page 120
108
intention in bivariate analyses. Specifically, as susceptibility scores increased, the
likelihood of intention increased by 2.22 times. This was consistent with previous
literature published on both prostate cancer screening and hepatitis C screening (Lu et al.
2010; Oliver et al., 2011). The increase in barriers scores decreased the likelihood of
intention to get screened by 0.57 times. Benefits were removed from the final model.
One potential explanation for why benefits did not remain significantly related with
intention while controlling for perceived barriers and perceived susceptibility could be
explained by the strong correlations between the constructs, as perceived benefits were
significantly related with both perceived susceptibility (p<0.01) and perceived barriers
(p<0.01). This was consistent with Champion’s (1987) work which showed that even
when benefits were related with behavior and intention; it was removed during logistic
regression due to its inability to account for variance when examined with barriers.
Research Question 7
7. Does insurance status (and other demographic and health variables) influence
the relationships examined in research questions 5 and 6?
Pearson’s and point biserial correlations as well as logistic regression analyses
were used to answer research question 7. The answers are discussed below beginning
first with research question 5, meeting guidelines for cholesterol screening, and then
addressing research question 6, intention to screen cholesterol in the next month.
Meeting AHA guidelines for cholesterol screenings. In order to understand the
influence of demographic and health variables on the relationships among HBM
constructs and meeting guidelines for cholesterol screening, Pearson’s and point biserial
Page 121
109
correlations between meeting guidelines and demographic/health variables were
examined. Results revealed significant and positive relationships between meeting
cholesterol guidelines and a greater disease index (p<0.01), higher BMI (p<0.05), being
insured (p<0.01), and older age (p<0.01).
The first logistic regression analysis revealed that perceived barriers, having
insurance, older age, a greater disease index, and a higher BMI were all significantly and
positively associated with meeting guidelines for cholesterol screening (χ2
=50.16 ,
p=0.00). The only factor not significantly related was perceived susceptibility.
Subsequent backward stepwise regression was then conducted and resulted in a final
model where fewer barriers, being insured, older age, greater disease index, and higher
BMI were retained in the model explaining meeting guidelines for cholesterol screening
(χ2
=50.16 , p=0.00). Although age and BMI were not significantly related with meeting
guidelines (p>0.05), they were retained in the model to provide the best fit. All other
variables retained in the model were significantly related with meeting cholesterol
screening guidelines.
In backward stepwise regression, perceived susceptibility was the only variable
not retained in the final model, which could potentially be explained by examining the
significant relationships between perceived susceptibility and insurance status (r=0.16,
p=0.05), age (r=0.38, p=0.00), disease index (r=0.54, p=0.00), and BMI (r=0.31, p=0.00).
The relationship between insurance status and meeting guidelines was significant
(p=0.00) with a substantial odds ratio (7.78). This means that each person with insurance
was 7.78 more likely to meet cholesterol screening guidelines. Since insurance would
reduce the cost related for someone to get their cholesterol checked, this could explain
Page 122
110
the strength of this relationship. It was also probable that someone who had insurance
was also more likely to visit the doctor more often, making it more likely that they have
had their cholesterol checked within the last five years (Casey et al., 2001).
The relationship between disease index and meeting guidelines is also
significantly strong with an odds ratio of 2.20. This means that the more diseases a
person possessed, the more likely they were to have had their cholesterol checked within
the recommended guidelines. The disease index took the survey categories (diabetes,
heart attack, angina, high blood pressure, heart bypass surgery or stent, congestive heart
failure, high blood cholesterol, and stroke) and categorized participants by the number of
diseases they had. The disease index reported 45.4% to have at least one of the diseases.
If the diseases are looked at by frequencies, 25.9% of the participants had high
cholesterol, 30% had high blood pressure, and 14.7% had diabetes. Given these
frequencies, it is not surprising that the disease index was strongly related with having
met the guidelines. Since 25.9% of the population had been diagnosed with high
cholesterol, this would most likely indicate that they have had their cholesterol checked.
A high percentage of participants also reported high blood pressure and diabetes, both of
which are diseases that are risk factors for and influenced by cholesterol levels, making it
likely that they have had their cholesterol checked as well (AHA, 2011). It is likely that
the people with high cholesterol, high blood pressure, and/or diabetes are some of the
same people across categories since the disease index shows 15.9% to have two of the
mentioned disease, 5.3% to have three, and 2.4% to have four or more. It is likely that
those who have a CVD related illness have in fact met the guidelines for cholesterol
screening. Over half of the sample (54.7%) reported not having any of the listed diseases
Page 123
111
which may lower their likelihood of having been screened. This assumption would be
consistent with the relationships found in this study.
A fifth result to note is the negative (significant) relationship between perceived
barriers and meeting guidelines. The relationship indicated that the more barriers a
person faced, he/she was 0.47 times less likely to meet the established guidelines. The
barriers represented by this scale were transportation, trust, remembering, and priorities.
These items were consistent with the reported barriers in rural communities (Goins et al.
2005; Strickland & Strickland, 1996).
Finally, although age and BMI were not significantly related with cholesterol
screening behavior, they remained in the model. In considering the role of age, older age
is generally accompanied by increased disease and more awareness of mortality (Guibert
et al., 1999; Hamner & Wilder, 2010; Stimpson & Wilson, 2009). As BMI increases, so
does the risk for disease, specifically high blood pressure, high cholesterol, and diabetes
due to excess weight gain (Krummel et al., 2002).
Intention to get cholesterol screened. In order to understand the influence of
demographic and health variables on the relationship between HBM constructs and
intention to screen cholesterol, Pearson’s and point biserial correlations were examined
first. The correlation matrix showed significant relationships between intention to
participate in cholesterol screening and perceived susceptibility (p<0.01), perceived
benefit (p<0.05), disease index (p<0.01), BMI (p<0.05), race/ethnicity (p<0.01), income
(p<0.01), education (p<0.01), and age (p<0.01). Perceived barriers were approaching
significance (p=0.07). However, insurance status was not related with intention to get
cholesterol screened. The lack of relation between insurance status and intention may be
Page 124
112
due to the higher correlation between those who had insurance status and meeting current
cholesterol guidelines; which would mean that those who had insurance were likely to
already have been screened and would not need to be screened again within the next
month. The remaining participants without insurance status would not have been
screened which then makes sense that they may have greater intention to be screened.
Based on significant bivariate relationships, the first logistic regression analysis
included perceived susceptibility, perceived benefits, perceived barriers, race/ethnicity,
disease index, education, age, and BMI. However, the only significant variable in the
model was race/ethnicity, with perceived barriers (p=0.06) and BMI (p=0.07)
approaching significance. Backward stepwise regression was then conducted and
resulted in a final model which included race/ethnicity, age, and BMI (χ2=33.06; p =
0.00). The resulting model undermined the assumptions that HBM constructs would
predict intention, as both perceived susceptibility and barriers were removed from the
model using backwards stepwise regression. Perceived susceptibility was strongly
related with race/ethnicity (r= 0.25, p=0.00), age (r=0.38, p=0.00), and BMI (r=0.31,
p=0.00). This high correlation between perceived susceptibility and these factors
potentially could explain why the construct was not included in the model. In
Champion’s (1987) study of breast self-exams, a similar result occurred where perceived
susceptibility was removed from the model. She stated that the theoretical framework of
HBM suggests that a participant’s perceived susceptibility would decrease after a
preventative action was taken. Thus, the participant would have a lower likelihood of
intention to participate in another screening (Champion, 1987). It is likely that the same
Page 125
113
thing happened in this sample, especially since the AHA’s recommendations for
cholesterol screenings is every five years.
The removal of perceived barriers in the backwards-stepwise regression was
interesting since perceived barriers was only significantly related to age (p=0.03), which
would not wholly account for its removal from the model. The removal of perceived
barriers was inconsistent with the current literature which shows barriers to be predictive
of intention (Champion, 1984; Champion, 1987; Champion & Skinner, 2008; Champion
et al., 2008; Janz & Becker, 1984). Part of this inconsistency might also be explained by
the relatively low sample size used in this study. Based on original sample size
calculations for this study, a sample of at least 230 was determined to establish the
power and validity for this survey, since that sample size was not achieved this study may
have inadequate power to detect all relationships (Garson, 2008). Future research should
use a larger sample size in order to re-examine this analysis. It may also be that
perceived barriers need to be examined within the categories of race/ethnicity, age, and
BMI. Future research should examine relationships by these categories.
The final model consisted of race/ethnicity (p=0.000), age (p=0.004), and BMI
(p=0.03). Race/ethnicity had a very high correlation with intention (r=0.45, p=0.00) and
a strong odds ratio with intention in this final model. According to the results of this
study, being non-white (defined as being Hispanic, African American, Asian/Pacific
Islander, or other) made a participant 5.79 times more likely to intend to have his or her
cholesterol screened. This result is not consistent with the current literature with rural
communities, which indicates that minorities were less likely to engage in preventative
behaviors (Strickland & Strickland, 1996). It is important to note here that rural America
Page 126
114
is not homogenous. Weinert and Long (1990) frequently address the diversity of rural
communities in their research, classifying regional diversity as an “essential
consideration when identifying rural health care needs” and stating that “it is reasonable
to expect that health differences among various rural areas and subgroups may be
pronounced” (Strickland & Strickland, 1996; Weinert & Long, 1990). Given the
diversity of rural America it is possible that there are differences in minorities seeking
healthcare in communities in central Texas and other rural populations in the United
States. For these communities, it may be that minorities have higher intentions to get
screened because whites are more likely to have insurance and have previously checked
their cholesterol (Casey et al., 2001; Strickland & Strickland, 1996). Since cholesterol
screening guidelines recommend screening every five years, those who have previously
been screened would have no intention of getting screened in the next month.
Other factors that contributed to the final model, age and BMI were also
significantly related with intention to be screened and had strong odds ratios as well. The
relationship between age (p=0.00) and intention showed, the older a participant gets, he
or she is 1.04 times more likely to intend to check his or her cholesterol. This
relationship gives insight into age being a predictor of intention which could be due to
maturity of the person, insight into their own mortality, or connection with greater
diseases seen in people as they age (Hamner & Wilder, 2010). The findings on age are
consistent with the literature which found age, particularly over 50, to be a predictor of
intention to screen cholesterol levels (Stimpson & Wilson, 2009). The model indicated
that increases in BMI (p=0.03) were associated with a participant being 1.06 times more
likely to intend to get their cholesterol screened. This finding is possibly related to the
Page 127
115
amount of disease linked with obesity. Future research should analyze HBM constructs
based on age, race/ethnicity, and BMI categories to see if there is potential moderation.
Implications
The current study supports the use of the HBM in understanding cholesterol
screening behaviors in rural communities. The findings of this study were consistent
with cancer screening literature in regards to the relationship between perceived
susceptibility and intention (Lu et al. 2010; Oliver et al., 2011), the relationship between
barriers and rural behavior (Goins et al., 2005; Strickland & Strickland, 1996), and the
relationship between severity and prediction of behavior (Champion, 1984; Champion &
Skinner, 2008; Janz & Becker, 1984).
This study was unique in that it used a theoretical framework to examine
cholesterol screening behavior. Cholesterol screening behavior has rarely been studied in
terms of understanding the actual behavioral aspects of cholesterol screening, and the
studies that do exist have been entirely qualitative (Deskins et al., 2006). In this study we
developed the first quantitative measures for HBM constructs regarding cholesterol
screening behavior. The current body of literature focuses on cholesterol levels,
outcomes of screening for cholesterol levels, and patient satisfaction with cholesterol
screenings. This study looked at why a person chooses (or refuses) to participate in a
cholesterol screening.
The use of a theoretical framework is also unique to this area of study. There
were ten studies identified that addressed cholesterol screenings, and only five used a
theoretical framework for the study (Anderson et al., 2011; Burke et al., 2003; Deskins et
al., 2006; Guibert et al., 1999; Spoon et al., 1997). This study was also unique in that
Page 128
116
rural communities in central Texas were studied, which have different demographic
characteristics as compared to other rural areas in Texas and other parts of the country.
The study supported the use of HBM constructs of perceived susceptibility, perceived
benefits, and perceived barriers to understand cholesterol screening behavior in rural
communities in central Texas. The constructs within the study also identified areas of
knowledge that were lacking as well as barriers that need to be addressed within rural
communities.
This research has several implications for researchers and health practitioners who
desire to help identify CVD risk in rural populations. This research gives insight into the
strongest predictors of behavior, including the large barriers faced by people residing in
rural communities. Healthcare practitioners should be aware of the most prominent
barriers and the barriers that were retained in the developed scale, such as the lack of trust
and inability to understand health care, since these impact their patients’ use of healthcare
services. Health educators should also use this information to design better programs to
educate rural communities on the importance of understanding their cholesterol levels.
The current results also provide insight into a lack of knowledge of cholesterol
and its potential links to CVD. This identifies a need for education in these areas within
rural communities. Future research should examine differences across age and ethnic
groups, as educational activities may need to be tailored for different age groups and
race/ethnicities since those factors are the biggest predictors of intention to perform
behavior.
Page 129
117
Limitations
There are multiple limitations to this study. The first limitation is that the results
of the survey instrument are self-reported. meaning there is no way to verify whether
participants actually checked their cholesterol. Disease status, education, and income
were also self-reported which could have been inflated or left out due to embarrassment.
Secondly, there is a lack of generalizability and selection bias due to the use of a
convenience sample. The convenience sample included members of three rural
communities in central Texas. Since the sample was recruited from a rural community in
central Texas with a very distinct demographic make-up, it is possible that the results of
this survey might not be generalizable to all rural communities, especially those with
different demographic characteristics. For example, this rural sample was predominantly
white (75.9%) and educated, on average, through the 12th
grade, which is very different
than other rural areas in Texas and the rest of the United States (Goins et al., 2005;
Strickland & Strickland, 1996). This research aimed to reduce selection bias by
recruiting through the school system, community health programs, and community
activities such as Bingo. However, because of the methods used, it was possible that
participants could have worked in the communities but not resided there. Zipcode was
asked on the survey to distinguish area of residence. Additionally, zipcode was not
related with either dependent variable of interest (current behavior or intention). Given
the sample population, this study may be generalizable to neighboring rural communities.
The deomgraphic characteristics of the sample population were very reflective of the
three communities surveyed, although this sample had a higher average age (45.3 years)
Page 130
118
than the communities (32.83 years; McNeal et al., 2010) and there were a
disproportionately high number of women who completed the survey (77.6%).
Third, this study aimed to use theory to understand cholesterol screening
behaviors, which has rarely been done. This presented a limitation because there were
often no comparisons for the results seen for the actual behavior. Although, we
compared the results of this study to the results of the HBM framework within cancer
screening behaviors. The results in this study are reflective of the previous uses of HBM
frameworks, giving it support. However, without further research using HBM to
understand cholesterol screening, its novelty is a limitation.
Fourth, the survey instrument was developed through the modification of scales
unrelated to cholesterol screening. This research study determined which factors within
the scale were in fact valid and reliable and, through EFA, establish five scales in which
to measure cholesterol screening behavior (perceived susceptibility, perceived severity,
perceived benefits, perceived barriers, and self-efficacy). Future research needs to
conduct a confirmatory factor analysis to further examine further validity and reliability
of the scales.
Fifth, this study was a cross-sectional research study design. The cross-sectional
design cannot predict behavior because it collected data at one point in time. There was
no way to understand the cause-and-effect relationship that might exist between HBM
constructs or demographic variables. Therefore, there was no way to know if fewer
barriers leads to cholesterol screening or if having cholesterol screening leads to fewer
barriers.
Page 131
119
Sixth, the small sample size was also a limitation to this study. Despite
disemminating 1,125 surveys, only 170 surveys were returned (15.1% response rate).
The desired sample size to establish validity and reliability of the HBM scales was five
times the number of total items (Garson, 2008). For the 67-item scale developed in this
research, the desired sample size was 230. The small sample size may have prevented
the detection of significant relationships. It is important to note that there were two
different sampling techniques used that may have influenced response rate. The round of
data collection consisted of surveys that were sent home with students, which had a low
response rate. While the second round of data collection included the researcher showing
up to Bingo, personally handing out surveys to participants, and collecting them when
participants were through. The possibility of a participant filling out and returning a
survey was much higher at Bingo. Future researchers should recognize that person-to-
person contact in rural communities may be a better data collection method.
Last, this study reveals potential limitations of the HBM. The data analysis
showed that none of the HBM constructs were related with intention. Intention is not a
construct within the HBM and comes from TPB. The lack of relationships between
intention and HBM constructs questions the model’s ability to predict intention to
participate in future screening. However, it was evident that, as it was intended, HBM
constructs were related with behavior itself. It is also possible that perceived limitations
of the HBM may also be influenced by the small sample size available.
Future Research
This research study contributes to the current body of literature by providing
validated quantitative scales to measure five HBM constructs as they pertain to
Page 132
120
cholesterol screening behavior (perceived susceptibility, perceived severity, perceived
benefits, perceived barriers, and self-efficacy). However, future research should examine
these scales and conduct a confirmatory factor analysis with larger and more diverse rural
samples. Future research should also strive for a higher response rate. Other states have
found rural communities to have between 42-48% response. The current study only
achieved a 15.1% response rate. It is advisable that future researchers seek out strong
community partners and stakeholders to help advertise and administer the surveys.
The findings of this research support the future use of HBM constructs to
understand cholesterol screening behavior and also to understand health behaviors in
rural communities, specifically, perceived suceptibility, perceived benefits, and perceived
barriers. The findings show perceived susceptibility, perceived benefits, and perceived
barriers to be correlated with meeting guidelines and intention in bivariate analyses.
However, given the final model revealed by logistic regression, there was a distinct need
to further examine these relationships in a larger sample size. Future research might also
consider using cues to action to increase participation in a screening behavior. Cues to
action may be different depending on the rural community and should be tailored to the
appropriate audience.
Beacause none of the HBM constructs were included in the final model
examining intention to engage in a future screening, future research should look at HBM
constructs by age group, race/ethnicity, and BMI categories. This is necessary to better
understand what constructs in HBM are predictive for current behavior and intention. It
is also important for future research to use the developed scales in different rural
communities to confirm and further examine validity and reliability in diverse rural
Page 133
121
populations. This would mean that the instument would need to be used throughout rural
communities in the United States and possibly tailored for different cultures and socio-
demographics. It also means there might be a need to translate the survey into spanish in
order to validate the scale among rural communities in states such as Texas, New Mexico,
Arizona, and California.
Conclusion
Results of the current study show the utility of HBM constructs in explaining
cholesterol screening behavior in rural communities in central Texas. The limitations of
this study were self-reported bias, a convenience sample, and sample size. Despite these
limitations, barriers were identified that healthcare practicioners and health educators can
use to help develop new educational programs. Based on the final logistic regression
models, race/ethnicity, age, and BMI were significantly related with intention and
perceived barriers, insurance status, age, BMI, and diseases index were significantly
related with meeting AHA’s cholesterol screening recommendations. Knowing that these
factors have a large influence on a person’s behavior and intention means that
educational programs should foucs on different ages, races, and BMI ranges and also
focus on getting rural populations to meet the AHA guidelines for cholesterol screenings.
Page 135
123
APPENDIX A
Survey Instrument
The following statements measure different aspects of belief concerning Heart Attacks
and Stroke.
Please circle the number (1-5) which best explains how much you agree with each
statement.
Cholesterol is defined as a waxy substance found in the fats in your blood.
Strongly Disagree Disagree Neutral Agree
Strongly Agree
1 I have or will probably develop high cholesterol during my life. 1 2 3 4 5
2 I worry about having high cholesterol. 1 2 3 4 5
3 It is likely that I will suffer from a heart attack or stroke in the future. 1 2 3 4 5
4 My chances of suffering from a heart attack/stroke in the next few years are great. 1 2 3 4 5
5 I feel I will have a heart attack or stroke sometime during my life. 1 2 3 4 5
6 Having a heart attack or stroke is currently a possibility for me. 1 2 3 4 5
7 I am concerned about the chance of having a heart attack or stroke in the near future. 1 2 3 4 5
8 If I have high cholesterol, I will be more likely to have a heart attack or stroke. 1 2 3 4 5
9 If I had a heart attack and stroke, my whole life would change. 1 2 3 4 5
10 Having a heart attack or stroke will cause problems that would last a long time. 1 2 3 4 5
11 If I had a heart attack or stroke it would be hard on my family. 1 2 3 4 5
12 The thought of having a heart attack or stroke scares me. 1 2 3 4 5
13 If I had a heart attack or stroke I might not be able to work. 1 2 3 4 5
Page 136
124
14 If I had a heart attack or stroke I wouldn’t be able to provide for myself or my family. 1 2 3 4 5
15 My feelings about myself would change if I had a heart attack or stroke. 1 2 3 4 5
16 Knowing my cholesterol level can help me stay healthy. 1 2 3 4 5
17 I would not be so anxious about a heart attack or stroke if I got my cholesterol checked. 1 2 3 4 5
18 When I do cholesterol checks, it is good for my health. 1 2 3 4 5
19 Regular cholesterol checks lower the risk of having a heart attack or stroke. 1 2 3 4 5
20 I don’t think it’s useful to know my cholesterol level. 1 2 3 4 5
21 Knowing my cholesterol level doesn’t keep me from having a heart attack or stroke. 1 2 3 4 5
Strongly Disagree Disagree Neutral Agree
Strongly Agree
22 It is not easy for me to get my cholesterol checked. 1 2 3 4 5
23 It is embarrassing for me to get my cholesterol checked. 1 2 3 4 5
24 Cholesterol checks can be painful or uncomfortable. 1 2 3 4 5
25 My family would make fun of me if I got my cholesterol checked. 1 2 3 4 5
26 Getting cholesterol checks gets in the way of things I need to do. 1 2 3 4 5
27 Getting my cholesterol checked takes too much time. 1 2 3 4 5
28 It is hard to remember to get my cholesterol checked. 1 2 3 4 5
29 I have other problems more important than checking my cholesterol. 1 2 3 4 5
30 I am able to do everything I want to, so I don’t need to get my cholesterol checked. 1 2 3 4 5
31 I do not have transportation to get to the doctor to get my 1 2 3 4 5
Page 137
125
cholesterol checked.
32 There is nowhere to get my cholesterol checked where I live. 1 2 3 4 5
33 I can’t afford to get my cholesterol checked. 1 2 3 4 5
34 I do not get my cholesterol checked because I do not trust healthcare providers. 1 2 3 4 5
35
I do not get my cholesterol checked because I can’t understand or talk with my doctor. 1 2 3 4 5
The following statements measure your confidence in being able to seek cholesterol and blood
pressure screenings.
Please circle the number (1-5) that best explains how likely you are to participate in the
behavior.
How likely are you to get your cholesterol checked…
Very Unlikely
Unlikely Neutral Likely Very Likely
37 If you have to pay for it? 1 2 3 4 5
38 If you don’t have a doctor? 1 2 3 4 5
39 If it is hard to get a doctor to take your insurance? 1 2 3 4 5
40 If you would lose work time? 1 2 3 4 5
41
If a close friend or family member tells you a screening is needed? 1 2 3 4 5
42 If you need a ride to your appointment? 1 2 3 4 5
43 If your friend tells you a screening is unnecessary? 1 2 3 4 5
44 If your last screening was normal? 1 2 3 4 5
45 If your last screening was abnormal? 1 2 3 4 5
46 If you are too busy during clinic hours? 1 2 3 4 5
Page 138
126
Please complete the following information about yourself. The information you
provide will be used for research purposes only and will not be shared with anyone
outside of the research project.
1. What is your current age? ______ (years old) 2. What is your gender? ____ Male OR ____ Female 3. What is your height? ______ Feet ______ Inches 4. What is your current weight? ___________ Pounds 5. What is your race/ethnicity? (check only ONE)
____ White ____ African American ____ Hispanic ____ Asian/Pacific Islander ____ Other
6. Are you…. (Check only ONE)? ____ Married ____ Divorced ____ Widowed ____ Separated
____ never married (Single) ____ a member of an unmarried couple 7. What is the highest grade or year of school you completed? ____ Never attended school or only attended kindergarten ____ Grades 1 through 8 (Elementary) ____ Grades 9 through 11 (Some high school) ____ Grade 12 or GED (High School graduate) ____ College 1 year to 3 years (Some college or technical school) ____ College 4 years or more (College graduate) 8. Are you currently….? ____ Employed for wages ____ Self-employed ____ Out of work for more than 1 year ____ Out of work for less than 1 year ____ A Homemaker ____ A Student ____ Retired ____ Unable to work
9. Do you have any kind of health care coverage, including health insurance, prepaid plans such as HMOs, or government plans such as Medicare/Medicaid or Indian Health Services?
____ Yes ____ No ____ Don’t know/not sure 10. Have you EVER been told by a doctor, nurse, or other health professional that you have any of the following (check ALL that apply):
____ Diabetes (high blood sugar)
Page 139
127
____ Heart Attack ____ Angina (chest pain) ____ High Blood Pressure ____ Heart bypass surgery or a stent to open an artery ____ Congestive Heart Failure ____ High Blood Cholesterol ____ Stroke or mini stroke
11. Do you smoke cigarettes every day, some days, or not at all?
____ Everyday ____ Some days ____ Not at all 12. Have you had a test for high blood sugar or diabetes within the past three years?
____ Yes ____ No ____ Don’t know/Not sure
13. How often do you participate in any physical activities or exercises such as walking, gardening, running, or golf for exercise? (Check only ONE)
____ Once a day ____ Once a week ____ 3-5 times a week ____ Once a month ____ I don’t exercise
14. When was the last time you had your blood cholesterol checked? (Check only ONE)
____ Within the past 1 year ____ Within the past 2 years ____ Within the past 5 years ____ 5 or more years ago ____ Never ____ Don’t know/Not sure
15. Where did you get your blood cholesterol checked most recently? (Check only ONE)
____ Doctor’s office ____ Screening program ____ Hospital ____ I have not had my cholesterol checked 16. Do you intend to get your cholesterol checked in the NEXT month? ____ Yes OR ____ No 17. When was the last time you had your blood pressure checked? (Check only ONE)
____ Within the past year ____ Within the past 2 years ____ Within the past 5 years ____ 5 or more years ago ____ Never ____ Don’t know/Not sure 18. Have you received any type of education about Blood Pressure and Cholesterol in the last 5 years? If yes, where did you receive the education?
Page 140
128
____ Yes, _____________________________________ ____ No ____ Don’t know/not sure
19. Yearly household income:
____ less than $10,000 ____ $60,000 to $69,999
____ $10,000 to $19,999 ____ $70,000 to $79,999
____ $20,000 to $29,999 ____ $80,000 to $89,999
____ $30,000 to $39,999 ____ $90,000 to $99,999
____ $40,000 to $49,999 ____ $100,000 or greater
____ $50,000 to $59,999
19. What is your zip code? _______________________
20. How far away is the closest town from your home? (Check only ONE)
___ I live in town ___ 1-5 miles out of town ___ 5-10 miles out of town ___ More than 10 miles out of town
21. How do you get to and from medical appointments (check one)?
____ Your own vehicle
____ Family member’s vehicle
____ Friend’s vehicle
____ Public transportation
____ Bicycle
____ Other: _________________________
Page 141
129
APPENDIX B
Request for the Approval of Research Involving Human Subjects
Proposal
Title of the research project/teaching exercise: Using the Health Belief Model to
understand cholesterol screenings in rural populations in central Texas.
Are you using subjects in research? Yes (yes or no)
Are you using subjects in teaching exercises? NO (yes or no)
Part 1: Expedited Review Request (if applicable)
The Baylor University Committee for Protection of Human Subjects in Research
(Institutional Review Board or (IRB) has agreed to perform expedited reviews of certain
research proposals that involve only survey research that poses minimal risk to research
subjects. Proposals handled through the expedited review process are held to the same
standard as those that go through the normal review process.
I have reviewed the research or teaching exercise listed above. In my opinion, this
proposal meets all three of the following criteria required for expedited review by the
Baylor University Committee for Protection of Human Subjects in Research:
1. The only involvement of research subjects in the proposed research/teaching
activity is response to written, oral, or electronic surveys;
2. The information requested in these surveys does not include any highly personal
or sensitive information (reports of criminal activity or sexual behavior); and
3. The activity poses minimal physical and psychological risk to the research
participant.
Part 2: Introduction and Rationale
Describe the research background and rationale for the project:
Cardiovascular Disease is the number one killer of U.S. adults, approximately 616,067
each year. (Xu, 2007). The biggest risk factors for Cardiovascular Disease are
hypertension, high cholesterol, Type-2 diabetes, and lifestyle factors. Lifestyle factors
include smoking, nutrition and physcial activity. A good indicator of risk for
Cardiovascular Disease is cholesterol. Detection of high levels in these ares can prompt
lifestyle changes that can help prevent or manage Cardiovascular disease (Mayo Clinic,
2011). This is especially needed in rural communities where the risk of dying of
Cardiovascular Disease is 1.34 times more likely than their non-rural counterpart (Zuniga,
2003). However, rural communities have less access to primary care or screening
Page 142
130
facilities in which to check their blood pressure, cholesterol, or blood sugar, as well as
less access to treatment or medication if a diagnosis of Cardiovascular disease is given.
Application of health behavior theory is useful for better understanding behavior and is
important for understanding why a member of a rural community might particiapte in a
cholesterol screening. The Health Belief Model (HBM) is a theory that has been
frequently used to help understand participation in health screenings, particularly for
breast cancer (Champion, 1987; Tavafian, 2009). HBM has also been used qualitatively
to understand rural risk for cardiovascular disease, however quantitative measures of
HBM constructs have not been developed (Hamner, 2010; Homko, 2008). The purpose of
this research is to develop and pilot test HBM construct scales to better understand the
use of cholesterol screenings in rural communities in Central Texas.
Clearly outline the questions being addressed
Question 1: Are the developed HBM measures valid and reliable?
Question 2: What is the perceived susceptibility and severity of high cholesterol in rural
communities in Central Texas?
Question 3: What are the perceived benefits and barriers of participating in cholesterol
screenings in rural communities?
Question 4: Are the constructs of the Health Belief Model related with cholesterol
screening use?
Question 5: Does insurance status influence these relationships?
Describe any expertise you have in this area or research or teaching:
Tiffany Rose will serve as the principle investigator of this study and has research and
teaching expertise on the promotion of health and quality of life. Tiffany Rose serves as a
graduate teaching assistant and research assistant in the master of public health degree
program at Baylor University. She holds a bachelor’s degree in Biology and will graduate
from Baylor’s MPH in Community Health Education program in May of 2012. Her
teaching expertise focuses on promoting health and quality of life among college students
and adolescents. She teaches university students in a university wellness course and has
worked with adolescents to address a variety of health issues (e.g., total wellness,
physical activity, nutrition, body composition and image, sexual health, infectious
diseases, drugs, tobacco, and alcohol). She has served as a project coordinator through
Scott & White’s Heart Aware Reaching Rural Populations (HARRP) Program under Dr.
Catherine McNeal, providing health screenings and treatment to rural communities across
central Texas. She has served as a research assistant for the study titled “Interdialytic
Exercise in Renal Failure Patients” (under Dr. M. Renee Umstattd) and studies regarding
women’s health interventions health promotion among Kurdish women in Armenia
(under Dr. Eva Doyle).
Dr. M. Renée Umstattd will serve as the faculty principle investigator and faculty advisor
of this study and has research expertise focusing on the promotion of health and quality
Page 143
131
of life across the lifespan through physical activity. Specific research expertise areas
include examining relationships among theoretical determinants of physical activity from
a social cognitive and ecological perspective; implementation and evaluation of
theoretically based physical activity interventions and the translation and dissemination
of efficacious physical activity interventions into community settings.
Cite relevant research (including your own) in a bibliography:
Ali, N. (2002). Prediction of coronary heart disease prevention behaviors in women: A
test of the health belief model. Women & Health, 35(1), 83-96.
Babu, B., Varma, G., Nayak, A., Rath, K. (2007). Utilization of primary healthcare
services: Experiences and perceptions of a rural community in east Godavari district. The
Indian Journal of Social Work, 68(2): 235-247.
Bonar, E. & Rosenberg, H. (2011). Using the health belief model to predict injecting drug
users’ intentions to employ harm reduction strategies. Addictive Behaviors, 36, 1038-
1044.
Bradley, E., Thompson, J., Byam, Webster, T., Zerihun, A., Alpern, R., Herrin, J., Abebe,
Y., & Curry, L. (2011). Access and quality of rural healthcare: Ethiopian millennium
rural initiative. International Journal for Quality in Health Care, 23(3), 222-230.
doi:10.1093/intqhc/mzr013
Centers for Disease Control and Prevention (CDC). Behavioral Risk Factor Surveillance
System Survey Questionnaire. Atlanta, Georgia: U.S. Department of Health and Human
Services, Centers for Disease Control and Prevention, 2011.
Champion, V. (1984). Instrument development for health belief model constructs.
Advances in Nursing Sciences, 6(4), 73-85.
Champion, V. (1987). The relationship of breast self-examination to health belief model
variables. Research in Nursing & Health, 10, 375-382.
Cristacho, S., Garces, D., Peters, K., & Mueller, B. (2008). Listening to rural Hispanic
Immigrants in the Midwest: A community-based participatory assessment of major
barriers to health care access and use. Qualitative Health Research, 18(5), 633-646.
doi:10.1177/1049732308316669.
Garson, D. G. (2008). Factor Analysis: Statnotes. Retrieved March 22, 2008, from North
Carolina State University Public Administration Program,
http://www2.chass.ncsu.edu/garson/pa765/factor.htm.
Goins, R., Williams, K., Carter, M., Spencer, S., & Solovieva, T. (2005). Perceived
barriers to health care access among rural older adults: A qualitative study. The Journal
of Rural Health 21(3), 206-213.
Page 144
132
Guvenc, G., Akyuz, A., & Acikel, C. (2010). Health belief model scale for cervical
cancer and pap smear test: psychometric testing. Journal of Advanced Nursing, 67(2),
428-437. doi:10.1111/j.1365-2648.2010.05450.x
Gray, M. (1990). Factors related to practice of breast self-examination in rural women.
Cancer Nursing, 13(2), 101-107.
Hamner, J. & Wilder, B. (2010). Perceptions and predictions of cardiovascular disease of
Alabama women in a rural county. Applied Nursing Research, 23, 80-85.
doi:10.1016/j.apnr.2008.06.004
Harju, B., Wuensch, K., Kuhl, E., & Cross, N. (2006). Comparison of rural and urban
residents’ implicit and explicit attitudes related to seeking medical care. The Journal of
Rural Health, 22(4), 359-363.
Homko, C., Santamore, W., Zamora, L., Shirk, G., Gaughan, J., Cross, R., Kashem, A.,
Petersen, S., & Bove, A. (2008). Cardiovascular disease knowledge and risk perception
among underserved individuals at increased risk of cardiovascular disease. Journal of
Cardiovascular Nursing, 23(4), 332-337.
Hogenmiller, J., Atwood, J., Lindsey, A., Johnson, D., Hertzog, M., & Scott Jr, J. (2007).
Self-efficacy scale for Pap smear screening participation in sheltered women. Nursing
Research, 56(6), 369-377.
Hsu, H., & Gallinagh, R. (2001). The relationships between health beliefs and utilization
of free health examinations in older people living in a community setting in Taiwan.
Journal of Advanced Nursing, 35(6), 864-873.
Iriyama, S., Nakahara, S., Jimba, M., Ichikawa, M., & Wakai, S. (2007). AIDS health
beliefs and intention for sexual abstinence among male adolescent students in Kathmandu,
Nepal: A test of perceived severity and susceptibility. Public Health, 121, 64-72.
Krummel, D., Humphries, D., & Tessaro, I. (2002). Focus groups on cardiovascular
health in rural women: Implications for practice. Journal of Nutrition Education and
Behavior, 34(1), 38-45.
Long, K. & Weinert, C. (1987). Understanding the health care needs of rural families.
Family Relations, 36(4), 450-455.
Mayo Clinic. High Blood Pressure (hypertension). Diseases and Conditions. 2011.
http://www.mayoclinic.com/health/high-blood-pressure/DS00100
Page 145
133
Montana Disability & Health Program (2004). Montana providers of services to Adults
with developmental disabilities: Urban/rural characteristics, and direct service staff
turnover rates and replacement costs. Rural Disability and Rehabilitation. Research
Progress Report #25. Retrieved from:
mtdh.ruralinstitute.umt.edu/publications/MontanaProviders.html
Pennsylvania Rural Health Services (2005). Rural by the numbers. RuralPA-CPS.
Retrieved from: www.rural.palegislature.us/news0905.html
Rosenstock, I. The health belief model: explaining health behavior through expectancies.
In: Glanz, K., Rimer, B.K., & Viswanath, K. (Ed.). (2008). Health Behavior and Health
Education. San Francisco, California: Jossey-Bass.
Sarkar, U., Ali, S., & Whooley, M. (2006). Self-efficacy and health status in patients with
coronary heart disease: Findings from the Heart and Soul study. Psychosomatic
Medicine, 69, 306-312.
Sellers, S., Poduska, M., Propp, L., White, S. (1999). The health care meanings, values,
and practices of Anglo-American males in the rural Midwest. Journal of Transcultural
Nursing, 10(4), 320-330.
Smalley, S., Wittler, R., & Oliverson, R. (2004). Adolescent assessment of cardiovascular
heart disease risk factor attitudes and habits. Adolescent Heart Disease Attitudes and
Habits, 35(5), 374-379. doi:10.1016/j.jadohealth.2004.01.005
Strickland, J., & Strickland, D. (1996). Barriers to preventive health services for minority
households in rural south. The Journal of Rural Health, 12(3), 206-217.
doi:10.1111/j.17480361.1996.tb00795.x
Sullivan, K., White, K., Young, R., Chang, A., Roos, C., & Scott, C. (2008). Predictors of
intention to reduce stroke risk among people at risk of stroke: An application of an
extended health belief model. Rehabilitation psychology, 53(4), 505-512. doi:
10.1037/a0013359
Tavafian, S., Hasani, L., Aghamolaei, T., Zare, S., & Gregory, D. (2009). Prediction of
breast self-examination in a sample of Iranian women: an application of the Health Belief
Model. BMC Women’s Health, 9(37), doi:10.1186/1472-6874-9-37
Tovar, E.G., Rayens, M.K., Clark, M., & Nguyen, H. (2010). Development and
psychometric testing of the health beliefs related to cardiovascular disease scale:
preliminary findings. Journal of Advanced Nursing 66(12), 2772-2784.
doi:10.1111/j.1365-2648.2010.05443.x
Utz, S., Padgett, L., Blank. M., Guarini, J., Morton, S., Wilson, L., & Simmons, W.
(2001). Comparisons of specific illness beliefs of rural and urban blacks and whites.
Journal of Nursing Research, 7(2), 1-27.
Page 146
134
Weinert, C., & Long, K. (1990). Rural families and health care: Refining the knowledge
base. In D. Unger & M. Sussman (Eds.) Families in community settings: Interdisciplinary
perspectives. Binghamton, NY: Hawthorne.
Xu, J., Kochanek, K., Murphy, S. & Tejada-Verda, B. (2010). Deaths: Final data for 2007.
National Vital Statistics Report, 58(19), 1-135.
Zuniga, M.; Anderson, D.; and Alexander, K. (2003). Heart Disease and Stroke in Rural
America: A Literature Review. Rural Healthy People 2010: A companion document to
Healthy People 2010. Volume 2. College Station, TX: The Texas A&M University
System Health Science Center, School of Rural Public Health, Southwest Rural Health
Research Center.
Part 3: Methodology
Thoroughly describe the methodology to carry out the project/teaching exercise:
The study will involve all members of the Holland, Bartlett, and Granger, Texas
communities who are over 18 years of age and choose to participate. The survey will be
offered through the Holland and Granger school districts. The survey will be given to
other members of the Holland, Bartlett, and Granger communities through local churches
and participants involved in the Heart Aware Reaching Rural Populations program
currently being implemented by Dr. Catherine McNeal at Scott & White. Attached are
support letters from each of the participating organizations. The community members
will be invited to fill out the one-time survey preceded by completing an informed
consent form with detailed information regarding the purpose and protocol of the study.
Participation is voluntary and consent will be indicated by completion and submission of
the informed consent form. Consent will also be indicated by the return of a fully
completed survey since there is no identifying information of the survey form. To help
ensure that confidentiality is maintained the following procedures will be followed:
•All surveys and informed consent forms will be labeled with identification numbers
prior to survey administration.
•After data collection is completed, all surveys and informed consent forms will be stored
separately in locked filing cabinets that will be accessible only by project investigators.
Incentives
Upon completion of a survey, each participant completing and returning an informed
consent form will be entered into a drawing for one of ten prizes. The participants will
have a choice of either a prize, such as a portable DVD player, MP4 player, or video MP3
player, or a check for $100. If the participant chooses the check option, he or she will be
required to fill out a W-9, which will require personal information which will only be
used to process the check. The name, phone number, and email of the participant will
immediately be removed from the informed consent form and will in no way be
connected to the completed survey.
Page 147
135
Sample Size
The desired sample size to establish validity and reliability of the survey items should be
5 times the number of survey items, which is 225 (Garson, 2008). In order to establish
more power and validity in the survey, a 95% confidence level with 5% error is desired.
In order to achieve this out of a population of 3,500 people, at least 350 people need to
complete surveys. In order to receive 350 completed surveys, response rates of the
communities need to be considered. Rural Health services in various states, such as
Montana and Pennsylvania, report and average of 42-48% response rates for rural
communities (Montana, 2004; Pennsylvania, 2005). Disseminating eight hundred surveys
allow the recommended allocation for a 42-48% response rate in the Granger and
Holland communities. Obtaining eight hundred surveys should account for the response
rate as well as incomplete surveys.
Data collection
Data will be collected through a one-time survey that will ask questions related to
demographics and Health Belief Model constructs. The surveys will be disseminated
through different organizations at varying times. These organizations include community
school districts, churches, and the Heart Aware Program.
Survey instrument/Measures
The survey instrument has been adapted from Champion’s Health Belief Scale for Breast
Self-Exams (Champion, 1984), susceptibility items for Cardiovascular Disease (Tovar et
al., 2010), and the Self-Efficacy Scale for Pap smear (Hogenmiller, 2007). An expert
panel has reviewed the items to ensure face validity. The survey should take
approximately 20-25 minutes to complete. The survey contains 45 questions measuring
constructs of the Health Belief Model. In addition to Health Belief Model constructs,
demographic questions are also included.
-Perceived Susceptibility will be measured by 7 items to examine a person’s perceived
risk of developing high cholesterol. These items will be measured using a 5-point Likert
Scale, where 1 = strongly disagree and 5 = strongly agree.
-Perceived Severity will be measured by 8 items that will understand a person’s
perception of how severe high cholesterol and secondary disease, such as heart attack and
stroke, will be if they get it. These items will be measure using a 5-point Likert Scale,
where 1 = strongly disagree and 5 = strongly agree.
-Perceived Benefits will be measured by 4 items to assess effectiveness and reward of
engaging in cholesterol screenings. These items will be measured using a 5-point Likert
Scale, where 1 = strongly disagree and 5 = strongly agree.
-Perceived Barriers will be measured using 16 items that address problems faced in order
to participate in a cholesterol screenings. These items will be measured using a 5-point
Likert Scale, where 1 = strongly disagree and 5 = strongly agree.
Page 148
136
-Self-efficacy will be measured using 10 items that will examine the person’s confidence
in his/her ability to get screened for cholesterol. These items will be measured using a 5-
point Likert Scale, where 1 = very unlikely and 5 = very likely.
Data Analysis
Data will be analyzed using SPSS 19. Descriptive statistics, such as means and standard
deviations, will be used to understand demographic characteristics of the sample and
responses to HBM subscales. Exploratory Factor Analysis will be conducted to examine
validity of the modified HBM scales. Cronbach’s alpha will be used to calculate the
internal consistency of the items. Pearson correlation coefficients and regression analyses
will be used to determine if there are significant relationships between constructs of the
HBM, intention and current cholesterol screening behavior. Subsequent multivariate
analyses will be used to examine if these relationships are impacted when controlling for
insurance coverage.
How many subjects will be used? 800 will be recruited (please see explanation above).
How will the subjects be recruited?
Subjects will be recruited through various organizations in the communities. Letters of
support from both school districts, the Heart Aware Program, and two local churches can
be viewed in the supporting documents. Consent forms and surveys will be disseminated
to parents through the school system. The surveys will be conducted through Sunday
school classes and Bible studies at local churches. Surveys will also be disseminated to
participants of the Heart Aware program that is currently being implemented in these
communities by Dr. Catherine McNeal at Scott & White. People who choose to
participate and return an informed consent form will be entered into a drawing for one of
ten prizes or checks for $100 as a token of appreciation for their time.
Possible risks to the subjects (both physical and psychological):
There is minimal risk in this study. It is possible that the subjects may feel uncomfortable
talking about their knowledge of cardiovascular disease, their opinions of healthcare or
why they choose not to participate in screening behaviors, such as barriers due to money
or transportation.
Method(s) to limit risks:
Each participant will be given the opportunity to withdraw from the study at any time and
participation in the study is entirely voluntary. All information will be kept confidential
and will be fully de-identified.
Proposed safeguards to protect the subjects’ right to privacy:
All participant information gathered through the survey will remain confidential and will
be stored in a secured area (password protected computer and/or locked filing cabinet).
Throughout the course of the study, all identifying information will be stored separately
from collected data in a secure location and disposed of after incentives are disbursed. All
data is de-identified to where each survey will be assigned a unique identification number
that will not be associated with informed consent information. Participants will be
notified of this in the informed consent form.
Outline the method(s) to be used to obtain the data, to analyze the data, and to
disseminate the results of the research project:
Page 149
137
Data will be collected through a one-time survey that will ask questions related to
demographics and Health Belief Model constructs. The study will involve all members of
the Holland, Bartlett, and Granger, Texas communities who are over 18 years of age and
choose to participate. The survey will be offered through various organizations in these
communities including school districts, various churches, and through participants
involved in the Heart Aware program that is currently being implemented in both
communities by Dr. Catherine McNeal at Scott & White.
Data will be analyzed using SPSS 19. Descriptive statistics, such as mean and standard
deviation, will be used to understand demographic characteristics of the sample and
responses to HBM subscales. Exploratory Factor Analysis will be conducted to examine
validity of the modified scales. Cronbach’s alpha will be used to calculate the internal
consistency of the items. Pearson correlation coefficients and regression analyses will be
used to determine if there are significant relationships between constructs of the HBM,
intention and current cholesterol screening behavior. Subsequent multivariate analyses
will be used to examine if these relationships are impacted when controlling for insurance
coverage. Data will be reported in Tiffany Rose's Master's Thesis as well as being
submitted to Journals for publication and national health organizations for presentation. A
copy of the results will also be provided to the school nurses in each community and the
Heart Aware program to help better reach the needs of the communities involved.
Part 4: Informed Consent Form Checklist When using humans as subjects in research you must obtain their informed consent. Please upload a copy of your Informed Consent Form before submitting your
proposal
I verify that the following items appear on my Informed Consent Form:
A statement explaining the purpose of the research.
A statement of the expected duration of the subject's participation.
A description of the procedures to be followed.
A description of any reasonable foreseeable risks or discomforts to the subject, including invasion of
privacy.
A description of any benefits resulting from the research, either to the subject or to others.
A statement that informs subject of his/her right not to be a subject in a research project that is also a
teaching exercise.
A statement informing subject about how his/her anonymity will be guarded; i.e., that their
confidentiality will be protected by assigned code numbers, by limiting access to data, by locked
storage of files, etc.
Page 150
138
A statement that the subject's participation is voluntary, and that his/her refusal to participate will
involve no penalty or loss benefits to which the subject is otherwise entitled, and that the subject may
discontinue participation at any time without penalty or loss of benefits to which the subject is
otherwise entitled.
A disclaimer, if applicable, regarding the use of the Internet to collect data.
For research involving more than minimal risk, an explanation regarding the availability of any
compensation or any medical treatments if injury occurs (if applicable, see OHRP Reports).
If written informed consent is required, a place for the subject to sign and date the form and a
statement that a copy of the signed consent form will be given to the subject for his/her records.
If the subject is a minor, a statement of parental responsibility in consenting to the child's participation
in the study with a place for the parent to sign and date the form in addition to the participant's
signature.
The name, address, and telephone number of the principal investigator of the research project, and
his/her affiliation with Baylor University. If the principal investigator is a graduate student, the name
and telephone number of the faculty advisor is also required.
A statement informing subject that inquiries regarding his/her rights as a subject, or any other aspect of
the research as it relates to his/her participation as a subject, can be directed to Baylor's University
Committee for Protection of Human Subjects in Research.
Part 5: Research Instrument(s)
Please upload any non-standard, newly developed interview or questionnaire
instrument (one that has not been previously published) that will be used
also
Upload as appendices any other information pertinent to the proposal, such as
consent letters from participating agencies, etc.
IMPORTANT:
You must share your proposal with your Faculty Advisor and Department Chair
using the “Share this Project” feature in IRBnet. If your Faculty Advisor or
Department Chair is not listed as an IRBnet user, contact them and have them
register with IRBnet so you can share your project with them. Your Faculty
Advisor and Department Chair must sign your project within IRBnet before
submitting the proposal to the IRB.
Page 151
139
APPENDIX C
Waiver of Informed Consent
Informed Consent Form
Title of Research: Using the Health Belief Model to understand cholesterol
screenings in rural populations in central Texas.
Principal Investigator: Tiffany Rose. Graduate Teaching Assistant in the
Department of Health, Human Performance, & Recreation
housed within the School of Education, at Baylor
University.
Faculty Principal Investigator: Dr. M. Renée Umstattd Meyer. Assistant Professor in the
Department of Health, Human Performance, & Recreation
housed within the School of Education, at Baylor
University.
Sponsor: N/A
Thank you for showing an interest in being a part of this survey. Before you decide to be a part of this project, it’s important that we explain the process clearly to you.
Explanation of Procedures:
Researchers at Baylor University are trying to be aware of the use of cholesterol
screenings for cardiovascular disease in rural areas. The research results from this project
will be used to help plan future health programs for the areas of Holland, Bartlett, and
Granger, as well as other rural areas in the U.S. What will you be required to do?
The study is about people living in rural areas. You are being asked to be a part of a one-
time survey. The survey will be given during the year through the Holland and Granger
School Districts. Surveys will also be distributed through local churches, and through the
participants in the Heart Aware Program, which will reach members of the Holland,
Granger, and Bartlett communities. The survey will take around 20-25 minutes to finish
and you will be asked questions about your chance of illness, pros and cons of using
screenings, views about screenings and other health questions. Being a part of this survey
is not required and consent is given by signing and turning in this informed consent form,
or by turning in a finished survey.
Risks:
One risk of being in this study is that you might not like to answer questions about your
health status, or talk about your views about your healthcare. Any answers you give on
this survey will be kept private and secret.
Page 152
140
Benefits:
By being in this study, you will be entered into a drawing for the chance to win one of
ten prizes: either a prize worth $100 or a check for $100. You will also learn more about
your area’s views of cholesterol screenings. You can also benefit by knowing that being a
part of this study helps us learn more about rural areas, which will help in the Heart
Aware Program and the creation of other future programs in your area. Rights of people taking part in the research study:
The information you provide will be kept secret and private. Information from this study
will only be used by the research staff or to contact you if you win the drawing. All data
will be kept using password protected computers, websites, and/or locked filing cabinets.
Please know that being a part of this survey is not required. If you choose not to take
part in the study, there will not be a penalty. And, you may quit the study at any time. If
you choose not to be a part of this study, the information that has been told to us will be
kept secret and private.
The Baylor University Institutional Review Board (a group that looks out for the fair and
just treatment of people in research studies) will review study records from time to time.
This is to be sure that people in research studies are being treated fairly and that the study
is being carried out as planned.
Cost:
The only cost to you is the time you will spend completing the survey.
Payment for being a part of the Research
If you choose to be a part of this study, your name will be put in a drawing for ten prizes:
either one of the following prizes worth $100 or a $100 check. There will only be one
entry per adult who fills out a survey. Your phone number and email (if you have one)
are needed below so we may contact you if you win the drawing. Your phone number
and email will only be used if you win the drawing and will be kept private and not
shared with anyone. If you are contacted about winning the drawing, you will have 24
hours to respond.
Drawing options include:
Colby 7” LCD Portable DVD/CD/MP3 Player
Archos 35 HD Vision 8GB MP4 Player
Colby Electronics 2.4” 16GB Video MP3 Player
Sunbeam Heritage Series Black 4.6 Qt Mixmaster Stand Mixer
Keurig B31 Mini Plus Personal Coffee Brewer
Breadman Bread maker
Oster Extra-Large Convection Toaster Oven
Questions or Problems:
For more information about this research you should contact Dr. M. Renée Umstattd
Meyer at (254)710-4029; One Bear Place #97313, Waco, Texas 76798;
[email protected] . Dr. Umstattd Meyer is an Assistant Professor of Health
Education in the Department of Health, Human Performance, & Recreation at Baylor
Page 153
141
University. If you have any questions about your rights as a research participant, you
may contact Baylor's University Committee for Protection of Human Subjects in
Research. The chairman is Dr. Michael Sherr, One Bear Place # 97320 Waco, TX
76798-7320, (254)710-4483.
STATEMENT OF CONSENT
I have read this form. I know what it says and freely agree to take part in the study based
on what is said in this form. I will have a copy of this form to keep for my records.
Signature: Date:
------------------------------------------------------------------------------------------------------------
------------------------------
Printed Name:_______________________________________________
*Email: _____________________________________________________
*Phone number: ______________________________________________
(*This will only be used to contact people chosen to receive gift cards during the
drawing.)
Page 154
142
BIBLIOGRAPHY
Ali, N. (2002). Prediction of coronary heart disease prevention behaviors in women: A
test of the health belief model. Women & Health, 35(1), 83-96.
American Heart Association (AHA), (2011). Cholesterol Q&A. Retrieved from
http://www.heart.org/HEARTORG/GettingHealthy/FatsAndOils/Fats101/Cholest
erol-Q-A_UCM_304898_Article.jsp
Ammerman, A., Keyserling, T., Atwood, J., Hosking, J., Zayed, H. & Krasny, C. (2003).
A randomized controlled trial of a public health nurse directed treatment program
for rural patients with high blood cholesterol. Preventive Medicine, 36, 340-351.
doi:10.1016/S0091-7435(02)00042-7
Anderson, R., Camacho, F., Iaconi, A., Tegeler, C., & Balkrishnan, R. (2011). Enhancing
the effectiveness of community stroke risk screening: A randomized controlled
trial. Journal of Stroke and Cerebrovascular Diseases, 20(4), 330-335.
Bandura, A. (1977). Self-Efficacy: The Exercise of Control. New York: W.H. Freeman.
Becker, M.H. (1974). The health belief model and personal health behaviors. Health
Education Monographs, 2, 324-473.
Bekwelem, W., VanWormer, J., Boucher, J., & Pereira, R. (2011). Cardiovascular risk
factor screening satisfaction in the heart of new ulm project. CM&R Rapid
Release, doi:10.3121/cmr.2011.1011
Burke, L., Dunbar-Jacob, J., Sereika, S., & Ewart, C.(2003). Development and testing of
the cholesterol-lowering diet self-efficacy scale. European Journal of
Cardiovascular Nursing, 2, 265-273. doi: 10.1016/S1474-515(03)00093-8
Casey, M.M., Call, K.T., & Klinger, J.M. (2001). Are rural residents likely to obtain
recommended preventative health services? American Journal of Preventative
Health, 21(3), 182-188. Retrieved from Elsevier.
Center for Disease Control and Prevention (CDC). FastStats: Leading Causes of
Death. Atlanta, Georgia: U.S. Department of Health and Human Services, Centers
for Disease Control and Prevention, 2007.
Centers for Disease Control and Prevention (CDC). Behavioral Risk Factor Surveillance
System Survey Questionnaire. Atlanta, Georgia: U.S. Department of Health and
Human Services, Centers for Disease Control and Prevention, 2011.
Page 155
143
Champion, V. (1984). Instrument development for health belief model constructs.
Advances in Nursing Sciences, 6(4), 73-85.
Champion, V. (1987). The relationship of breast self-examination to health belief model
variables. Research in Nursing & Health, 10, 375-382.
Champion V.L. & Menton, U. (1997). Predicting mammography and breast self-
examination in African American women. Cancer Nursing, 20(5), 315-322.
Champion, V.L., Monahan, P.O., Springston, J.K., Russell, K., Zollinger, T.W., Saywell,
R.M., & Maraj, M. (2008). Measureing mammography and breast cancer beliefs
in African American women. Journal of Health Psychology, 13(6), 827-837.
doi:10.11.77/1359105308093867
Champion, V. L. & Skinner, C.S. (2008). The health belief model: explaining health
behavior through expectancies. In: Glanz, K., Rimer, B.K., & Viswanath, K. (Ed.).
Health Behavior and Health Education. San Francisco, California: Jossey-
Bass.
Costanza.M., Luckmann, R., Stoddard, A., Avrunin, J., White, M.J., Stark, J., Clemow,
L., & Rosal, M. (2005). Applying a stage model of behavior change to colon
cancer screening. Preventive Medicine, 41, 707-719.
doi:10.1016/j.ypmed.2004.12.013
Costello, A.B. & Osborne, J.W. (2005). Best practices in exploratory factor analysis:
Four recommendations for getting the most from you analysis. Practical
Assessment, Research and Evaluation, 10(7), 1-9.
Cromwell, W. (2007). High-density lipoprotein associations with coronary heart disease:
Does measurement of cholesterol content give the best result? Journal of Clinical
Lipidology, 1, 57-64, doi:10.1016/j.jacl.2007.01.002
Deskins, S., Harris, C., Bradlyn, A., Cottrell, L., Coffman, J., Olexa, J. & Neal, W.
(2006). Preventive Care in Appalachia: Use of the theory of planned behavior to
identify barriers to participation in cholesterol screenings among west Virginians.
Journal of Rural Health, 22(4): 367-374.
DeVellis, R. F. (2003). Scale Development: Theory and Applications. Thousand Oaks,
California: Sage Publishing.
Duffett-Leger,L., Letourneau, N., & Croll, J. (2008). Cervical cancer screening practices
among university women. JOGNN, 37, 572-581. doi:10.1111/j.1552-
6909.2008.00276.x
Page 156
144
DuHamel, K., Li, Y., Rakowski, W., Samimi, P. & Jandorf, L. (2011). Validity of the
process of change for colorectal cancer screening among African Americans.
Annals of Behavioral Medicine, 41, 271-283. doi:10.1007/s12160-010-9250-0
Fernandez, M., Diamond, P., Rakowski, W., Gonzales, A., Tortolero-Luna, G., Williams,
J. & Morales-Campos, D. (2009). Development and validation of a cervical
cancer screening self-efficacy scale for low-income mexican American women.
Cancer Epidemiology, Biomarkers & Prevention, 18, 866-875. doi:10.1158/1055-
9965.EPI-07-2950
Ferrer, R., Hall, K., Portnoy, D., Ling, B., Han, P. & Klein, W. (2011). Relationships
among health perceptions vary depending of stage of readiness for colorectal
cancer screening. Health Psychology, 30(5), 525-535. doi: 10.1037//a0023583
Gans, K., Burkholder, G., Risica, P., & Lasater, T. (2003). Baseline fat-related dietary
behaviors of white, Hispanic, and black participants in a cholesterol screening and
education project in New England. Journal of the American Dietetic Association,
103(6), 699-706. doi:10.1053/jada.2003.50135
Garson, D. G. (2008). Factor Analysis: Statnotes. Retrieved March 22, 2008, from North
Carolina State University Public Administration Program,
http://www2.chass.ncsu.edu/garson/pa765/factor.htm.
Goins, R., Williams, K., Carter, M., Spencer, S., & Solovieva, T. (2005). Perceived
barriers to health care access among rural older adults: A qualitative study. The
Journal of Rural Health 21(3), 206-213.
Gray, M. (1990). Factors related to practice of breast self-examination in rural women.
Cancer Nursing, 13(2), 101-107.
Grispen, J.E., Ronda, G., Dinant, G.J., de Vries, N.K., & van der Weijden, T. (2011). To
test of not to test: a cross-sectional survey of the psychosocial determinants of
self-testing for cholesterol, glucose, and HIV. BMC Public Health, 11, 112-122.
Guibert, R., Leduc, N., Fournier, P., & Tetreault, H. (1999). What factors determine
whether individuals found to have hypercholesterolemia at mass screening accept
advice to visit their physician. Public Health, 113, 105-110.
Guvenc, G., Akyuz, A., & Acikel, C. (2010). Health belief model scale for cervical
cancer and pap smear test: psychometric testing. Journal of Advanced Nursing,
67(2), 428-437. doi:10.1111/j.1365-2648.2010.05450.x
Hamner, J. & Wilder, B. (2010). Perceptions and predictions of cardiovascular disease of
Alabama women in a rural county. Applied Nursing Research, 23, 80-85.
doi:10.1016/j.apnr.2008.06.004
Page 157
145
Hochbaum, G.M. (1958). Public participation in medical screening programs: A socio-
psychological study. Washington, D.C.: U.S. Dept. of Health, Education and
Welfare.
Hogenmiller, J., Atwood, J., Lindsey, A., Johnson, D., Hertzog, M., & Scott Jr, J. (2007).
Self-efficacy scale for pap smear screening participation in sheltered women.
Nursing Research, 56(6), 369-377.
Homko, C., Santamore, W., Zamora, L., Shirk, G., Gaughan, J., Cross, R., Kashem, A.,
Petersen, S., & Bove, A. (2008). Cardiovascular disease knowledge and risk
perception among underserved individuals at increased risk of cardiovascular
disease. Journal of Cardiovascular Nursing, 23(4), 332-337.
Janz, N.K. & Becker, M.H. (1984). The health belief model: A decade later. Health
Education Quarterly, 11(1), 1-47.
Krummel, D., Humphries, D., & Tessaro, I. (2002). Focus groups on cardiovascular
health in rural women: Implications for practice. Journal of Nutrition Education
and Behavior, 34(1), 38-45.
Lu, H.C., Huang, K.C., & Chu, C.J. (2010). Influencing factors of healthcare-seeking
behaviors in Taiwanese patients with hepatitis C. Gastroenterology Nursing,
33(6), 414-420.
Mason, T. & White, K. (2008). Applying an extended model of the theory of planned
behavior to breast self-examination. Journal of Health Psychology, 13, 946-955.
doi:10.1177/1359105308095069
Mayo Clinic. High Blood Pressure (hypertension). Diseases and Conditions. 2011.
http://www.mayoclinic.com/health/high-blood-pressure/DS00100
Montaño, D. & Kasprzyk, D. Theory of reasoned action, theory of planned behavior, and
the integrated behavioral model. In: Glanz, K., Rimer, B.K., & Viswanath, K.
(Ed.). (2008). Health Behavior and Health Education. San Francisco, California:
Jossey-Bass.
Murphy, K. & Myors, B. (2004). Statistical Power Analysis: A Simple and General
Model for Traditional and Modern Hypothesis Tests. Mahwah, New Jersey:
Lawrence Erlbaum Associates, Publishers.
Natarajan, S., Glick, H., Criqui, M., Horowitz, D., Lipsitz, S. & Kinosian, B. (2003).
Cholesterol measures to identify and treat individuals at risk for coronary heart
disease. American Journal of Preventive Medicine, 25(1), 50-57.
doi:10.1016/S0749-3797(03)00092-8
Page 158
146
Oliver, J.S., Grindel, C.G., DeCoster, J., Ford, C.D. & Martin, M.Y. (2011). Benefits,
barriers, sources of influence and prostate cancer screening among rural men.
Public Health Nursing, 28(6), 515-522.
Parsa, P., Kandiah, M., Mohd Nasir, M.T., Hejar, A.R., & Nor Afiah, M.Z. (2008).
Reliability and validity of Champion’s health belief model scale for breast cancer
screening among Malaysian women. Singapore Medical Journal, 49(11) 897-903.
Pennsylvania General Assembly, (2005). Pennsylvania Rural Health Services. Rural by
the numbers. RuralPA-CPS. Retrieved from:
www.rural.palegislature.us/news0905.html
Prochaska, J., Redding, C., & Evers, K. The transtheoretical model and stages of
change. In: Glanz, K., Rimer, B.K., & Viswanath, K. (Ed.). (2008). Health
Behavior and Health Education. San Francisco, California: Jossey-Bass.
Rodondi, N., Bovet, P., Hayoz, D., & Cornuz, J. (2008). The impact of CAROtid plaque
screening on smoking (CAROSS) cessation and control of other cardiovascular
risk factors: Rationale and design of a randomized control trial. Contemporary
Clinical Trials, 29, 767-773. doi:10.1016/j.cct.2008.03.001
Sanossian, N., Saver, J., Kim, D., Razinia, T., & Ovbiagele, B. (2006). Do high-density
lipoprotein cholesterol levels influence stroke severity? Journal of Stroke and
Cerebrovascular Disease, 15(5), 187-189.
doi:10.1016/j.jstrokecerebrovaSDis.2006.05.003
Seninger & Bainbridge (2004). Montana Disability & Health Program Montana providers
of services to adults with developmental disabilities: Urban/rural characteristics,
and direct service staff turnover rates and replacement costs. Rural Disability and
Rehabilitation. Research Progress Report #25. Retrieved from:
mtdh.ruralinstitute.umt.edu/publications/MontanaProviders.html
Sieverding, M., Matterne, U., & Ciccarello, L. (2010). What role do social norms play in
the context of men’s cancer screening intention and behavior? Application of an
extended theory of planned behavior. Health Psychology, 29(1), 72-81.
doi:10.1037/a0016941
Sol, B.G., van der Graaf, Y., van Petersen, R., & Visseren F.L. (2010). The effect of self-
efficacy on cardiovascular lifestyles. European Journal Cardiovascular Nursing,
10(3), 180-186. doi: 10.1016/j.ejcnurse.2010.06.005.
Spoon, M., Benedict, J. & Buonamici, A. (1997). Using community health fairs to target
high-risk clientele. Journal of Nutrition Education, 29, 356-358.
Page 159
147
Stevens, J. (2002). Confirmatory and exploratory factor analysis. Applied Multivariate
Statistics for the Social Sciences. 4th
ed. Mahwah, NJ: Lawrence Erlbaum
Associates, Inc, 358- 454.
Strickland, J., & Strickland, D. (1996). Barriers to preventive health services for minority
households in rural south. The Journal of Rural Health, 12(3), 206-217.
doi:10.1111/j.17480361.1996.tb00795.x
Stimpson JP, & Wilson FA. Cholesterol screening by marital status and sex in the United
States. Prev Chronic Dis 2009;6(2).
http://www.cdc.gov/pcd/issues/2009/apr/08_0102.htm. Accessed November 27,
2011.
Sullivan, D. (2002). Screening for cardiovascular disease with cholesterol. International
Journal of Clinica Chimica Acta, 315, 49-60.
Sullivan, K., White, K., Young, R., Chang, A., Roos, C., & Scott, C. (2008). Predictors of
intention to reduce stroke risk among people at risk of stroke: An application of
an extended health belief model. Rehabilitation psychology, 53(4), 505-512. doi:
10.1037/a0013359
Tabachnick, B.G. & Fidell, L.S. (2001). Using Multivariate Statistics. (4th
ed) Allyn and
Bacon: Boston, MA.
Tavafian, S., Hasani, L., Aghamolaei, T., Zare, S., & Gregory, D. (2009). Prediction of
breast self-examination in a sample of Iranian women: an application of the
Health Belief Model. BMC Women’s Health, 9(37), doi:10.1186/1472-6874-9-37
Tovar, E.G., Rayens, M.K., Clark, M., & Nguyen, H. (2010). Development and
psychometric testing of the health beliefs related to cardiovascular disease scale:
preliminary findings. Journal of Advanced Nursing 66(12), 2772-2784.
doi:10.1111/j.1365-2648.2010.05443.x
Trotta, P. (1980). Breast self-examination factors influencing compliance. Oncology
Nursing Forum, 7, 13-17.
Tu, S., Yasui, Y., Kuniyuki, A., Schwartz, S., Jackson, C., & Taylor, V. (2002). Breast
cancer screening : stages of adoption among Cambodian American women.
Cancer Detection and Prevention, 26(1), 33-41.
Tung, W., Lu, M., & Cook, D. (2010). Cervical cancer screening among Taiwanese
women: A transtheoretical approach. Oncology Nursing Forum, 37(4), 288-294.
Wagner, C. Semmler, C. Good, A., & Wardel, J. (2009). Health literacy and self-efficacy
for participating in colorectal cancer screening: The role of information
processing. Patient Education and Counseling, 75, 352-357.
Page 160
148
Weinert, C., & Long, K. (1990). Rural families and health care: Refining the knowledge
base. In D. Unger & M. Sussman (Eds.) Families in community settings:
Interdisciplinary perspectives. Binghamton, NY: Hawthorne.
Weinstein, N., Sandman, P., & Blalock, S. The precaution adoption process model. In:
Glanz, K., Rimer, B.K., & Viswanath, K. (Ed.). (2008). Health
Behavior and Health Education. San Francisco, California: Jossey-Bass.
Xu, J., Kochanek, K., Murphy, S. & Tejada-Verda, B. (2010). Deaths: Final data for 2007.
National Vital Statistics Report, 58(19), 1-135.
Zuniga, M.; Anderson, D., & Alexander, K. (2003). Heart Disease and Stroke in Rural
America: A Literature Review. Rural Healthy People 2010: A companion
document to Healthy People 2010. Volume 2. College Station, TX: The Texas
A&M University System Health Science Center, School of Rural Public Health,
Southwest Rural Health Research Center.