64
Using the ITU BS.1770-2 and CBS Loudness Meters to Measure Automatic Loudness Controller Performance
Using the ITU BS.1770-2 and
CBS Loudness Meters to
Measure Automatic Loudness
Controller Performance

Experience has shown that the
mass television audience wants
two things from television audio:
• Dialog should be comfortably intelligible.
• Commercials should not be irritatingly loud. – The CALM Act, which applies to U.S. broadcasters, DBS
providers, and cable systems transmitting digital audio, forbids commercials from being irritatingly loud compared to program material.
– The FCC implemented the CALM Act via Rule FCC-11-182, which incorporates ATSC Recommended Practice A/85 and any future improvements and revisions to it.

Target Loudness
• To achieve consistent loudness from one source to the next and one channel to the next, the integrated loudness of each program element must be equal to a target loudness that is known to the home receiver.
• In broadcast systems that use Dolby Digital® audio, the value of “dialnorm” in the metadata must be equal to the target loudness.
• “Golden Rule” (per FCC 11-182A): The dialnorm value must correctly identify the loudness of the content it accompanies in order to prevent excessive loudness variation during content transitions on a channel (e.g., TV program to commercial) or when changing channels.

• ITU-R standard BS.1770:
– BS.1770 defines a standardized loudness meter that permits the
integrated loudness of a given program segment to be measured.
– The goal for each program segments is to make its BS.1770 integrated loudness equal to the target loudness.
– Because the loudness is integrated over the entire duration of a program segment, this goal still supports a mixing style that creates a wide dynamic range.
– The target loudness’ unit of measure is LKFS or LUFS, which are the same except for terminology.
• LK is specified in ATSC Recommendation A/85.
• LU is specified in EBU Recommendation R 128 and in ITU-R BS.1770.
Target Loudness

There are two main approaches to
CALM Act compliance:
• File-based static loudness adjustment based on long-term BS.1770 loudness measurements of a given file’s integrated loudness.
• On-line real-time loudness control like that provided by processors that have been used for decades in analog TV broadcasts.

On-line loudness control
• On-line loudness control is implemented by hardware that is inserted in the audio feed before the on-air transmitter’s Dolby Digital® encoder.
• Identifies and controls excessive loudness in real time.
• Upsides: – Can be very simple to implement and use: “Set it and forget it.”
– Can eliminate short-term loudness bursts that would otherwise annoy consumers, particularly family, roommates, and neighbors who are not watching the program in question.
– Usually makes transitions between program elements smoother than does file-based loudness control.
• Downsides: – Reduces program dynamic range.
– Ideally, processing should be readily bypassable on-air to accommodate upstream material (like network feeds) whose loudness is certified by the provider to comply with FCC 11-182. (This is the FCC’s “Safe Harbor” provision.) However, this refinement complicates master control operation.

Subjective loudness metering and
automatic on-line loudness control
have a long history. • The first on-line automatic loudness control technology was developed by CBS
Laboratories in the mid-1960s in response to a Federal Communications Commission study regarding audience complaints about objectionably loud commercials.
• Bronwyn Jones and Emil Torick at CBS Technology Center revisited this work in 1981 to improve loudness meter accuracy. This work was published in the SMPTE Journal.
• In 1983, the FCC Office of Science and Technology tested the J&T loudness controller, concluding that it was likely to reduce complaints caused by loud commercials.
• In 2005, Orban made substantial improvements to the J&T loudness controller gain computer sidechain to:
– improve smoothness
– make operation more audibly subtle
– produce more consistent dialog loudness, even when the dialog is mixed with music and/or effects

Ideally, a loudness meter should
take into account:
• Frequency Dependence: The ear’s perception of
loudness is strongly dependent on frequency.

• Loudness Addition: For a given total sound power, the sound becomes louder as the power is spread over a larger number of psychoacoustic critical bands (about 1/3-octave).
• Loudness Integration over Time: A given amount of acoustic power sounds progressively louder until its duration exceeds about 200 milliseconds, at which point no further loudness increase is heard.
Ideally, a loudness meter should
take into account:

The BS.1770 meter takes only
frequency dependence into
account:
•The BS.1770 meter is a wideband time-integrated
power meter preceded by a frequency weighting filter.
•The BS.1770 meter does not model loudness
summation or the short-term loudness integration
time constants (~200 ms) of human hearing.

BS.1770 Loudness Meter Block
Diagram

BS.1770 Loudness Meter Pre-filter

BS.1770 Loudness Meter RLB
Filter
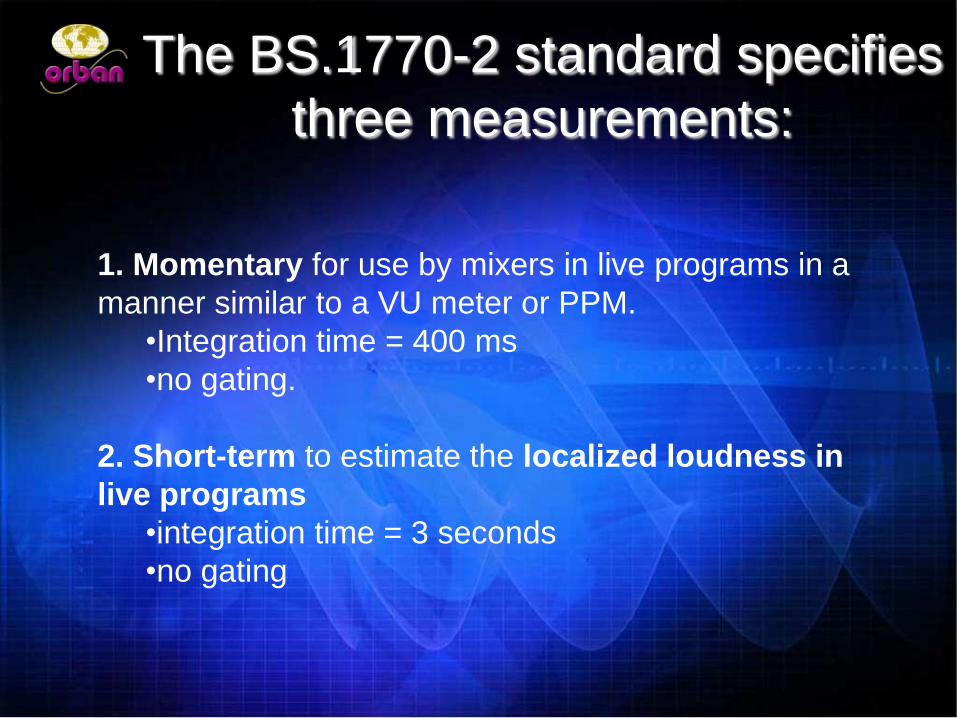
The BS.1770-2 standard specifies
three measurements:
1. Momentary for use by mixers in live programs in a
manner similar to a VU meter or PPM.
•Integration time = 400 ms
•no gating.
2. Short-term to estimate the localized loudness in
live programs
•integration time = 3 seconds
•no gating

3. Integrated for measurement of
compete program segments
•Integration time = 3 seconds or longer, ideally
including the entire program segment.
•Gated to ignore program material more than 10 dB
quieter than the loudest parts of the program, as
measured with the “momentary” integration time of
400 ms., where measurements are overlapped by
75% so that a new 400 ms. measurement starts
every 100 ms.
The BS.1770-2 standard specifies
three measurements

The BS.1770-2 meter disagrees with
human listeners by up to 6 dB
Figure 13, BS.1770-2 standard

Mechanically relying on the
BS.1770 meter has caused
complaints in the Hollywood
production community
For example…

“When I said [BS.1770] loudness meters lie, I mean that what sounds equally
loud to my ear may not be the same to the meter. For instance, a section of
narration without music might measure something like –25 or –26 LKFS if there
are lots of spaces. A section of archived sound, like the calls of a sports game
commentator with crowd roaring, will easily read –22 or even higher, for what
sounds like the same volume to my ear. So, IF there is a loudness range
expectation that will be part of a Quality Control measurement, then I am forced to
mix badly and make the meters read correctly, or I need to be prepared to deal
with the consequences later.
“By the way, I have had this exact problem be the reason a mix was bounced by
QC. I had kept the volume down, to make the meter read within the allowed
range (this was a spec that said all sections of their show had to be within the
same narrow range; I did not have the luxury of measuring only the full show
duration). The client complained about it and rightly so. We made the mix
more correct and got tapped by the QC report. So, as I said, the meter lies. If
one has the added burden of narrow loudness range, as I have had in the past (and
that I fear will continue in the future), one finds himself in a quandary.”
— “Postman,” AVID board, 3-08-2011
http://duc.avid.com/archive/index.php

“I would like to back up Postman on faulty meter readings with this
example:
“I did a –24 piece for Fox that was wall to wall singing and music
for two minutes. Because of the overall loudness and continued full
audio signal I had to bring it down and when it aired it was 3 db
too quiet even though it matched the magic LKFS number. I
have no problem using these meters or meeting specs but they
are faulty.”
— “wheresmyfroggy,” AVID board, 3-28-2011

What to Do?
Take ATSC A/85’s prime directive seriously:
•“Because loudness is a subjective phenomenon,
human hearing is the best judge of loudness.”
•Relying solely on BS.1770 without listening is a recipe
for substandard source-to-source consistency:
•Dense material will often be more than 3 LK
quieter than unadorned dialog.
•Dialog levels will vary depending on the amount of
underscoring and/or effects in the track.

J&T Loudness Meter Technology:
A more complete psychoacoustic
model compared to BS.1770
• Loudness Addition: The meter first divides the signal into eight frequency bands and applies each band to a rectifier followed by a fast averaging, which mimics the “instantaneous” loudness integration time of human hearing.
• Frequency Dependence: The averaged outputs of the bands are summed with unequal gains that mimic the frequency dependence of the ear, as determined by experiments with listeners using octave-band noise, heard on loudspeakers in a room typical of a home listening environment.
• Loudness Integration in Time: The sum of the smoothed filter outputs is applied to a filter with an integration time of approximately 200 ms. This makes the J&T a “short-term” or “momentary” loudness meter.
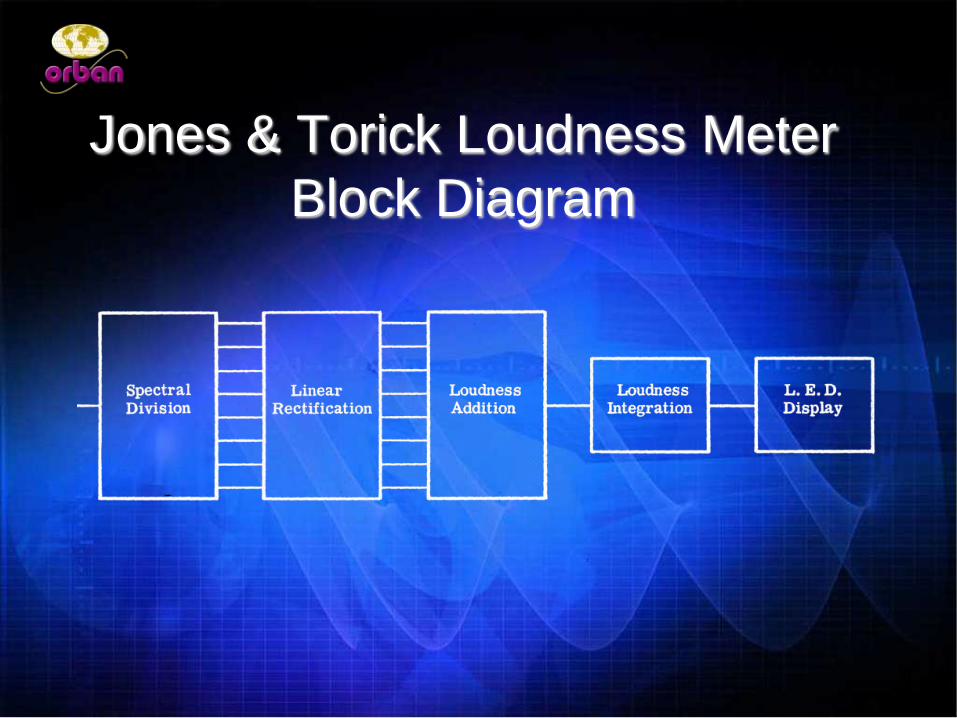
Jones & Torick Loudness Meter
Block Diagram

J&T Loudness Meter Filterbank

J&T Filterbank Curves &
Summation

Extension of the J&T Meter to
Multichannel Audio
• Each audio channel is applied to its own filterbank.
• The output powers of corresponding filters in each audio channel are summed before being applied to the “instantaneous” time constant.
• Summing the output powers simulates how the ear perceives the overall loudness of a sound field in the listening room. This is consistent with the technique that was used to extend BS.1770 to multichannel audio.

Extension of the J&T Meter to
Long-Term Loudness
Measurement Two long-term measurement strategies are shown in this presentation:
1. “J&T Maximum”: The highest indication of the meter in a 10-second time window is logged and plotted.
2. “J&T Long-Term”: The average of the peak indications of the meter over a 10-second period is logged and plotted. The average is performed before dB conversion. All peak indications within the period are weighted equally with the following exceptions:
– If the maximum peak in the window is more than 3 dB higher than the second
highest peak, it is discarded.
– All peaks more than 6 dB below the maximum (or second-to-maximum, if the maximum peak was discarded) are also discarded.
– This strategy emphasizes the highest indications of the meter within the measurement window. It was first published by Orban in 2008 and is similar in concept to the gating technique later added to BS.1770 in the BS.1770-2 revision.

Loudness Meter Accuracy
Limitations 1
• Loudness meter accuracy is inherently limited by the fact that human listeners disagree by several dB when asked to match the loudness of test program material with a reference tone or wideband noise. Different people perceive loudness differently.
• A loudness meter can only be calibrated for a fixed acoustic listening level because the equal-loudness curves show the ear’s sensitivity as a function of frequency to be level-dependent.

Loudness Meter Accuracy
Limitations 2
• The room acoustics and frequency response at the receiver are unpredictable, particularly at bass frequencies.
• These issues mean that automatic loudness measurement and control for broadcast will always be approximate.
• However, it is still important to minimize the average error by choosing a loudness meter that exhibits good correlation to the, average loudness as perceived by many listeners in aggregate.

Automatic Loudness Control
• Automatic loudness control must start with an objective reference: A loudness meter whose indications closely match subjective loudness as perceived by listeners.
• The listeners being tested should match the typical demographics of television viewers, in age and gender.
• Both the BS.1770 and J&T meters have been tested in this manner. – The BS.1770 meter exhibited a worst-case disagreement of more
than 5 dB with listeners.
– The J&T meter exhibited a worst-case disagreement of 3 dB with listeners, although a smaller set of program items was tested.

Automatic Loudness Control
• To make an automatic loudness controller, one can insert an loudness meter into a gain computer sidechain, where the sidechain produces gain reduction that is the inverse of the loudness meter’s output above a preset threshold.
• This topology is similar to a compressor except that the loudness meter is used instead of a simple RMS or weighted peak detector.

Automatic Loudness Control
• Sidechain ballistics are critical. Smooth-sounding loudness control cannot be achieved by using the same time constants as the loudness meter.
• The gain reduction may be wideband or multiband. Appropriate multiband design minimizes audible gain pumping.

Loudness Control in Practice
• Starting in 1981, the J&T loudness controller technology was licensed to several audio processor manufacturers.
• Thousands of processors using this technology have been employed on-air in television stations throughout the world. Millions of program hours have been processed.
• Experience has shown that using this technology significantly reduces listener complaints caused by loud commercials.

Automatic Loudness Controller
Program Context Limitations • An automatic loudness controller operates with reference to an absolute
subjective loudness threshold that does not adapt to program context as well as a human mixer.
• For example, if there is a transition between very quiet program material (like footfalls through rustling leaves or quiet underscoring) and a commercial, the commercial may still seem offensively loud even though the loudness controller is controlling its loudness correctly with reference to other sounds that reach full-scale loudness. For this reason, mixers have learned to begin and end program elements with “bumpers” that are intended to be at the same loudness as previous or succeeding commercials and other non-program material.
• While automatic speech/non-speech discrimination can help a loudness controller understand context, it cannot deal with all situations (like the examples above, where adjacent elements are both “non-speech”).

Loudness Metering for This
Presentation
•The free Orban
Loudness Meter
V.2.0 measured
loudness and
logged the results.
www.orban.com/meter

Loudness Measurements
• The meter readings were logged every 10 seconds.
• The J&T Peak and Long-Term measurements used a 10-second observation window.
• The BS.1770-2 meter used a 10-second integration time.
• Logging data from the Orban Loudness Meter was used to create plots of loudness vs. time and loudness histograms. – A histogram approximates a Probability Density Function and
describes the relative likelihood for the measured loudness to take on a given value.

Loudness Measurements
• Program material is a 30-minute recording from the output of a network-affiliated TV station’s master control switcher.
• The material consists of a daytime drama (interspersed with commercials and programming promotions), followed by local news.

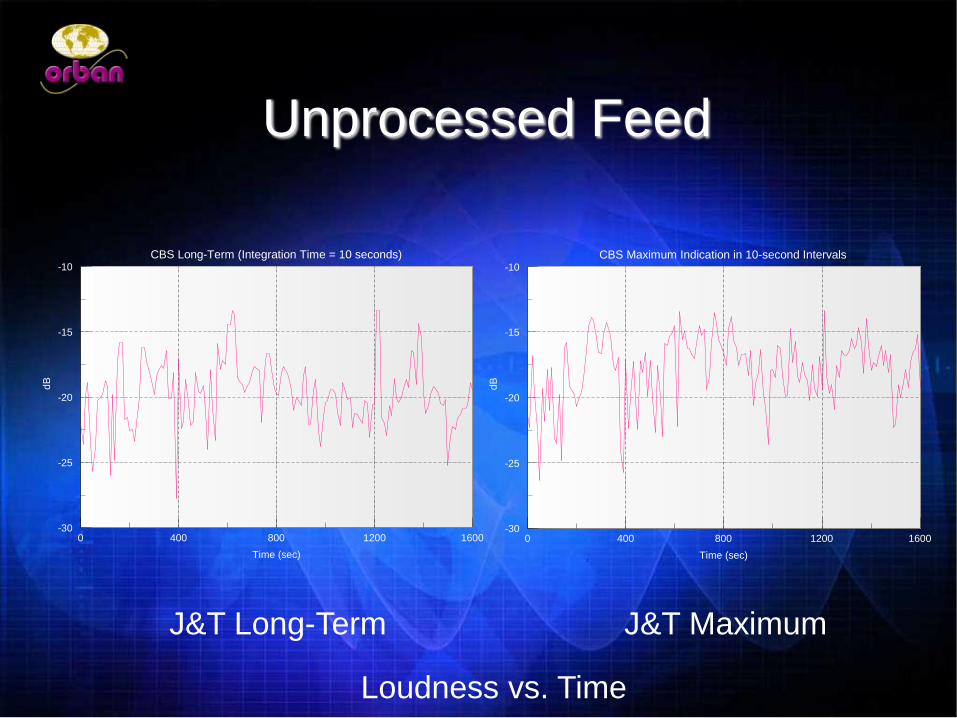
Loudness Measurements
• The following measurements show that the
loudness consistency of the unprocessed
feed is not satisfactory.
• Listening tests verify this. Program material
loudness is annoyingly inconsistent and
commercials are much louder than the
program material.
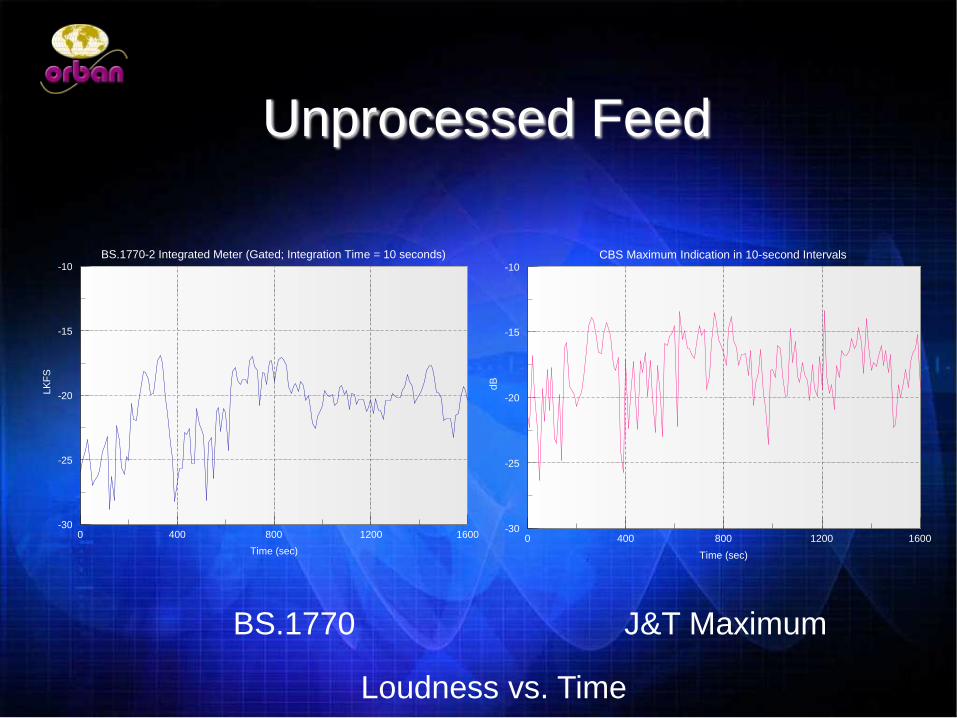
Unprocessed Feed
LKFS
-30 -25 -20 -15 -10
Nu
mb
er
of O
bse
rva
tion
s in a
Giv
en L
ou
dn
ess B
in
0
5
10
15
20
25
Histogram of BS.1770-2 Integrated Loudness in 10-second Integration Intervals
LKFS
-30 -25 -20 -15 -10
Nu
mb
er
of O
bse
rva
tion
s in a
Giv
en L
ou
dn
ess B
in
0
5
10
15
20
25
Histogram of BS.1770-2 Integrated Loudness in 10-second Integration Intervals
Time (sec)
0 400 800 1200 1600
LK
FS
-30
-25
-20
-15
-10
BS.1770-2 Integrated Meter (Gated; Integration Time = 10 seconds)
Time (sec)
0 400 800 1200 1600
dB
-30
-25
-20
-15
-10
CBS Maximum Indication in 10-second Intervals
BS.1770 J&T Maximum
Loudness vs. Time

Unprocessed Feed
LKFS
-30 -25 -20 -15 -10
Nu
mb
er
of O
bse
rva
tion
s in a
Giv
en L
ou
dn
ess B
in
0
5
10
15
20
25
Histogram of BS.1770-2 Integrated Loudness in 10-second Integration Intervals
LKFS
-30 -25 -20 -15 -10
Nu
mb
er
of O
bse
rva
tion
s in a
Giv
en L
ou
dn
ess B
in
0
5
10
15
20
25
Histogram of BS.1770-2 Integrated Loudness in 10-second Integration Intervals
Time (sec)
0 400 800 1200 1600
LK
FS
-30
-25
-20
-15
-10
BS.1770-2 Integrated Meter (Gated; Integration Time = 10 seconds)
Time (sec)
0 400 800 1200 1600
dB
-30
-25
-20
-15
-10
CBS Long-Term (Integration Time = 10 seconds)
BS.1770 J&T Long-Term
Loudness vs. Time
Unprocessed Feed
LKFS
-30 -25 -20 -15 -10
Nu
mb
er
of O
bse
rva
tion
s in a
Giv
en L
ou
dn
ess B
in
0
5
10
15
20
25
Histogram of BS.1770-2 Integrated Loudness in 10-second Integration Intervals
LKFS
-30 -25 -20 -15 -10
Nu
mb
er
of O
bse
rva
tion
s in a
Giv
en L
ou
dn
ess B
in
0
5
10
15
20
25
Histogram of BS.1770-2 Integrated Loudness in 10-second Integration Intervals
Time (sec)
0 400 800 1200 1600
dB
-30
-25
-20
-15
-10
CBS Maximum Indication in 10-second Intervals
Time (sec)
0 400 800 1200 1600
dB
-30
-25
-20
-15
-10
CBS Long-Term (Integration Time = 10 seconds)
J&T Maximum J&T Long-Term
Loudness vs. Time

Unprocessed Feed
dB
-30 -25 -20 -15 -10
Nu
mb
er
of O
bse
rva
tio
ns in a
Giv
en
Lo
ud
ness B
in
0
5
10
15
20
25
30
Histogram of CBS Long-Term in 10-second Periods
LKFS
-30 -25 -20 -15 -10
Nu
mb
er
of O
bse
rva
tion
s in a
Giv
en L
ou
dn
ess B
in
0
5
10
15
20
25
Histogram of BS.1770-2 Integrated Loudness in 10-second Integration Intervals
LKFS
-30 -25 -20 -15 -10
Nu
mb
er
of O
bse
rva
tion
s in a
Giv
en L
ou
dn
ess B
in
0
5
10
15
20
25
Histogram of BS.1770-2 Integrated Loudness in 10-second Integration Intervals
LKFS
-30 -25 -20 -15 -10
Nu
mb
er
of O
bse
rva
tion
s in a
Giv
en L
ou
dn
ess B
in
0
5
10
15
20
25
Histogram of BS.1770-2 Integrated Loudness in 10-second Integration Intervals
BS.1770 J&T Long-Term

Unprocessed Feed
LKFS
-30 -25 -20 -15 -10
Nu
mb
er
of O
bse
rva
tion
s in a
Giv
en L
ou
dn
ess B
in
0
5
10
15
20
25
Histogram of BS.1770-2 Integrated Loudness in 10-second Integration Intervals
LKFS
-30 -25 -20 -15 -10
Nu
mb
er
of O
bse
rva
tion
s in a
Giv
en L
ou
dn
ess B
in
0
5
10
15
20
25
Histogram of BS.1770-2 Integrated Loudness in 10-second Integration Intervals
LKFS
-30 -25 -20 -15 -10
Nu
mb
er
of O
bse
rva
tion
s in a
Giv
en L
ou
dn
ess B
in
0
5
10
15
20
25
Histogram of BS.1770-2 Integrated Loudness in 10-second Integration Intervals
dB
-30 -25 -20 -15 -10
Nu
mb
er
of O
bse
rva
tio
ns in a
Giv
en
Lo
ud
ness B
in
0
5
10
15
20
25
30
Histogram of CBS Maximum Peak in 10-second Periods
BS.1770 J&T Maximum

Unprocessed Feed
dB
-30 -25 -20 -15 -10
Nu
mb
er
of O
bse
rva
tio
ns in a
Giv
en
Lo
ud
ness B
in
0
5
10
15
20
25
30
Histogram of CBS Long-Term in 10-second Periods
LKFS
-30 -25 -20 -15 -10
Nu
mb
er
of O
bse
rva
tion
s in a
Giv
en L
ou
dn
ess B
in
0
5
10
15
20
25
Histogram of BS.1770-2 Integrated Loudness in 10-second Integration Intervals
LKFS
-30 -25 -20 -15 -10
Nu
mb
er
of O
bse
rva
tion
s in a
Giv
en L
ou
dn
ess B
in
0
5
10
15
20
25
Histogram of BS.1770-2 Integrated Loudness in 10-second Integration Intervals
dB
-30 -25 -20 -15 -10
Nu
mb
er
of O
bse
rva
tio
ns in a
Giv
en
Lo
ud
ness B
in
0
5
10
15
20
25
30
Histogram of CBS Maximum Peak in 10-second Periods
J&T Long-Term J&T Maximum

Loudness Controller for This
Presentation
• The on-line automatic loudness controller
used to prepare the audio samples was an
Orban Optimod 8685.

Loudness Controller
Simplified Block Diagram

Comparing On-Line Processing
Algorithms
• 2-Band compression: Does not control loudness well enough to avoid viewer annoyance in TV audio.
• 2-Band compression + Loudness Control: Loudness control that mostly preserves the spectral balance of the input.
• AGC + 5-Band compression + Loudness Control: Most effective loudness control that also prevents audible gain pumping caused by spectral gain intermodulation.

AGC+5-Band Compression +
Loudness Control
• Excessive loudness is often caused by large
amounts of midrange energy that is added in
production mixing to try to make the audio “pop.”
Commercials are notorious in this regard.
• Program material that has not been de-essed
can also cause objectionable loudness peaks.

AGC+5-Band Compression +
Loudness Control
• Slow AGC controls average levels applied to the 5-band compressor, preventing the compressor from unnaturally increasing audio density. Windowed AGC minimizes gain changes on inputs with well-controlled loudness while tracking fast changes quickly.
• 5-Band compression automatically re-equalizes the spectral balance to make the program more comfortable for the audience to hear – it tames harsh sibilance and dental-drill midrange.
• 5-Band compression is less likely than 2-Band compression to introduce pumping caused by spectral gain intermodulation.
• Loudness Controller typically applies 1 to 3 dB of gain reduction to speech; may apply up to 12 dB of GR to loudest commercials.

J&T Loudness-Controlled Program
LKFS
-30 -25 -20 -15 -10
Nu
mb
er
of O
bse
rva
tion
s in a
Giv
en L
ou
dn
ess B
in
0
5
10
15
20
25
Histogram of BS.1770-2 Integrated Loudness in 10-second Integration Intervals
LKFS
-30 -25 -20 -15 -10
Nu
mb
er
of O
bse
rva
tion
s in a
Giv
en L
ou
dn
ess B
in
0
5
10
15
20
25
Histogram of BS.1770-2 Integrated Loudness in 10-second Integration Intervals
Time (seconds)
0 400 800 1200 1600
LK
FS
-28
-27
-26
-25
-24
-23
-22
-21
-20
BS.1770-2 Integrated Meter (Gated; Integration Time = 10 seconds)
Time (seconds)
0 400 800 1200 1600
dB
-28
-27
-26
-25
-24
-23
-22
-21
-20
CBS Long-Term (Integration Time = 10 seconds)
BS.1770 J&T Long-Term
Loudness vs. Time

J&T Loudness-Controlled Program
LKFS
-30 -25 -20 -15 -10
Nu
mb
er
of O
bse
rva
tion
s in a
Giv
en L
ou
dn
ess B
in
0
5
10
15
20
25
Histogram of BS.1770-2 Integrated Loudness in 10-second Integration Intervals
LKFS
-30 -25 -20 -15 -10
Nu
mb
er
of O
bse
rva
tion
s in a
Giv
en L
ou
dn
ess B
in
0
5
10
15
20
25
Histogram of BS.1770-2 Integrated Loudness in 10-second Integration Intervals
Time (seconds)
0 400 800 1200 1600
LK
FS
-28
-27
-26
-25
-24
-23
-22
-21
-20
BS.1770-2 Integrated Meter (Gated; Integration Time = 10 seconds)
Time (seconds)
0 400 800 1200 1600
dB
-28
-27
-26
-25
-24
-23
-22
-21
-20
CBS Maximum Indication in 10-second Intervals
BS.1770 J&T Maximum
Loudness vs. Time

J&T Loudness-Controlled Program
LKFS
-30 -25 -20 -15 -10
Nu
mb
er
of O
bse
rva
tion
s in a
Giv
en L
ou
dn
ess B
in
0
5
10
15
20
25
Histogram of BS.1770-2 Integrated Loudness in 10-second Integration Intervals
LKFS
-30 -25 -20 -15 -10
Nu
mb
er
of O
bse
rva
tion
s in a
Giv
en L
ou
dn
ess B
in
0
5
10
15
20
25
Histogram of BS.1770-2 Integrated Loudness in 10-second Integration Intervals
Time (seconds)
0 400 800 1200 1600
dB
-28
-27
-26
-25
-24
-23
-22
-21
-20
CBS Maximum Indication in 10-second Intervals
Time (seconds)
0 400 800 1200 1600
dB
-28
-27
-26
-25
-24
-23
-22
-21
-20
CBS Long-Term (Integration Time = 10 seconds)
J&T Long-Term J&T Maximum
Loudness vs. Time

J&T Loudness-Controlled Program
LKFS
-30 -25 -20 -15 -10
Nu
mb
er
of O
bse
rva
tion
s in a
Giv
en L
ou
dn
ess B
in
0
5
10
15
20
25
Histogram of BS.1770-2 Integrated Loudness in 10-second Integration Intervals
LKFS
-30 -25 -20 -15 -10
Nu
mb
er
of O
bse
rva
tion
s in a
Giv
en L
ou
dn
ess B
in
0
5
10
15
20
25
Histogram of BS.1770-2 Integrated Loudness in 10-second Integration Intervals
LKFS
-28 -27 -26 -25 -24 -23 -22 -21 -20
Nu
mb
er
of O
bse
rva
tion
s in a
Giv
en L
ou
dn
ess B
in
0
5
10
15
20
25
30
Histogram of BS.1770-2 Integrated Loudness in 10-second Integration Intervals
dB
-28 -27 -26 -25 -24 -23 -22 -21 -20
Nu
mb
er
of O
bse
rva
tion
s in a
Giv
en L
ou
dn
ess B
in0
5
10
15
20
25
30Histogram of CBS Long-Term in 10-second Integration Periods
BS.1770 J&T Long-Term
Loudness Histogram

Loudness-Controlled Program
LKFS
-30 -25 -20 -15 -10
Nu
mb
er
of O
bse
rva
tion
s in a
Giv
en L
ou
dn
ess B
in
0
5
10
15
20
25
Histogram of BS.1770-2 Integrated Loudness in 10-second Integration Intervals
LKFS
-30 -25 -20 -15 -10
Nu
mb
er
of O
bse
rva
tion
s in a
Giv
en L
ou
dn
ess B
in
0
5
10
15
20
25
Histogram of BS.1770-2 Integrated Loudness in 10-second Integration Intervals
LKFS
-28 -27 -26 -25 -24 -23 -22 -21 -20
Nu
mb
er
of O
bse
rva
tion
s in a
Giv
en L
ou
dn
ess B
in
0
5
10
15
20
25
30
Histogram of BS.1770-2 Integrated Loudness in 10-second Integration Intervals
dB
-28 -27 -26 -25 -24 -23 -22 -21 -20N
um
ber
of O
bse
rva
tion
s in a
Giv
en L
ou
dn
ess B
in0
5
10
15
20
25
30
Histogram of CBS Maximum Peak in 10-second Periods
BS.1770 J&T Maximum
Loudness Histogram

Loudness-Controlled Program
LKFS
-30 -25 -20 -15 -10
Nu
mb
er
of O
bse
rva
tion
s in a
Giv
en L
ou
dn
ess B
in
0
5
10
15
20
25
Histogram of BS.1770-2 Integrated Loudness in 10-second Integration Intervals
LKFS
-30 -25 -20 -15 -10
Nu
mb
er
of O
bse
rva
tion
s in a
Giv
en L
ou
dn
ess B
in
0
5
10
15
20
25
Histogram of BS.1770-2 Integrated Loudness in 10-second Integration Intervals
dB
-28 -27 -26 -25 -24 -23 -22 -21 -20N
um
ber
of O
bse
rva
tion
s in a
Giv
en L
ou
dn
ess B
in0
5
10
15
20
25
30
Histogram of CBS Maximum Peak in 10-second Periods
dB
-28 -27 -26 -25 -24 -23 -22 -21 -20
Nu
mb
er
of O
bse
rva
tion
s in a
Giv
en L
ou
dn
ess B
in
0
5
10
15
20
25
30Histogram of CBS Long-Term in 10-second Integration Periods
J&T Long-Term J&T Maximum
Loudness Histogram

AGC+5-Band Compression + J&T
and BS.1770 Loudness Control • The Jones & Torick Loudness controller can be combined with a “BS.1770
Safety Limiter.”
• Located after the J&T Loudness Controller, the BS.1770 Safety Limiter constrains the reading of the BS.1770 meter to a preset threshold (0 to +6 LK) with respect to Dialnorm.
• The limiter’s 10-second attack time minimizes (but cannot eliminate) “loudness ducking” on material with low peak-to-RMS ratio. Loudness ducking is an inevitable side effect of relying on the BS.1770 algorithm to estimate the loudness of such material.
• The limiter’s 3-second release time prevents dialog that follows a loud commercial from being too quiet for an annoying length of time.
• The limiter’s asymmetrical attack and release times can sometimes cause the BS.1770 meter indication to overshoot. However, using symmetrical attack and release times would be perceptually inferior.

Comparison: BS.1770 Safety
Limiter Off and On
LKFS
-30 -25 -20 -15 -10
Nu
mb
er
of O
bse
rva
tion
s in a
Giv
en L
ou
dn
ess B
in
0
5
10
15
20
25
Histogram of BS.1770-2 Integrated Loudness in 10-second Integration Intervals
LKFS
-30 -25 -20 -15 -10
Nu
mb
er
of O
bse
rva
tion
s in a
Giv
en L
ou
dn
ess B
in
0
5
10
15
20
25
Histogram of BS.1770-2 Integrated Loudness in 10-second Integration Intervals
LKFS
-28 -27 -26 -25 -24 -23 -22 -21 -20
Nu
mb
er
of O
bse
rvatio
ns in
a G
iven
Lo
ud
ne
ss B
in
0
4
8
12
16
Histogram of BS.1770-2 MeasurementBS.1770 Limiter OFF
LKFS
-28 -27 -26 -25 -24 -23 -22 -21 -20
Nu
mb
er
of O
bse
rvatio
ns in
a G
iven
Lo
ud
ne
ss B
in
0
4
8
12
16
Histogram of BS.1770-2 MeasurementBS.1770 Limiter ON
BS.1770-2 Meter with 10-second Integration Time
Loudness Histogram

Comparison: BS.1770 Safety
Limiter Off and On
LKFS
-30 -25 -20 -15 -10
Nu
mb
er
of O
bse
rva
tion
s in a
Giv
en L
ou
dn
ess B
in
0
5
10
15
20
25
Histogram of BS.1770-2 Integrated Loudness in 10-second Integration Intervals
LKFS
-30 -25 -20 -15 -10
Nu
mb
er
of O
bse
rva
tion
s in a
Giv
en L
ou
dn
ess B
in
0
5
10
15
20
25
Histogram of BS.1770-2 Integrated Loudness in 10-second Integration Intervals
dB
-28 -27 -26 -25 -24 -23 -22 -21 -20
Nu
mb
er
of O
bse
rvatio
ns in
a G
iven
Lo
ud
ne
ss B
in
0
4
8
12
16
Histogram of CBS Peak MeasurementBS.1770 Limiter OFF
dB
-28 -27 -26 -25 -24 -23 -22 -21 -20
Nu
mb
er
of O
bse
rvatio
ns in
a G
iven
Lo
ud
ne
ss B
in
0
4
8
12
16
Histogram of CBS Peak MeasurementBS.1770 Limiter ON
J&T Maximum Peak in 10-second period
Loudness Histogram

Comparison: BS.1770 Safety
Limiter Off and On
LKFS
-30 -25 -20 -15 -10
Nu
mb
er
of O
bse
rva
tion
s in a
Giv
en L
ou
dn
ess B
in
0
5
10
15
20
25
Histogram of BS.1770-2 Integrated Loudness in 10-second Integration Intervals
LKFS
-30 -25 -20 -15 -10
Nu
mb
er
of O
bse
rva
tion
s in a
Giv
en L
ou
dn
ess B
in
0
5
10
15
20
25
Histogram of BS.1770-2 Integrated Loudness in 10-second Integration Intervals
dB
-28 -27 -26 -25 -24 -23 -22 -21 -20
Nu
mb
er
of O
bse
rvatio
ns in
a G
iven
Lo
ud
ne
ss B
in
0
4
8
12
16
Histogram of CBS Long-Term MeasurementBS.1770 Limiter OFF
dB
-28 -27 -26 -25 -24 -23 -22 -21 -20
Nu
mb
er
of O
bse
rvatio
ns in
a G
iven
Lo
ud
ne
ss B
in
0
4
8
12
16
Histogram of CBS Long-Term MeasurementBS.1770 Limiter ON
J&T Long-Term in 10-second period
Loudness Histogram

Comparison: BS.1770 Safety
Limiter Off and On
LKFS
-30 -25 -20 -15 -10
Nu
mb
er
of O
bse
rva
tion
s in a
Giv
en L
ou
dn
ess B
in
0
5
10
15
20
25
Histogram of BS.1770-2 Integrated Loudness in 10-second Integration Intervals
LKFS
-30 -25 -20 -15 -10
Nu
mb
er
of O
bse
rva
tion
s in a
Giv
en L
ou
dn
ess B
in
0
5
10
15
20
25
Histogram of BS.1770-2 Integrated Loudness in 10-second Integration Intervals
Time (sec)
0 400 800 1200 1600
LK
FS
(B
S.1
770
)d
B (
CB
S)
-28
-27
-26
-25
-24
-23
-22
-21
-20
Loudness with BS.1770 Limiter OFFThree Algorithms Overlaid
Legend
CBS Long-term (1770 lim off)
CBS Peak 1770 lim off - 3.8
BS1770-2 (1770 lim off)
Legend
CBS avg peak max
CBS Max - 3.8 dB
BS.1770-2 long-term
Time (sec)
0 400 800 1200 1600
LK
FS
(B
S.1
770
)d
B (
CB
S)
-28
-27
-26
-25
-24
-23
-22
-21
-20
Loudness with BS.1770 Limiter ONThree Algorithms Overlaid
J&T Maximum Peak, J&T Long-Term, and
BS.1770-2 in 10-second period
Loudness vs. Time

• When the J&T Loudness Controller is placed before the BS.1770 Safety Limiter, the J&T controller prevents the BS.1770 controller from unnaturally increasing the level of unadorned dialog. This is because the J&T controller locks onto dialog better than BS.1770, particularly when the dialog is mixed with music and/or effects.
• “Inverse BS.1770” gain reduction” sounds unnatural when used by itself: – It will subtly modulate dialog levels when underscoring or effects appear
behind the dialog.
– Highly produced material with low peak-to-RMS ratio will be quieter than dialog.
• Recommendation: Use a BS.1770 Safety Limiter if controlling overall loudness is more important than achieving the best subjective source-to-source consistency of the “anchor element” (usually dialog). Otherwise, use the J&T Loudness Controller alone.
Observations:

Potential Pitfalls
• If not optimally designed, on-line loudness controllers can introduce objectionable audible artifacts:
– “Spitty” dialog with hollowed-out midrange caused by inappropriately designed multiband
compression.
– Ambience pumping and breathing caused by poor or no silence gating in the compressor.
– Stereo image shifts caused by unsophisticated gain coupling between audio channels.
– Slow pumping of loudness caused by using loudness meter time constants in an loudness controller sidechain.
• Mechanical reliance on the BS.1770 meter can cause inconsistent loudness between program segments, although inconsistency usually does not exceed 3 LK. While this is within the +2/-5 LK “comfort zone” defined in ATSC A/85, it can nevertheless give the impression that the broadcast is sloppily produced. When your ears disagree with the BS.1770 meter, trust your ears!

• In digital television, some program material is well mixed and does not require on-line automatic loudness control. Automatic loudness control can be bypassed for such material.
• Other material, like live news and sports, requires on-line automatic loudness control to prevent viewer annoyance – time pressures in live broadcasts prevent the audio from being carefully produced.
• Automatic loudness control is unlikely to ever be as good as a human mixer when the most esthetically pleasing results are desired. Only humans can understand the subtleties of context. File-based loudness control is more likely than on-line loudness control to create loudness inconsistencies at the boundaries between program elements.
Recap

• The J&T loudness meter (and loudness controllers based on it) tend to lock onto dialog.
• The BS.1770 meter indicates the approximate overall loudness of the program, although it tends to over-read material with a low peak-to-RMS ratio. If dialog levels are held constant, the BS.1770 meter will indicate that dialog mixed with underscoring or effects is louder than unadorned dialog, even though the dialog levels have not changed. The BS.1770 Short-Term measurement is particularly prone to this behavior and should not be used as the sole reference for an automatic loudness controller.
• Cascading a J&T loudness controller and a BS.1770 “overshoot limiter” is often a good compromise. The J&T controller prevents unadorned dialog from being unnaturally pumped up in loudness, while the BS.1770 controller catches material whose overall loudness might be considered excessive, depending on the loudness control philosophy of the broadcaster.
Recap

Thanks for your attention!


