28
USP Performance & Business Environment Assessment
USP Performance & Business Environment Assessment

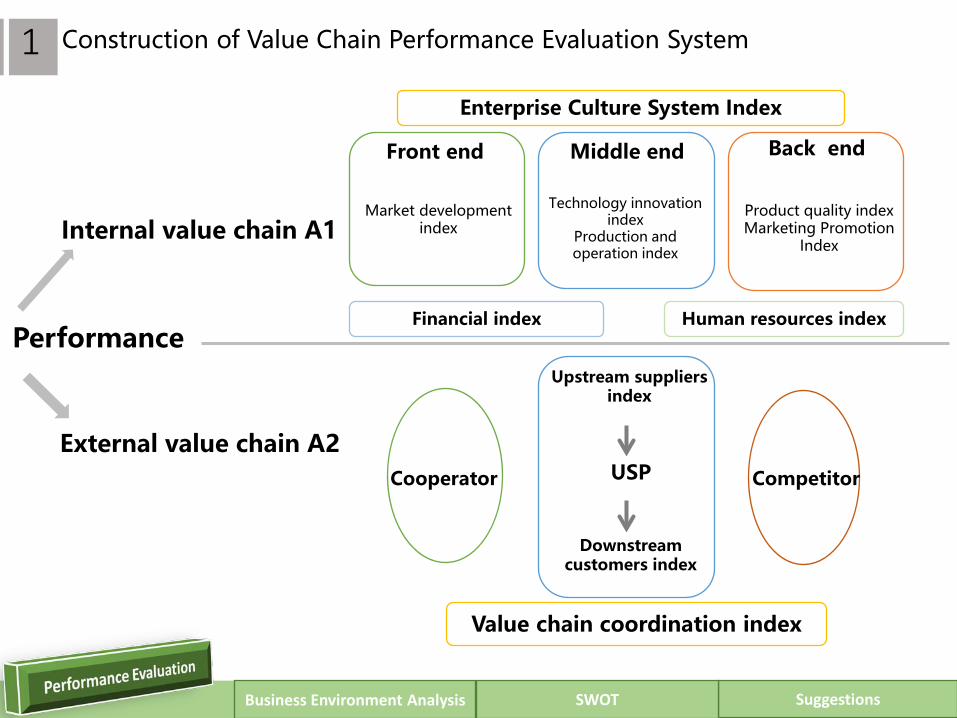
Construction of Value Chain Performance Evaluation System1
Front end
Market development index
Middle end
Technology innovation index
Production and operation index
Back end
Product quality indexMarketing Promotion
Index
Financial index Human resources index
Enterprise Culture System Index
USP
Upstream suppliers index
Downstream customers index
Internal value chain A1
External value chain A2
Performance
Value chain coordination index
Cooperator Competitor
Business Environment Analysis SuggestionsSWOT

Internal Value Chain2
Rationalized recommendation adoption rate C111
Customer complaint rate C112
Market development index B12
Market development cost rate C121
operating expense ratio C122
Infrastructure such as market development is strengthened.
Enterprise culture system index B11
Front end
Middle end
1. Technology innovation index B13
R & D cost rate C131
Number of R&D personnel C132
Product developing speed C133
Return on investment of new products C134
Emphasis on innovation is conducive to long-term development
2. Technology innovation index B14
Acceptable rate of product C141
Product life cycle C142
Production capacity is strong but service quality is low.
Corporate culture construction level is average.
Business Environment Analysis SuggestionsSWOT

Internal Value Chain2
Financial indexB17
Back end
1. Product quality index B15 Customer satisfaction C151
Internal quality C152
Product quality is not high and declining.
2. Marketing Promotion Index B16 Number of sales channels C161
Number of marketing methods C162
Number of Sales channels is small, marketing promotion ability is weak.
1. Profitability C171 Net interest rate Gross-profit ratio Cost and expense ratios
Profitability is being reduced.
2. Operation ability C172 Property rate of turnover
No significant change in USP operational capacity.
3. Debt paying ability C173 Assets-liability ratio Current ratio
Long-term and short-term solvency is being enhanced.
Business Environment Analysis SuggestionsSWOT

Internal Value Chain2Human Resource
Indicators B18
Financial index
4. Growth Ability C174 Income growth rate Profit growth rate
Growth capacity is declining.
5. Cash Flow Capacity C175 Cash ratio of operating income
Cash flow capacity is declining.
6. Owner’s Equity C176 Owner’s Equity
Equity is stable.
7. Risk Level C177 High risk business assets ratio Litigation cost ratio Contingent liability ratio Asset loss rate
Risk levels are low for the time
being.
8. Asset Size C178 Fixed assets All other assets
The total size of assets is small
and corporate structure is simple.
Employee knowledge level C181
Employee training input C182
Employee turnover rate C183
Both are constantly improving.
Business Environment Analysis SuggestionsSWOT

External Value Chain3Supplier indicator B21
Timely delivery rate C211
Supplier qualification rate of product quality C212
Quantity of suppliers C213
Customer indicator B22
Customer Satisfaction Index C221
Customer Retention Rate C222
Customer Acquisition Rate C223
Both customer satisfaction and customer retention rate decreased, while customer acquisition rate increased.
The quality of the products supplied by suppliers is declining.
Competitor indicator B23
Market share C231
Competitor size C232
Current period inventory C233
USP has many competitors, and it is at adisadvantage in the market competition.
Value chain synergetic index B24
Information validity C241
Information sharing rate C242
Value chain node enterprise loyalty C243
The rationality of profit distribution C244
The rate of Effective and Shared information is low, but corporate loyalty and rationality are strong.
Business Environment Analysis SuggestionsSWOT

(1) According to single factor fuzzy judgment, determine the single factor to establish fuzzy matrix𝑅𝑅11 = 0.00 0.06
0.00 0.130.20 0.60 0.140.26 0.46 0.15 …
(2) Weight coefficient matrix 𝑤𝑤11 = 0.51 0.49 𝑤𝑤12 = 0.51 0.49 …(3) Secondary fuzzy evaluatio 𝐵𝐵𝑖𝑖𝑖𝑖 = 𝑤𝑤𝑖𝑖𝑖𝑖 × 𝑅𝑅𝑖𝑖𝑖𝑖𝐵𝐵11 = 0.00 0.0943 0.2294 0.5314 0.1449 𝐵𝐵12 =0.00 0.4812 0.3649 0.1539 0.00 …
(4) First-level fuzzy evaluation matrix 𝑅𝑅1 =0.0000 0.0943 0.2294 0.5314 0.14490.0000 0.4812 0.3649 0.1539 0.00000.1530 0.3965 0.2950 0.1555 0.00000.0856 0.3384 0.5144 0.0616 0.00000.0000 0.3316 0.3405 0.2620 0.06590.0000 0.0275 0.2650 0.5710 0.13650.0378 0.1971 0.4064 0.2767 0.08200.0000 0.2345 0.4595 0.3020 0.0040
…
𝑤𝑤1 = 0.03 0.04 0.27 0.15 0.17 0.11 0.15 0.08 … 𝐵𝐵𝑖𝑖 = 𝑤𝑤𝑖𝑖 × 𝑅𝑅𝑖𝑖R = 0.05982 0.287764 0.363043 0.246338 0.043335
0.169995 0.227937 0.432231 0.310452 0.005208 𝑤𝑤 = 0.61 0.39𝐵𝐵 = 𝑤𝑤 × 𝑅𝑅 = 0.10278825 0.26443147 0.39002632 0.27134246 0.02846547
V = 𝑉𝑉1,𝑉𝑉2,𝑉𝑉3,𝑉𝑉4,𝑉𝑉5 = 𝑒𝑒𝑒𝑒𝑒𝑒𝑒𝑒𝑒𝑒𝑒𝑒𝑒𝑒𝑒𝑒𝑒𝑒,𝑔𝑔𝑔𝑔𝑔𝑔𝑔𝑔, 𝑎𝑎𝑎𝑎𝑒𝑒𝑎𝑎𝑎𝑎𝑔𝑔𝑒𝑒, 𝑏𝑏𝑎𝑎𝑔𝑔,𝑤𝑤𝑒𝑒𝑎𝑎𝑤𝑤= 100,80,60,40,20
Fuzzy Performance Evaluation of USP4𝑷𝑷 = 𝑩𝑩 × 𝑽𝑽 = 𝟔𝟔𝟔𝟔.𝟐𝟐𝟐𝟐𝟐𝟐𝟐𝟐𝟐𝟐𝟐𝟐𝟔𝟔In the Internal Value Chain
Corporate culture system index “ bad ”
Market development index “ good ”
Technical innovation index “ good ”
Production and operation index “ average ”
Product quality index “ average ”
Marketing promotion index “ bad ”
Financial index “ average ”
Human resources index “ average ”
In the External Value Chain
Supplier index “ average ”
Customer index “ bad ”
Competitor index “ average”
Value chain synergy index “ average ”
In ALL
Internal value chain index “ average ”
external value chain index “ average ”
The rank of performance evaluation of USP is
between average and good, with a average
bias.

CVP Analysis5
Service category SI BP SMM SI BP SMM
Exclusive consultant unit variable labor cost 150.00 250.00 - 150.00 250.00 -
Non-exclusive consultant unit variable
labor cost250.00 400.00 600.00 250.00 400.00 -
Unit sales commission① 253.81 189.57
Exclusive consultant fixed labor cost 700,000.00 1,000,000.00 - 600,000.00 900,000.00
Online platform and APP 2,000,000.00 1,200,000.00
Rent 520,000.00 500,000.00Training 400,000.00 100,000.00Interests 200,000.00 200,000.00
Wages and admin 1,550,000.00 1,500,000.00Total fixed cost 6,370,000.00 5,000,000.00
Note:Assuming that the market development expenses are all sales commissions, since the market development expenseshave increased from 200,000 yuan in 2017 to 500,000 yuan in 2018, it is reasonable to assume that the proportion of salesrelying on the sales commission program in the total sales volume has increased from 5% in 2017 to 10% in 2018.
2017:Average unit Sales Commission =500000/(19700*10%)=253.81( Yuan/time )
2018:Average unit sales commission =200000/(21100*5%)=189.57( Yuan/time )

CVP Analysis5
Labor cost:
SI+BP→total reduction by 520,000.00
SI+BP+SMM→Total growth rate=10.49%
Platform cost:
Salary of IT+IT infrastructure+Other→
Total growth rate=66.67%
The increase in income can’t meet the
increased costs. If it fails to achieve
effective cost reduction and efficiency
increase, USP will face greater
operational risks.
In 2018, USP’s overall operation
conditions deteriorated.
Drop in gross margin: USP has increased
development costs and technical staff
compensation.
Margin of safety reduction: The gap between
existing sales and the break-even point shrinks,
making USP less resistant to market downturns.
Comprehensive breakeven sales increased:
USP production and operation risk increased.
35.58% 39.10%
11,013,139.70 8,470,269.35
3,206,860.30 4,139,730.65
8470
11013
4140 3207
39.10%
35.58%
33.00%34.00%35.00%36.00%37.00%38.00%39.00%40.00%
02000400060008000
1000012000
2017 2018
Comprehensive breakeven sales
Margin of safety
Gross profit margin
Business Environment Analysis SuggestionsSWOT
CVP Analysis5
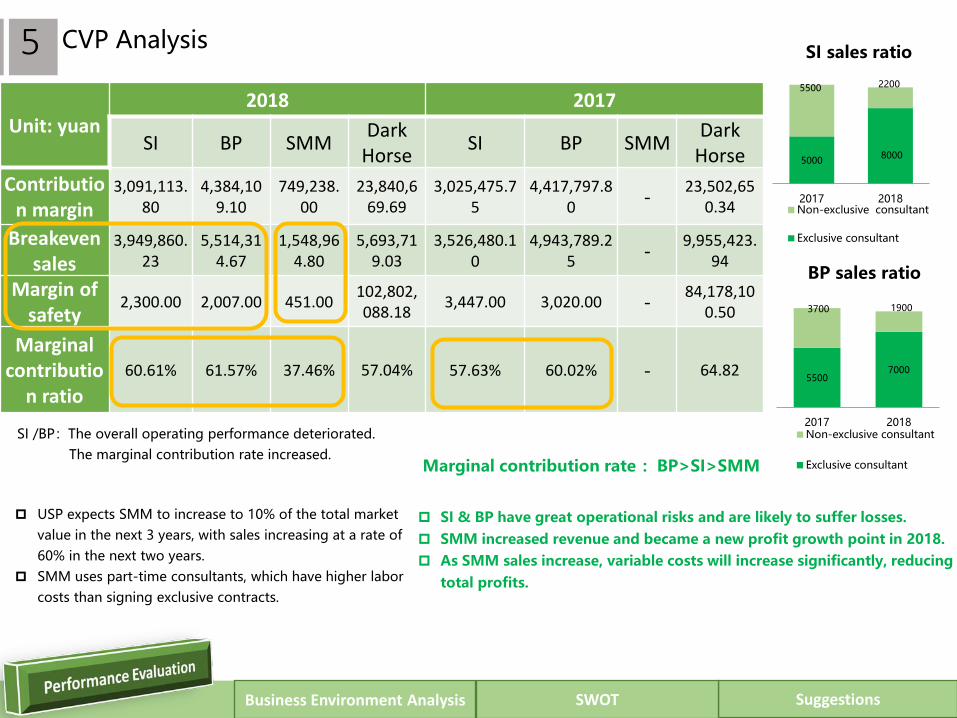
Unit: yuan2018 2017
SI BP SMM Dark Horse SI BP SMM Dark
HorseContributio
n margin3,091,113.
804,384,10
9.10749,238.
0023,840,6
69.693,025,475.7
54,417,797.8
0 - 23,502,650.34
Breakeven sales
3,949,860.23
5,514,314.67
1,548,964.80
5,693,719.03
3,526,480.10
4,943,789.25 - 9,955,423.
94
Margin of safety
2,300.00 2,007.00 451.00 102,802,088.18 3,447.00 3,020.00 - 84,178,10
0.50
Marginal contributio
n ratio60.61% 61.57% 37.46% 57.04% 57.63% 60.02% - 64.82
Specific Operation of SI, BP and SMM
Marginal contribution rate :BP>SI>SMM
SI /BP:The overall operating performance deteriorated.The marginal contribution rate increased.
5000 8000
5500 2200
2017 2018
SI sales ratio
Non-exclusive consultant
Exclusive consultant
USP expects SMM to increase to 10% of the total market value in the next 3 years, with sales increasing at a rate of 60% in the next two years.
SMM uses part-time consultants, which have higher labor costs than signing exclusive contracts.
SI & BP have great operational risks and are likely to suffer losses. SMM increased revenue and became a new profit growth point in 2018. As SMM sales increase, variable costs will increase significantly, reducing
total profits.
55007000
3700 1900
2017 2018
BP sales ratio
Non-exclusive consultant
Exclusive consultant
Business Environment Analysis SuggestionsSWOT

Long and Short Term Decisions5
9,909.00 8,610.00 3,200.00
500.00 800.00 1,000.00
198.28 308.53 600.00
15.00 20.00 25.00
7,800.00 6,800.00 0
2,109.00 1,810.00 3,200.00
20.11
24.57
16.00
Short-Term-Constrained Resource Decisions (2019)
1,024,500.00 1,920,000.00 3,120,000.00 4,200,000.00 5,136,000.00
9,654,058.92
Long-term-Net Present Value Decision
Note:Market development cost is 500,000.00The sales commission ratio is 10%Unit sales
commission= 500000(9909+8610)/0.1
=270.00
It is estimated that 200 people in the company will work 250 days a year and a total of 40w working hours a year.
Note:Invest 2 million in 2018, with a discount rate of 8%.The sales volume of SMM in the first two years increased by 60%, assuming 50%, 30%, and 20% respectively.
Business Environment Analysis SuggestionsSWOT

USP Performance Issues Summary6Front End Increased investment in the market development and staff
training, payed attention to infrastructure construction.
→Positive The cost of platform negatively affected the efforts to innovate.
→Negative
Middle End The safety margin of SI and BP decreased, and there is a large
operating risk and a high possibility of loss. Increased revenue cannot cover the cost with constant price;
→Negative
The variable labor cost reduced by SMM is greater than the fixed labor cost increased.
Compared with traditional law firms, USP charges lower fees, provides simplified services and has cost advantages.
→Positive
Back End Falling customer satisfaction reduced corporate credibility. Single sales channels, unappealing marketing and product pricing,
no competitive advantage; The sales model lacks pertinence and is easy to lose customer.
→Negative
Finance SI and BP have underperformed in 2018. The introduction of
SMM have not generated significant revenue. The uncontrolled cost leads to the decline of USP's profitability and growth capacity.
→Negative
Corporate culture management system Single service positioning, simple customer group and lacking
core competitiveness.
→Negative
HR metrics In 2018, the consultant turnover rate declined and the
employee incentive system implemented by USP was effective.
→Positive
Business Environment Analysis SuggestionsSWOT

USP Performance Issues Summary6
Upstream supplier: USP does not have enough consultants and the quality of service is not high.
→Negative The reduction of consultant turnover in 2018 ensures the stability of upstream suppliers.
→Positive Downstream customers: customer satisfaction declines, customer retention rate and customer acquisition rate
are difficult to break through.
→Negative
USP has no partners, but many strong competitors.
→Negative
Vertical value chain
Horizontal value chain
Business Environment Analysis SuggestionsSWOT

External Shocks7
Government Policy Many incentives for entrepreneurship. The strategy of mass entrepreneurship and innovation.
Market capacity Reform of the business system is
comprehensively advanced. In the last five years, China set up
72.929 million new market entities and 21.609 million new enterprises.
Internet Development The impact of disintermediation,
flattening and equalization of the Internet.
The Internet ecology has improved and its penetration rate has risen.
USP's targeted customer group:College students planning to start a business
The policy directly increases the number of potential customers.
It provides USP with more potential sales and development opportunities.
USP completed the development and maintenance of online platform and APP: Outside the confines of traditional business
To some extent, it has avoided the loss of customers who are keen on the Internet.
Performance Evaluation SuggestionsSWOT

Market Structure7
The absolute cost barrier in the start-up services industry is very low.
USP's competitors are entering the
market. As traditional service providers enter the
industry with a lot of capital, the barriers to entry in the future are becoming higher.
Industry concentration is low and unstable.
At present, the national entrepreneurial service enterprises show a trend of diversification.
USP is small in size, which makes it
difficult to compete with traditional enterprises in capital and resources.
Other similar firms will compete for USP's market resources.
The sharing of innovation services is strong and the technical content is low. Once a model is profitable, other firms copy it.
Product differentiation is difficult to achieve.
Product differentiation USP's service is relatively unitary, so there
is a risk of customer loss. The increased price sensitivity of consumers
when choosing between similar services presents a challenge to cost control.
Market concentration
Barriers to entry
Performance Evaluation SuggestionsSWOT

Market Behavior7
USP didn't invest enough in marketing, so it does not have an advantage in the face of high marketing investment from competitors.
Technical talents are the most important part for enterprises to attract customers;Companies in the industry compete for scarce talent through pay strategies.
Marketing spending
The main competitors are 36Kr, Innovation Works, Lenovo Star and Chaos Research. 36Kr's marketing expenses in 2019 Q4 were 49.7 million yuan, up 109.3% from the same period last year.
With no major shareholders or partners, USPis struggling to remain competitive in the market.
As a small enterprise, USP is difficult to survive alone in the face of the suppression of large enterprises in the market.
Talent competition USP reduces its employee turnover by
entering into exclusive agreements with consultants;
If USP cannot invest more in labor costs, it will lead to a brain drain.
Vertical integration
There are many small enterprises in this industry, and the integrated development is an irresistible trend.
Performance Evaluation SuggestionsSWOT

Market Behavior7
Service competition
I.Healthy service competitionII.Vicious service competition
USP does not have a clear advantage in terms of quality of service, and it does not take steps to retain existing customers and attract new ones.
Price competition
Industry market competition space is large, and price competition is the main means;
Enterprises compete for the market share, making the price vicious competition degree to intensify.
USP has no advantage in price competition. Although the unit price of SI and BP is not expected to increase in the future, the excessively large reduction will result in the consequence that the revenue cannot cover the cost.
Specialized market segmentation Entrepreneurial service agencies are divided
into tutoring and training type, sharing office type, financing service type, professional service type, media platform type and maker incubation type.
The industry in which USP is located continues to expand into vertical segments, which increases the degree of competition in the entrepreneurial service industry.
Performance Evaluation SuggestionsSWOT

Market Performance7
The industry average net sales interest rate for 2017-2018 is 10.73%.
The overall profit level of the industry is low and the market competition is fierce.
Risk management
ability
ProfitabilitySocial
benefits
USP's average net profit margin in these two years is 16.28%, and its profitability is higher than the industry average.
The industry as a whole is now in second phase , and USP has entered third phase: profitability will increase due to economies of scale.
The industry will improve the success rate of entrepreneurs and increase the job opportunities.
Promote the efficiency of resource allocation.
USP helps customers to solve entrepreneurial difficulties and promotes the development of the industry.
We will help college graduates start their own businesses successfully and relieve the pressure on employment.
USP reduces employee turnover and creates incentives by signing exclusive agreements with consultants.
SI and BP teams are independent from each other, with clear job responsibilities and authority division.
The IT team is composed of professional engineers, which ensures the professionalism and perfect human resource control.
Imperfect industry internal governance structure; lack of risk management mechanism; imperfect human resource control; poor information communication; imperfect supervision mechanism.
Performance Evaluation SuggestionsSWOT
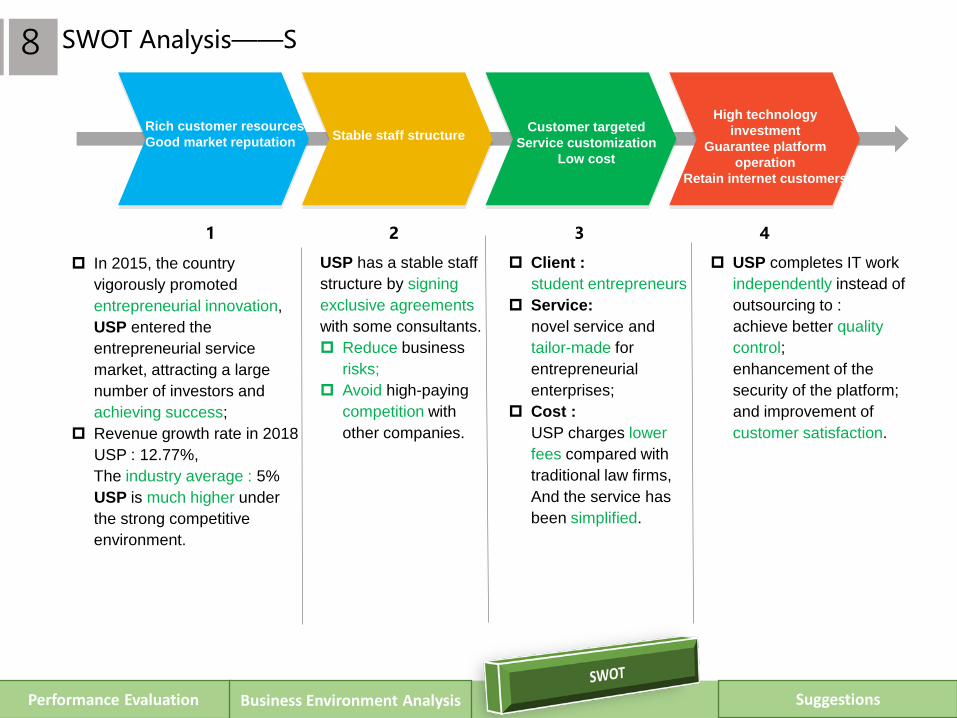
USP has a stable staff structure by signing exclusive agreements with some consultants. Reduce business
risks; Avoid high-paying
competition with other companies.
Client :student entrepreneurs
Service:novel service andtailor-made for entrepreneurial enterprises;
Cost :USP charges lower fees compared with traditional law firms, And the service has been simplified.
SWOT Analysis——S8
1 2 3 4
Rich customer resourcesGood market reputation Stable staff structure Customer targeted
Service customizationLow cost
High technology investment
Guarantee platform operation
Retain internet customers
In 2015, the country vigorously promoted entrepreneurial innovation, USP entered the entrepreneurial service market, attracting a large number of investors and achieving success;
Revenue growth rate in 2018USP : 12.77%,The industry average : 5%USP is much higher under the strong competitive environment.
USP completes IT work independently instead of outsourcing to :achieve better quality control;enhancement of the security of the platform;and improvement of customer satisfaction.
Performance Evaluation Business Environment Analysis Suggestions

SWOT Analysis——W8
The consultants in the industry are generally freelance workers.
The labor relationship is unstable, which easily prevents the normal operation of USP.
2. Strong non-substitution of staff and high churn rate
Because of small size, it is difficult to adopt a low-cost strategy for USP
USP's increased revenue cannot meet theincreased costs.
1. Insufficient labor cost control
Customer satisfaction declined in 2008, and the servicequality was low;
Marketing promotion and product pricing have not attracted customers, so there is a threat of customers looking for alternatives.
4. Decline in customer satisfaction
The service provided by USP lacks core competitiveness.
The current sales channels are extensive and scattershot, which is prone to risk of losingcustomers.
3. Single service groups, and lack of targeted sales model
Performance Evaluation Business Environment Analysis Suggestions

SWOT Analysis——O81. Entrepreneurship counseling periodization and business integration are important trends in the future
USP can achieve an asset-lightbusiness model focused on servicequality by Providing expertise Broadening financing channels Developing industrial resources
3. Improve services, sales channels and marketing methods Expand sales channels Optimize service process Use media resources to promote Settle in a large entrepreneurial service platform Use a variety of methods to carry out promotional activities Focus on customer’s requirements and subdivide service
categories
2. Platform-based entrepreneurial service organizations have gradually become mainstream formats
USP can provide customers with all-round and comprehensive services, which will bring more business opportunities and resources.
4. Adopt a centralized management strategy
It is difficult for USP to compete on price shortlyafter its establishment.
USP can adopt a centralized competition strategyto develop SI and BP while gradually shifting its emphasis to SMM, which has a brighter prospect.
Performance Evaluation Business Environment Analysis Suggestions
03
02
04
01
SWOT Analysis——T8
3. Market concentration is low and unstable
Although USP launched a new business in 2018 to diversify risks, it is inevitable that competitors will imitate to seize USP's market resources.
1. Threat of new entrants
Because of national policy support and low entry barriers, more and more competitors are entering the industry, so USP face greatercompetitive pressure.
2. Severe competition among competitors in the industry
The industry has a relatively high degree of marketization.
Traditional companies have a large marketshare and pose a greater threat to USP,and may compete on price to threaten newly established small companies like USP
4. The tussle for talent
Although USP signed exclusive contracts with consultants to reduce brain drain, large companies may dream up newperks and incentives to wage a fiercewar for talent.
Performance Evaluation Business Environment Analysis Suggestions

SMM
Increase the contribution margin ratio. When the sales volume exceeds X, try to sign
exclusive contracts with consultant; Achieve an asset-light business model
focused on services by providing professional technology, broadening financing channels, and developing industrial resources ;
Obtain more revenue by providing more detailed and better professional and intermediary services.
Note: X=
basic salary(commission for each service before exclusive contract is signed − commission for each service after exclusive contract is signed)
SI and BP
Give more publicity, especially for BP; Reduce cost (especially fixed cost) while keeping
the unit price unchanged; Increase the number of exclusive consultants and
reduce the number of part-time consultants.
Online platform
Pay a reasonable cost in platform maintenance.
Competitive strategy
Adopt a centralized competition strategy, shift
the emphasis to SMM.
Suggestions9
Performance Evaluation Business Environment Analysis SWOT

Employee
Improve employee welfare under
the premise of reasonable cost.
Accounting
Put the cost of online
platform and mobile
APP that meets the
capitalization conditions
into the cost of
intangible assets, for the
annual amortization can
be tax-deductible to
increase net profit.
Increase investment in employee
training and enhance service
quality to improve customer
satisfaction.
• Make targeted improvements by
distributing questionnaires to
customers and collecting their
suggestions on company services.
Use more exclusive
consultants instead of part-time
consultants.
Suggestions9
Performance Evaluation Business Environment Analysis SWOT

Marketing
Establish promotion channels for colleges and universities, and recruit "campus ambassadors" with strong communication and execution capabilities;
Distribute advertisements on social media and use official accounts to shoot company daily Vlogs for promotion.
(1)Publicity
Carry out promotion by reduce price during the graduation season, in which many students may choose to start a business;
Have more repeat customers by managing cards and offering service terms of providing real-time adjustment services with market changes. Customers can enjoy discounts if they prestore funds in the card.
(2)Promotion
Pricing
Adjust the pricing of SI, BP, and SMM from 500 yuan per time, 800 yuan per time, 1,000 yuan per time to 999.98 yuan per time or 998 yuan per time. This is a psychological strategy.
(1)Mantissa pricing
Establish a customer scoring system and increase the price of services provided by consultants who have better feedbacks, so that customers may think that the price discrepancies are worth;
Adopt a product portfolio pricing strategy and launch package services for the three major businesses, with an average price lower than the price of a single service.
(2)Grade pricing strategy
Suggestions9
Performance Evaluation Business Environment Analysis SWOT

Adopt a customer-specific
competitive strategy and segment
existing services to attract
customers. For example, services
can be subdivided into advertising,
promotion, design, and execution
of entrepreneurial plans.
Focus on customer’s requirements Subdivide service categories
Strengthen communication with
customers and actively accept
feedback of customers.
Optimize project workflow
Customers are more willing to
consume in the entrepreneurial
service platform of large enterprises
that has been certified by a third party
and has guarantees of third-party.
Enter the platform
Include middle-aged
entrepreneurs, entrepreneurs who
are difficult to keep up with social
hot spots or are restricted by
economic factors.
Expand customer base
Suggestions9
Performance Evaluation Business Environment Analysis SWOT

Thank you for watching


