COVID-19 The purpose of this report is to develop a shared understanding of the current status of the pandemic at the national, regional, state and local levels. We recognize that data at the state level may differ from that available at the federal level. Our objective is to use consistent data sources and methods that allow for comparisons to be made across localities. We appreciate your continued support in identifying data discrepancies and improving data completeness and sharing across systems. We look forward to your feedback. STATE REPORT 09.06.2020 SUMMARY • Utah is in the yellow zone for cases, indicating between 10 and 100 new cases per 100,000 population last week, with the 27th highest rate in the country. Utah is in the yellow zone for test positivity, indicating a rate between 5% and 10%, with the 11th highest rate in the country. • Utah has seen an increase in new cases and stability in test positivity over the last week statewide, particular in counties with colleges and universities. • The following three counties had the highest number of new cases over the last 3 weeks: 1. Salt Lake County, 2. Utah County, and 3. Davis County. These counties represent 78.5% of new cases in Utah. • 45% of all counties in Utah have moderate or high levels of community transmission (yellow or red zone), with 3% having high levels of community transmission (red zone). • During the week of Aug 24 – Aug 30, 2% of nursing homes had at least one new resident COVID-19 case, 8% had at least one new staff COVID-19 case, and 1% had at least one new resident COVID-19 death. • Utah had 90 new cases per 100,000 population in the last week, compared to a national average of 88 per 100,000. • Current staff deployed from the federal government as assets to support the state response are: 2 to support operations activities from FEMA and 1 to support epidemiology activities from CDC. • Between Aug 29 - Sep 04, on average, 17 patients with confirmed COVID-19 and 16 patients with suspected COVID-19 were reported as newly admitted each day to hospitals in Utah. An average of 88% of hospitals reported either new confirmed or new suspected COVID patients each day during this period; therefore, this may be an underestimate of the actual total number of COVID-related hospitalizations. Underreporting may lead to a lower allocation of critical supplies. RECOMMENDATIONS • Persistently elevated case rates are concerning as schools open and colder weather approaches. • Recommend statewide face covering requirement; at a minimum, all counties defined as yellow and red in this report should enact local ordinances, especially Utah, Davis, Weber, Washington, Cache, Morgan, and Sanpete counties. • Continue to educate vulnerable family members to protect themselves by avoiding family gatherings and any indoor events where face coverings are not uniformly worn, and social distancing is not possible or practiced. • Ensure in-person schools are all practicing effective mitigation procedures, including appropriate distancing and face mask use in all indoor settings. • Identify groups that are not wearing face coverings and target educational efforts to them. • Continue efforts to enhance testing capacity by expanding public-private partnerships; increasing the budget and capacity of public health labs; pooling specimens where appropriate; and utilizing all university, veterinary and research platforms for surveillance and testing of students and, if needed, the surrounding communities. • Require all universities and colleges to have a plan for initial testing and periodic retesting of students, with quick turnaround times for results, and rapid isolation of cases and quarantine of contacts; residential cases and contacts should not be sent home to isolate or quarantine. • Explore use of focused wastewater surveillance to detect cases early and to direct diagnostic testing and public health interventions. • Enlist various student leaders and utilize campus media to promote compliance with recommendations. • Recruit college and university students to expand public health messaging and contact tracing capacity and protect local communities by strict mask wearing and social distancing off campus. • Continue to protect residents of nursing homes and long-term care facilities by testing of all residents on admission, periodic testing of staff in counties with elevated transmission and in accordance with CMS requirements, facility- wide testing when any staff or resident is diagnosed with COVID, reasonable restrictions on visitation, and required face coverings for all staff. • Using the Abbott BinaxNOW, establish weekly surveillance in critical populations to monitor degree of community spread among K-12 teachers; staff working at nursing homes, assisted living, and other congregate living settings; and first responders. • Tribal Nations: Continue to promote social distancing and mask recommendations. Develop specific, culturally relevant education and public health messaging. Pooled testing should be instituted for multigenerational households. Spaces to provide quarantine of contacts and isolation of cases should be provided along with material support, as needed, for all those who live in congregate settings or crowded or multigenerational households. • Specific, detailed guidance on community mitigation measures can be found on the CDC website . UTAH
Transcript
COVID-19
The purpose of this report is to develop a shared understanding of the current status of the pandemic at the national, regional, state and
local levels. We recognize that data at the state level may differ from that available at the federal level. Our objective is to use consistent
data sources and methods that allow for comparisons to be made across localities. We appreciate your continued support in identifying data
discrepancies and improving data completeness and sharing across systems. We look forward to your feedback.
STATE REPORT09.06.2020
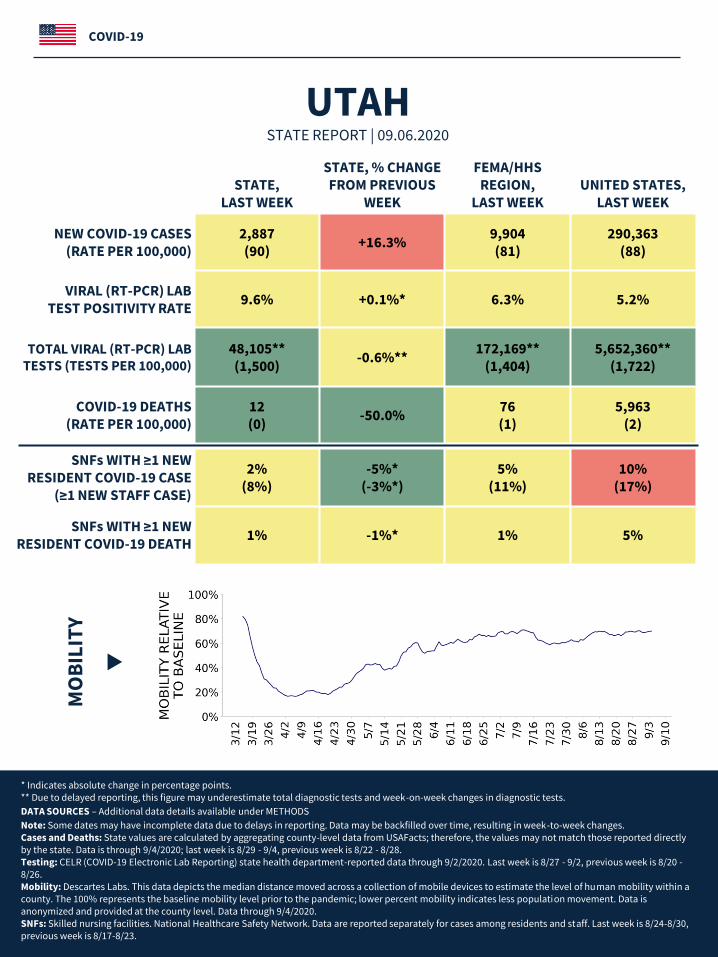
SUMMARY• Utah is in the yellow zone for cases, indicating between 10 and 100 new cases per 100,000 population last week, with
the 27th highest rate in the country. Utah is in the yellow zone for test positivity, indicating a rate between 5% and 10%, with the 11th highest rate in the country.
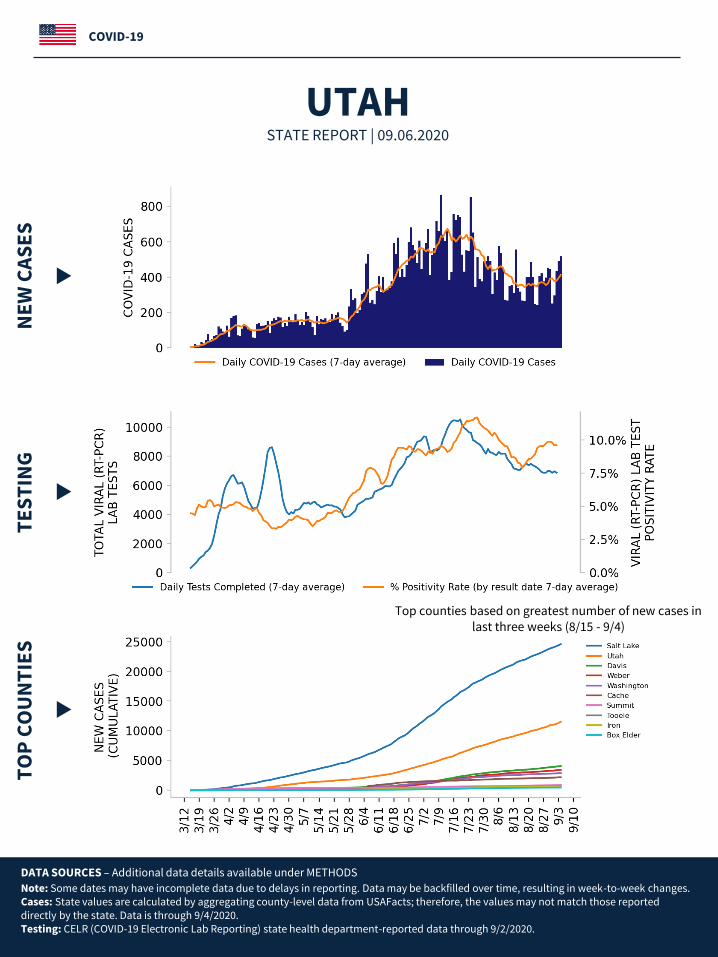
• Utah has seen an increase in new cases and stability in test positivity over the last week statewide, particular in counties with colleges and universities.
• The following three counties had the highest number of new cases over the last 3 weeks: 1. Salt Lake County, 2. Utah County, and 3. Davis County. These counties represent 78.5% of new cases in Utah.
• 45% of all counties in Utah have moderate or high levels of community transmission (yellow or red zone), with 3% having high levels of community transmission (red zone).
• During the week of Aug 24 – Aug 30, 2% of nursing homes had at least one new resident COVID-19 case, 8% had at least one new staff COVID-19 case, and 1% had at least one new resident COVID-19 death.
• Utah had 90 new cases per 100,000 population in the last week, compared to a national average of 88 per 100,000.• Current staff deployed from the federal government as assets to support the state response are: 2 to support
operations activities from FEMA and 1 to support epidemiology activities from CDC.• Between Aug 29 - Sep 04, on average, 17 patients with confirmed COVID-19 and 16 patients with suspected COVID-19
were reported as newly admitted each day to hospitals in Utah. An average of 88% of hospitals reported either new confirmed or new suspected COVID patients each day during this period; therefore, this may be an underestimate of the actual total number of COVID-related hospitalizations. Underreporting may lead to a lower allocation of critical supplies.
RECOMMENDATIONS• Persistently elevated case rates are concerning as schools open and colder weather approaches.• Recommend statewide face covering requirement; at a minimum, all counties defined as yellow and red in this report
should enact local ordinances, especially Utah, Davis, Weber, Washington, Cache, Morgan, and Sanpete counties.• Continue to educate vulnerable family members to protect themselves by avoiding family gatherings and any indoor
events where face coverings are not uniformly worn, and social distancing is not possible or practiced.• Ensure in-person schools are all practicing effective mitigation procedures, including appropriate distancing and face
mask use in all indoor settings.• Identify groups that are not wearing face coverings and target educational efforts to them.• Continue efforts to enhance testing capacity by expanding public-private partnerships; increasing the budget and
capacity of public health labs; pooling specimens where appropriate; and utilizing all university, veterinary and research platforms for surveillance and testing of students and, if needed, the surrounding communities.
• Require all universities and colleges to have a plan for initial testing and periodic retesting of students, with quick turnaround times for results, and rapid isolation of cases and quarantine of contacts; residential cases and contacts should not be sent home to isolate or quarantine.
• Explore use of focused wastewater surveillance to detect cases early and to direct diagnostic testing and public health interventions.
• Enlist various student leaders and utilize campus media to promote compliance with recommendations.• Recruit college and university students to expand public health messaging and contact tracing capacity and protect
local communities by strict mask wearing and social distancing off campus.• Continue to protect residents of nursing homes and long-term care facilities by testing of all residents on admission,
periodic testing of staff in counties with elevated transmission and in accordance with CMS requirements, facility-wide testing when any staff or resident is diagnosed with COVID, reasonable restrictions on visitation, and required face coverings for all staff.
• Using the Abbott BinaxNOW, establish weekly surveillance in critical populations to monitor degree of community spread among K-12 teachers; staff working at nursing homes, assisted living, and other congregate living settings; and first responders.
• Tribal Nations: Continue to promote social distancing and mask recommendations. Develop specific, culturally relevant education and public health messaging. Pooled testing should be instituted for multigenerational households. Spaces to provide quarantine of contacts and isolation of cases should be provided along with material support, as needed, for all those who live in congregate settings or crowded or multigenerational households.
• Specific, detailed guidance on community mitigation measures can be found on the CDC website.
TOTAL VIRAL (RT-PCR) LAB TESTS (TESTS PER 100,000)
48,105**(1,500)
-0.6%**172,169**
(1,404)5,652,360**
(1,722)
COVID-19 DEATHS (RATE PER 100,000)
12(0)
-50.0%76(1)
5,963(2)
* Indicates absolute change in percentage points.** Due to delayed reporting, this figure may underestimate total diagnostic tests and week-on-week changes in diagnostic tests.
DATA SOURCES – Additional data details available under METHODS
Note: Some dates may have incomplete data due to delays in reporting. Data may be backfilled over time, resulting in week-to-week changes.Cases and Deaths: State values are calculated by aggregating county-level data from USAFacts; therefore, the values may not match those reported directly by the state. Data is through 9/4/2020; last week is 8/29 - 9/4, previous week is 8/22 - 8/28.Testing: CELR (COVID-19 Electronic Lab Reporting) state health department-reported data through 9/2/2020. Last week is 8/27 - 9/2, previous week is 8/20 -8/26.Mobility: Descartes Labs. This data depicts the median distance moved across a collection of mobile devices to estimate the level of human mobility within a county. The 100% represents the baseline mobility level prior to the pandemic; lower percent mobility indicates less population movement. Data is anonymized and provided at the county level. Data through 9/4/2020.SNFs: Skilled nursing facilities. National Healthcare Safety Network. Data are reported separately for cases among residents and staff. Last week is 8/24-8/30, previous week is 8/17-8/23.
COVID-19
STATE REPORT | 09.06.2020
UTAH
COVID-19
STATE REPORT | 09.06.2020
UTAH
Red Zone: Those core-based statistical areas (CBSAs) and counties that during the last week reported both new cases above 100 per 100,000 population, and lab test positivity result above 10%.Yellow Zone: Those CBSAs and counties that during the last week reported both new cases between 10-100 per 100,000 population, and a lab test positivity result between 5-10%, or one of those two conditions and one condition qualifying as being in the “Red Zone.”Note: Lists of red and yellow localities are sorted by the number of new cases in the last 3 weeks, from highest to lowest. Some dates may have incomplete data due to delays in reporting. Data may be backfilled over time, resulting in week-to-week changes.
DATA SOURCES – Additional data details available under METHODS
Cases and Deaths: State values are calculated by aggregating county-level data from USAFacts; therefore, the values may not match those reported directly by the state. Data is through 9/4/2020; last week is 8/29 - 9/4, three weeks is 8/15 - 9/4.Testing: CELR (COVID-19 Electronic Lab Reporting) state health department-reported data through 9/2/2020. Last week is 8/27 - 9/2.
COVID-19 COUNTY AND METRO ALERTS*Top 12 shown in table (full lists below)
LOCALITIES IN RED ZONE LOCALITIES IN YELLOW ZONE
METRO AREA
(CBSA)LAST WEEK
1 Provo-Orem 6Salt Lake CityOgden-ClearfieldSt. GeorgeLoganHeberCedar City
COUNTY LAST WEEK 1 Utah 12
Salt LakeDavisWeberWashingtonCacheSummitTooeleIronBox ElderWasatchSanpeteMorgan
* Localities with fewer than 10 cases last week have been excluded from these alerts.
NE
W C
AS
ES
TE
ST
ING
COVID-19
STATE REPORT | 09.06.2020
UTAH
DATA SOURCES – Additional data details available under METHODS
Note: Some dates may have incomplete data due to delays in reporting. Data may be backfilled over time, resulting in week-to-week changes.Cases: State values are calculated by aggregating county-level data from USAFacts; therefore, the values may not match those reported directly by the state. Data is through 9/4/2020.Testing: CELR (COVID-19 Electronic Lab Reporting) state health department-reported data through 9/2/2020.
Top counties based on greatest number of new cases in last three weeks (8/15 - 9/4)
TO
P C
OU
NT
IES
TO
TA
L D
AIL
Y C
AS
ES
COVID-19
DATA SOURCES – Additional data details available under METHODS
Cases: State values are calculated by aggregating county-level data from USAFacts; therefore, the values may not match those reported directly by the state. Data is through 9/4/2020. Last 3 weeks is 8/15 - 9/4.
Top 12 counties based on number of new cases in the last 3 weeks
CASE RATES AND VIRAL LAB TEST POSITIVITY DURING THE LAST WEEK
COVID-19
NEW CASES PER 100,000 DURING THE LAST WEEK
VIRAL (RT-PCR) LABORATORY TEST POSITIVITY DURING THE LAST WEEK
WEEKLY CHANGE IN NEW CASES PER 100K
WEEKLY CHANGE IN VIRAL (RT-PCR) LABORATORY TEST POSITIVITY
DATA SOURCES – Additional data details available under METHODSNote: Some dates may have incomplete data due to delays in reporting. Data may be backfilled over time, resulting in week-to-week changes.Cases: State values are calculated by aggregating county-level data from USAFacts; therefore, the values may not match those reporteddirectly by the state. Data is through 9/4/2020. Last week is 8/29 - 9/4, previous week is 8/22 - 8/28.Testing: CELR (COVID-19 Electronic Lab Reporting) state health department-reported data through 9/2/2020. Last week is 8/27 - 9/2, previous week is 8/20 - 8/26.
STATE REPORT | 09.06.2020
UTAH
COVID-19
National Picture
NEW CASES PER 100,000 LAST WEEK
NEW CASES PER 100,000 IN THE WEEK ONE MONTH BEFORE
DATA SOURCESNote: Some dates may have incomplete data due to delays in reporting. Data may be backfilled over time, resulting in week-to-week changes.
Cases: County-level data from USAFacts through 9/4/2020. Last week is 8/29 - 9/4; the week one month before is 8/1 - 8/7.
COVID-19
National Picture
VIRAL (RT-PCR) LAB TEST POSITIVITY LAST WEEK
VIRAL (RT-PCR) LAB TEST POSITIVITY IN THE WEEK ONE MONTH BEFORE
DATA SOURCESNote: Some dates may have incomplete data due to delays in reporting. Data may be backfilled over time, resulting in week-to-week changes.
Testing: Combination of CELR (COVID-19 Electronic Lab Reporting) state health department-reported data and HHS Protect laboratory data (provided directly to Federal Government from public health labs, hospital labs, and commercial labs) through 9/2/2020. Last week is 8/27 - 9/2; the week one month before is 7/30 - 8/5.
Metric Green Yellow Red
New cases per 100,000 population per week <10 10-100 >100
Percent change in new cases per 100,000 population <-10% -10% - 10% >10%
Diagnostic test result positivity rate <5% 5%-10% >10%
Change in test positivity <-0.5% -0.5%-0.5% >0.5%
Total diagnostic tests resulted per 100,000 population per week >1000 500-1000 <500
Percent change in tests per 100,000 population >10% -10% - 10% <-10%
COVID-19 deaths per 100,000 population per week <1 1-2 >2
Percent change in deaths per 100,000 population <-10% -10% - 10% >10%
Skilled Nursing Facilities with at least one resident COVID-19 case, death <1% 1%-5% >5%
Change in SNFs with at least one resident COVID-19 case, death <-1% -1%-1% >1%
COVID-19
METHODS
DATA NOTES
COLOR THRESHOLDS: Results for each indicator should be taken in context of the findings for related indicators (e.g., changes in case incidence and testing volume)
STATE REPORT | 09.06.2020
• Some dates may have incomplete data due to delays in reporting. Data may be backfilled over time, resulting in week-to-week changes. It is critical that states provide as up-to-date data as possible.
• Cases and deaths: County-level data from USAFacts as of 22:00 EDT on 09/06/2020. State values are calculated by aggregating county-level data from USAFacts; therefore, values may not match those reported directly by the state. Data are reviewed on a daily basis against internal and verified external sources and, if needed, adjusted. Last week data are from 8/29 to 9/4; previous week data are from 8/22 to 8/28; the week one month before data are from 8/1 to 8/7.
• Testing: The data presented represent viral COVID-19 laboratory diagnostic and screening test (reverse transcription polymerase chain reaction, RT-PCR) results—not individual people—and exclude antibody and antigen tests. CELR (COVID-19 Electronic Lab Reporting) state health department-reported data are used to describe county-level viral COVID-19 laboratory test (RT-PCR) result totals when information is available on patients’ county of residence or healthcare providers’ practice location. HHS Protect laboratory data (provided directly to Federal Government from public health labs, hospital labs, and commercial labs) are used otherwise. Some states did not report on certain days, which may affect the total number of tests resulted and positivity rate values. Because the data are deidentified, total viral (RT-PCR) laboratory tests are the number of tests performed, not the number of individuals tested. Viral (RT-PCR) laboratory test positivity rate is the number of positive tests divided by the number of tests performed and resulted. Resulted tests are assigned to a timeframe based on this hierarchy of test-related dates: 1. test date; 2. result date; 3. specimen received date; 4. specimen collection date. Resulted tests are assigned to a county based on a hierarchy of test-related locations: 1. patient residency; 2. provider facility location; 3. ordering facility location; 4. performing organization location. States may calculate test positivity other using other methods. Last week data are from 8/27 to 9/2; previous week data are from 8/20 to 8/26; the week one month before data are from 7/30 to 8/5. HHS Protect data is recent as of 11:30 EDT on 09/06/2020. Testing data are inclusive of everything received and processed by the CELR system as of 19:00 EDT on 09/05/2020.
• Mobility: Descartes Labs. These data depict the median distance moved across a collection of mobile devices to estimate the level of human mobility within a locality. The 100% represents the baseline mobility level prior to the pandemic; lower percent mobility indicates less population movement. Data is anonymized and provided at the locality level. Data is recent as of 13:00 EDT on 09/06/2020 and is through 9/4/2020.
• Hospitalizations: Unified hospitalization dataset in HHS Protect. This figure may differ from state data due to differences in hospital lists and reporting between federal and state systems. These data exclude psychiatric, rehabilitation, and religious non-medicalhospitals. In addition, hospitals explicitly identified by states/regions as those from which we should not expect reports were excluded from the percent reporting figure. The data presented represents raw data provided; we are working diligently with state liaisons to improve reporting consistency. Data is recent as of 15:00 EDT on 09/06/2020.
• Skilled Nursing Facilities: National Healthcare Safety Network (NHSN). Data report resident and staff cases independently. Quality checks are performed on data submitted to the NHSN. Data that fail these quality checks or appear inconsistent with surveillanceprotocols may be excluded from analyses. Data presented in this report are more recent than data publicly posted by CMS. Last week is 8/17-8/23, previous week is 8/24-8/30.