30
Infographics: show me the data Tamara cox Palmetto middle librarian
| Date post: | 20-Aug-2015 |
| Category: |
Education |
| Upload: | palmetto-middle-school |
| View: | 2,147 times |
| Download: | 0 times |

Infographics: show me the data
Tamara coxPalmetto
middle librarian
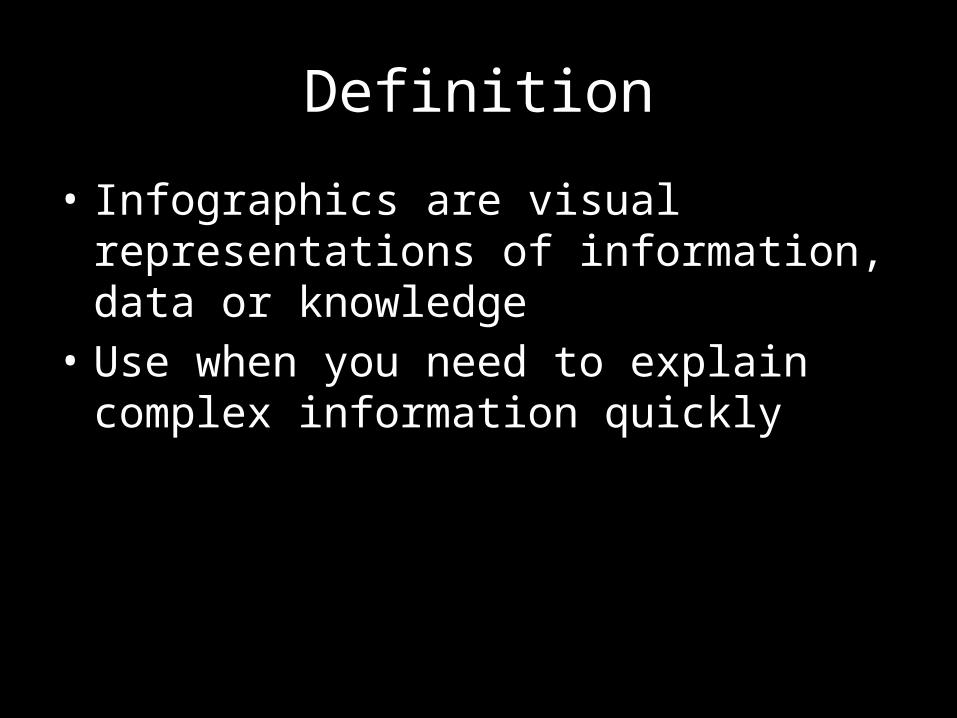
Definition
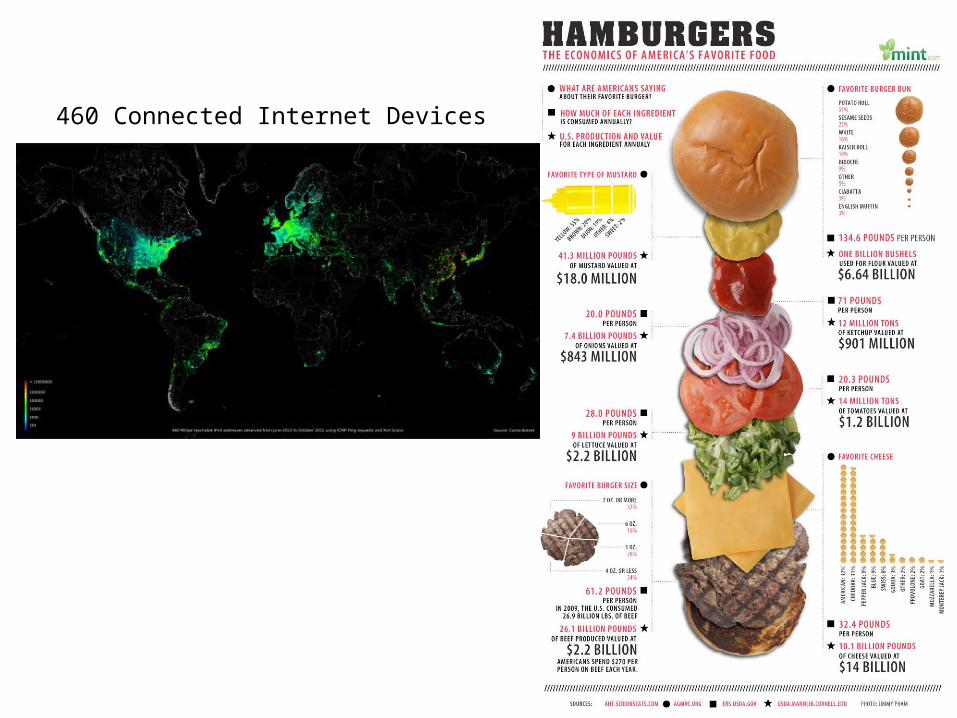
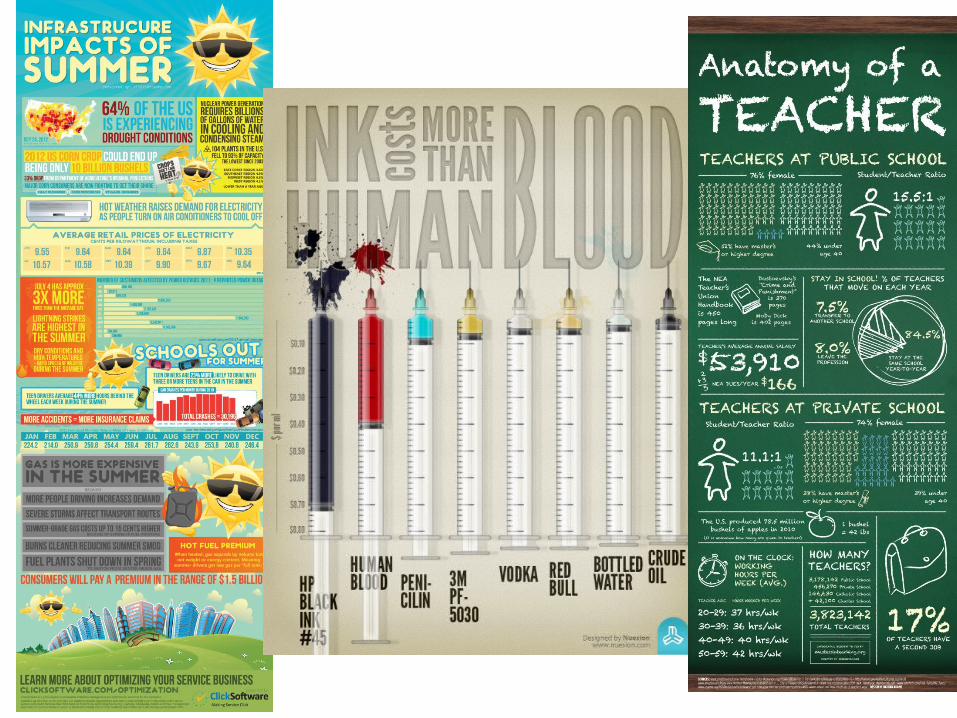
• Infographics are visual representations of information, data or knowledge
• Use when you need to explain complex information quickly


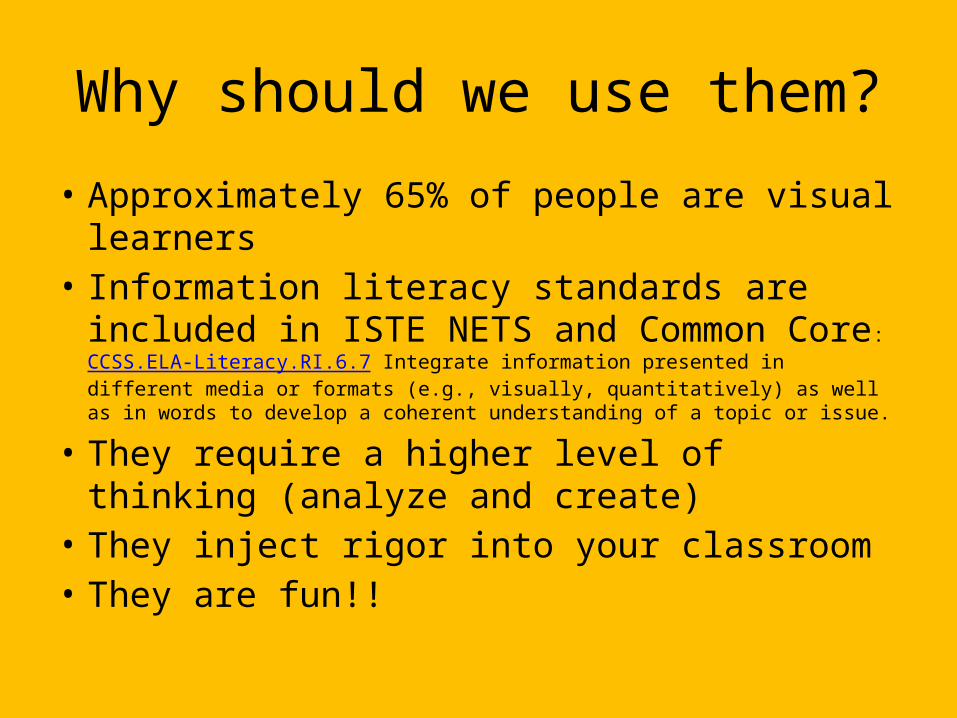
Why should we use them?
• Approximately 65% of people are visual learners• Information literacy standards are included in
ISTE NETS and Common Core: CCSS.ELA-Literacy.RI.6.7 Integrate information presented in different media or formats (e.g., visually, quantitatively) as well as in words to develop a coherent understanding of a topic or issue.
• They require a higher level of thinking (analyze and create)
• They inject rigor into your classroom• They are fun!!
Where do you find them?
Links:http://dailyinfographic.com/http://www.coolinfographics.com/http://pinterest.com

How do you use them with students?
• Share one for a warm up to introduce topic• Have students search for infographics on a topic and
share with the class• Compare two infographics on the same topic• Ask students to fact check infographics• Have students create math problems using data from
an infographic• Require students to locate and explain data from an
infographic• Have students create their own!
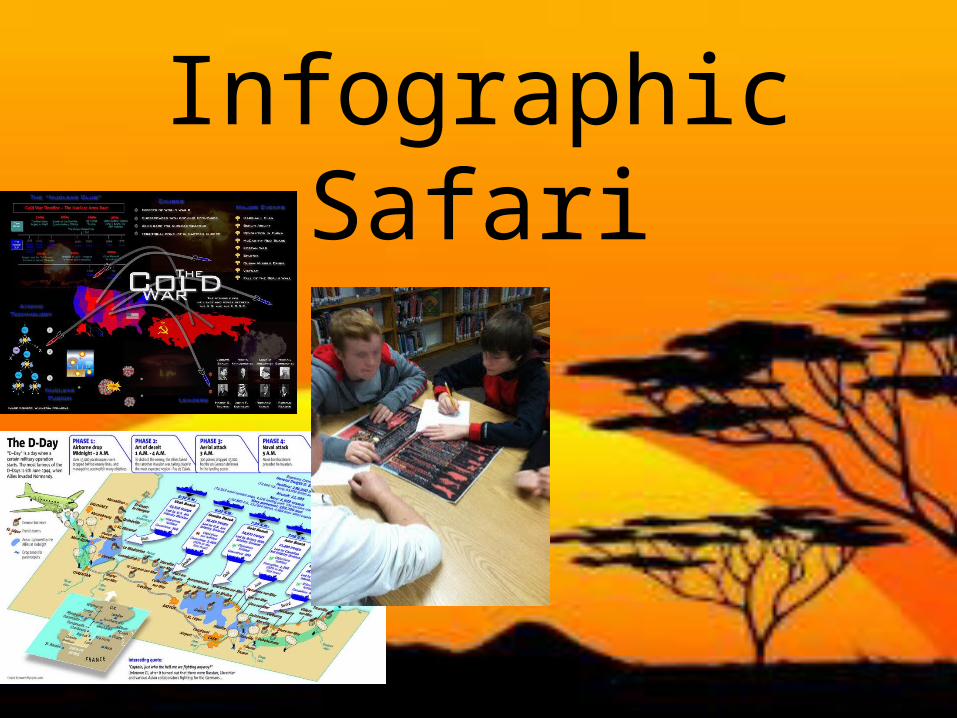
Infographic Safari
Mrs. Cox, Palmetto Middle Librarian, 2013

How can students create them?
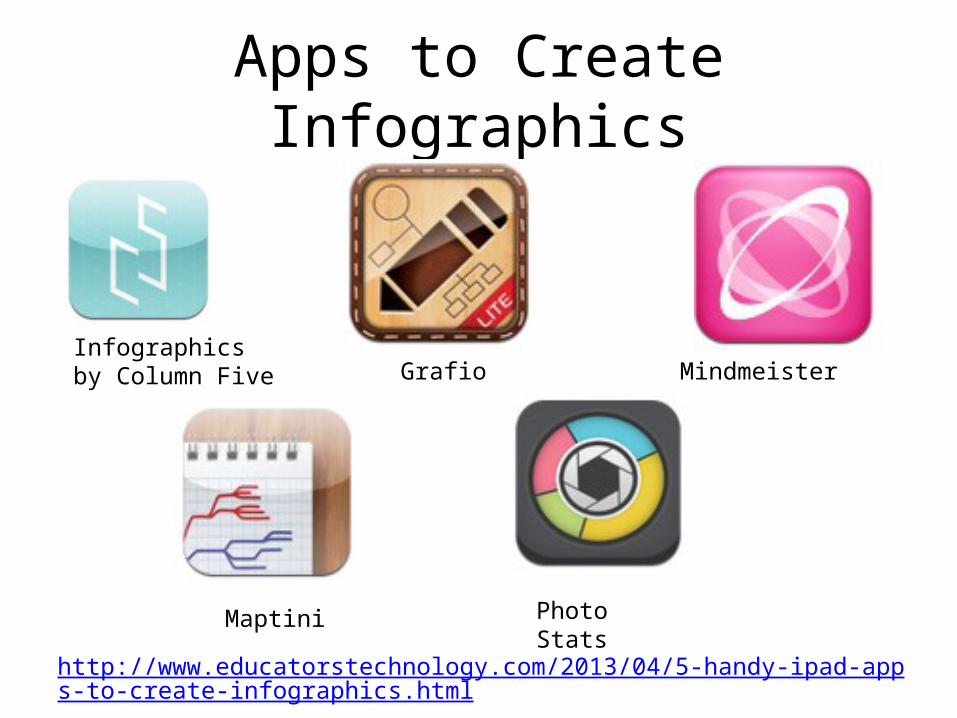
Apps to Create Infographics
Infographics by Column Five Grafio Mindmeister
Maptini Photo Stats
http://www.educatorstechnology.com/2013/04/5-handy-ipad-apps-to-create-infographics.html
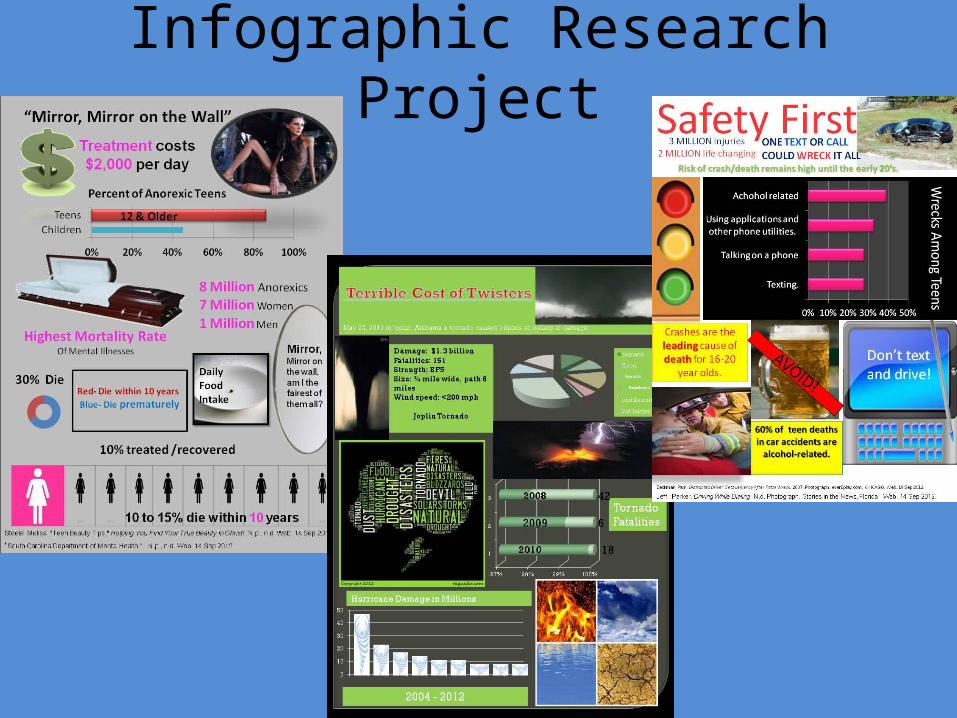
Infographic Research Project
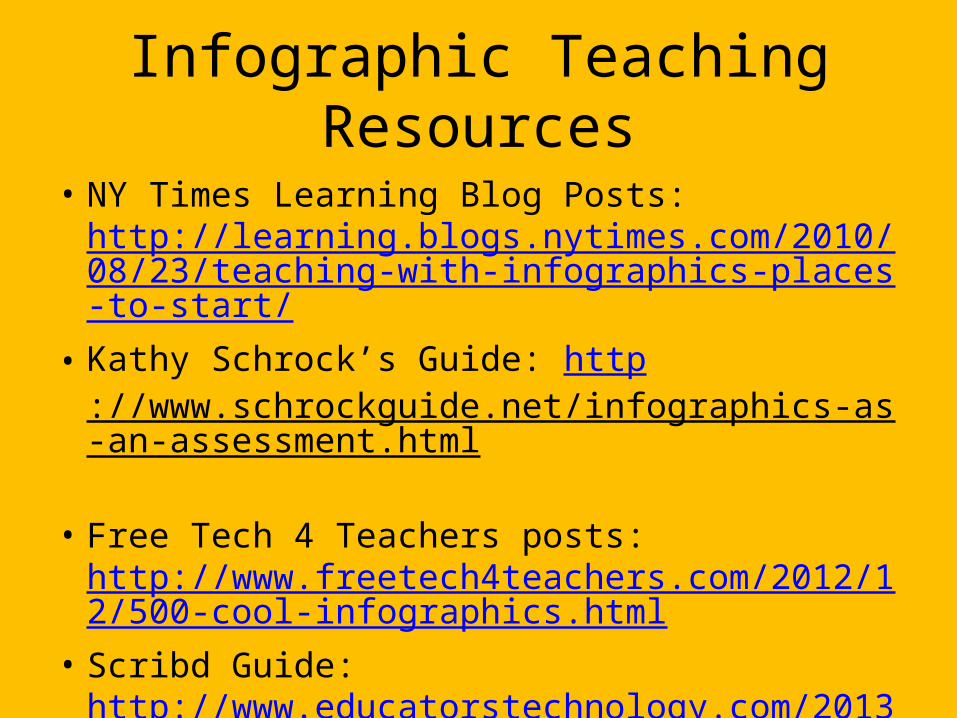
Infographic Teaching Resources
• NY Times Learning Blog Posts: http://learning.blogs.nytimes.com/2010/08/23/teaching-with-infographics-places-to-start/
• Kathy Schrock’s Guide: http://www.schrockguide.net/infographics-as-an-assessment.html
• Free Tech 4 Teachers posts: http://www.freetech4teachers.com/2012/12/500-cool-infographics.html
• Scribd Guide: http://www.educatorstechnology.com/2013/03/excellent-tips-and-tools-to-create.html
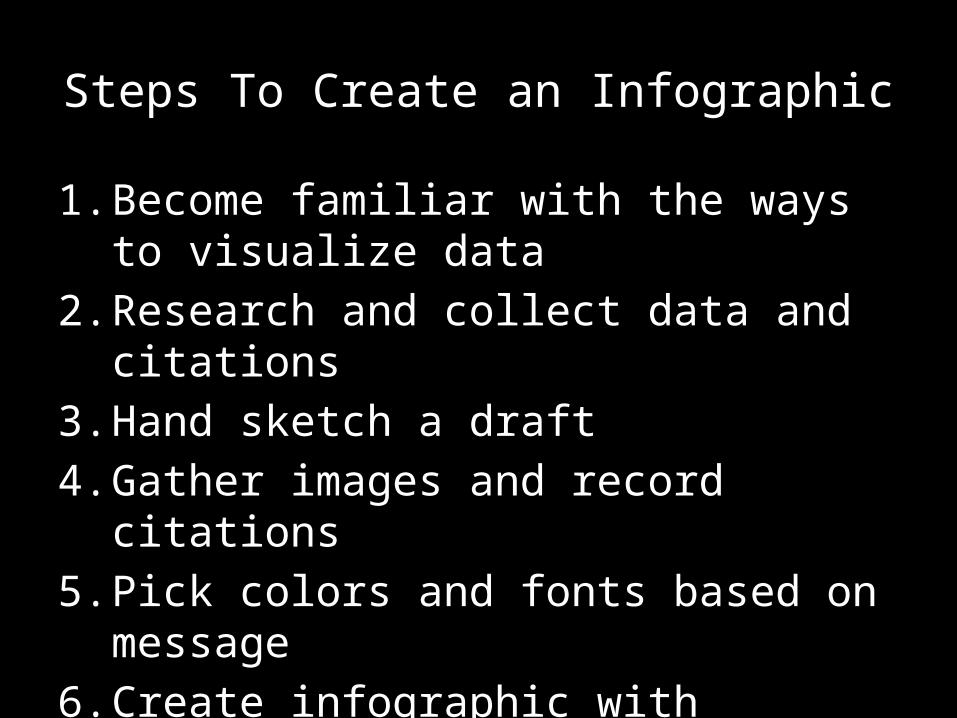
Steps To Create an Infographic
1. Become familiar with the ways to visualize data
2. Research and collect data and citations3. Hand sketch a draft4. Gather images and record citations5. Pick colors and fonts based on message6. Create infographic with citations
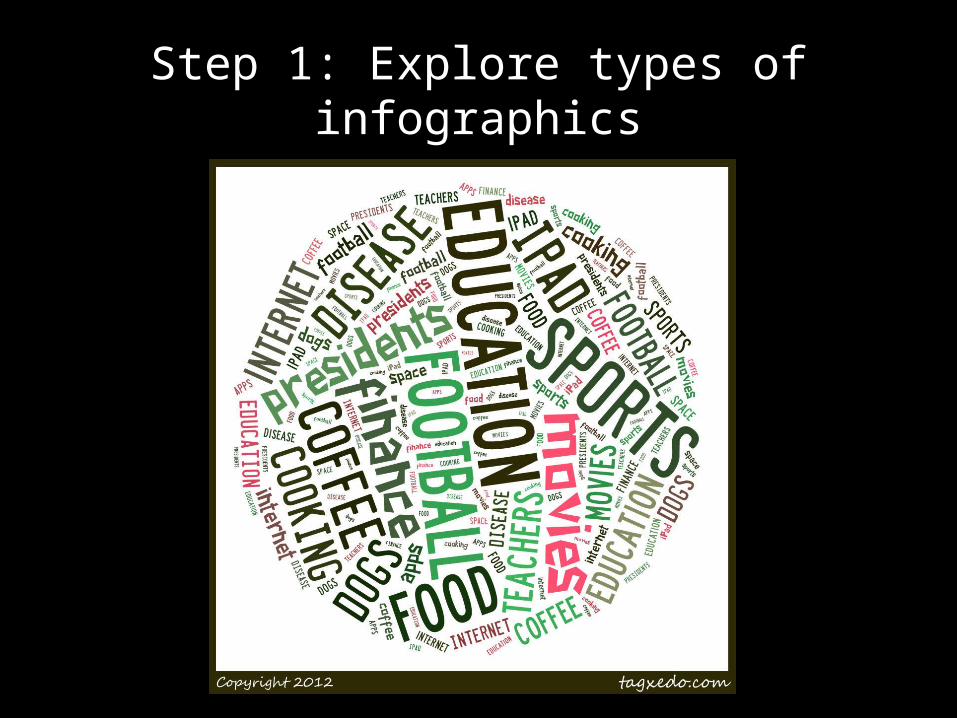
Step 1: Explore types of infographics

Step 2: Research and collect data
• Books• DISCUS Articles• Magazines• Newspapers• Web sites• Use citationmachine.net to create MLA
citations.

Step 3: Hand sketch a draft
http://www.123rf.com/photo_11073871_hand-drawn-infographics.html

Step 4: Gather images and cite
• Pics 4 Learning: http://www.pics4learning.com/
• Clip Art ETC: http://etc.usf.edu/clipart/• Edupics: http://www.edupics.com/• Photl: http://www.photl.com/• PicFindr: http://www.picfindr.com/

Step 5: Pick colors and fonts
Color Schemes That Work
• Yellow on blue blackground

Color Schemes That Work
• White on black background
Color Schemes That Work
• Black on yellow background
Colors to Avoid
• Red on green is hard for those with colorblindness

Colors to Avoid
• If you want to use red, go for burgundy instead
• Red causes an agitated emotional response

Colors Evoke Emotion
• Green makes the viewer feel involved with topic
• Blue indicates a calm message• Yellow is for hope and cheerfulness• Purple is childlike, save for “light” topics• Black indicates power
Fonts
• Type can express mood and emotion• Do not use more than three different fonts• Bookman, Garamond, and Times New
Roman are good for large blocks of text• Arial and Comic Sans are good for
headlines• Make limited use of CAPITAL LETTERS

Step 6: Create infographic and cite sources
• Power Point will be used to create the infographic
• Rubric Overview• Don’t forget citations

Power Point Tricks to Know
• Bring to Front, Send to Back• Set color transparent• Change slide orientation• Create graphs in Excel and Paste in• Save as JPEG

SourcesSchrock, Kathy. “Power Point Etiquette” Slideshare Presentation, http://www.slideshare.net/kathyschrock/powerpoint-for- administratorsLinks to infographics used:http://www.123rf.com/photo_11073871_hand-drawn-infographics.htmlhttp://idea4invention.com/articles/electric-car-inventions-timeline-infographichttp://www.mobypicture.com/user/JeeeM/view/ 7788306http://mashable.com/2012/07/18/lego-infographic/http://www.markedlines.com/a-roundup-of-25-jaw-dropping-infographics /http://www.clicksoftware.com/national-critical-planning-infrastructure-management-during-summer.htmhttp://www.coolinfographics.com/blog/2013/3/19/ink-costs-more-than-human-blood.htmlhttp://www.coolinfographics.com/blog/2013/3/22/460-million-connected-internet-devices.htmlhttp://visual.ly/anatomy-teacher