Page 1
[a] Undergraduate in Business Administration in Federal Technological University of Parana
(UTFPR), Curitiba, PR – Brazil. E-mail: [email protected]
[b] Doctor in Business Administration at Pontifical Catholic University of Parana (UTFPR). Professor
of Federal Technological University of Parana (UTFPR), Curitiba, PR – Brazil. E-mail: andecata-
[email protected] [c] Doctor in Production Engineering at Federal University of Santa Catarina (UFSC), Santa Catarina,
SC – Brazil. E-mail: [email protected] [d] Undergraduate in Mechanical Engineering in Federal Technological University of Parana
(UTFPR), Curitiba, PR – Brazil. E-mail: [email protected]
Due to the favorable characteristics such as climate and topography, the Agribusiness represents much of the generation of wealth in Brazil. Considering this importance, the objective of this re-search was to identify how many cows of the Dutch and Jersey breeds are required for a small milk producer get profit with its production of Brazilian. For this, the cash flows and the NPV were calcu-lated. The NPV was calculated under deterministic and probabilistic aspects, performing a Monte Carlo simulation and afterwards a Sensitivity Analysis, illustrating the variable parameters that more influence in the outcome of the NPV. It was noticed that the selling price of a liter of milk and the amount of liters of milk produced per cow are the parameters which most affect the NPV. The results showed that there is a need for at least 33 cows of Dutch breed or 43 cows of Jersey breed for the project to generate wealth to the producer.
Keywords: Milk Production. Cows. Investment Analysis. Monte Carlo. Sensitivity Analysis.
Page 2
Financial viability for milk production of Dutch and Jersey breeds: An analysis through Monte Carlo simulation and Sensitivity Analysis
Due to the favorable characteristics such as climate and topography, repre-
sents a large part of Brazil’s economy. This sector is responsible for approximately
26.7% of GDP, 37% of jobs and 36% of exports, putting the country in first place in
the export of alcohol, sugar, coffee, soy, beef, pork and chicken (ZAMBOLIN et al.,
2008).
The cattle are included in this context. In 2011 the herd in Brazil was counting
on 39.5 million, equivalent to 9.1 million tons. Internal consumption was up 7.6 mil-
lion tons (83.5% of production), exports 1.5 million tons (16.5%) and imports 30
thousand tons (0.3% of production) (LEMOS, 2013).
Within the cattle sector is the dairy. It moves approximately U$ 10 billion per
year, employing 3 million people annually, earning 20 billion liters of milk. Between
1990 and 2000 the production in Brazil grew 37%. The Midwest is responsible by
35% of the national herd. The country requires approximately 25.5 billion liters of
milk a year to meet its domestic market. Due to the high number of economic agents
who work in the system and the numerous marketing channels, the dairy market is
quite complex (CARVALHO et al., 2002). In this scenario, the goal of research of this
article is: what amount of cows of Dutch and Jersey breed are needed to make milk
production financially viable?
The study is justified given that even with the increased production of 14.4 bil-
lion liters in 1990 to about 26 billion liters in 2007, productivity has increased by
only 60%, considered low compared with developed countries. Some factors were
the big birthing intervals, the inefficient labor, inadequate management, among oth-
ers. For these indices to change, the producer/exporter of milk must pay attention to
the quality of the product, and several technologies are available at different costs
(MIRANDA; DINIZ; ANDREOLI, 2008).
In addition, it is necessary that the producers analyze the viability of the busi-
ness, since if it is not feasible, production can be discontinued and the country does
not move forward in increasing productivity. In the theoretical point of view, several
studies has been researching financial viability in the rural context (PERES et al.,
2009; LEAL et al., 2009; BROZOZOWSKI; ZMARLICKI, 2010; SEREIA et al., 2010; SIL-
VA; FERREIRA; FERREIRA, 2011; SABBAG; NICODEMO, 2011; SILVA et al., 2012;
CATAPAN et al., 2012; RONQUE et al., 2013; SOUZA; GARCIA, 2013; LIMA et al.,
2015).
This article is divided in four sections, in addition to this introduction. The se-
cond section brings the theoretical framework of research, followed by a third sec-
tion that illustrates the methodology used for the development of the article. After-
wards the research results are presented followed by the results of the numerical
analysis and the conclusions.
This section brings the theoretical framework necessary to support the theo-
retical research, addressing first, aspects of milk production and finally, on financial
viability.
Page 3
According to the IPARDES (Parana’s institute for Economic and Social Devel-
opment) (2009) the increase in milk productivity in 1996 to 2006 in the State of
Paraná was of 71%.The same Institute (2009) states that 86.7% of producers are
satisfied with this activity and 93.5% wish to continue in the business.
Schmitz and Santos (2013) discourse about the growth of the market regard-
ing the UHT milk, which requires a quick treatment and processing of fresh milk
what impacts small producers, focus of this research. Investments in new technolo-
gies become mandatory for maintenance of the producer.
Investment requires planning. The producer of milk, as well as every entre-
preneur needs to know how to manage its activities and resources. The main factors
that may interfere with the activity of the dairy product, considering the internal
context are: genetics, diet, reproduction and health of animals (MIRANDA et al.,
2008).
The race with the highest dairy expertise and therefore the most used is the
Dutch race. Although it’s the most expensive to start the business, like other animals
of European origin, requires more careful both in comfort as in handling, suffering
more with the difference of Brazil’s tropical climate (MIRANDA; FREITAS, 2009).
Silva et al. (2011), complements that medium-sized Dutch cows are equivalent
to large cows from other breeds, in terms of performance in milk production. How-
ever the Jersey cows, not so used in Brazil, are very satisfactory in their performanc-
es of production in tropical climates (GONZALES, 2007). Being addressed the aspects
related to milk production, the next section talks about financial viability.
Feasibility analyses projects aim to understand the viability of certain ideas,
and so, when there is an opportunity to invest. This process begins with the collect-
ing and processing of information that, later, after properly analyzed, may permit to
test the feasibility of an investment opportunity (FRIZZONE; ANDRADE Jr, 2005).
In this perspective, the feasibility analysis is also known as investment analysis
and aims to identify the best alternative of financial return for a given investment to
be held by a company (CARMONA, 2009; OGATA et al., 2014) and, therefore, any
investments need to be evaluated according to their opportunity (OGATA et al.,
2014).
To analyze an investment alternative, there is a need for the definition of ap-
propriate criteria to aid in the analysis and decision of choosing between the more
advantageous alternatives (CAMARGO, 2007). Thus, understanding the necessity of
selection of various indicators to assist in feasibility analysis, this research will
measure the Net Present Value (NPV) and Internal Rate of Return (IRR) of the pro-
ject.
The net present value (NPV) of a project is the expected return on the date ze-
ro discounted the initial investment. Whereas the return to be analyzed must be dis-
counted, it is necessary to establish, first, the discount rate.
Page 4
Financial viability for milk production of Dutch and Jersey breeds: An analysis through Monte Carlo simulation and Sensitivity Analysis
Casarotto Filho and Kopittke (2010) explains that when it is found and later
analyzed a proposed investment should be considered the fact that you're losing the
opportunity to obtain the same return capital in another project, that is, the oppor-
tunity cost of money. So, understanding that the discount rate or cost of opportunity
in a project can be defined as Minimum Attractive Rate of Return (MARR), Souza and
Clement (2009) explains that the MARR is the best rate, whereas a low degree of risk,
available for implementation of the capital.
Camargo (2007) set the MARR as minimum gain that the company has with a
next-best alternative use of capital, when used its own resources to finance an in-
vestment. Ogata et al. (2014) explain the basis for your estimate is the interest rate
on the market, in which, the ones that most impact are: Basic Financial Rate; the Ref-
erence Rate; the long-term interest Rate and System Fee Settlement and Custody.
However, there is a difficulty in establishing an accurate value to MARR for use of the
de-capitalization of the projected cash flow, due to oscillations and the varieties of
these rates, already cited (OGATA et al., 2014).
Presented the MARR, the NPV, according to Frizzone and Andrade Junior
(2005), is an indicator that shows an expected capital gain above (if positive) or be-
low (if negative) the expected return considering the minimum rate of attractiveness.
In this sense, will be attractive when the VPL expected was equal to or greater than
zero and rejected when the NPV is negative (FRIZZONE; ANDRADE Jr., 2005). The
Formula 1 illustrates the calculation of NPV.
n
j ji
CFjNPV
0 )1(
][ [1]
Being: n = time of the project in months; CFj = cash flow discounted per period; i = discount factor.
The ease of interpretation of the results of the NPV and the minimization of its
interpretive error makes this a robust analysis technique, as the net present value is
the sum of the present values of each of the cash flows-both positive and negative-
that occur over the life of the project (DAMODARAN, 2004).
Frizzone and Andrade Junior (2005) point out that the NPV is a measure in
currency, which requires the definition of a discount rate since there may be multiple
values of NPV, one for each discount rate considered. Thus, the appropriate discount
rate for the NPV is the one which increases security in the decision, since it assumes
that cash flows generated can be reinvested to discount rate considered (FRIZZONE;
ANDRADE Jr., 2005).
Souza and Clement (2008) explain that it is a robust investment analysis tech-
nique, which is the most known and used, and can be summed up as the concentra-
tion of all the values expected from a cash flow in zero date.
Another index that evaluates the investment project is the internal rate of re-
turn (IRR), which to Souza and Clement (2009) is the rate that makes the NPV of a
cash flow equal to zero and, therefore, is the rate that makes the value of future prof-
its equivalent to the expenses with the project. So, is characterized as a rate of return
Page 5
on capital invested (SOUZA; CLEMENTE, 2009). Therefore, considering that this rate
sets the NPV to zero, the Formula 2 illustrates the calculation of IRR, considering the
NPV formula, but setting in to zero, and using as variable the discount rate.
n
j jIRR
CFj
0 )1(
][0 [2]
Being: n = time of the project in months; CFj = cash flow discounted per period; IRR = internal rate of return.
Lemes Júnior, Rigo and Cherobim (2010) explain, in line with the Formula 2
presented, that the Internal Rate of Return is the rate which equals the cash flow in
relation to the amount to be invested in the project.
The practical use of the IRR method is typically used in deployment projects or
industrial expansion as compared to the regular indexes of the sector to which the
project refers (CASAROTTO FILHO; KOPITTKE, 2010). Thus, the robustness of this
method increases, since it allows comparability.
This section includes the research methodology and is divided into: (i) Re-
search Outline; and, (ii) Processing of data.
All researches aim to find a solution to a problem, investigation, questioning
the reality to generate knowledge (PÁDUA, 2014). According to Bassett Jr. and Feres
Jr. (2011) there are three stages of research: bibliographical research, observation of
facts and data collection. To carry out this research, it was used these three steps.
The literature research can be performed with already published materials (books,
scientific articles) (SILVA; MARK, 2005).
The first part, concerning bibliographical research of this study, began with
questionnaires sent to the Brazilian Agricultural Research Corporation (EMBRAPA)
to begin the search for materials on the topic. With the collected material the two
breeds were chosen (Dutch and Jersey). After this initial step, bibliographic searches
were made in order to contextualize the subject and study the work produced in the
area.
The second step is the observation of facts, to this end, was necessary the
preparation of questionnaires to be sent to producers. According to Nogueira (2002),
the questionnaires are used to raise information and, in this research, it was used
three ways of acquiring the information, being those: (i) open: show all possible an-
swers; (ii) direct: offers directly the desired response; and, (iii) assisted: enables the
monitoring and coordination of direct questions to the interviewed.
According to Miguel (2010), the purpose of a detailed interview is not to pro-
vide or identify responses only to specific questions, but attempt to understand the
Page 6
Financial viability for milk production of Dutch and Jersey breeds: An analysis through Monte Carlo simulation and Sensitivity Analysis
experience of other people. In this case these were important for the knowledge and
iteration of the researcher with the object of study. The interviews are important to
data collection for a more clearly preparation of tables (FERRER, 2012), which were
the base for the completion of the study.
The second step had as main objective the identification of factors that alter
the profit of dairy production as investments, inputs, outputs, taxes. The calculation
of these values was based on interviews with dairy farmers of São José dos Pinhais,
metropolitan region of Curitiba, in Paraná State, Brazil. The choice of this city speci-
fies the easy contact with these professionals.
The interviews were recorded, transcribed and had their content analyzed. For
better understanding, visits were carried out in rural properties, where there is pro-
duction of milk and subsequently analyzed spreadsheets provided by owners. With
the data gathered, the tables were organized, with cash flows for each race.
For definition of the number of cows required to achieve financially viable
dairy production, were projected monthly cash flows foreach cow (it was a prede-
termined Minimum Rate of attractiveness of 1% per month), defined the fixed initial
investments, dependent on the structure for the milk production, and the variable
initial investment, dependent on the number of cows. Thus, it was determined that
when the Net Present Value (NPV), which represents the wealth generated by the
project. The number of cows required to achieve Net Present Value equals to zero is
the minimum required number of cows for financial viability, i.e. the farmers won't
lose money with this minimum number. To calculate this value all the equations were
programed in MATLAB® and the equation for NPV was solved for number of cows.
The next section presents the data treatment.
The data treatment was performed in order to evaluate the influence of the
main parameters on the success of the milk business. To do that, it was specified a
range of variation for each of the parameters, then it was possible to simulate a real
variation that might occur in reality and the effect of it on the effectiveness of the
business. The names, values and range of variation for each of these parameters are
listed on Table 1.
Page 7
Table 1 - Parameter names, values and range of variation
Parameter Investments Dutch Cow
Variation Jersey Cow Variation
1 Cow`s Price[R$] 8.000 ±10% 6.000 ±10%
Cash In
2 Liters of Milk Produced by 1 Cow in a Day [L] 30 ±10% 18 ±10%
3 Poorness Factor [#] 0,25 ±10% 0,25 ±10%
4 Price of 1Liter of Milk [R$] 1,15 ±10% 1,13 ±10%
Variable Cash Out
5 Kg of Ration per Cow a Day [Kg] 10 ±10% 3 ±10%
6 Price of 1 Kg of Ration [Kg] 0,95 ±10% 0,95 ±10%
Fixed Cash Out
7 Electric Energy [R$] 700 ±10% 700 ±10%
Source: prepared by the authors, 2015.
With these parameters a Monte Carlo simulation (CHINNECKET et al., 2006)
was performed. Monte Carlo is a full factorial analysis, which analyzes all the availa-
ble parameter combinations, for each of those combinations it was evaluated the
effectiveness of the business using a constant number of cows equals to thirty. When
this routine was completed a sensitivity analysis was performed, the goal was to
quantify which of the parameters are the most influential on the result.
The range of variation of the parameters was determined through possible
variations of these parameters and from the data collected by the interviews. The
range of variation was chosen to be constant so the results would only represent the
influence of the parameters strength on the result, since parameters with different
ranges of variation generates different results.
The main principle of the analysis is to isolate the effect of the variation of a
parameter, to do that, an algorithm was developed. It creates a matrix that lists all
available combinations of the seven chosen parameters, in this case it was 3^7 com-
binations, since it was evaluated the base value, the value plus the variation and the
value minus the variation, the result is, three possible values for each of the 7 param-
eters. For all those combinations the effectiveness of the business, measured by the
NPV, was evaluated.
Afterwards another algorithm that identifies the sets of combinations where
the parameter being analyzed is varying and all the others remain constant was
made. The routine was performed for each of the combinations of constant parame-
ters, then an average of the results is done, these values are divided by the total vari-
ation and the result is a quantification of how influent a parameter is.
After the Sensitivity Analysis the number of cows required in order to achieve
success in the business was determined. To do that, the equations were programed in
MATLAB® and solved for number of cows (the variable). The results were plotted for
the Dutch and Jersey cows.
Page 8
Financial viability for milk production of Dutch and Jersey breeds: An analysis through Monte Carlo simulation and Sensitivity Analysis
The results of the analysis of the data supplied by EMBRAPA (Brazilian agricul-
tural research Company) and interviews with workers in the area, what according to
Alves and Silva (1992) is highly used, it takes into account the speech, the context of
the interviewee to achieve maximum accuracy. With that, the next section shows the
result for the Dutch breed.
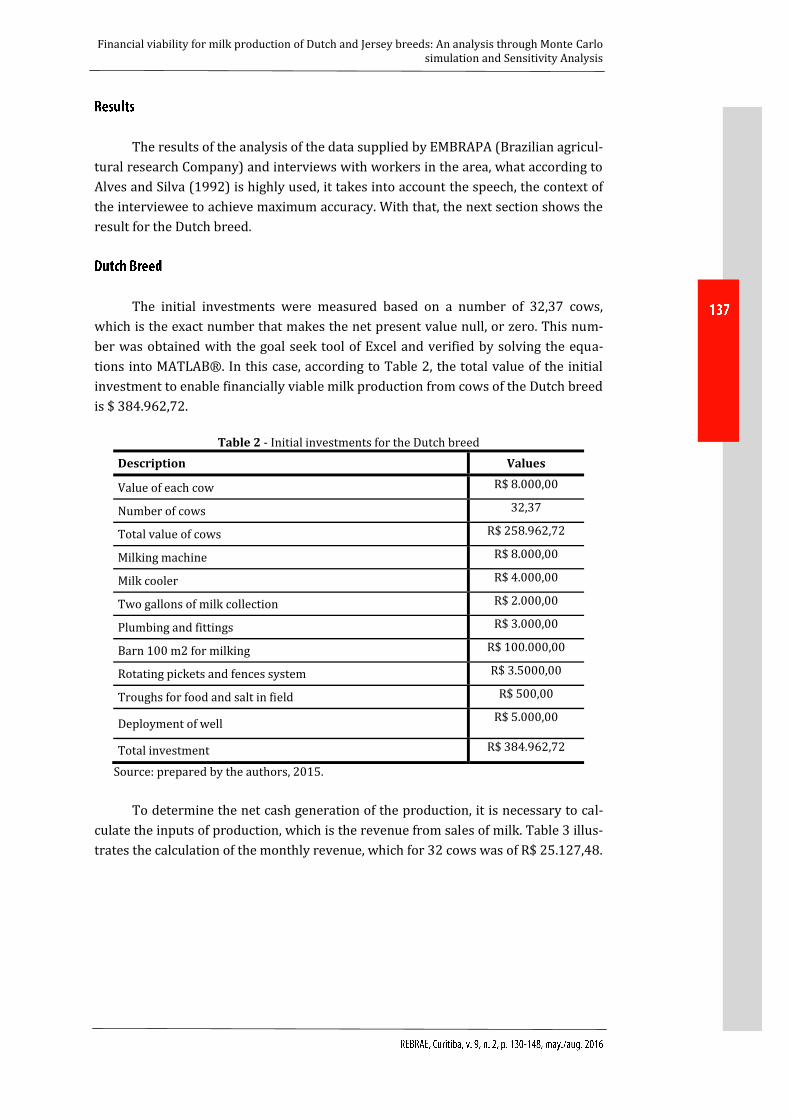
The initial investments were measured based on a number of 32,37 cows,
which is the exact number that makes the net present value null, or zero. This num-
ber was obtained with the goal seek tool of Excel and verified by solving the equa-
tions into MATLAB®. In this case, according to Table 2, the total value of the initial
investment to enable financially viable milk production from cows of the Dutch breed
is $ 384.962,72.
Table 2 - Initial investments for the Dutch breed
Description Values
Value of each cow R$ 8.000,00
Number of cows 32,37
Total value of cows R$ 258.962,72
Milking machine R$ 8.000,00
Milk cooler R$ 4.000,00
Two gallons of milk collection R$ 2.000,00
Plumbing and fittings R$ 3.000,00
Barn 100 m2 for milking R$ 100.000,00
Rotating pickets and fences system R$ 3.5000,00
Troughs for food and salt in field R$ 500,00
Deployment of well R$ 5.000,00
Total investment R$ 384.962,72
Source: prepared by the authors, 2015.
To determine the net cash generation of the production, it is necessary to cal-
culate the inputs of production, which is the revenue from sales of milk. Table 3 illus-
trates the calculation of the monthly revenue, which for 32 cows was of R$ 25.127,48.
Page 9
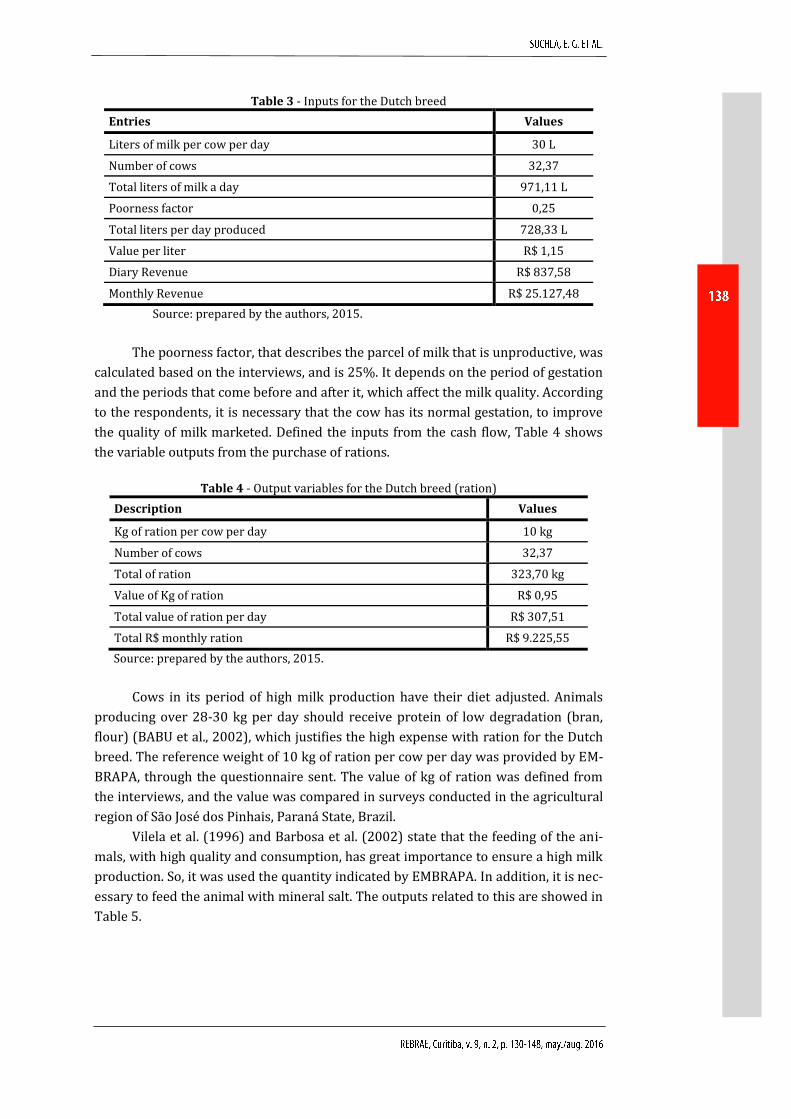
Table 3 - Inputs for the Dutch breed
Entries Values
Liters of milk per cow per day 30 L
Number of cows 32,37
Total liters of milk a day 971,11 L
Poorness factor 0,25
Total liters per day produced 728,33 L
Value per liter R$ 1,15
Diary Revenue R$ 837,58
Monthly Revenue R$ 25.127,48
Source: prepared by the authors, 2015.
The poorness factor, that describes the parcel of milk that is unproductive, was
calculated based on the interviews, and is 25%. It depends on the period of gestation
and the periods that come before and after it, which affect the milk quality. According
to the respondents, it is necessary that the cow has its normal gestation, to improve
the quality of milk marketed. Defined the inputs from the cash flow, Table 4 shows
the variable outputs from the purchase of rations.
Table 4 - Output variables for the Dutch breed (ration)
Description Values
Kg of ration per cow per day 10 kg
Number of cows 32,37
Total of ration 323,70 kg
Value of Kg of ration R$ 0,95
Total value of ration per day R$ 307,51
Total R$ monthly ration R$ 9.225,55
Source: prepared by the authors, 2015.
Cows in its period of high milk production have their diet adjusted. Animals
producing over 28-30 kg per day should receive protein of low degradation (bran,
flour) (BABU et al., 2002), which justifies the high expense with ration for the Dutch
breed. The reference weight of 10 kg of ration per cow per day was provided by EM-
BRAPA, through the questionnaire sent. The value of kg of ration was defined from
the interviews, and the value was compared in surveys conducted in the agricultural
region of São José dos Pinhais, Paraná State, Brazil.
Vilela et al. (1996) and Barbosa et al. (2002) state that the feeding of the ani-
mals, with high quality and consumption, has great importance to ensure a high milk
production. So, it was used the quantity indicated by EMBRAPA. In addition, it is nec-
essary to feed the animal with mineral salt. The outputs related to this are showed in
Table 5.
Page 10
Financial viability for milk production of Dutch and Jersey breeds: An analysis through Monte Carlo simulation and Sensitivity Analysis
Table 5 - Output variables for the Dutch race (mineral salt).
Description Values
Grams of salt per cow per day 30 g
Number of cows 32,37
Total grams of salt per day 971,11 g
Cost Kg of salt R$ 10,00
Total cost of salt per day R$ 9,71
Total monthly costof salt R$ 291,33
Source: prepared by the authors, 2015.
The value of mineral salt necessary for the completion of the animal nutrition
was collected in questionnaires sent to EMBRAPA. Therefore, the total cost with min-
eral salt per month is R$ 291,33. So, adding the cost on rations and mineral salt, con-
sidering 32,37 cows, the total value is around R$ 9.516,88. There are also fixed costs
in nature for the maintenance of the herd, which are shown in Table 6.All values
measured in Table 6were obtained from interviews.
Table 6 - Fixed Outputs for the Dutch breed.
Description Values
Energy (rural rate)-lighting, milking machine and pump well R$ 700,00
Labor R$ 2.500,00
Payroll taxes of the employee R$ 1.175,00
Maintenance equipment (2%) R$ 340,00
Monthly Inspection Veterinarian R$ 750,00
De-worming medication and medicines (0.05% on value of cows) R$ 1.294,814
Italian ryegrass R$ 162,50
Millet R$ 125,00
Source: prepared by the authors, 2015.
The value measured on the payroll taxes of the employees are the employer’s
social security contributions, including: the National Institute of Social Security, the
Guarantee Fund On the Length of Service, Thirteenth Salary (which must be provi-
sioned month by month) and Vacations plus Third of the Vacations (which should
also be provided for month by month). Thus, Table 7illustrates the taxes and their
percentages applied to the gross salary of the employee.
Table 7 - Payroll taxes
INSS 20%
FGTS 8%
13. Salary 8,33%
Vacation + constitutional Third 11,11%
Source: prepared by the authors, 2015.
Page 11
So, considering the initial investment measured, calculated inputs and outputs,
it was projected the cash flow of the project to calculate the NPV of the same, with a
period of 60 months or 5 years. The choosing of the period was based on interviews,
since the productive period with maximum efficiency and quality of milk is 5 years
satisfactory. After this period the cow starts to decrease their production, which
affects the revenue generated for the same. So, it is feasible to purchase new cows.
Residual values were not considered in the project. Table 8 illustrates the cash flow
projection.
Table 8 - Projected Cash flow for the Dutch breed
Source: prepared by the authors, 2015.
Table 12 has an NPV equals to 0 and IRR equals MARR, which illustrates that
with 32 cows the producer won't lose money on this project. Also, if you choose to
use an amount higher than 32 cows, the project will generate cash and, therefore,
becomes financially viable. Presented the survey results to the context of the Dutch
race, the next section illustrates the results for the Jersey breed.
Following the same methodology than for the Dutch cow, for the Jersey breed
are required 42.38 cows so that the net present value is null or equal to zero. Table
9shows that the total value of the initial investment to enable financially viable milk
production from cows of the Jersey breed is of R$ 380,322.83.
Table 9 - Investments for the Jersey breed
Description Values
Value of each cow R$ 6.000,00
Number of cows 42,39
Total value of cows R$ 254.322,83
Milking machine R$ 8.000,00
Milk cooler R$ 4.000,00
Two gallons of milk collection R$ 2.000,00
Plumbing and fittings R$ 3.000,00
Barn 100 m2 for milking R$ 100.000,00
Rotating pickets and fences system R$ 3.500,00
Troughs for food and salt R$ 500,00
Deployment of well R$ 5.000,00
Total investment R$ 380.322,83
Source: prepared by the authors, 2015.
Month 0 1 2 ... 60
Inputs 0 R$ 25.127,48 R$ 25.127,48 R$ 25.127,48
Outputs R$384.962,72 R$ 16.564,19 R$ 16.564,19 R$ 16.564,19
Cash Flow - R$ 384.962,72 R$ 8.563,28 R$ 8.563,28 R$ 8.563,28
Discounted
R$ 8.478,49 R$ 8.394,55 R$ 4.713,65
Page 12
Financial viability for milk production of Dutch and Jersey breeds: An analysis through Monte Carlo simulation and Sensitivity Analysis
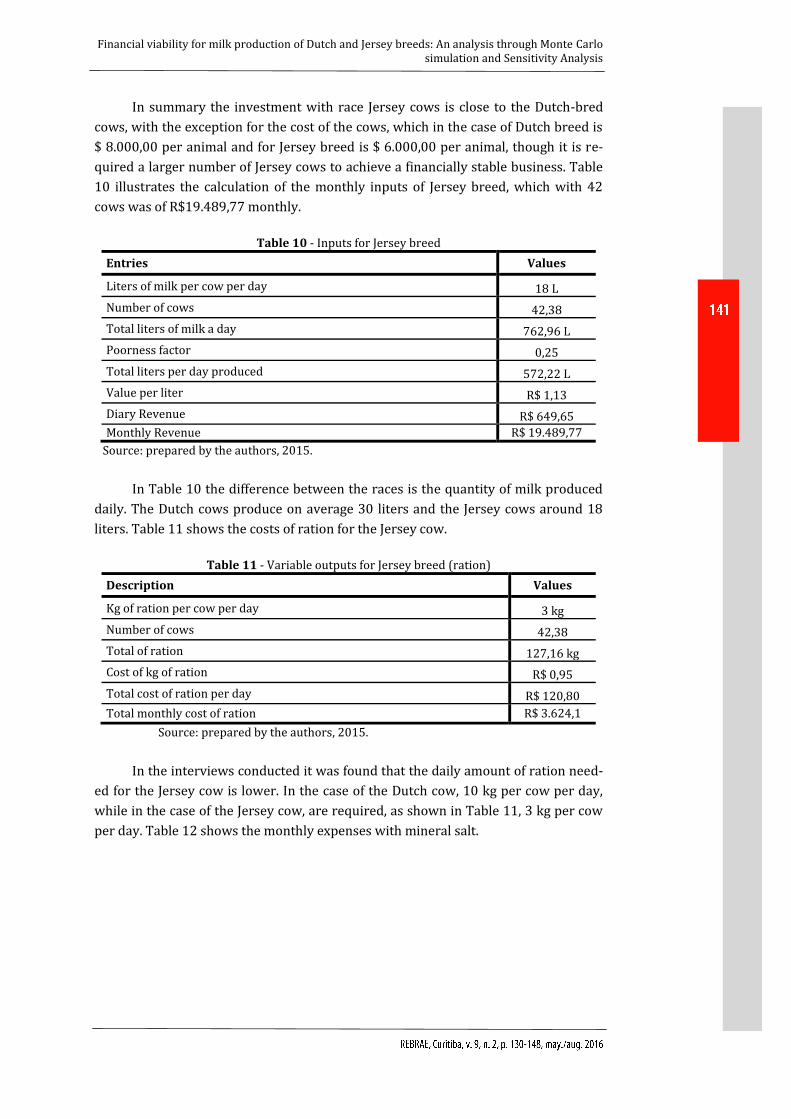
In summary the investment with race Jersey cows is close to the Dutch-bred
cows, with the exception for the cost of the cows, which in the case of Dutch breed is
$ 8.000,00 per animal and for Jersey breed is $ 6.000,00 per animal, though it is re-
quired a larger number of Jersey cows to achieve a financially stable business. Table
10 illustrates the calculation of the monthly inputs of Jersey breed, which with 42
cows was of R$19.489,77 monthly.
Table 10 - Inputs for Jersey breed
Entries Values
Liters of milk per cow per day 18 L
Number of cows 42,38
Total liters of milk a day 762,96 L
Poorness factor 0,25
Total liters per day produced 572,22 L
Value per liter R$ 1,13
Diary Revenue R$ 649,65
Monthly Revenue R$ 19.489,77
Source: prepared by the authors, 2015.
In Table 10 the difference between the races is the quantity of milk produced
daily. The Dutch cows produce on average 30 liters and the Jersey cows around 18
liters. Table 11 shows the costs of ration for the Jersey cow.
Table 11 - Variable outputs for Jersey breed (ration)
Description Values
Kg of ration per cow per day 3 kg
Number of cows 42,38
Total of ration 127,16 kg
Cost of kg of ration R$ 0,95
Total cost of ration per day R$ 120,80
Total monthly cost of ration R$ 3.624,1
Source: prepared by the authors, 2015.
In the interviews conducted it was found that the daily amount of ration need-
ed for the Jersey cow is lower. In the case of the Dutch cow, 10 kg per cow per day,
while in the case of the Jersey cow, are required, as shown in Table 11, 3 kg per cow
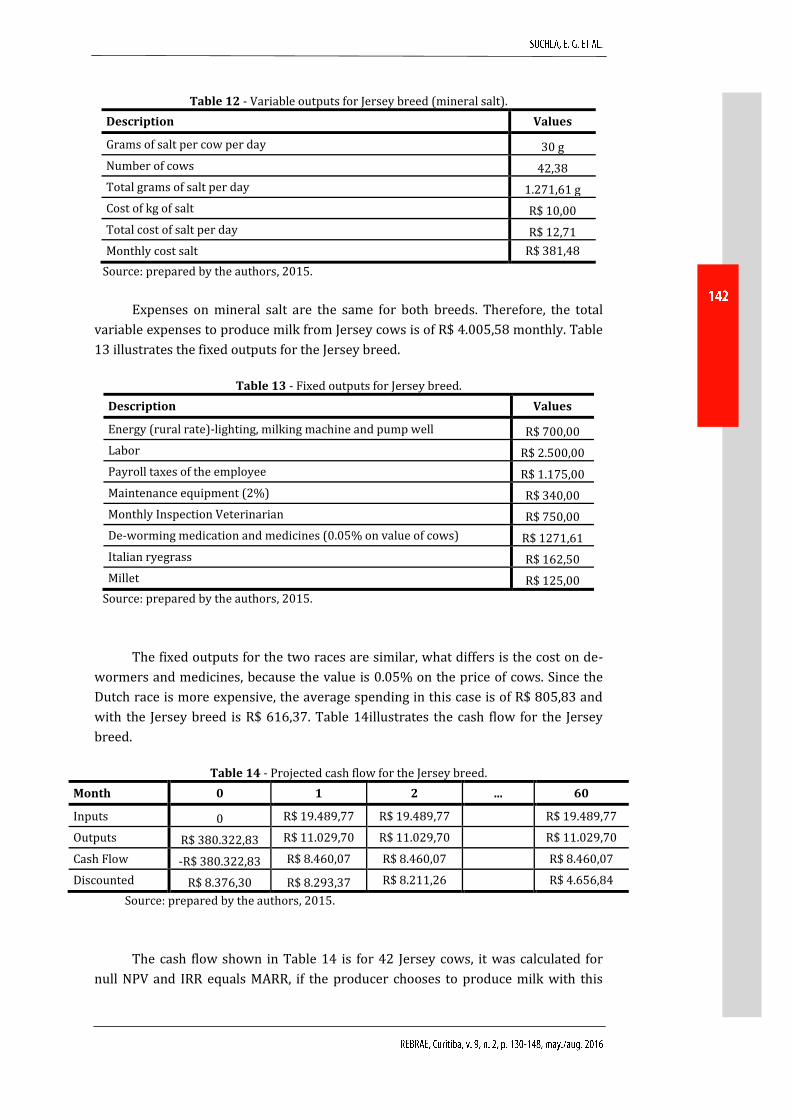
per day. Table 12 shows the monthly expenses with mineral salt.
Page 13
Table 12 - Variable outputs for Jersey breed (mineral salt).
Description Values
Grams of salt per cow per day 30 g
Number of cows 42,38
Total grams of salt per day 1.271,61 g
Cost of kg of salt R$ 10,00
Total cost of salt per day R$ 12,71
Monthly cost salt R$ 381,48
Source: prepared by the authors, 2015.
Expenses on mineral salt are the same for both breeds. Therefore, the total
variable expenses to produce milk from Jersey cows is of R$ 4.005,58 monthly. Table
13 illustrates the fixed outputs for the Jersey breed.
Table 13 - Fixed outputs for Jersey breed.
Description Values
Energy (rural rate)-lighting, milking machine and pump well R$ 700,00
Labor R$ 2.500,00
Payroll taxes of the employee R$ 1.175,00
Maintenance equipment (2%) R$ 340,00
Monthly Inspection Veterinarian R$ 750,00
De-worming medication and medicines (0.05% on value of cows) R$ 1271,61
Italian ryegrass R$ 162,50
Millet R$ 125,00
Source: prepared by the authors, 2015.
The fixed outputs for the two races are similar, what differs is the cost on de-
wormers and medicines, because the value is 0.05% on the price of cows. Since the
Dutch race is more expensive, the average spending in this case is of R$ 805,83 and
with the Jersey breed is R$ 616,37. Table 14illustrates the cash flow for the Jersey
breed.
Table 14 - Projected cash flow for the Jersey breed.
Month 0 1 2 ... 60
Inputs 0 R$ 19.489,77 R$ 19.489,77 R$ 19.489,77
Outputs R$ 380.322,83 R$ 11.029,70 R$ 11.029,70 R$ 11.029,70
Cash Flow -R$ 380.322,83 R$ 8.460,07 R$ 8.460,07 R$ 8.460,07
Discounted R$ 8.376,30 R$ 8.293,37 R$ 8.211,26 R$ 4.656,84
Source: prepared by the authors, 2015.
The cash flow shown in Table 14 is for 42 Jersey cows, it was calculated for
null NPV and IRR equals MARR, if the producer chooses to produce milk with this
Page 14
Financial viability for milk production of Dutch and Jersey breeds: An analysis through Monte Carlo simulation and Sensitivity Analysis
amount of cows, he won't lose or make money. If he chooses a higher amount, it will
add value to the project.
The needed number of cows for each of the combinations was calculated and
the results are shown in Figure 1. The horizontal axis refers to each of the analysis
run with a set of combinations.
It is possible to see that, in the majority, the required number of Dutch cows
(in blue) is lower than the number of Jersey cows (in red) for similar conditions, but
in certain combinations of parameters the number is much higher. These peaks rep-
resent the worst case scenarios for the analysis, where the costs are the highest and
the income is the lowest. Since the values of the costs are higher for the Dutch cow
than for the Jersey cows, the outcome of the variation is a much higher number of
cows needed in those cases.
The solution, number of required cows, showed to be really sensitive to the
price of milk, a small variation of this quantity causes a big deviation of the solution.
The analysis done with the Jersey cow proved to be more numerically stable than for
the Dutch cow, this is a result of the values and range of variation of the parameters
used. The average number of cows is 40.1196 and 46.4195 for the Dutch and Jersey
cows respectively.
Figure 1 - Number of cows needed vs. combination number
Source: prepared by the authors, 2015.
The sensitivity analysis results are shown in Figure 2 and in Figure 3. Some of
the parameters have the exact same value of influence on the result. This is explained
by the fact that they are multiplied linearly in the equations used to evaluate the
success of the business, so the influence must be the same. The Price of a Liter of Milk
Page 15
has the same influence than the Liters of Milk Produced per Cow per Day and they
are the most influential parameters for both cows.
The parameters related to the ration (price and quantity) influence more the
Dutch than the Jersey cows, this is explained by the difference of ration per day that
each cow consumes, the Dutch cows eat much more ration than the Jersey ones, due
to that, the effect on cost is higher.
Figure 2 - Sensitivity analysis results for Dutch cow
Source: prepared by the authors, 2015.
The cost of each cow is more influential in the case of Jersey cows than for the
Dutch cows, the explanation comes from the fact that are needed more Jersey cows
than Dutch to have profit in the business. Because of it, a positive variation on the
price of each cow is more significant when it affects a large number of cows then a
small number of them.
Figure 3 - Sensitivity analysis results for Jersey cow
Source: prepared by the authors, 2015.
Page 16
Financial viability for milk production of Dutch and Jersey breeds: An analysis through Monte Carlo simulation and Sensitivity Analysis
The parameters related to the price and quantity of milk produced are the
most important in the outcome of the business for both cows since they affect direct-
ly in the income.
The work had the objective of identifying how many cows of the Dutch and Jer-
sey breeds are necessary to ensure that a milk producer obtains profit from his pro-
duction, taking into account all the investment, inputs, outputs with each of the races
and also taxes imposed on payroll.
The cash flows and the NPV were calculated. Considering a deterministic sce-
nario, where there are various parameters, such as, the selling price of a liter of milk,
that have variations determined by the market, and depends on the supply-demand
relationship, the number of cows necessary to gain profit varies, so it is needed to
account for those variations.
After calculated for each of combinations of values of parameters, the answer,
minimum number of required cows to achieve profit, can be understood as a border
line value. When a producer has the number of cows lower than that number he will
lose money and above this number he will obtain profit.
The impact analysis, carried out through Monte Carlo simulation and Sensitivi-
ty Analysis, showed that the two parameters that affect more the outcome of the NPV
are the selling price of the milk and the amount of liters of milk produced per cow per
day. Thus, one can see that, considering a probabilistic scenario, the biggest influence
on the calculation of NPV is due to the monthly revenue generated.
From this sensitivity analysis paretto one must identify the parameters that
can be controlled by the producer, these must be optimized while the ones that can-
not be controlled must be watched carefully to build scenarios in a way that the pro-
ducer knows the outcome of their variation. Parameters related to price (such as
Electric energy cost, price of the cows, price of milk, price of ration) cannot be con-
trolled, but liters of milk produced by each cow and the poorness factor can be con-
trolled by buying cows with certified genetics and capacity to deliver a good produc-
tion, or by studying environmental aspects that influence the milk production.
This research was limited to analyzing Jersey and Dutch breeds, both in the
context of the city of São José dos Pinhais/PR. A suggestion for future research is to
analyze other breeds that allow data comparison. Still, it is suggested that the same
analysis is performed in other regions of the country, showing the rural investor
which is the best place for milk production.
ALVES, Z. M. M. B; SILVA, M. H. G. F. D. Análise qualitativa de dados de entrevista: uma
proposta. Paidéia (Ribeirão Preto), v. 2, n. 1, p. 61-69, 1992.
BRITTO JÚNIOR, Á. F; FERES JÚNIOR, N. A utilização da técnica da entrevista em trabalhos
científicos. Evidência, v. 7, n. 7, p. 237-250, 2011.
Page 17
BROZOZOWSKI, P; ZMARLICKI, K. Economics of Organic Apple and Strawberry Production
in Poland in the years 2007-2009. Journal of Fruit and Ornamental Plant Research, v. 18, n.
2, p. 255-264, 2010.
CAMARGO, C. Análise de investimentos e demonstrativos financeiros. Curitiba: Ibpex,
2007.
CARMONA, C. U. M. Finanças Corporativas e Mercados. São Paulo: Atlas, 2009.
CARVALHO, L. A; NOVAES, L. P; MARTINS, C. E; ZOCCAL, R; MOREIRA, P; RIBEIRO, A. C. C. L;
LIMA, V. M. B. Sistema de Produção de Leite (Cerrado). EMBRAPA, Juiz de Fora, 2002.
CASAROTTO FILHO, N; KOPITTKE, B. H. Análise de investimentos: matemática financeira,
engenharia econômica, tomada de decisão, estratégia empresarial. São Paulo: Atlas, 2010.
CATAPAN, D. C; CATAPAN, A; ROSSET, N. R; HARZER, J. H. Análise da viabilidade financeira
da produção de biogás através de dejetos de equinos. Custos e agronegócio on line, v. 8, n.
4, p. 25-51, 2012.
CHINNECK, J. W. Practical optimization: a gentle introduction. Carleton University, Ottawa,
2006. Recovered in July 10, 2015 in http://www.sce.carleton.ca/faculty/chinneck/po.html.
DAMODARAN, A. Finanças Corporativas: teoria e prática. Porto Alegre: Bookman, 2004.
FERRER, W. M. H. Manual de metodologia da pesquisa científica. NAP/UNIMAR, 2012.
FRIZZONE, J. A; ANDRADE JÚNIOR, A. S. Planejamento de irrigação: análise de decisão de
investimento. Brasília: EMBRAPA Informação Tecnológica, 2005.
GONZALES, H. L. Produção e qualidade do leite de vacas Jersey em pastagem cultivada
anual de inverno com e sem suplementação. Tese (Doutorado) – Universidade Federal do
Rio Grande do Sul, Curitiba, Rio Grande do Sul, Brasil, 2007.
HOMMA, A. K. O. H; CAMARÃO, A. P; FERREIRA, C. A. P; FREITAS, C. M. K. H; CARDOSO, E. C;
AZEVEDO, G. P. C; LÁU, H. D; TOURRAND, J. F; VEIGA, J. B; RODRIGUES FILHO, J. A. R; TEIXEIRA
NETO, J. F; MARQUES, J. R. F. M; VIEIRA, L. C; HOSTIOU, N; POCCARD-CHAPUIS, R. Criação de
Gado Leiteiro na Zona Bragantina. EMBRAPA, Juiz de Fora, 2015.
IPARES – Instituto Paranaense de Desenvolvimento Econômico e Social e Instituo Para-
naense de Assistência Técnica e Extensão Rural. Caracterização socioeconômica da ativi-
dade leiteira no Paraná: sumário executivo. Curitiba: IPARDES, 2009.
LELA, A. J. F; HORA, R. C; TONIN, T. A; BOLIANI, A. C. Viabilidade econômica do cultivo de
abacaxi no arenito Caiuá, região noroeste do Estado do Paraná região noroeste do Estado do
Paraná. Acta Scientiarum. Agronomy, v. 31, n. 2, p. 353-358, 2009.
LEMES JÚNIOR, A. B; RIGO, C. M; CHEROBIM, A. P. M. S. Administração Financeira: Princí-
pios, Fundamentos e Práticas Brasileiras. Rio de Janeiro: Elsevier, 2010.
LEMOS, F. K. A evolução da bovinocultura de corte brasileira: elementos para a caracteri-
zação do papel da ciência e da tecnologia na sua trajetória de desenvolvimento. Dissertação
(Mestrado) – Universidade de São Paulo, São Paulo, Brasil, 2013.
LIMA, A. S; NASCIMENTO, D. T; OLIVEIRA, J. H; SOUZA, L. V; BERTOLINI, G. R. F. Análise da
viabilidade da produção de hortaliças e ecológicas com base no valor para os consumi-
dores. Revista Eletrônica em Gestão, Educação e Tecnologia Ambiental, v. 19, n. 2, p. 775-793,
2015.
Page 18
Financial viability for milk production of Dutch and Jersey breeds: An analysis through Monte Carlo simulation and Sensitivity Analysis
MIGUEL, F. V. C. A entrevista como instrumento para investigação em pesquisas qualita-
tivas no campo da linguística aplicada. Odisseia, v. 5, n. 1, p. 1983-2435, 2010.
MIRANDA, J. E. C; FREITAS, A. F. Raças e tipos de cruzamentos para produção de leite.
EMBRAPA, Juiz de Fora, 1-12, 2009.
MIRANDA, J. E. C; DINIZ, F. H; ANDREOLI A. F. Planejamento da atividade leiteira: sugestões
para os produtores iniciantes. EMBRAPA, Juiz de Fora, 1-12, 2008.
NOGUEIRA, R. Elaboração e análise de questionários: uma revisão da literatura básica e a
aplicação dos conceitos a um caso real. Rio de Janeiro: UFRJ/COPPEAD, 2002.
OGATA, C. R. D; OLIVEIRA, S. C. K; CAMARGO, T. M; LEMES, D. P. P; CATAPAN, A; MARTINS, P.
F. Projeto de Investimento Para Automação no Brasil: Uma Análise Com a Utilização da
Metodologia Multi-Índices e da Simulação de Monte Carlo. Espacios (Caracas), v. 35, n. 5, p. 1-
14, 2014.
PÁDUA, E. M. M. Metodologia da pesquisa: Abordagem teórico-prática. Campinas: Papirus,
2004.
PERES, A. A. C; VÁSQUEZ, H. M; SOUZA, P. M; SILVA, J. F. C; VILELA, O. V; SANTOS, F. C. Análise
financeira e de sensibilidade de sistemas de produção de leite em pastagem. Revista
Brasileira de Zootecnia, v. 38, n. 10, p. 2072-2078, 2009.
RONQUE, E. R. V; VENTURA, M. U; SOARES JÚNIOR, D; MACEDO, R. B; CAMPOS, B. R. S. Viabili-
dade da cultura do morangueiro no Paraná – BR. Revista Brasileira de Fruticultura, v. 35, n.
4, p. 1032-1041, 2013.
SABBAG, O. J; NICODEMO, D. Viabilidade econômica para a produção de mel em proprie-
dade familiar. Pesquisa Agropecuária Tropical, v. 41, n. 1, p. 94-101, 2011.
SCHMITZ, A. M; SANTOS, R. A. A produção de leite na agricultura familiar do Sudoeste do
Paraná e a participação das mulheres no processo produtivo. Terra Plural, v. 7, n. 2, p.
339-355, 2013.
SEREIA, M. J; TOLEDO, V. A. A; TAKASUSUKI, M. C. C. R; SEKINE, E. S; FAQUINELLO, P; MAIA, F.
M. C. Viabilidade financeira da produção de geleia real com abelhas africanizadas su-
plementadas com diferentes nutrientes. Acta Scientiarum. Animal Sciences, v. 32, n. 4, p.
467-474, 2010.
SILVA, D. A. R; OLIVO, C. J; CAMPOS, B. C; TEJKOWSKI, T. M; MEINERZ, G. R; SACCOL, A. G. F;
COSTA, S. T. Produção de leite de vacas da raça Holandesa de pequeno, médio e grande
porte. Ciência Rural, v. 41, n. 3, p. 501-506, 2011.
SILVA, E. L. Metodologia da pesquisa e elaboração de dissertação. Florianópolis: UFSC,
2005.
SILVA, E. L; FERREIRA, M. A. M; FERREIRA, M. A. M. Viabilidade financeira da produção de
feijão em sistema automatizado de irrigação por mini aspersão. Organizações Rurais &
Agroindustriais, v. 13, n. 2, p. 290-302, 2011.
SILVA, H. A; MORAES, A; CARVALHO, P. C. F; FONSECA, A. F; GUIMARÃES, V. D. A; MONTEIRO,
A. L. G; LANG, C. R. Viabilidade econômica da produção de novilhas leiteiras a pasto em
sistema de integração lavoura pecuária. Pesquisa Agropecuária Brasileira, v. 47, n. 6, p.
745-753, 2012.
SOUZA, A; CLEMENTE, A. Decisões financeiras e análise de investimentos: fundamentos,
técnicas e aplicações. São Paulo: Atlas, 2008.
Page 19
SOUZA, J. L; GARCIA, R. D. C. Custos e Rentabilidades na Produção de Hortaliças Orgânicas
e Convencionais no Estado do Espirito Santo. Revista Brasileira de Agropecuária Sustentá-
vel, v. 3, n. 1, p. 11-24, 2013.
VILELA, D; ALVIM, M. J; CAMPOS, O. F; RESENDE, J. C. Produção de leite de vacas holandesas
em confinamento ou em pastagem de coast-cross. Juiz de Fora: EMBRAPA, 1996.
ZAMBOLIM, L; NASSER, L. C. B; ANDRIGUETO, J. R; TEIXEIRA, J. M. A; KOSOSKI, A. R; FACHI-
NELLO, J. C. Produção Integrada no Brasil: Agropecuária Sustentável, Alimentos Seguros.
Brasília: Mapa/ACS, 2009.
Received: 07/01/2016
Approved: 08/06/2016