Process Raman Allyson McIntyre Pharmaceutical Development Utilisation of Raman spectroscopy for primary and secondary pharmaceutical development IFPAC Annual Meeting, Arlington, VA (Washington DC) Jan 25 – Jan 28, 2015
Transcript
Process Raman
Allyson McIntyre
Pharmaceutical Development
Utilisation of Raman spectroscopy
for primary and secondary
pharmaceutical development
IFPAC Annual Meeting,
Arlington, VA (Washington DC)
Jan 25 – Jan 28, 2015
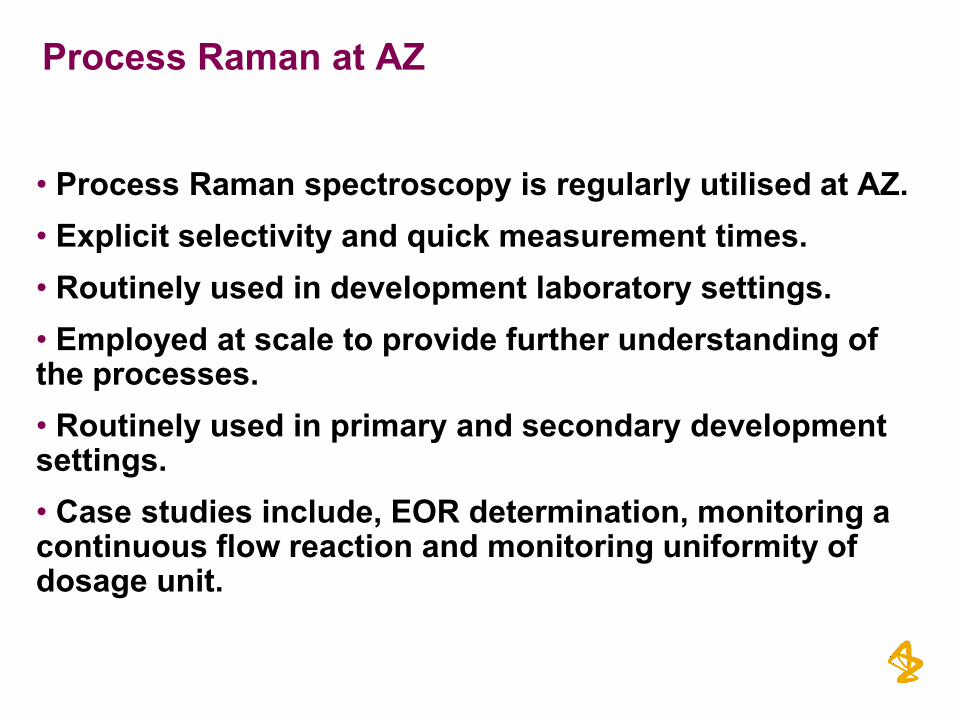
Process Raman at AZ
• Process Raman spectroscopy is regularly utilised at AZ.
• Explicit selectivity and quick measurement times.
• Routinely used in development laboratory settings.
• Employed at scale to provide further understanding of the processes.
• Routinely used in primary and secondary development settings.
• Case studies include, EOR determination, monitoring a continuous flow reaction and monitoring uniformity of dosage unit.
In situ monitoring of a heterogeneous etherification reaction using quantitative Raman spectroscopy
References 1. R Hart, N Pedge, A Steven & K Sutcliffe, In situ monitoring of a heterogeneous etherification reaction using
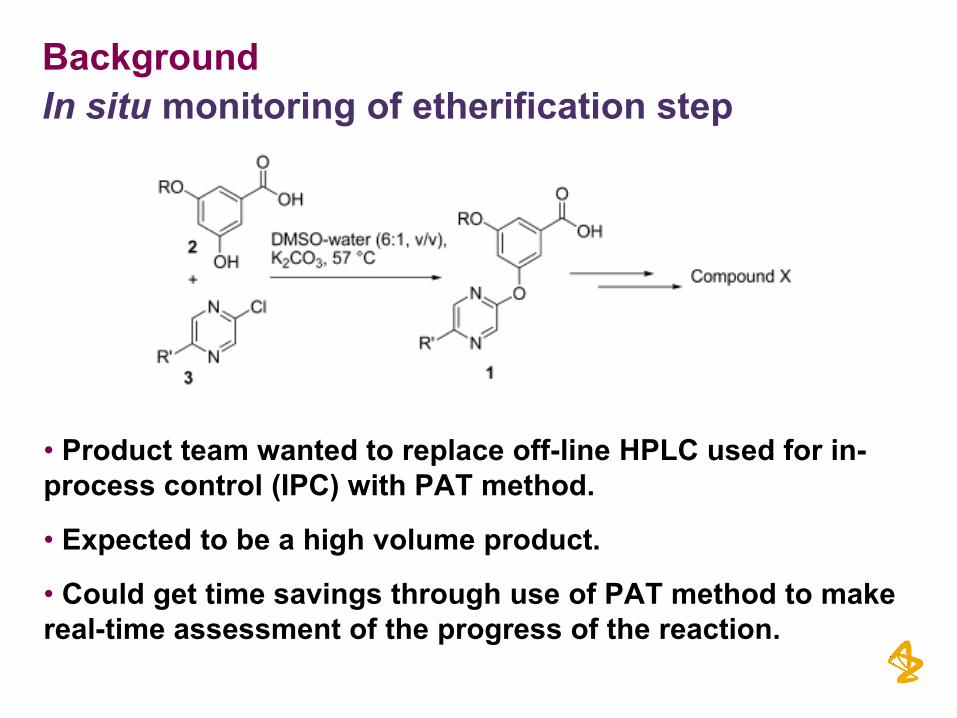
• Product team wanted to replace off-line HPLC used for in-
process control (IPC) with PAT method.
• Expected to be a high volume product.
• Could get time savings through use of PAT method to make
real-time assessment of the progress of the reaction.
Further advantages of using PAT method
• Reaction mixture is heterogeneous, is off-line HPLC
sample representative?
• In-line monitoring provided information on the levels of
excess starting material chloropyrazine (3).
• Presence of chloropyrazine (3) downstream in the
process at the crude API stage favoured crystallisation of
undesired polymorph of the API.
• Therefore, designated a critical quality attribute (CQA) at
this stage of the process so real-time monitoring was
important.
Experimental
• A one-factor, three level series of experiments investigating the amount of solvent charged were performed to introduce robustness into the model. • Solvent charge has large error in charging, giving a large contribution to spectral variation. • In addition, two further lab scale user trials were completed at the set points. • Different batches of input material were used to provide spectra with variable fluorescent background. • PLS2 model chosen to simultaneously predict ether (1) and phenol (2).
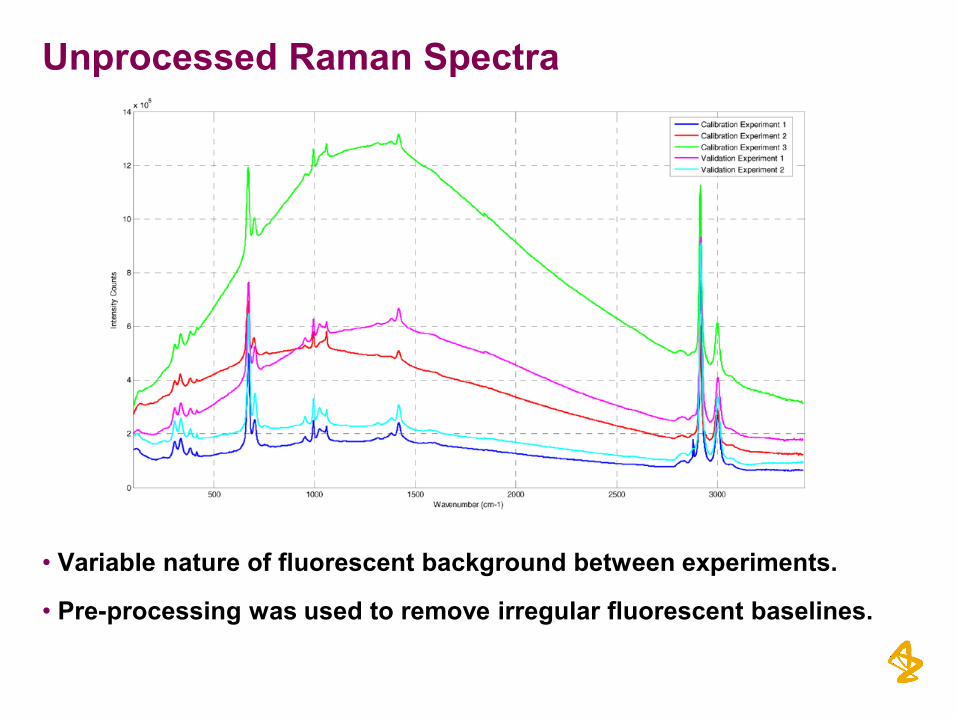
Unprocessed Raman Spectra
• Variable nature of fluorescent background between experiments. • Pre-processing was used to remove irregular fluorescent baselines.
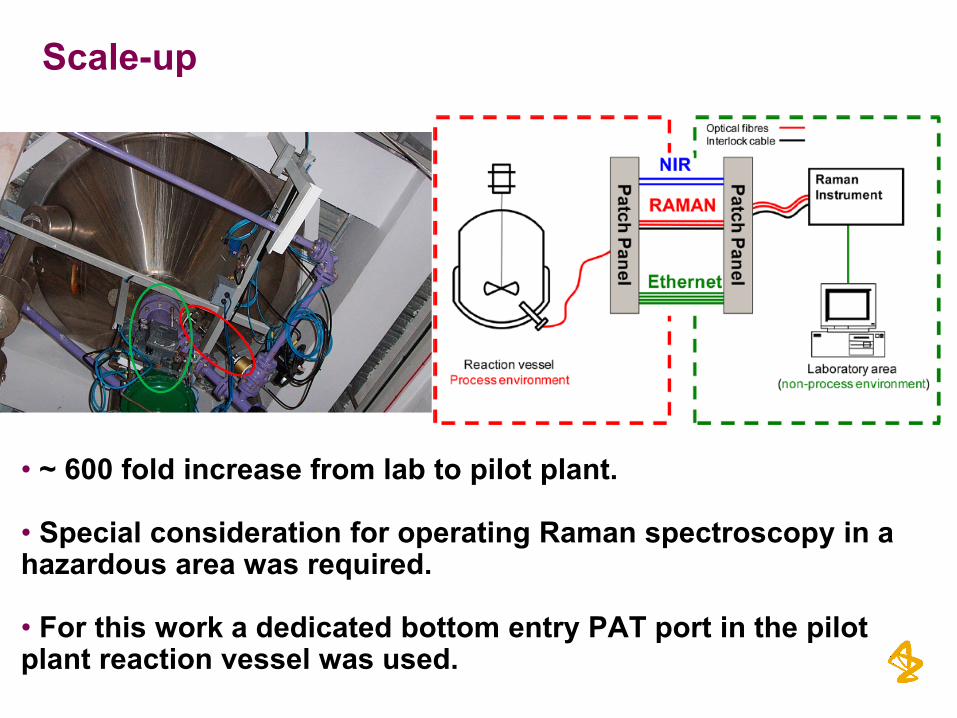
Scale-up
• ~ 600 fold increase from lab to pilot plant. • Special consideration for operating Raman spectroscopy in a hazardous area was required. • For this work a dedicated bottom entry PAT port in the pilot plant reaction vessel was used.
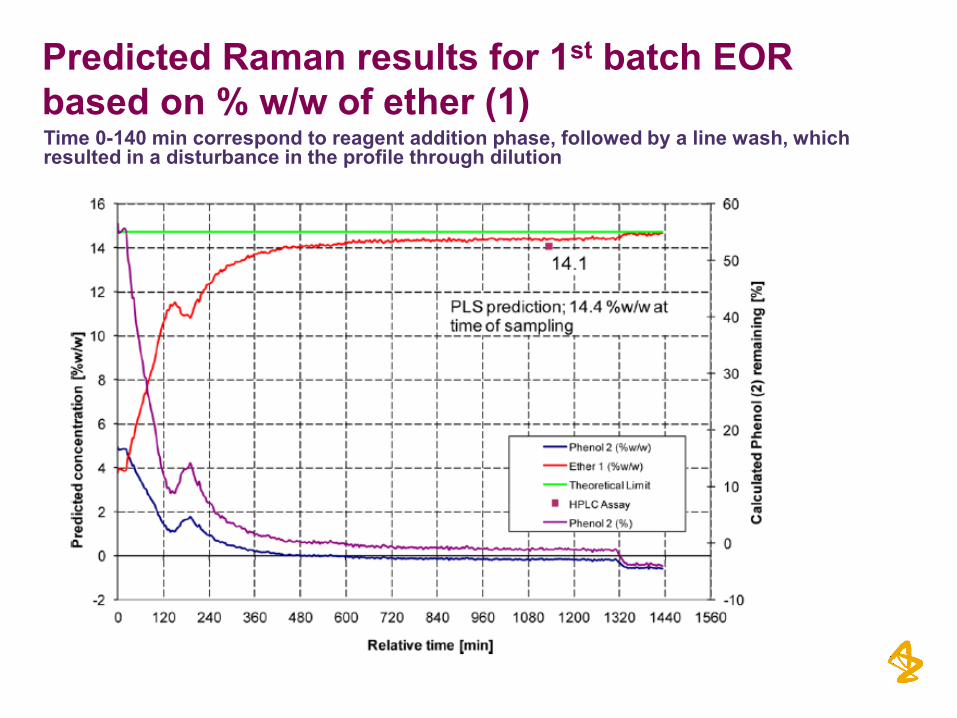
Predicted Raman results for 1st batch EOR
based on % w/w of ether (1) Time 0-140 min correspond to reagent addition phase, followed by a line wash, which resulted in a disturbance in the profile through dilution
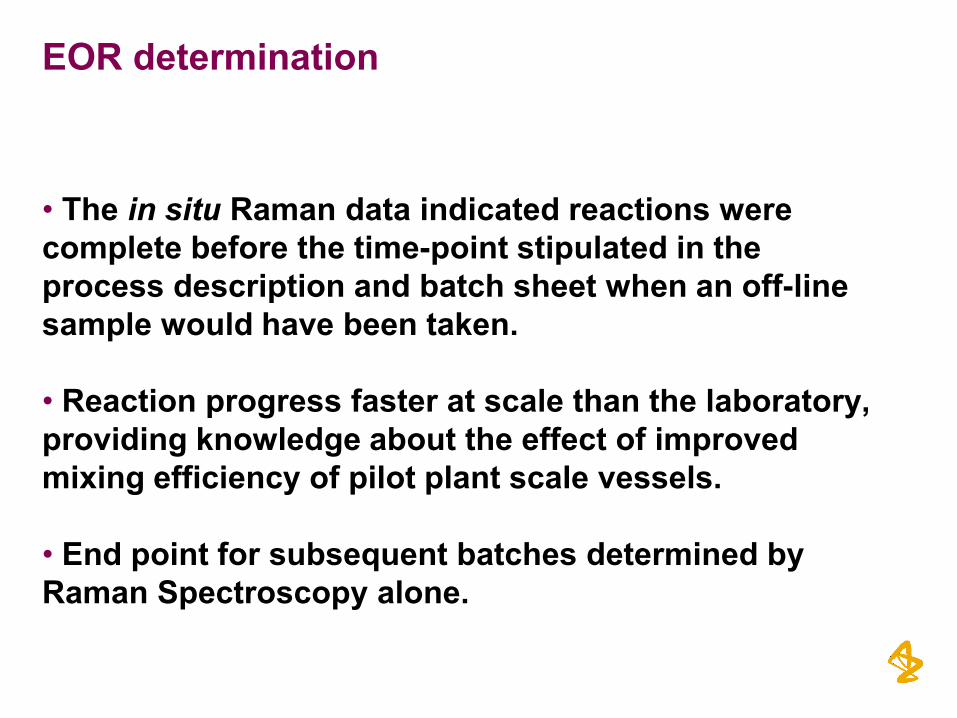
EOR determination
• The in situ Raman data indicated reactions were
complete before the time-point stipulated in the
process description and batch sheet when an off-line
sample would have been taken.
• Reaction progress faster at scale than the laboratory,
providing knowledge about the effect of improved
mixing efficiency of pilot plant scale vessels.
• End point for subsequent batches determined by
Raman Spectroscopy alone.
Monitoring of a Strecker reaction in continuous flow manufacture using PAT in large scale lab
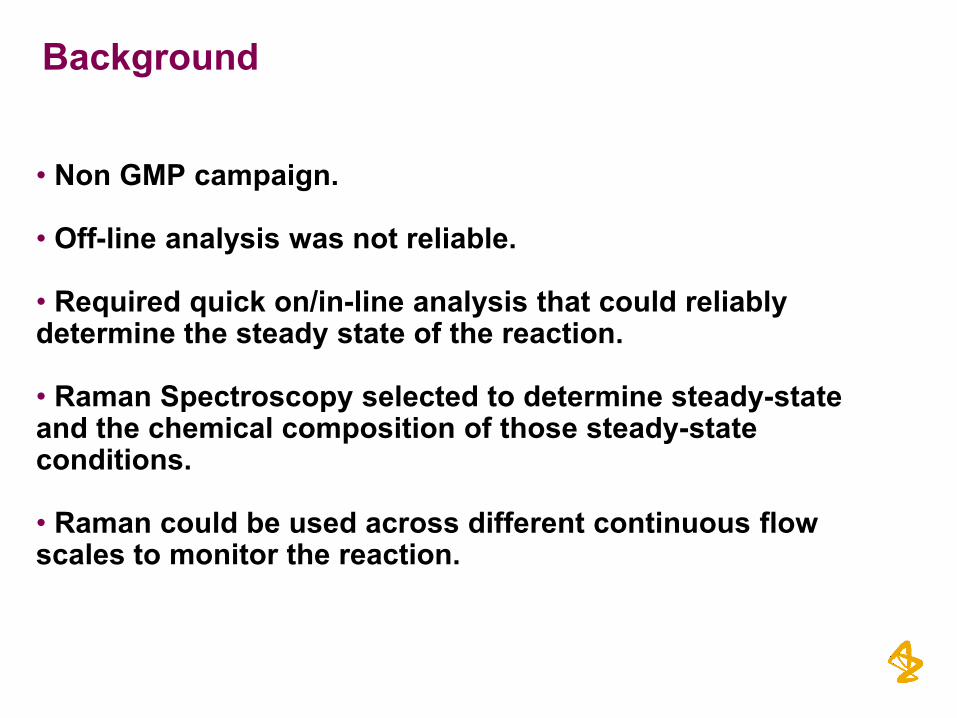
Background
• Non GMP campaign. • Off-line analysis was not reliable. • Required quick on/in-line analysis that could reliably determine the steady state of the reaction. • Raman Spectroscopy selected to determine steady-state and the chemical composition of those steady-state conditions. • Raman could be used across different continuous flow scales to monitor the reaction.
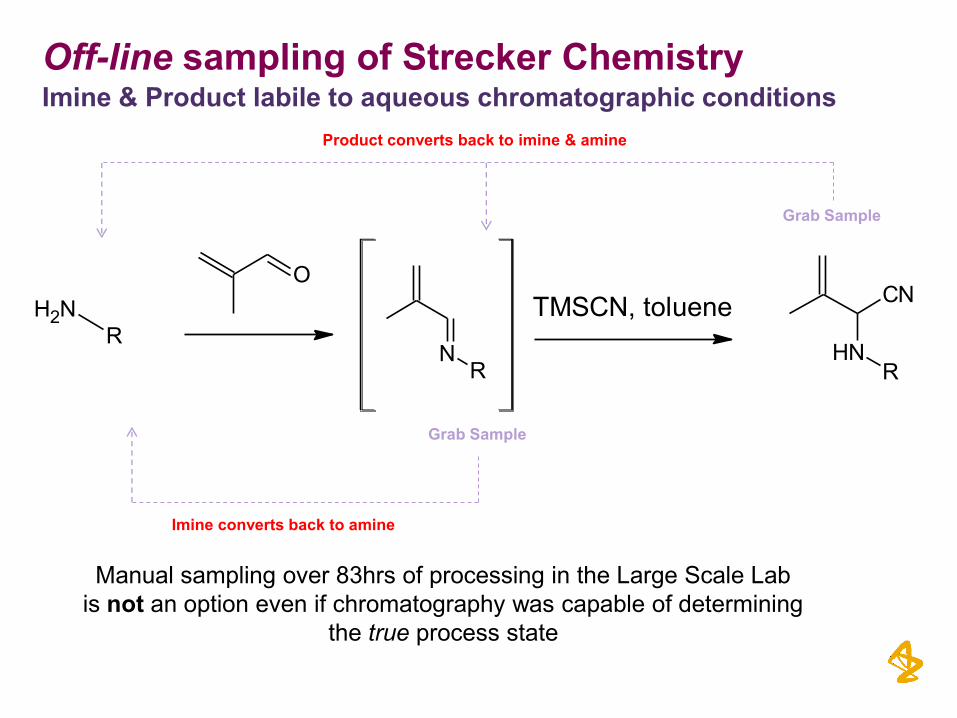
Off-line sampling of Strecker Chemistry Imine & Product labile to aqueous chromatographic conditions
Grab Sample
Grab Sample
Product converts back to imine & amine
Imine converts back to amine
Manual sampling over 83hrs of processing in the Large Scale Lab
is not an option even if chromatography was capable of determining
the true process state
NH2R
O
NR
TMSCN, tolueneCN
NHR
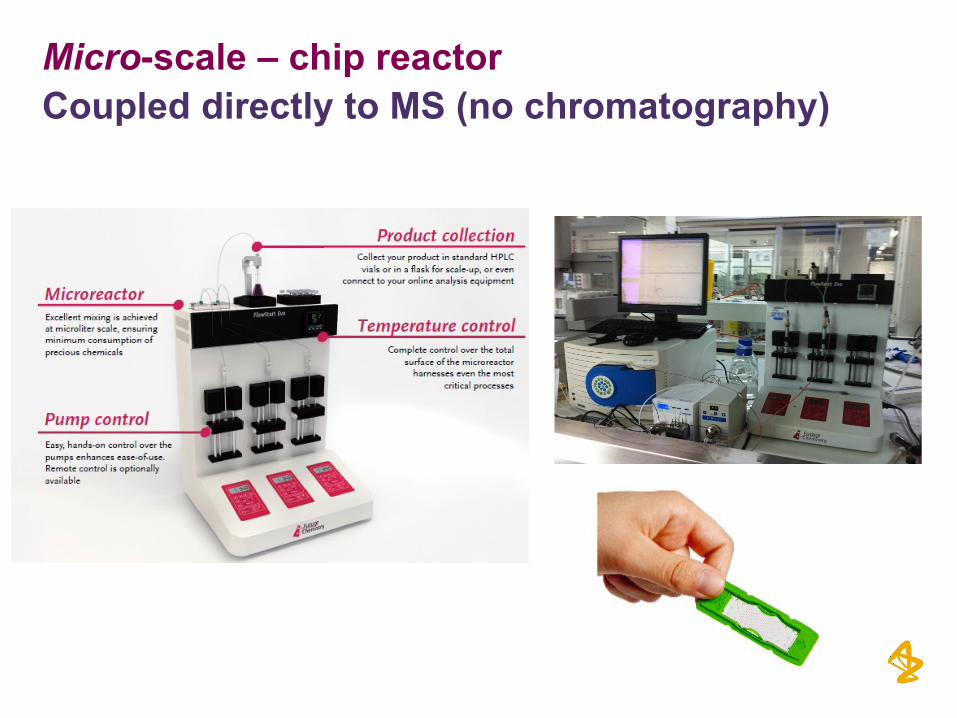
Micro-scale – chip reactor
Coupled directly to MS (no chromatography)
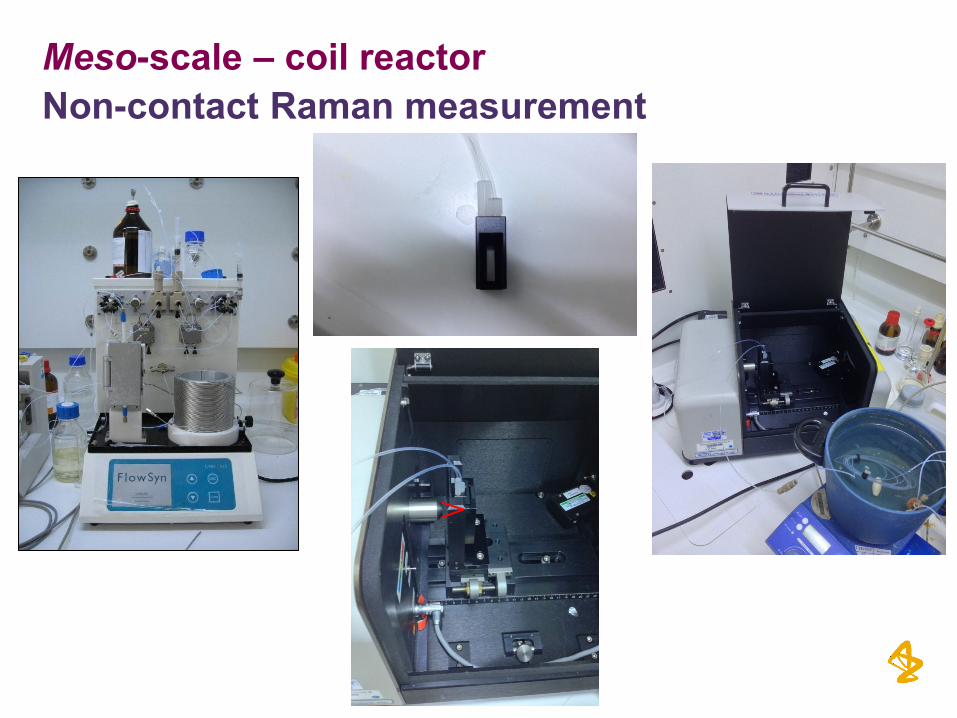
Meso-scale – coil reactor
Non-contact Raman measurement
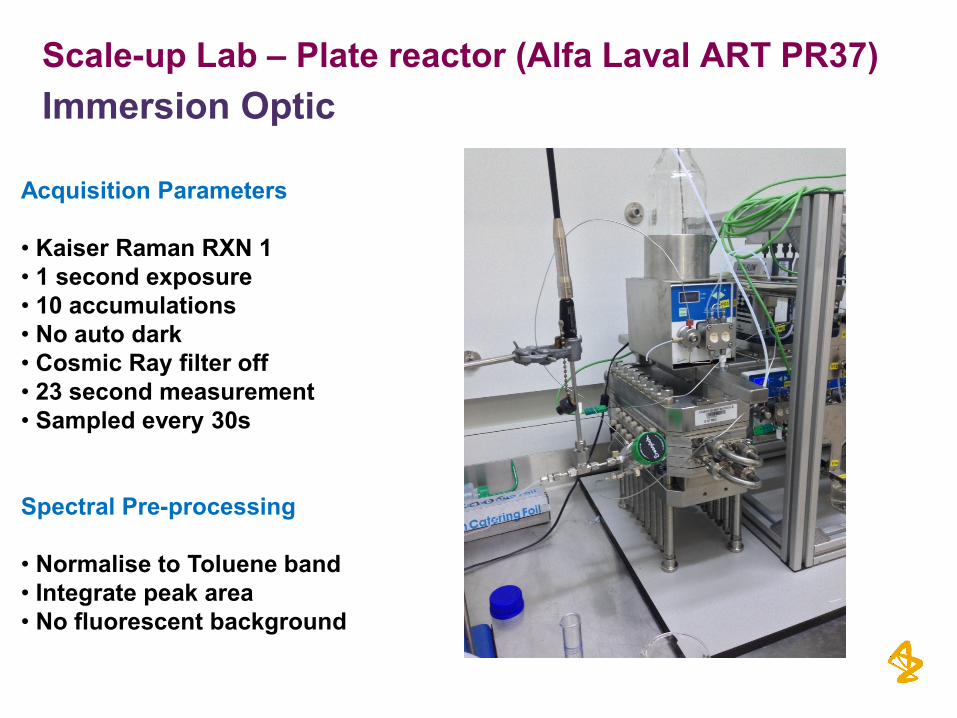
Scale-up Lab – Plate reactor (Alfa Laval ART PR37)
Immersion Optic
Acquisition Parameters
• Kaiser Raman RXN 1
• 1 second exposure
• 10 accumulations
• No auto dark
• Cosmic Ray filter off
• 23 second measurement
• Sampled every 30s
Spectral Pre-processing
• Normalise to Toluene band
• Integrate peak area
• No fluorescent background
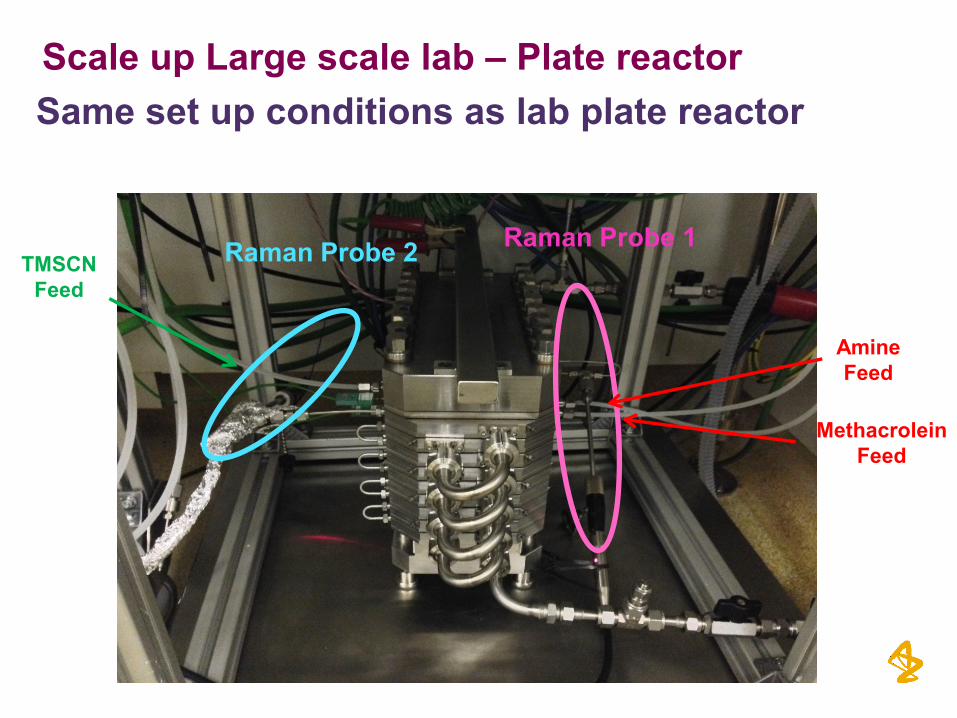
TMSCN
Feed
Amine
Feed
Methacrolein
Feed
Raman Probe 2 Raman Probe 1
Scale up Large scale lab – Plate reactor
Same set up conditions as lab plate reactor
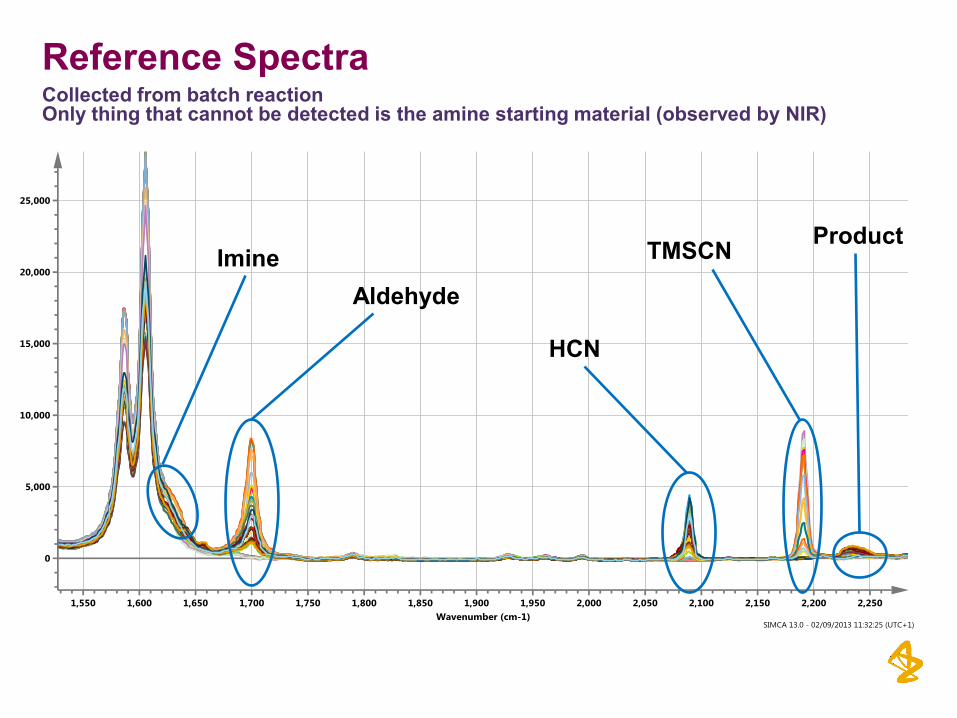
Reference Spectra Collected from batch reaction Only thing that cannot be detected is the amine starting material (observed by NIR)
Imine
Aldehyde
HCN
TMSCN Product
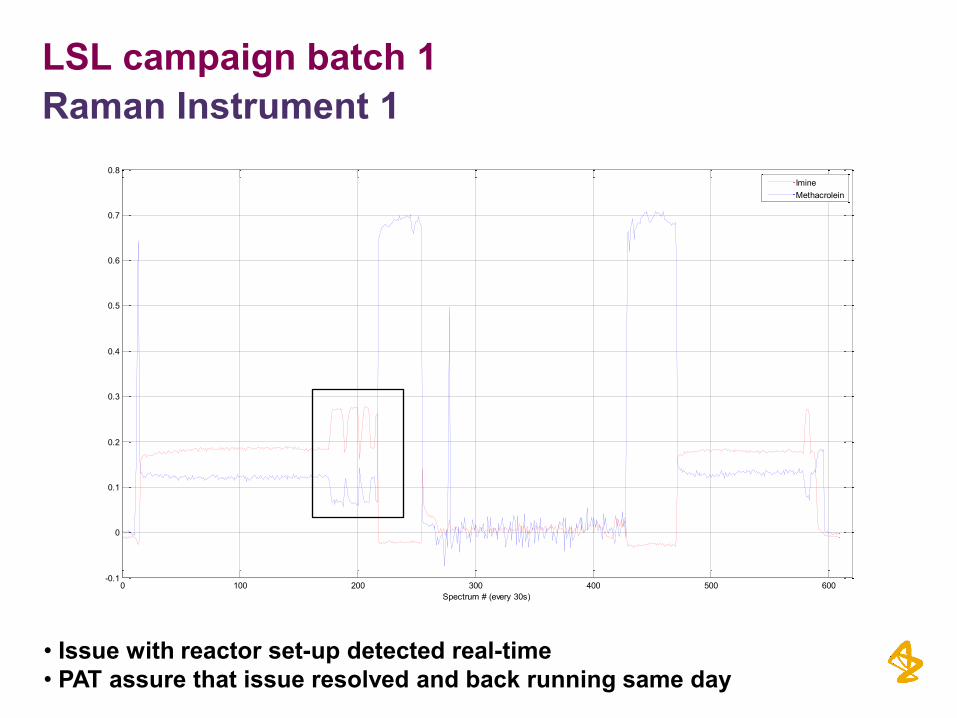
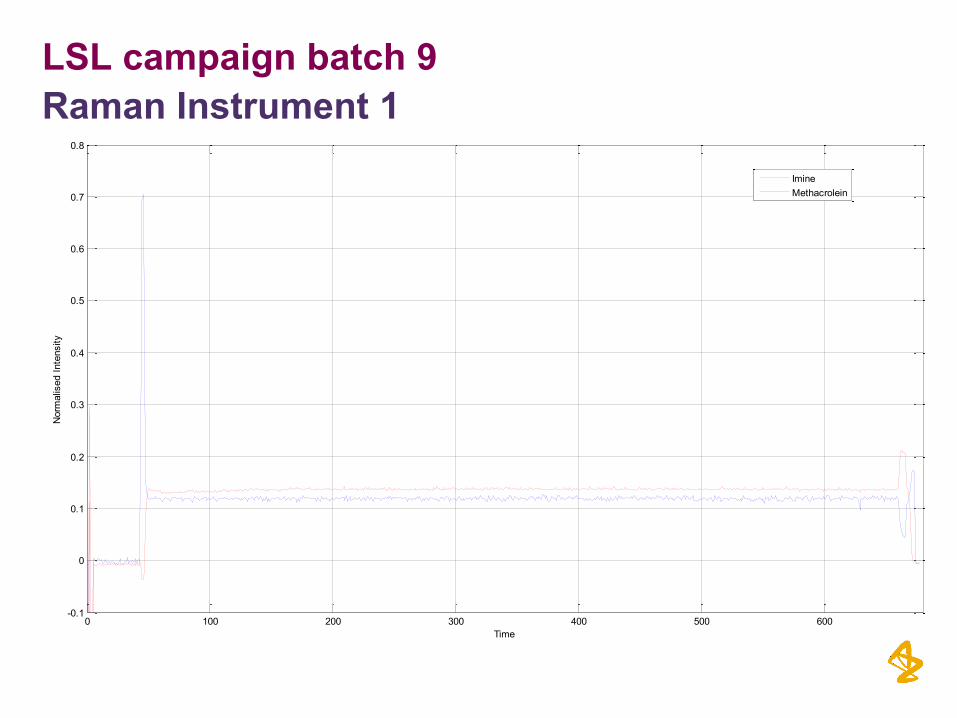
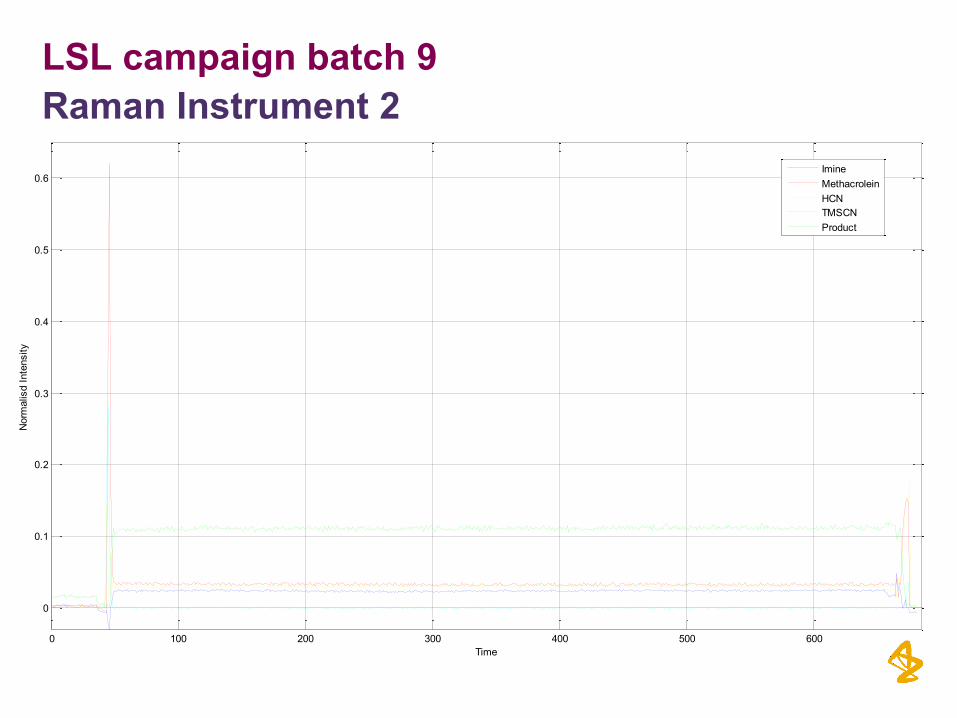
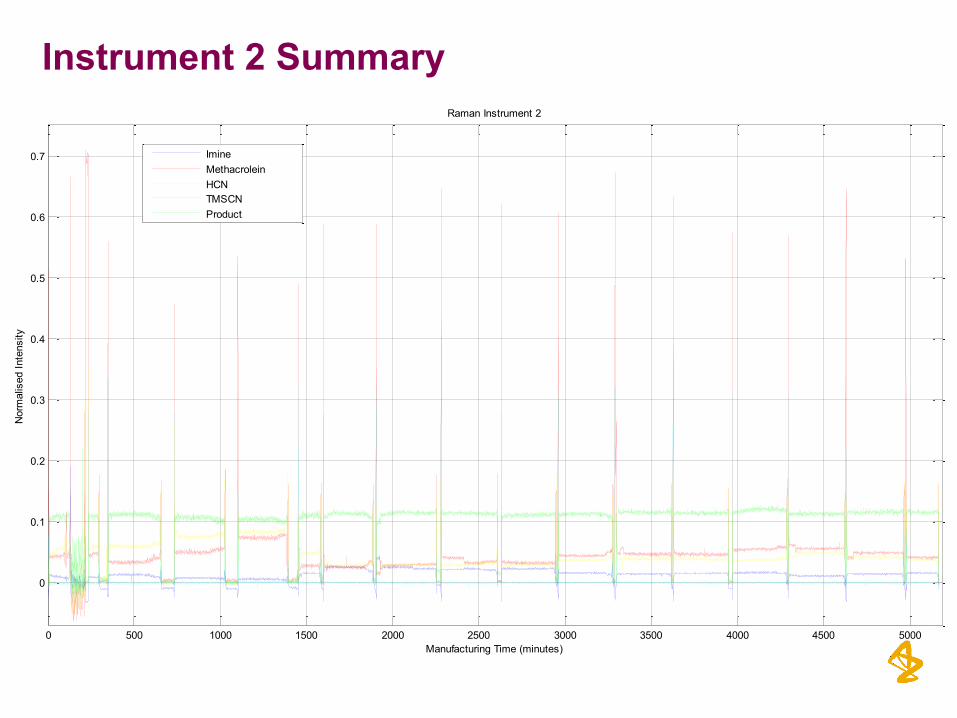
LSL campaign batch 1
Raman Instrument 1
0 100 200 300 400 500 600-0.1
0
0.1
0.2
0.3
0.4
0.5
0.6
0.7
0.8
Spectrum # (every 30s)
Imine
Methacrolein
• Issue with reactor set-up detected real-time
• PAT assure that issue resolved and back running same day
• In situ Raman spectroscopy was an integral part to
the monitoring of this stage.
• The project will not proceed with manufacturing
unless PAT is used – they consider it as a part of the
reactor.
Transmission Raman Spectroscopy to monitor uniformity of dosage unit in tablets during tablet manufacturing
References
2. Macleod N A, C Eliasson & P Matousek, Hidden depths? New techniques for sub-surface spectroscopy. Spectrosc. Eur. 19(5), 7-10 (2007).
3. Johansson J, A Sparén, O Svensson, S Folestad & M Claybourn, Quantitative Transmission Raman Spectroscopy of Pharmaceutical Tablets
and Capsules. Appl. Spectrosc., 61(11), 1211-1218 (2007).
4. Eliasson C, N A Macleod, LC Jayes, F C Clarke, S V Hammond, M R Smith & P Matousek, Non-invasive quantitative assessment of the content
of pharmaceutical capsules using transmission Raman spectroscopy. J. Pharm. Biomed. Anal., 47(2), 221-229 (2008).
5. Macleod N A & P Matousek, Deep non-invasive Raman spectroscopy of turbid media, Appl. Spectrosc., 62(11), 291A-304A (2008).
6. Sparén A, J Johansson, O Svensson, S Folestad & M Claybourn, Quantitative Transmission Raman Spectroscopy of Pharmaceutical Tablets
and Capsules. Am. Pharm. Rev., Jan/Feb (2009)
7. Fransson M, J Johansson, A Sparén & O Svensson, Comparison of multivariate methods for quantitative determination with transmission
Raman spectroscopy in pharmaceutical formulations, J. Chemom. 24(11-12), 674-680 (2010).
8. Townshend N, A Nordon, D Littlejohn, M Myrick, J Andrews & P Dallin, Comparison of the Determination of a Low-Concentration Active
Ingredient in Pharmaceutical Tablets by Backscatter and Transmission Raman Spectrometry, Anal. Chem. 84, 4671-4676 (2012).
Background
• Raman spectroscopy used as an alternative to near-infrared spectroscopy (NIR) for non-destructive quantitative analysis of solid pharmaceutical formulations.
• Compared with NIR spectra, Raman spectra have much better selectivity, which can facilitate calibration.
• For conventional backscatter Raman spectroscopy, sub-sampling has been an issue for quantitative analysis, but Raman spectroscopy in transmission mode has reduced this issue, since a large volume of an intact tablet is sampled during the measurement.
• Technique successfully applied in several drug development projects at AstraZeneca.
• Includes directly compressed formulations, it is essential to have good control of the variation of the content of drug substance in tablets.
• Case study -Transmission Raman spectroscopy to monitor the uniformity of dosage unit (UoDU) for whole tablets, during tablet manufacturing at the scale-up for a directly compressed formulation.
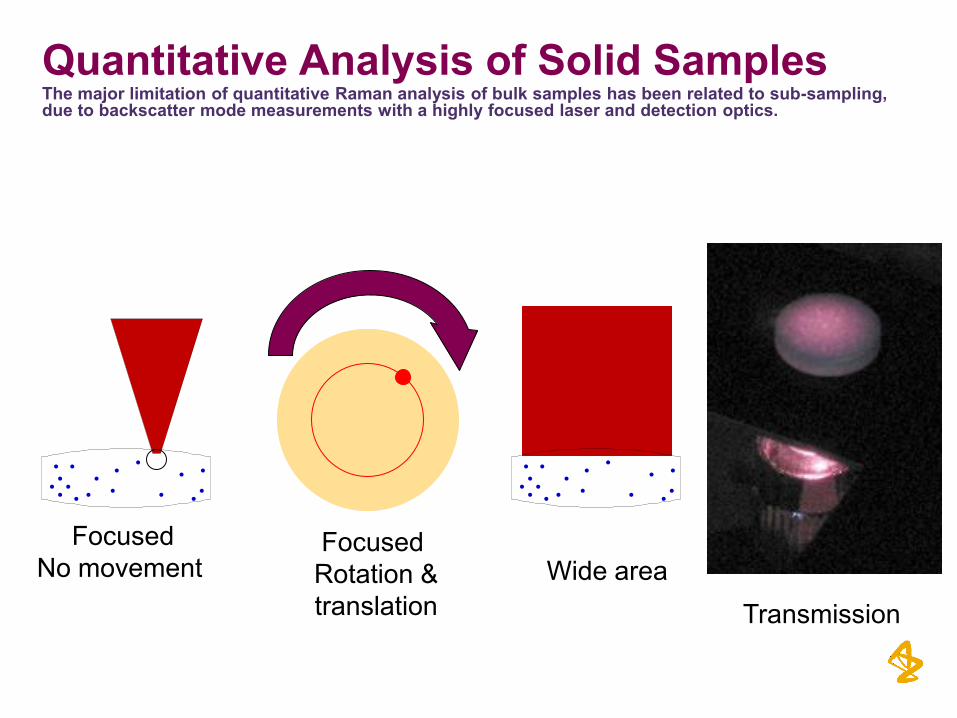
Quantitative Analysis of Solid Samples The major limitation of quantitative Raman analysis of bulk samples has been related to sub-sampling, due to backscatter mode measurements with a highly focused laser and detection optics.
Focused
Rotation &
translation
Focused
No movement
Transmission
Wide area
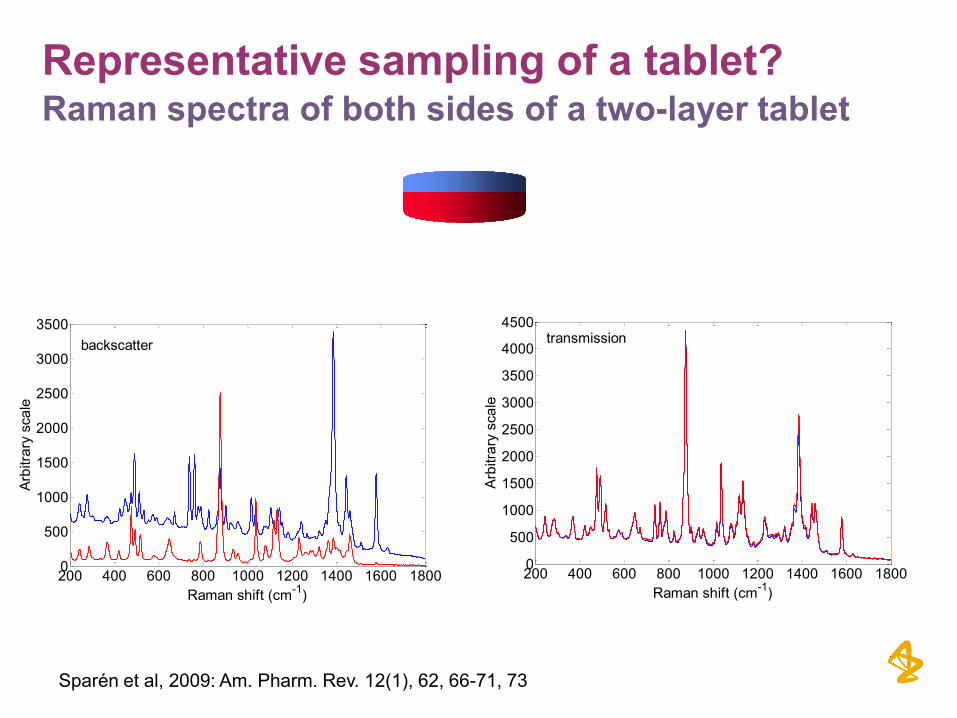
Representative sampling of a tablet? Raman spectra of both sides of a two-layer tablet
• Between 100 and 200 uncoated tablets per batch were
measured with transmission Raman spectroscopy.
• A small number of tablets (5-10 per batch) were selected for reference analysis, using liquid chromatography.
• Partial least squares regression (PLS) was used to build a calibration model between Raman spectra and LC reference values, with the aim of determining the concentration of drug substance in whole tablets.
• The dose of drug substance in each tablet (% label claim) was calculated by multiplying the concentration with the tablet weight.
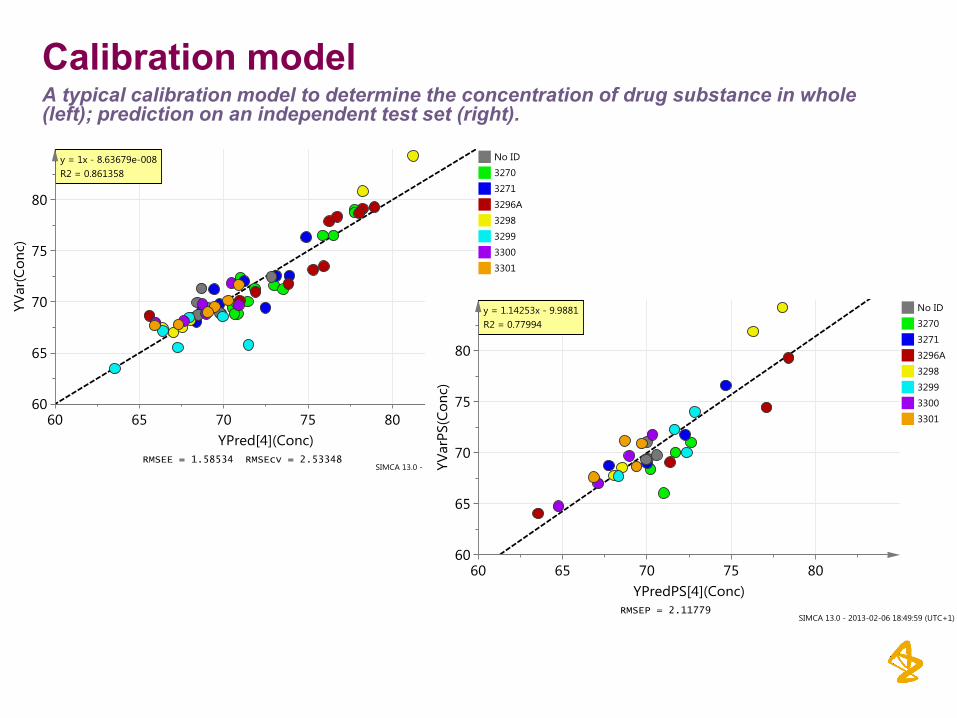
Calibration model A typical calibration model to determine the concentration of drug substance in whole (left); prediction on an independent test set (right).
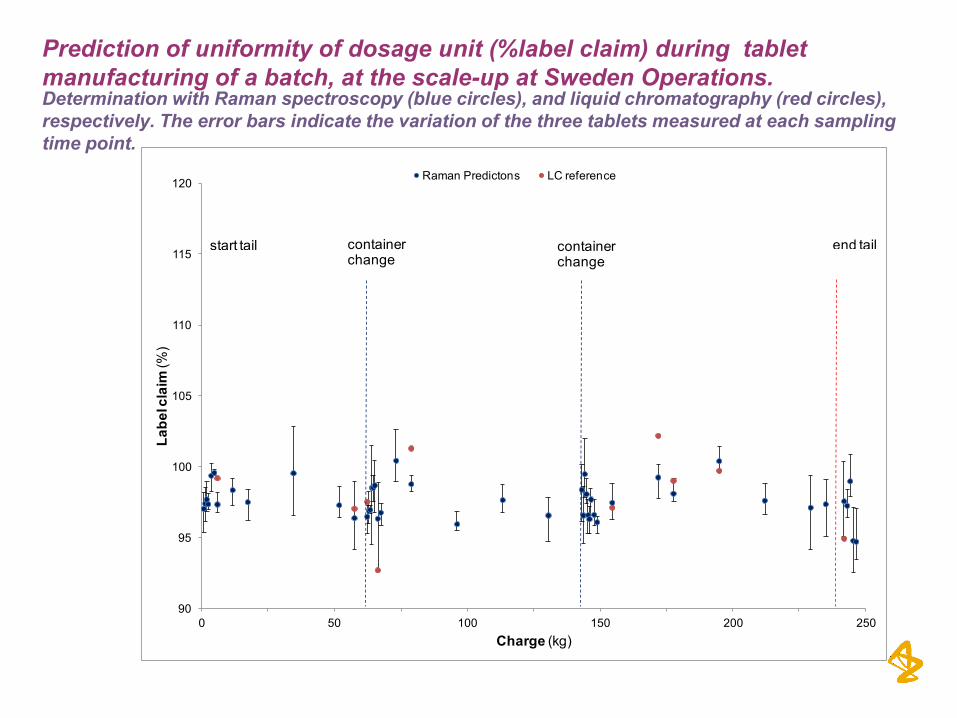
Prediction of uniformity of dosage unit (%label claim) during tablet
manufacturing of a batch, at the scale-up at Sweden Operations.
Determination with Raman spectroscopy (blue circles), and liquid chromatography (red circles),
respectively. The error bars indicate the variation of the three tablets measured at each sampling
time point.
90
95
100
105
110
115
120
0 50 100 150 200 250
La
be
l cla
im(%
)
Charge (kg)
Raman Predictons LC reference
start tail containerchange
containerchange
end tail
Summary
• Improved process understanding
• Can determine EOR during scale changes when mixing efficiency has
altered
• Monitoring reactions real-time that otherwise would have been extremely
challenging to monitor
• Useful for uniformity of dosage unit for directly compressed formulation
tablet manufacturing
• Application of in-line Raman spectroscopy
• Examples of Raman spectroscopy across scales, including lab, LSL &
Pilot plant
• Can be used for many applications in primary and secondary
manufacturing
• Cost saving (life cycle management)
• Sampling burden minimised and EoR accurately determined
Acknowledgements
• Richard Hart
• Nick Pedge
• Anders Sparén
• Olof Svensson
• Magnus Fransson
Confidentiality Notice
This file is private and may contain confidential and proprietary information. If you have received this file in error, please notify us and
remove it from your system and note that you must not copy, distribute or take any action in reliance on it. Any unauthorized use or
disclosure of the contents of this file is not permitted and may be unlawful. AstraZeneca PLC, 2 Kingdom Street, London, W2 6BD, UK,