29
Madrid, 2-3 July 2014 EPRG & CEEPR European Energy Policy Conference Utilities of the future Tomás Gómez
Madrid, 2-3 July 2014
EPRG & CEEPR European Energy Policy Conference
Utilities of the future
Tomás Gómez
2Instituto de Investigación TecnológicaEscuela Técnica Superior de Ingeniería ICAI
Utilities of the future2-3 July 2014
Contents• Research focus
• From technologies to business models
• Analytical models
• Future research
3Instituto de Investigación TecnológicaEscuela Técnica Superior de Ingeniería ICAI
Utilities of the future2-3 July 2014
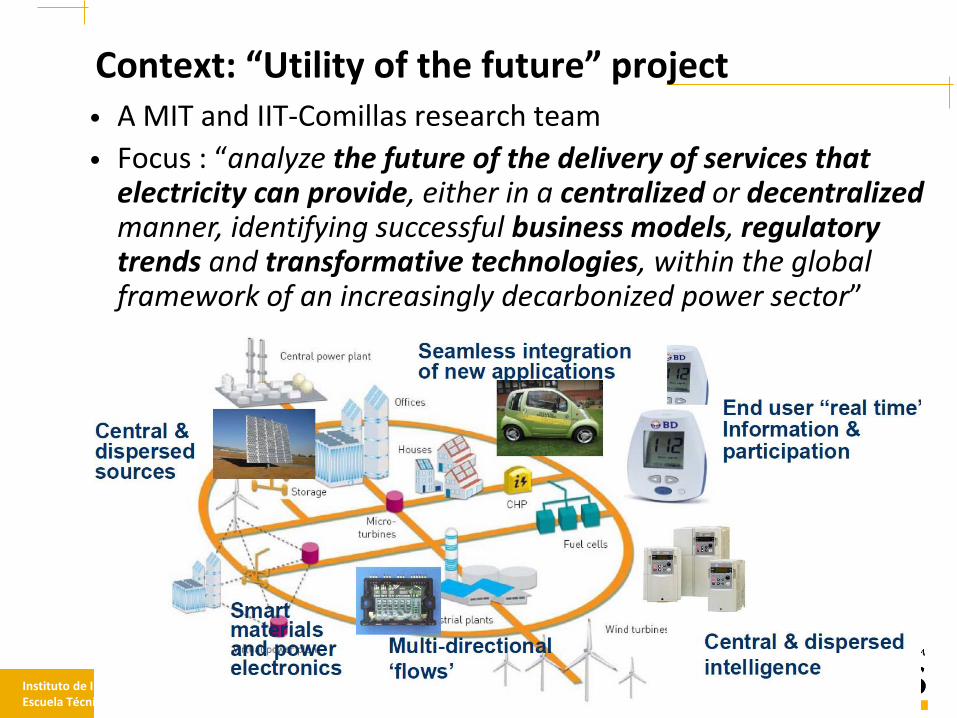
Context: “Utility of the future” project• A MIT and IIT-Comillas research team
• Focus : “analyze the future of the delivery of services that electricity can provide, either in a centralized or decentralizedmanner, identifying successful business models, regulatory trends and transformative technologies, within the global framework of an increasingly decarbonized power sector”
4Instituto de Investigación TecnológicaEscuela Técnica Superior de Ingeniería ICAI
Utilities of the future2-3 July 2014
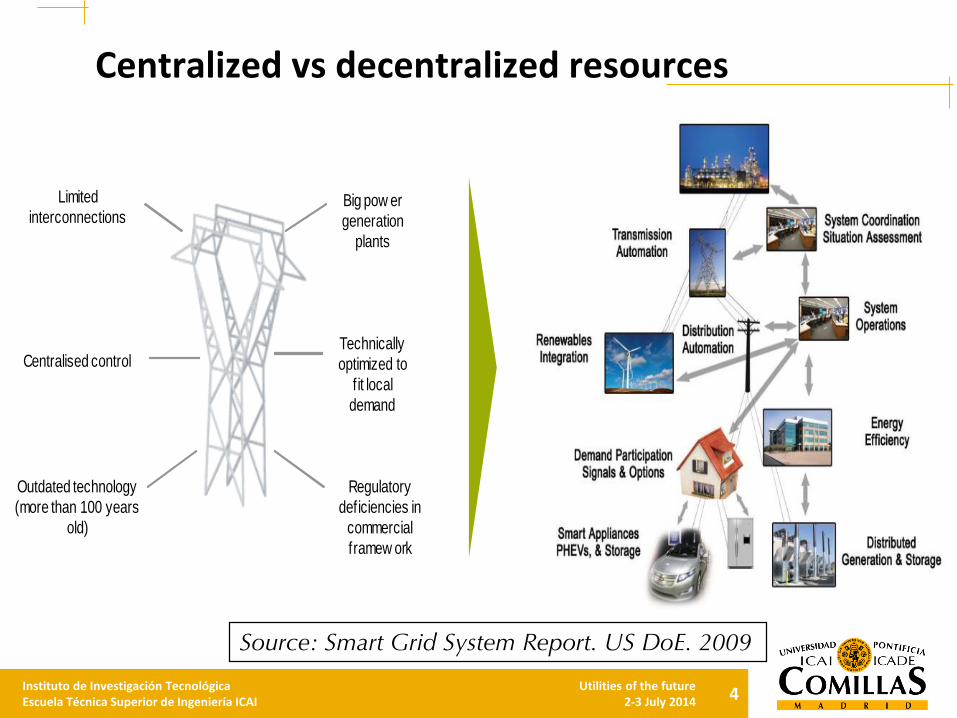
Centralized vs decentralized resources
Limited
interconnectionsBig pow er
generation
plants
Technically
optimized to
f it local
demand
Regulatory
deficiencies in
commercial
framew ork
Outdated technology
(more than 100 years
old)
Centralised control
Source: Smart Grid System Report. US DoE. 2009
5Instituto de Investigación TecnológicaEscuela Técnica Superior de Ingeniería ICAI
Utilities of the future2-3 July 2014
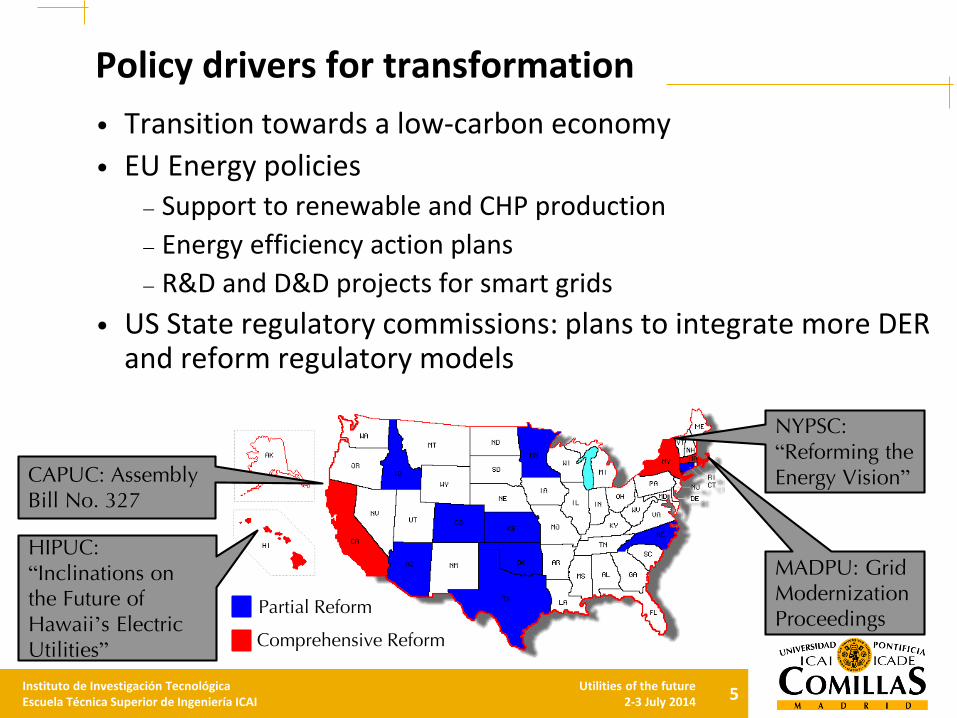
Policy drivers for transformation
• Transition towards a low-carbon economy
• EU Energy policies– Support to renewable and CHP production
– Energy efficiency action plans
– R&D and D&D projects for smart grids
• US State regulatory commissions: plans to integrate more DER and reform regulatory models
Partial Reform
Comprehensive Reform
MADPU: Grid Modernization Proceedings
NYPSC: “Reforming the Energy Vision”
HIPUC: “Inclinations on the Future of Hawaii’s Electric Utilities”
CAPUC: Assembly Bill No. 327
6Instituto de Investigación TecnológicaEscuela Técnica Superior de Ingeniería ICAI
Utilities of the future2-3 July 2014
Technology drivers
• Information and communication technologies
• Distributed energy resources– Flexible demand (demand response): smart meters, building and
home EMS, virtual storage
– Distributed on-site generation: PV, CHP, biogas, back-up units
– Plug-in electric vehicles (dumb and smart charging, V2G)
– Power storage: batteries
– Power electronics and control for integration of resources
• Converging infrastructures: energy (electricity, gas, heat), transportation, communications (smart cities)
7Instituto de Investigación TecnológicaEscuela Técnica Superior de Ingeniería ICAI
Utilities of the future2-3 July 2014
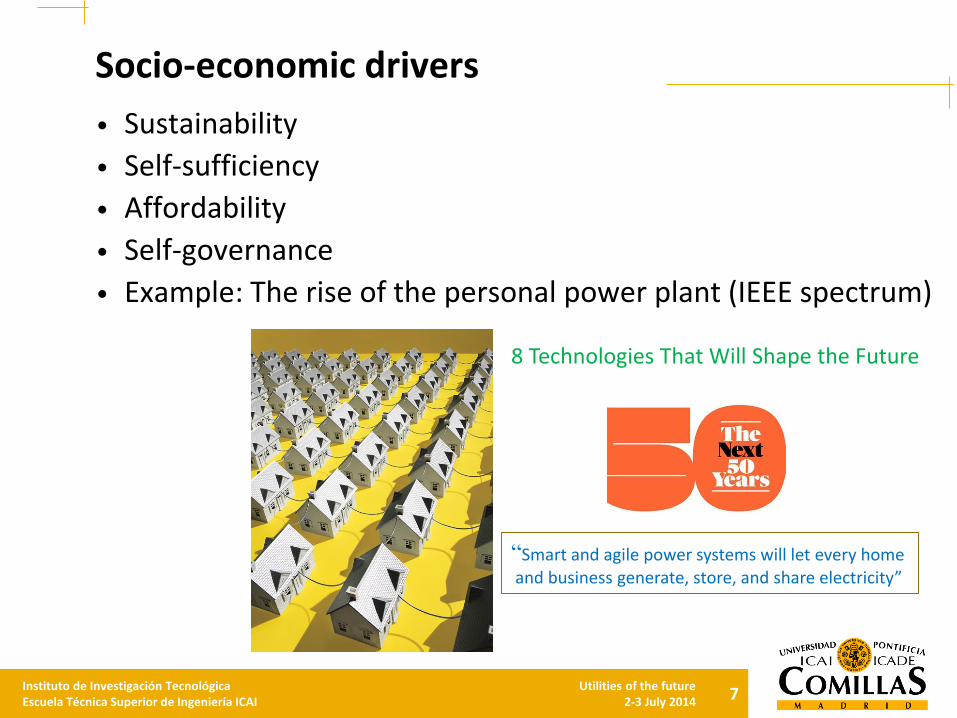
Socio-economic drivers
• Sustainability
• Self-sufficiency
• Affordability
• Self-governance
• Example: The rise of the personal power plant (IEEE spectrum)
“Smart and agile power systems will let every homeand business generate, store, and share electricity”
8 Technologies That Will Shape the Future
8Instituto de Investigación TecnológicaEscuela Técnica Superior de Ingeniería ICAI
Utilities of the future2-3 July 2014
System-wide impacts
• If the provision of electricity services becomes more diverse and decentralized (in a fundamental and sustainable manner)
• Greater competition for centralized generators
• Changes to transmission and distribution system
investment and operation
• Changes in energy mix, with implications for climate
change
9Instituto de Investigación TecnológicaEscuela Técnica Superior de Ingeniería ICAI
Utilities of the future2-3 July 2014
Contents• Research focus
• From technologies to business models
• Analytical models
• Future research
10Instituto de Investigación TecnológicaEscuela Técnica Superior de Ingeniería ICAI
Utilities of the future2-3 July 2014
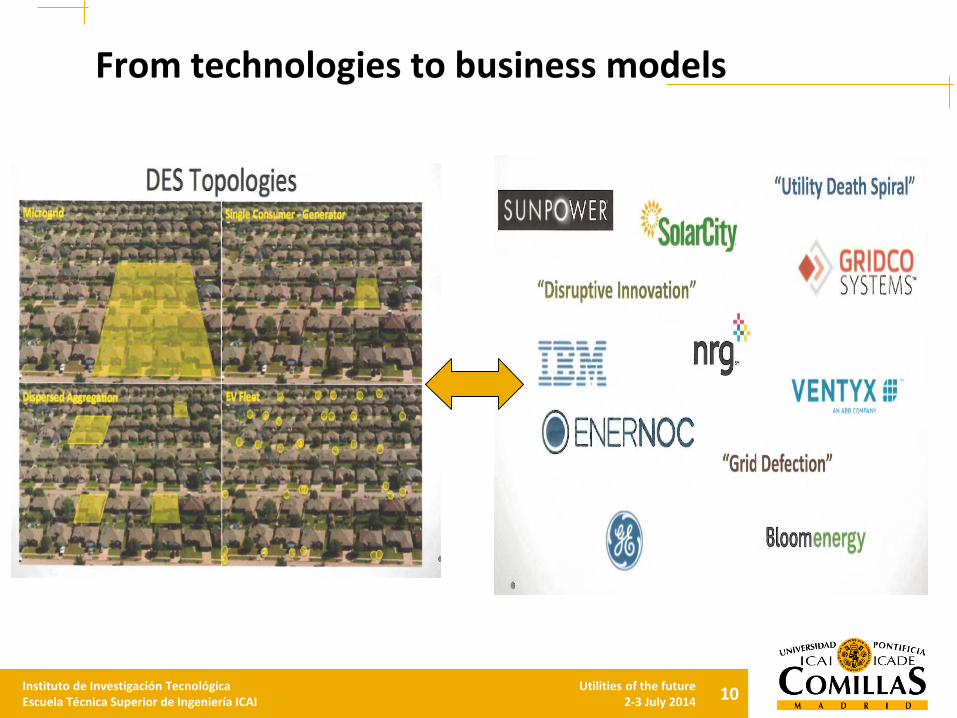
From technologies to business models
11Instituto de Investigación TecnológicaEscuela Técnica Superior de Ingeniería ICAI
Utilities of the future2-3 July 2014
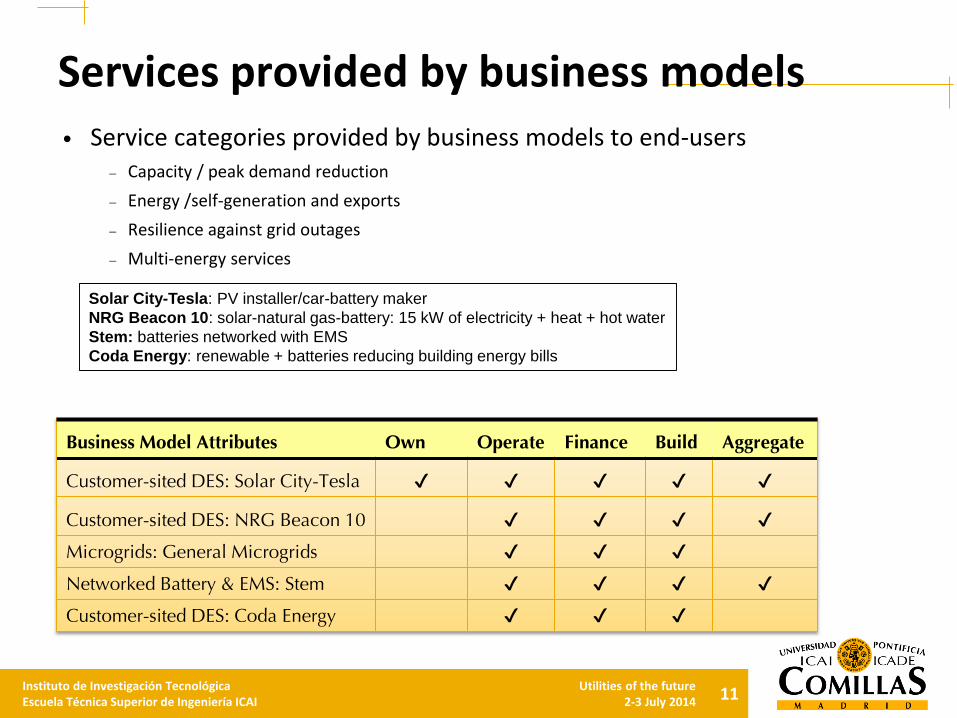
Business Model Attributes Own Operate Finance Build Aggregate
Customer-sited DES: Solar City-Tesla ✔ ✔ ✔ ✔ ✔
Customer-sited DES: NRG Beacon 10 ✔ ✔ ✔ ✔
Microgrids: General Microgrids ✔ ✔ ✔
Networked Battery & EMS: Stem ✔ ✔ ✔ ✔
Customer-sited DES: Coda Energy ✔ ✔ ✔
Services provided by business models• Service categories provided by business models to end-users
– Capacity / peak demand reduction
– Energy /self-generation and exports
– Resilience against grid outages
– Multi-energy services
Solar City-Tesla: PV installer/car-battery maker
NRG Beacon 10: solar-natural gas-battery: 15 kW of electricity + heat + hot water
Stem: batteries networked with EMS
Coda Energy: renewable + batteries reducing building energy bills
12Instituto de Investigación TecnológicaEscuela Técnica Superior de Ingeniería ICAI
Utilities of the future2-3 July 2014
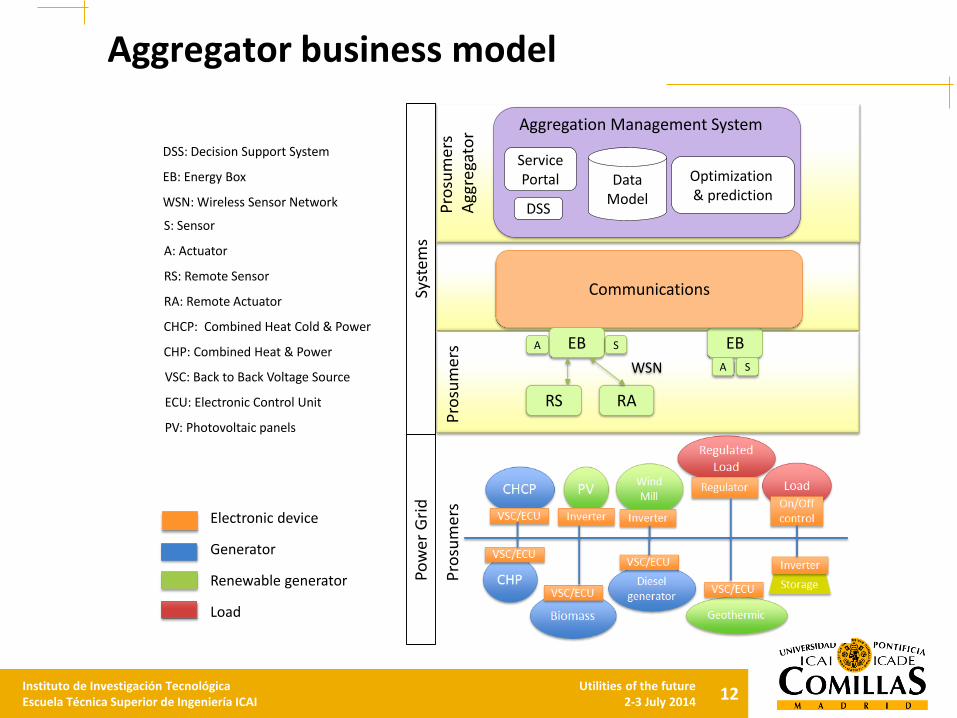
Aggregator business model
Electronic device
Generator
Renewable generator
Load
VSC: Back to Back Voltage Source
ECU: Electronic Control Unit
PV: Photovoltaic panels
CHCP: Combined Heat Cold & Power
CHP: Combined Heat & PowerEB
SA
Communications
DataModel
ServicePortal
DSS
Optimization& prediction
EB
RS RA
SA
WSN
Aggregation Management System
DSS: Decision Support System
EB: Energy Box
WSN: Wireless Sensor Network
S: Sensor
A: Actuator
RS: Remote Sensor
RA: Remote Actuator
Syst
em
sP
ow
er
Gri
d
Pro
sum
ers
Pro
sum
ers
Pro
sum
ers
Agg
rega
tor
13Instituto de Investigación TecnológicaEscuela Técnica Superior de Ingeniería ICAI
Utilities of the future2-3 July 2014
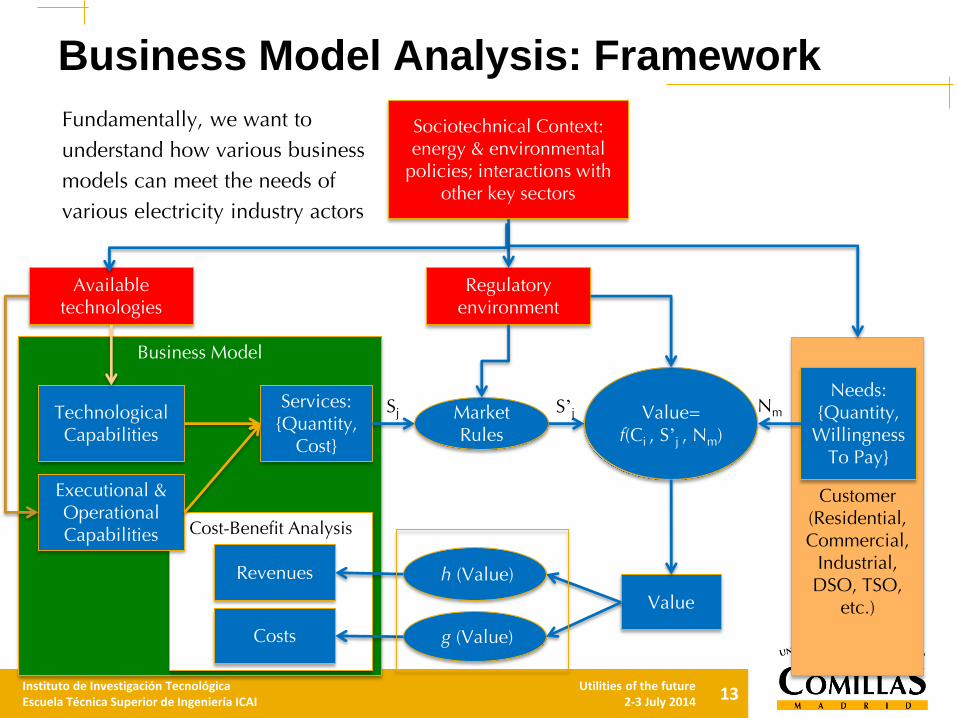
Business Model
Cost-Benefit Analysis
Customer(Residential, Commercial,
Industrial, DSO, TSO,
etc.)
TechnologicalCapabilities
Services: {Quantity,
Cost}
Costs
Revenues
Needs:{Quantity,
Willingness To Pay}
Value
Value=f(Ci , S’j , Nm)
Sj Nm
Available technologies
Sociotechnical Context: energy & environmental
policies; interactions with other key sectors
g (Value)
h (Value)
Regulatory environment
Executional & OperationalCapabilities
Market Rules
S’j
Business Model Analysis: Framework
Fundamentally, we want to understand how various business models can meet the needs of various electricity industry actors
14Instituto de Investigación TecnológicaEscuela Técnica Superior de Ingeniería ICAI
Utilities of the future2-3 July 2014
Contents• Research focus
• From technologies to business models
• Analytical models
• Future research
15Instituto de Investigación TecnológicaEscuela Técnica Superior de Ingeniería ICAI
Utilities of the future2-3 July 2014
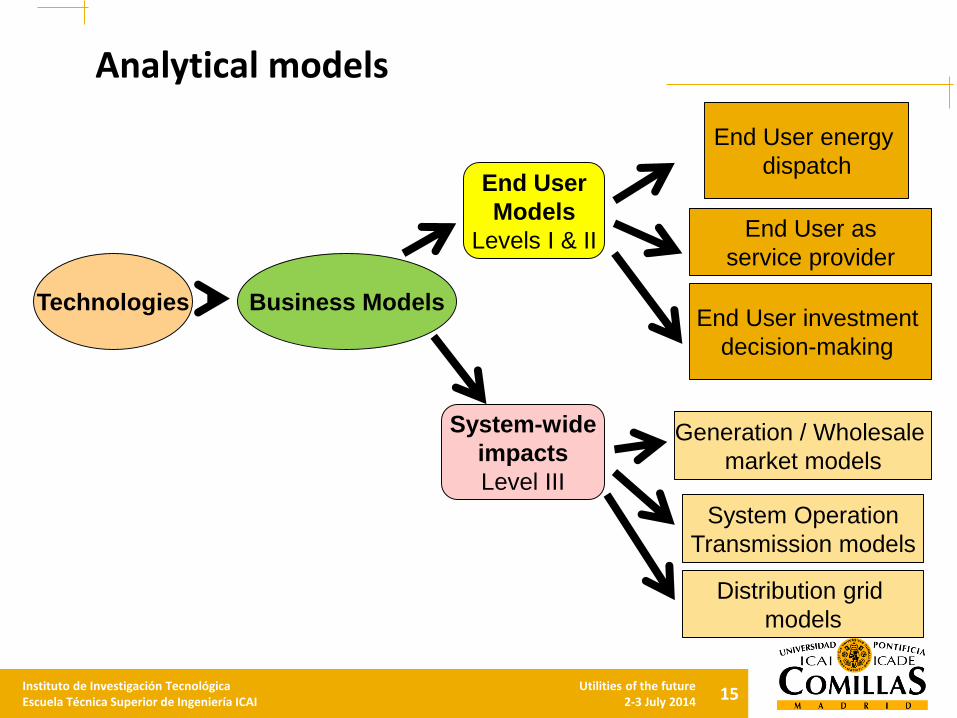
Analytical models
Technologies Business Models
End User
Models
Levels I & II
System-wide
impacts
Level III
End User energy
dispatch
End User investment
decision-making
End User as
service provider
Generation / Wholesale
market models
System Operation
Transmission models
Distribution grid
models
16Instituto de Investigación TecnológicaEscuela Técnica Superior de Ingeniería ICAI
Utilities of the future2-3 July 2014
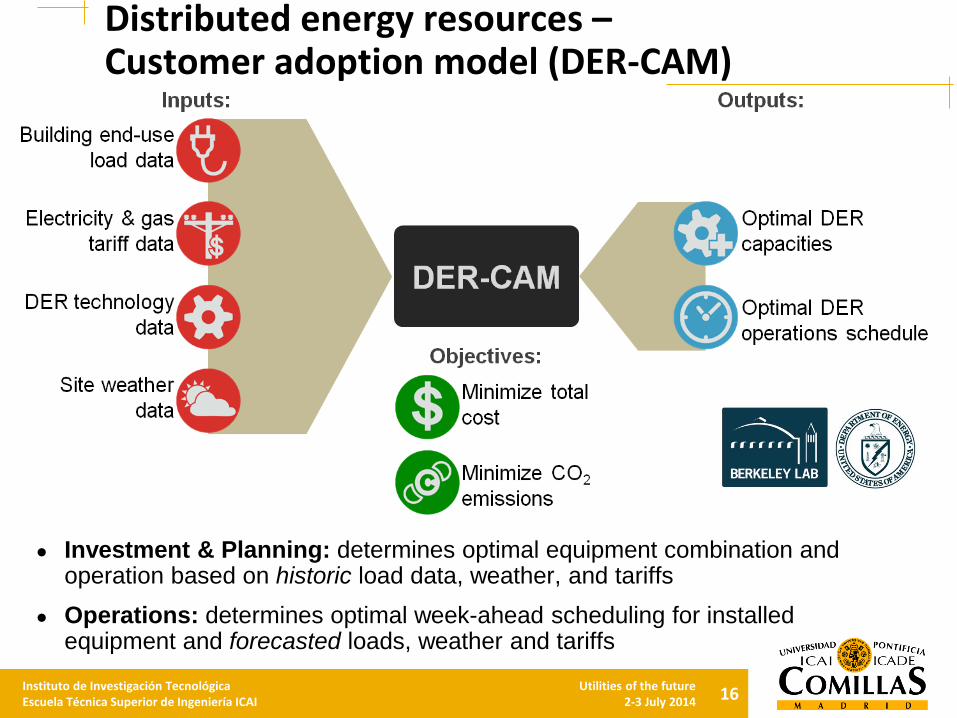
Distributed energy resources –Customer adoption model (DER-CAM)
● Investment & Planning: determines optimal equipment combination and operation based on historic load data, weather, and tariffs
● Operations: determines optimal week-ahead scheduling for installed equipment and forecasted loads, weather and tariffs
17Instituto de Investigación TecnológicaEscuela Técnica Superior de Ingeniería ICAI
Utilities of the future2-3 July 2014
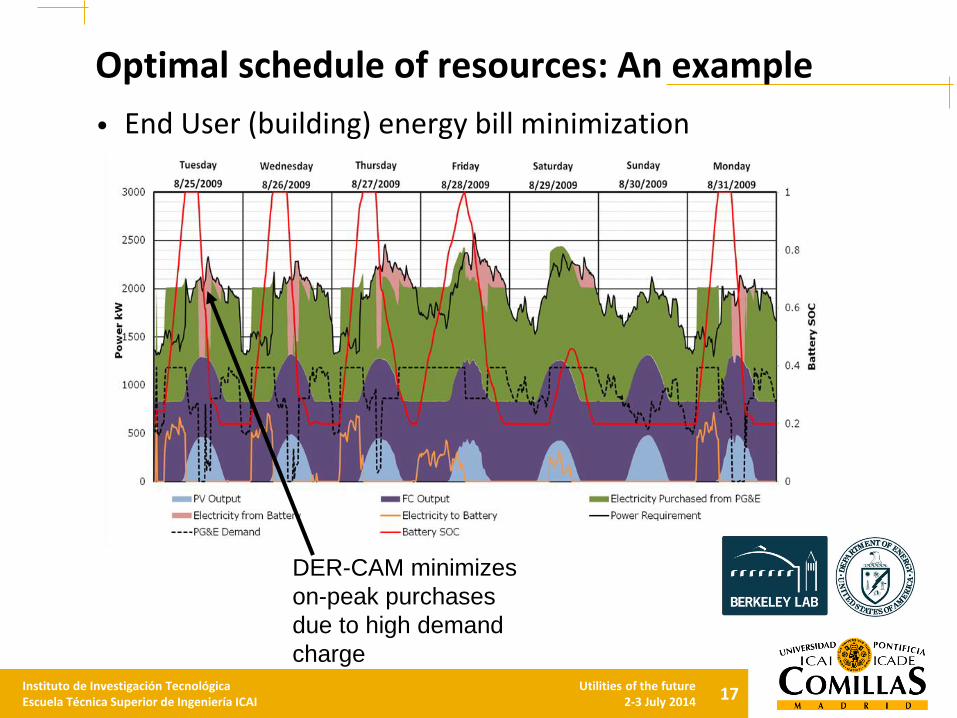
Optimal schedule of resources: An example
• End User (building) energy bill minimization
DER-CAM minimizes
on-peak purchases
due to high demand
charge
18Instituto de Investigación TecnológicaEscuela Técnica Superior de Ingeniería ICAI
Utilities of the future2-3 July 2014
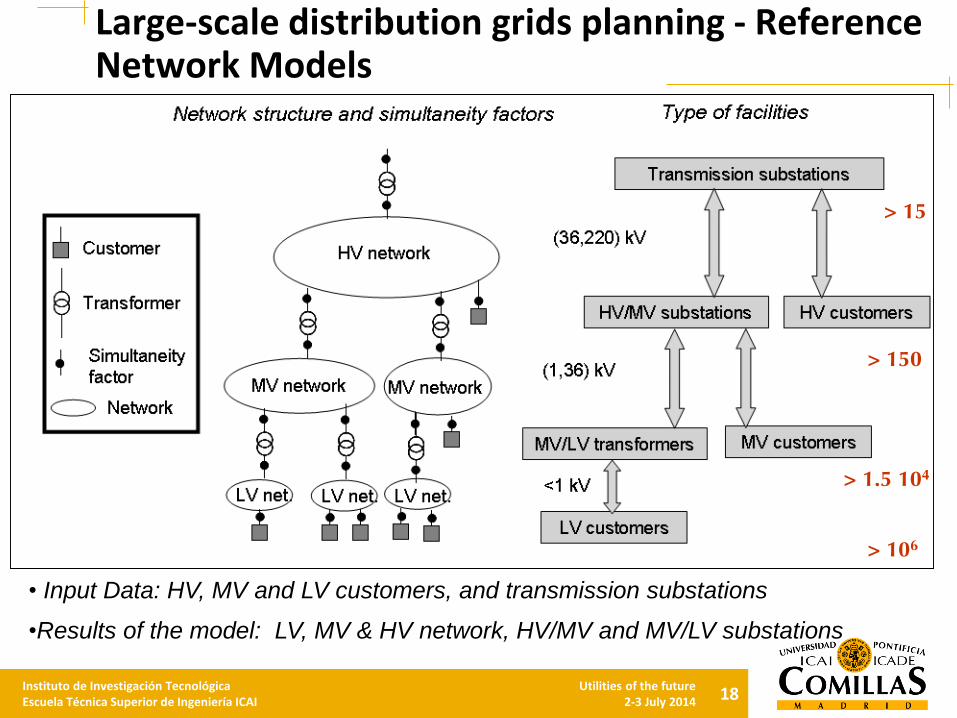
Large-scale distribution grids planning - Reference Network Models
> 15
> 150
> 106
> 1.5 104
• Input Data: HV, MV and LV customers, and transmission substations
•Results of the model: LV, MV & HV network, HV/MV and MV/LV substations
19Instituto de Investigación TecnológicaEscuela Técnica Superior de Ingeniería ICAI
Utilities of the future2-3 July 2014
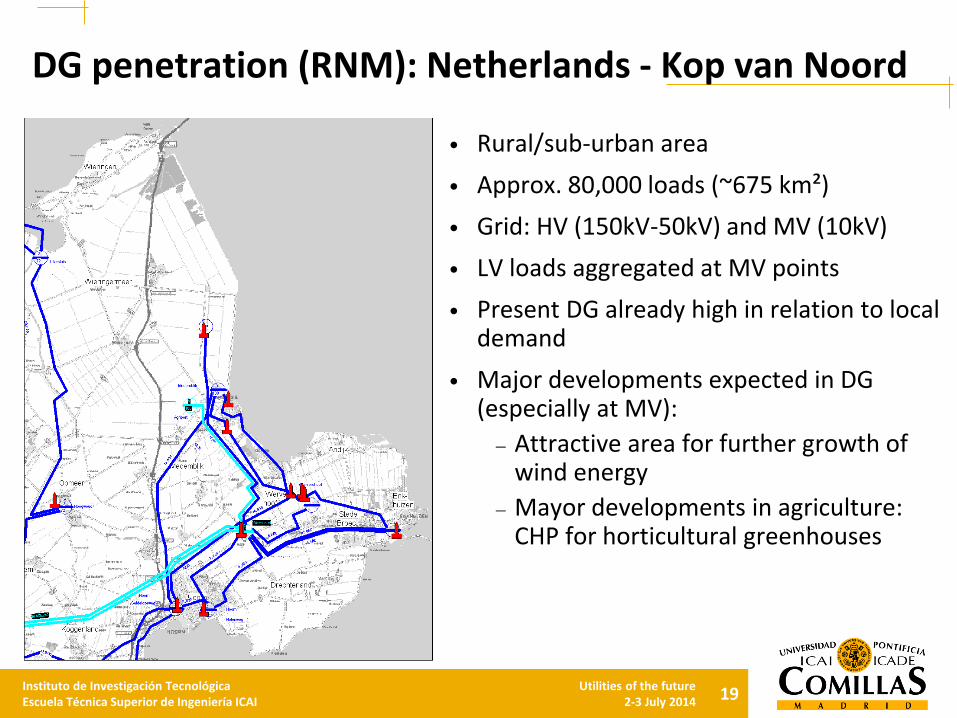
DG penetration (RNM): Netherlands - Kop van Noord
• Rural/sub-urban area
• Approx. 80,000 loads (~675 km²)
• Grid: HV (150kV-50kV) and MV (10kV)
• LV loads aggregated at MV points
• Present DG already high in relation to local demand
• Major developments expected in DG (especially at MV):
– Attractive area for further growth of wind energy
– Mayor developments in agriculture: CHP for horticultural greenhouses
20Instituto de Investigación TecnológicaEscuela Técnica Superior de Ingeniería ICAI
Utilities of the future2-3 July 2014
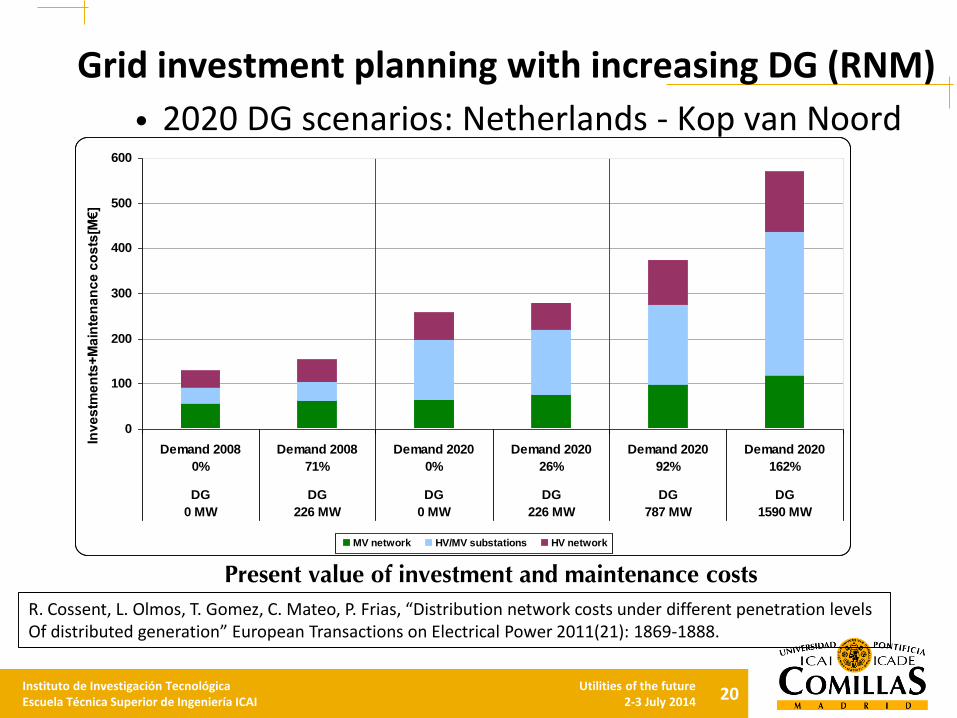
Grid investment planning with increasing DG (RNM)
0
100
200
300
400
500
600
Demand 2008
0%
Demand 2008
71%
Demand 2020
0%
Demand 2020
26%
Demand 2020
92%
Demand 2020
162%
DG
0 MW
DG
226 MW
DG
0 MW
DG
226 MW
DG
787 MW
DG
1590 MW
Inv
es
tme
nts
+M
ain
ten
an
ce
co
sts
[M€
]
MV network HV/MV substations HV network
Present value of investment and maintenance costs
• 2020 DG scenarios: Netherlands - Kop van Noord
R. Cossent, L. Olmos, T. Gomez, C. Mateo, P. Frias, “Distribution network costs under different penetration levelsOf distributed generation” European Transactions on Electrical Power 2011(21): 1869-1888.
21Instituto de Investigación TecnológicaEscuela Técnica Superior de Ingeniería ICAI
Utilities of the future2-3 July 2014
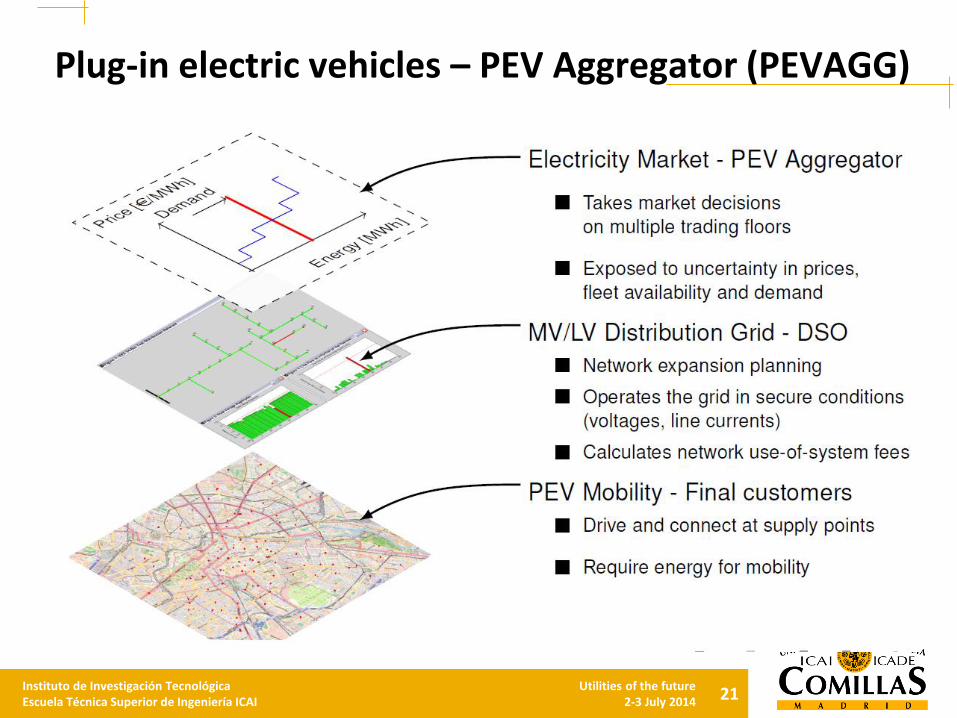
Plug-in electric vehicles – PEV Aggregator (PEVAGG)
22Instituto de Investigación TecnológicaEscuela Técnica Superior de Ingeniería ICAI
Utilities of the future2-3 July 2014
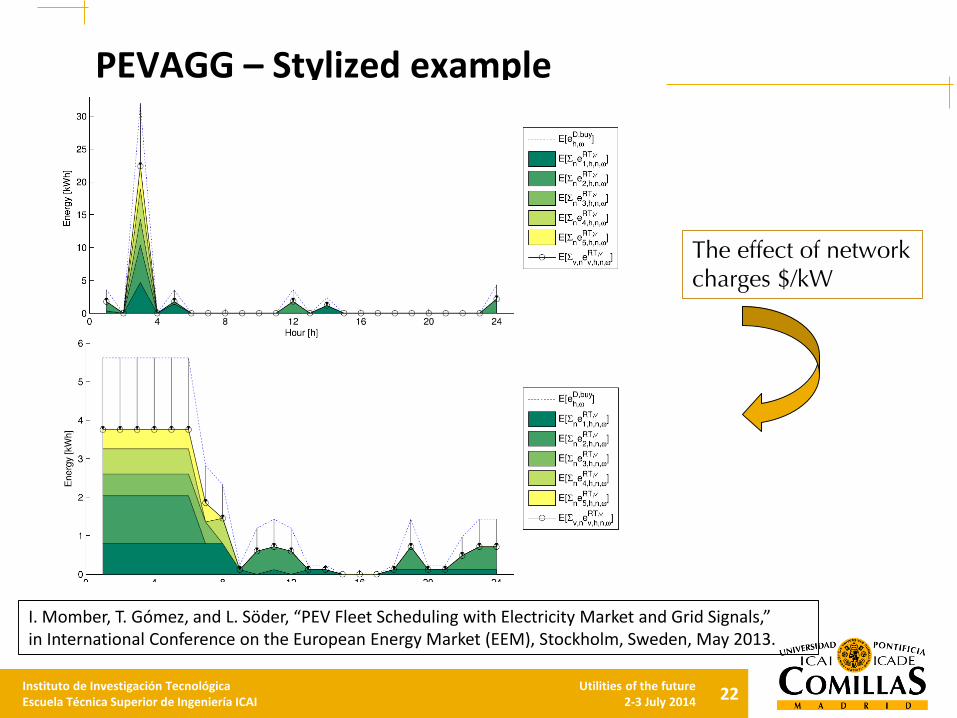
PEVAGG – Stylized example
The effect of networkcharges $/kW
I. Momber, T. Gómez, and L. Söder, “PEV Fleet Scheduling with Electricity Market and Grid Signals,” in International Conference on the European Energy Market (EEM), Stockholm, Sweden, May 2013.
23Instituto de Investigación TecnológicaEscuela Técnica Superior de Ingeniería ICAI
Utilities of the future2-3 July 2014
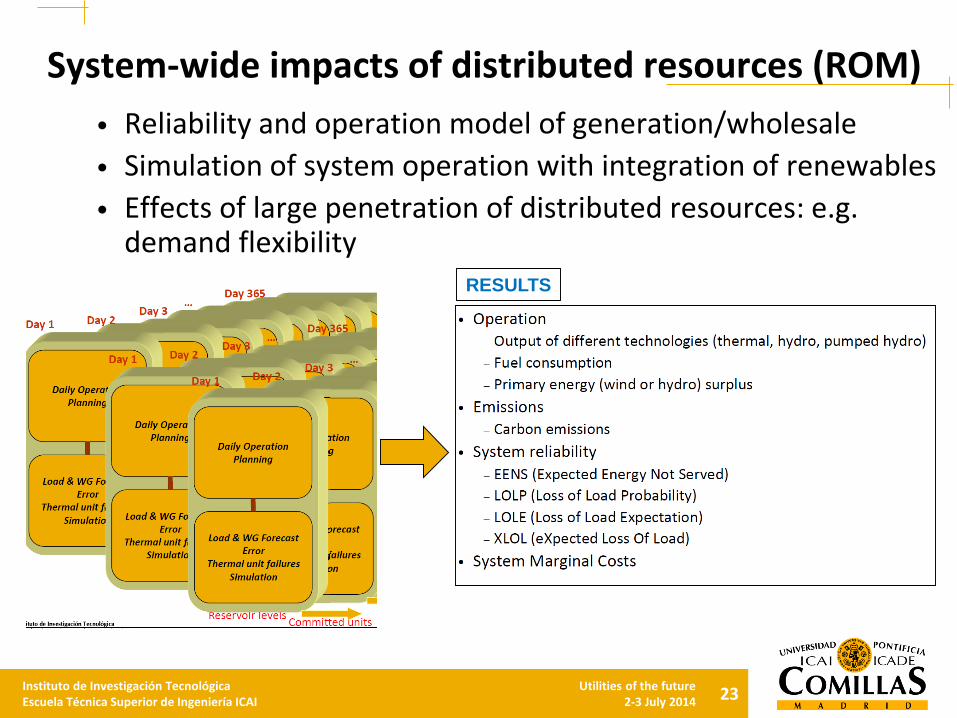
System-wide impacts of distributed resources (ROM)
• Reliability and operation model of generation/wholesale
• Simulation of system operation with integration of renewables
• Effects of large penetration of distributed resources: e.g. demand flexibility
RESULTS
24Instituto de Investigación TecnológicaEscuela Técnica Superior de Ingeniería ICAI
Utilities of the future2-3 July 2014
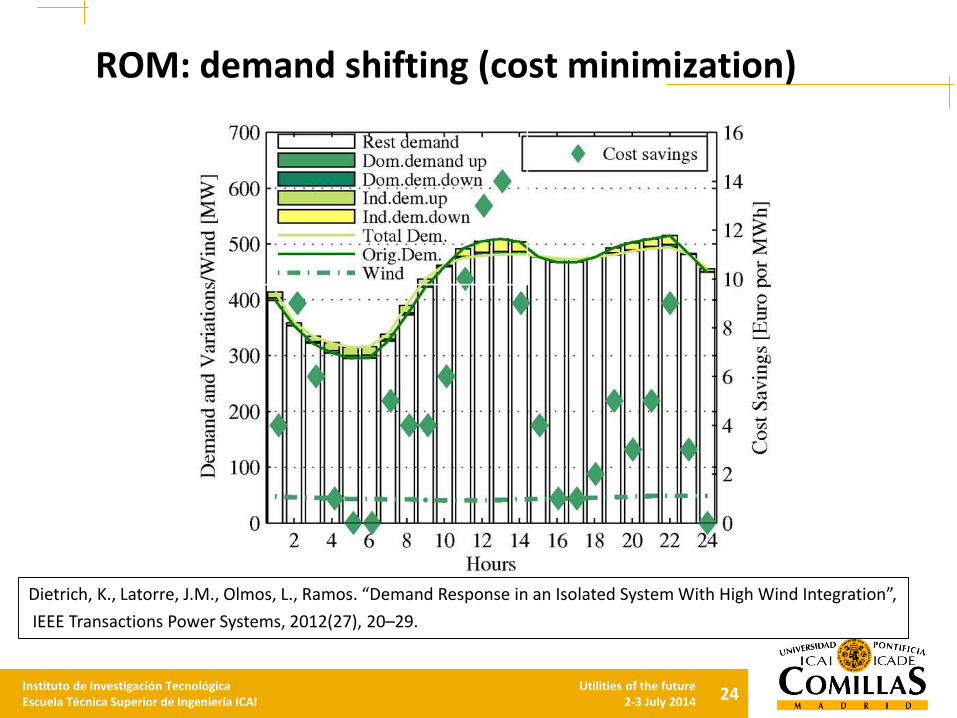
ROM: demand shifting (cost minimization)
Dietrich, K., Latorre, J.M., Olmos, L., Ramos. “Demand Response in an Isolated System With High Wind Integration”,
IEEE Transactions Power Systems, 2012(27), 20–29.
26 IEEE TRANSACTIONS ON POWER SYSTEMS, VOL. 27, NO. 1, FEBRUARY 2012
Fig. 2. Difference of marginal costs between high/low and average wind day.
TABLE ICOST SAVINGS AND DEMAND VARIATIONS
Cost savings achieved when introducing demand shifting are
higher on high wind days than on an average day (see Table I).
This is due to the higher amount of demand that is shifted on
these days. Marginal cost differences with respect to values for
the average day both without DSM and with DSM comparing
high and low wind days can be seen in Fig. 2. Positive cost
differences indicate higher cost than on the average day while
negative cost differences indicate lower cost than on the av-
erage day. With DSM, the difference in marginal cost is mostly
smaller, which means that demand shifting is outweighing part
of the effect caused by wind.
Relative demand variations caused by shifting are shown in
Fig. 3. It can be seen that demand is shifted in all three types of
days to the night hours. Furthermore, on windy days, more de-
mand is shifted between the second load peak and the valley be-
tween the two peaks during the day. This may be caused by the
fact that the difference between valley and peak load is bigger
on windy days (up to 100 MW) than on low wind and average
days (up to 33 and 48 MW, respectively). Fig. 4 shows the total
amount of demand shifted over the day when using the central-
ized load-shifting model without penalty. It shows the original
demand , wind production and demand variations
and on the left axis as well as hourly cost
savings when introducing demand shifting on the right axis.
Demand variations are classified by the type of consumer (do-
mestic, commercial, and industrial) and by the direction (up-
ward and downward variation).
One of the days with the highest wind production, which co-
incided to be weekend (Sunday), has been chosen to show the
effect of demand shifting. Low electricity demand combined
Fig. 3. Demand shifting in centralized model on different wind days.
Fig. 4. Demand shifting in centralized model.
Fig. 5. Demand shifting in high wind day in centralized model.
with high wind production can cause system operation prob-
lems. Thermal plants may have to go offline resulting in less
capacity being available to provide downward reserve. Fig. 5
shows demand, wind rates, demand shifting participations, and
cost savings when introducing DSM for each hour. Wind en-
ergy production represents, on average, 36.5% of demand going
up to over 52% during early morning hours. Shifted demand
25Instituto de Investigación TecnológicaEscuela Técnica Superior de Ingeniería ICAI
Utilities of the future2-3 July 2014
Contents• Research focus
• From technologies to business models
• Analytical models
• Future research
26Instituto de Investigación TecnológicaEscuela Técnica Superior de Ingeniería ICAI
Utilities of the future2-3 July 2014
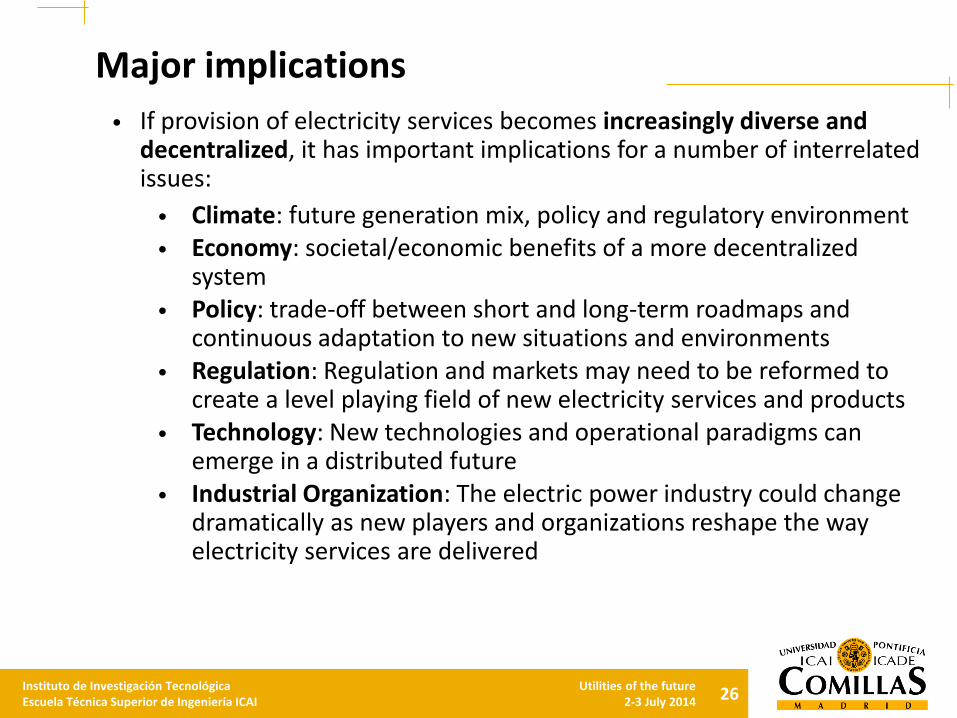
Major implications
• If provision of electricity services becomes increasingly diverse and decentralized, it has important implications for a number of interrelated issues:
• Climate: future generation mix, policy and regulatory environment• Economy: societal/economic benefits of a more decentralized
system • Policy: trade-off between short and long-term roadmaps and
continuous adaptation to new situations and environments• Regulation: Regulation and markets may need to be reformed to
create a level playing field of new electricity services and products• Technology: New technologies and operational paradigms can
emerge in a distributed future• Industrial Organization: The electric power industry could change
dramatically as new players and organizations reshape the way electricity services are delivered
27Instituto de Investigación TecnológicaEscuela Técnica Superior de Ingeniería ICAI
Utilities of the future2-3 July 2014
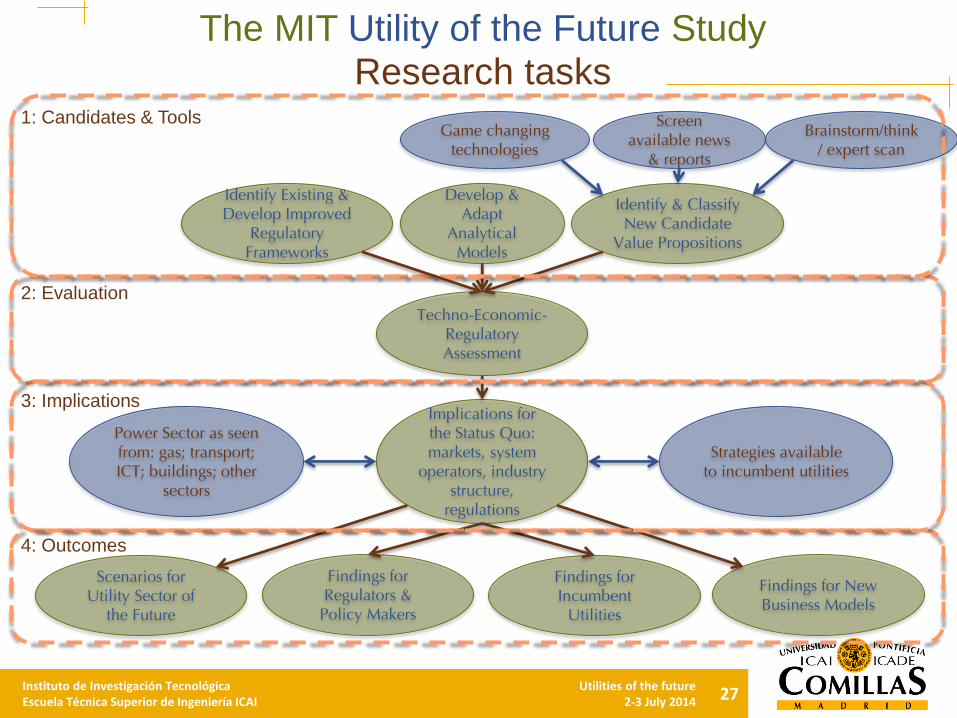
The MIT Utility of the Future StudyResearch tasks
Identify & Classify New Candidate
Value Propositions
Techno-Economic-Regulatory Assessment
Implications for the Status Quo: markets, system
operators, industry structure,
regulations
Scenarios for Utility Sector of
the Future
Findings for Regulators &
Policy Makers
Findings for New Business Models
Findings for Incumbent
Utilities
4: Outcomes
3: Implications
2: Evaluation
1: Candidates & ToolsGame changing
technologies
Screen available news
& reports
Develop & Adapt
Analytical Models
Brainstorm/think/ expert scan
Power Sector as seen from: gas; transport; ICT; buildings; other
sectors
Strategies available to incumbent utilities
Identify Existing & Develop Improved
Regulatory Frameworks
28Instituto de Investigación TecnológicaEscuela Técnica Superior de Ingeniería ICAI
Utilities of the future2-3 July 2014
Major Questions
• What new business models (BMs) could succeed?
o Which factors determine success & failure?
• How these BMs could complement / compete with / add to
the services provided by the incumbent utilities?
o How much could these BMs penetrate?
• How other sectors (gas, ICT, buildings, transportation) could be
affected / participate in this transformation?
• What major shortcomings exist in current regulation to be
taken advantage of by BMs?
o How to fix them to create a level playing field?
• What are some realistic scenarios of the delivery of electricity
services in 2025?
Instituto de Investigación Tecnológica
Santa Cruz de Marcenado, 26
28015 Madrid
Tel +34 91 542 28 00
Fax + 34 91 542 31 76
www.upcomillas.es
Thank you for your attention !!!
“Utility of the Future” Project Team:
Principal Investigators: Profs. Ignacio Pérez-Arriaga & Christopher Knittel
Faculty Committee: Profs. John Deutch, Tomas Gómez, Stephen Leeb,
Richard Lester, Les Norford, Nancy Rose, Richard Schmalensee
Project Directors: Drs. Richard Tabors & Raanan Miller
Research Team: Ashwini Bharatkumar, Scott Burger, Jose Pablo Chaves,
Jesse Jenkins, Raanan Miller, Richard Tabors & Nora Xu
Advisors: Profs. Carlos Batlle, Pablo Frías, Javier Reneses,
Michel Rivier & Alvaro Sánchez


