76
Utilities QlikTalk Esri UK, QlikTech & Differentia Consulting

Utilities QlikTalk
Esri UK, QlikTech
& Differentia Consulting
Legal Disclaimer
This Presentation contains forward-looking statements, including, but not limited to, statements regarding the value
and effectiveness of QlikTech's products, the introduction of product enhancements or additional products and
QlikTech's growth, expansion and market leadership, that involve risks, uncertainties, assumptions and other factors
which, if they do not materialize or prove correct, could cause QlikTech's results to differ materially from those
expressed or implied by such forward-looking statements. All statements, other than statements of historical fact, are
statements that could be deemed forward-looking statements, including statements containing the words "predicts,"
"plan," "expects," "anticipates," "believes," "goal," "target," "estimate," "potential," "may", "will," "might," "could," and
similar words. QlikTech intends all such forward-looking statements to be covered by the safe harbor provisions for
forward-looking statements contained in Section 21E of the Exchange Act and the Private Securities Litigation Reform
Act of 1995. Actual results may differ materially from those projected in such statements due to various factors,
including but not limited to: risks and uncertainties inherent in our business; our ability to attract new customers and
retain existing customers; our ability to effectively sell, service and support our products; our ability to manage our
international operations; our ability to compete effectively; our ability to develop and introduce new products and add-
ons or enhancements to existing products; our ability to continue to promote and maintain our brand in a cost-effective
manner; our ability to manage growth; our ability to attract and retain key personnel; the scope and validity of
intellectual property rights applicable to our products; adverse economic conditions in general and adverse economic
conditions specifically affecting the markets in which we operate; and other risks more fully described in QlikTech's
publicly available filings with the Securities and Exchange Commission. Past performance is not necessarily indicative
of future results. The forward-looking statements included in this presentation represent QlikTech's views as of the
date of this presentation. QlikTech anticipates that subsequent events and developments will cause its views to
change. QlikTech undertakes no intention or obligation to update or revise any forward-looking statements, whether
as a result of new information, future events or otherwise. These forward-looking statements should not be relied upon
as representing QlikTech's views as of any date subsequent to the date of this presentation.
This Presentation should be read in conjunction with QlikTech's periodic reports filed with the SEC (SEC Information),
including the disclosures therein of certain factors which may affect QlikTech’s future performance. Individual
statements appearing in this Presentation are intended to be read in conjunction with and in the context of the
complete SEC Information documents in which they appear, rather than as stand-alone statements.
© 2012 Qlik Technologies Inc. All rights reserved. QlikTech and QlikView are trademarks or registered trademarks of
Qlik Technologies Inc. or its subsidiaries in the U.S. and other countries. Other company names, product names and
company logos mentioned herein are the trademarks, or registered trademarks of their owners.
Agenda
09:30am: Registration open
10:00am: Arrivals and Networking
10:30am: Welcome and Introduction - Kevin Doughty, Esri UK
and Tom Truman, QlikView
11:00am Introduction to QlikView and Business Discovery
Mark Rodell – Senior Enterprise Architect QlikTech UK
11:30am: Refreshment Break
11:45am: Keynote: The Role of IT in the Utility of the Future
Stuart Ravens, Ovum
12:15pm: Location-based Dashboards
Kevin Doughty, Esri UK
12:30pm: Differentia Consulting - A Business Discovery Approach - Kit Mundy, Differentia Consulting
1:00pm: Networking Lunch
1.45pm: Integration examples with QlikView and Esri ArcGIS - Alasdair Hind Utilities Industry Lead - Technical
2:30pm: Q&A
2:45pm: End
Agenda
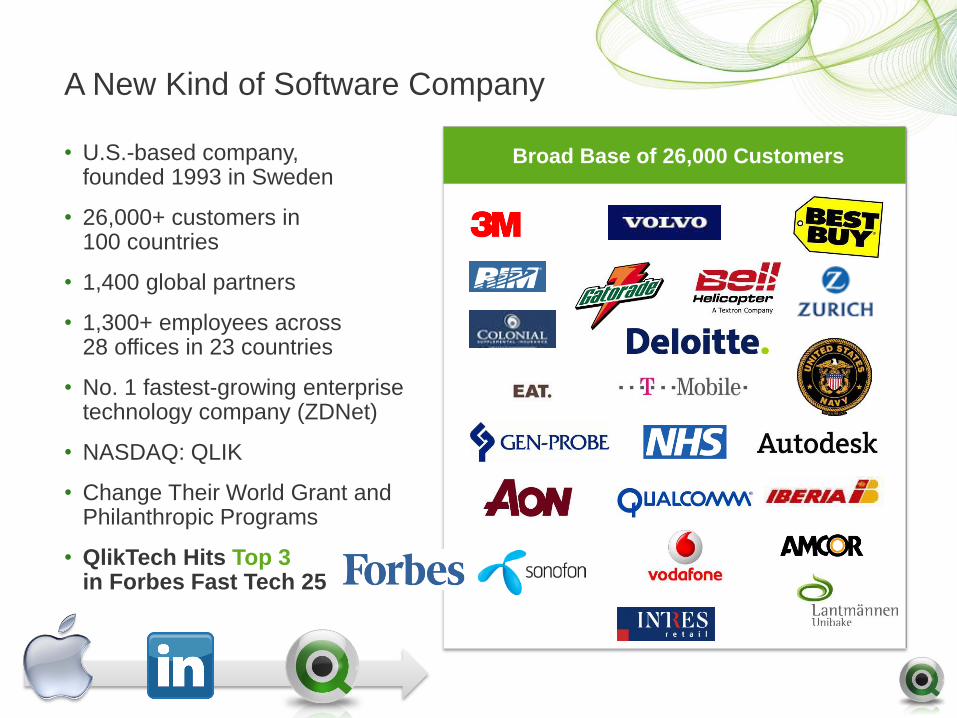
A New Kind of Software Company
• U.S.-based company, founded 1993 in Sweden
• 26,000+ customers in 100 countries
• 1,400 global partners
• 1,300+ employees across 28 offices in 23 countries
• No. 1 fastest-growing enterprise technology company (ZDNet)
• NASDAQ: QLIK
• Change Their World Grant and Philanthropic Programs
• QlikTech Hits Top 3 in Forbes Fast Tech 25
Broad Base of 26,000 Customers
…existing QlikView energy and utilities customers

Esri UK Introductory Slides
Kevin Doughty – Head of Business, Utilities- Esri UK
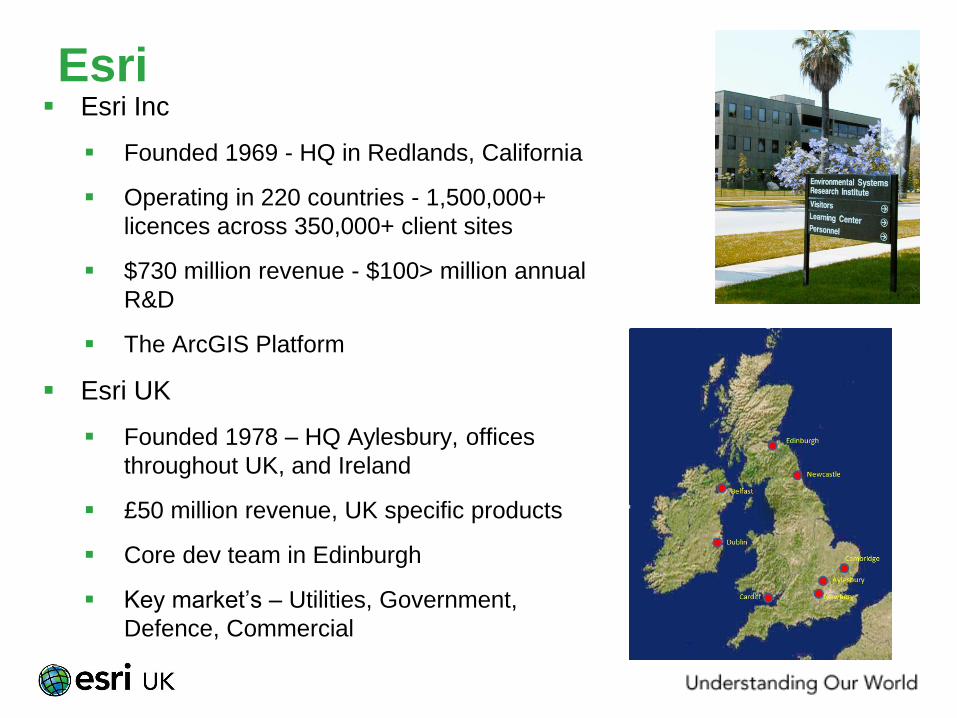
Esri Esri Inc
Founded 1969 - HQ in Redlands, California
Operating in 220 countries - 1,500,000+
licences across 350,000+ client sites
$730 million revenue - $100> million annual
R&D
The ArcGIS Platform
Esri UK
Founded 1978 – HQ Aylesbury, offices
throughout UK, and Ireland
£50 million revenue, UK specific products
Core dev team in Edinburgh
Key market’s – Utilities, Government,
Defence, Commercial
Introduction to QlikView and Business Discovery
Mark Rodell – Senior Enterprise Architect
QlikTech UK
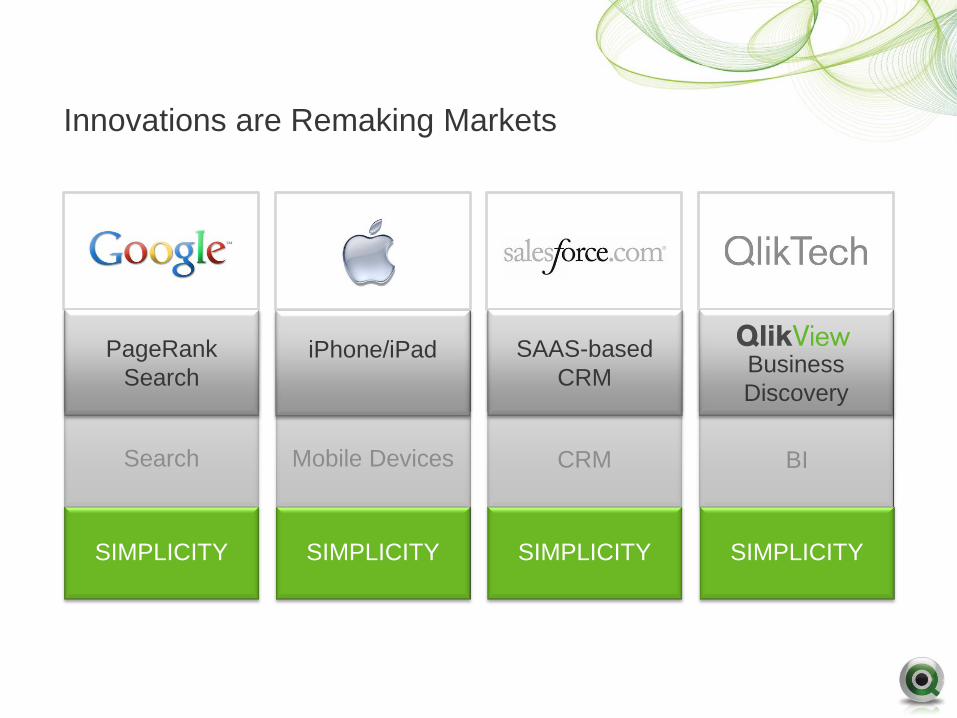
Mobile Devices Search
Innovations are Remaking Markets
BI CRM
SIMPLICITY SIMPLICITY SIMPLICITY SIMPLICITY
PageRank
Search iPhone/iPad SAAS-based
CRM Business
Discovery
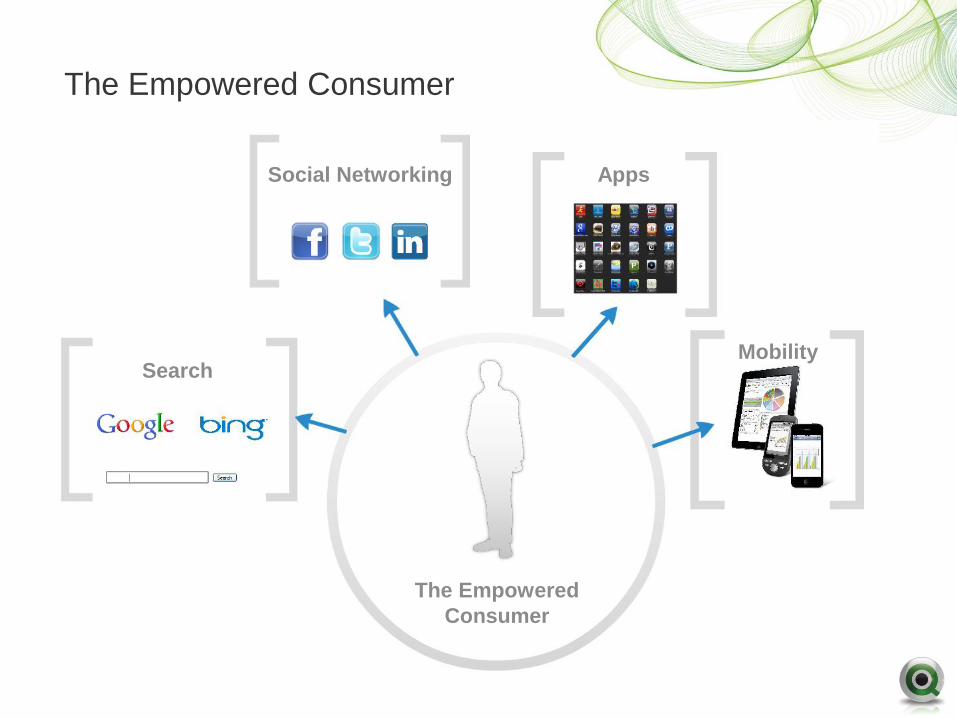
The Empowered Consumer
Mobility Search
Social Networking Apps
The Empowered
Consumer
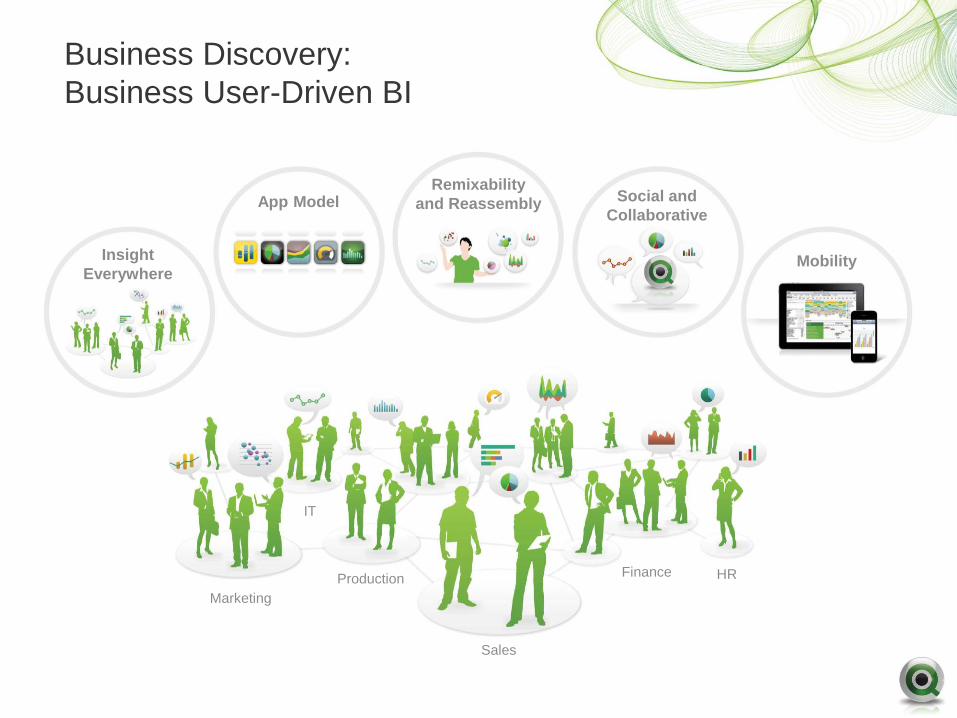
Business Discovery:
Business User-Driven BI
Insight
Everywhere
App Model Remixability
and Reassembly Social and
Collaborative
Mobility
Finance HR
Sales
Marketing
IT
Production
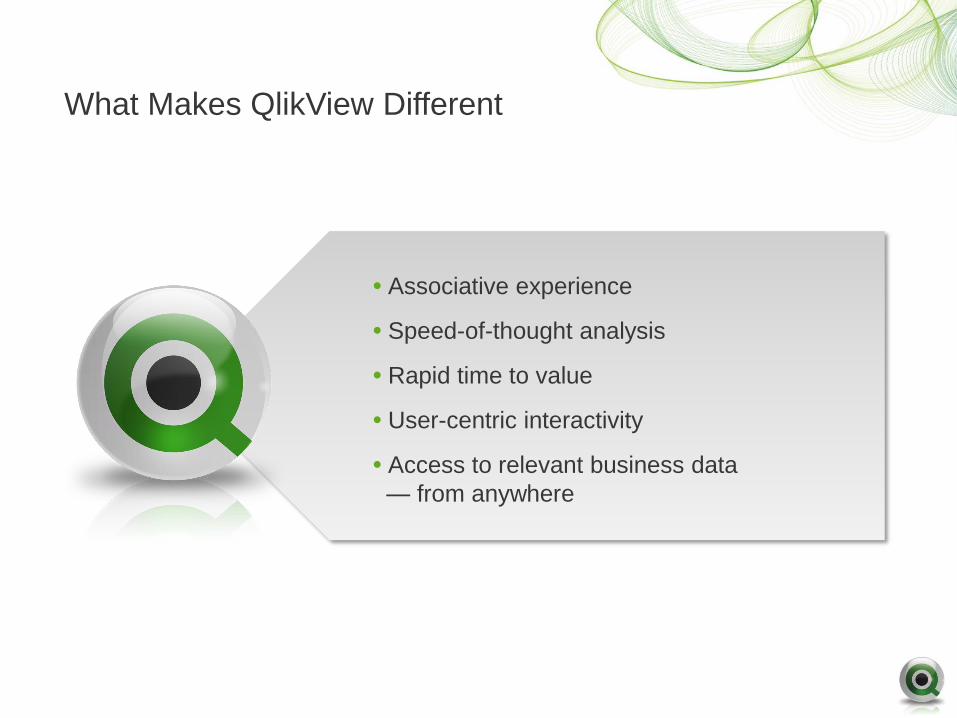
What Makes QlikView Different
• Associative experience
• Speed-of-thought analysis
• Rapid time to value
• User-centric interactivity
• Access to relevant business data
— from anywhere
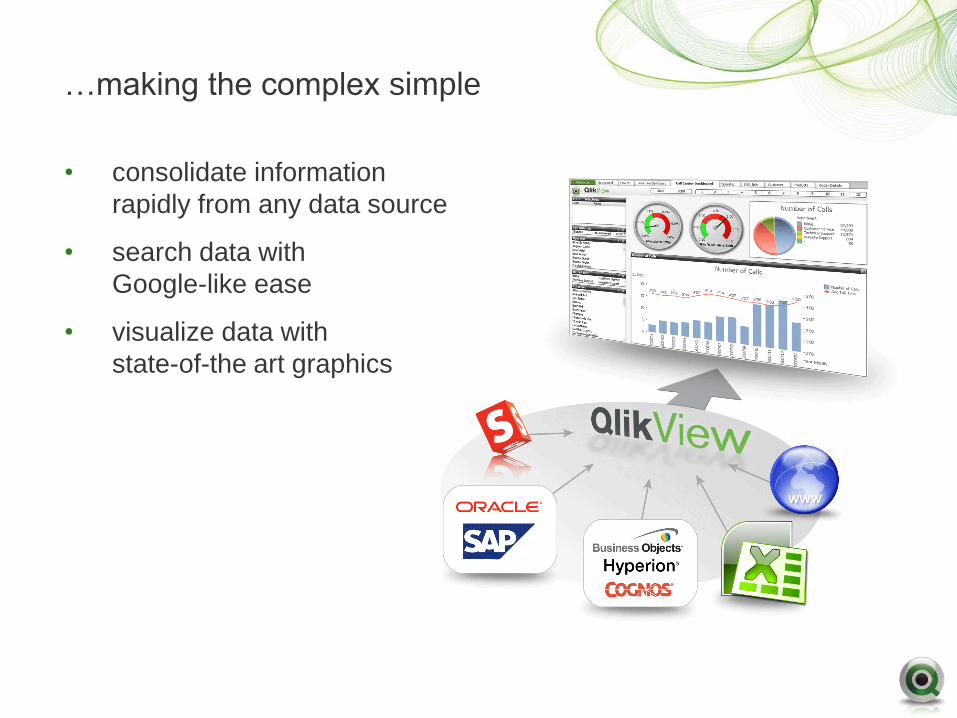
…making the complex simple
• consolidate information
rapidly from any data source
• search data with
Google-like ease
• visualize data with
state-of-the art graphics
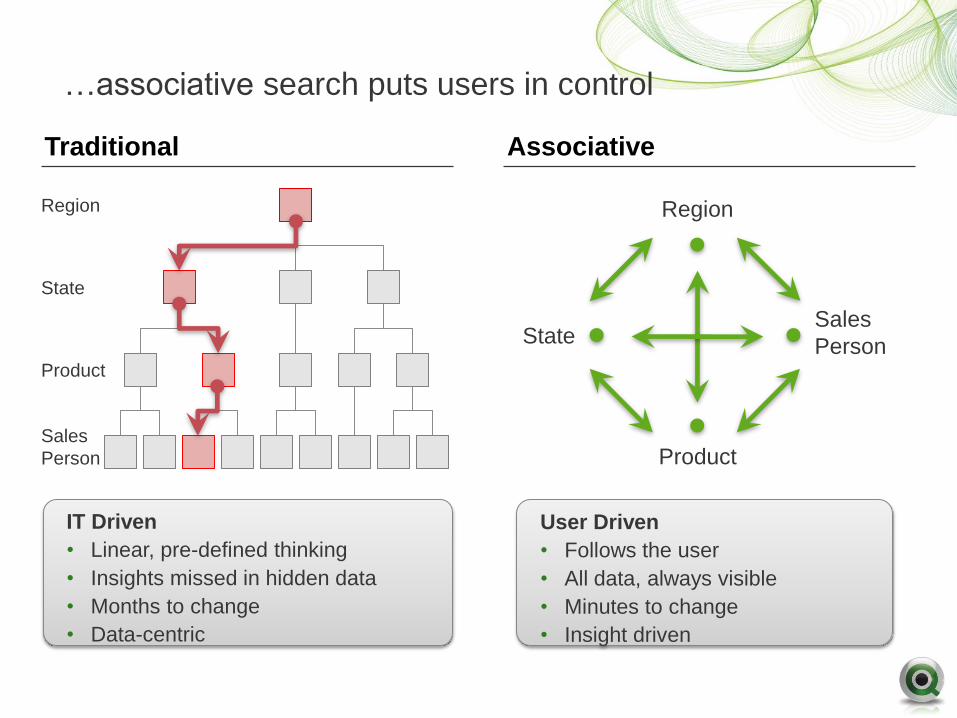
…associative search puts users in control
Region
State
Product
Sales
Person
IT Driven
• Linear, pre-defined thinking
• Insights missed in hidden data
• Months to change
• Data-centric
User Driven
• Follows the user
• All data, always visible
• Minutes to change
• Insight driven
Traditional Associative
Region
Product
State Sales
Person
QlikView
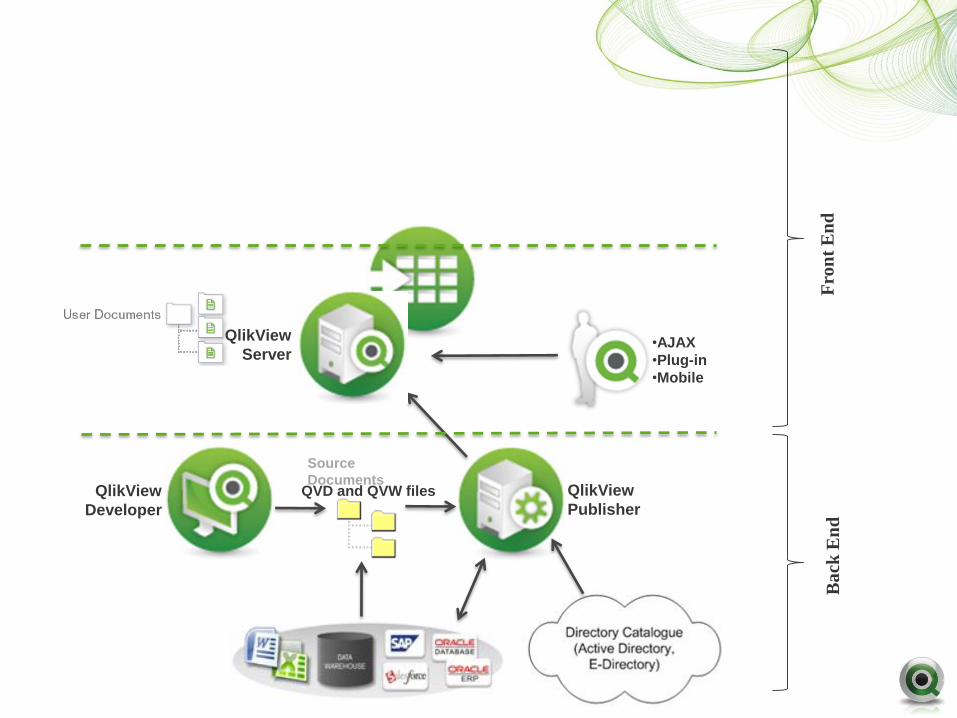
Architecture Overview– Whiteboard
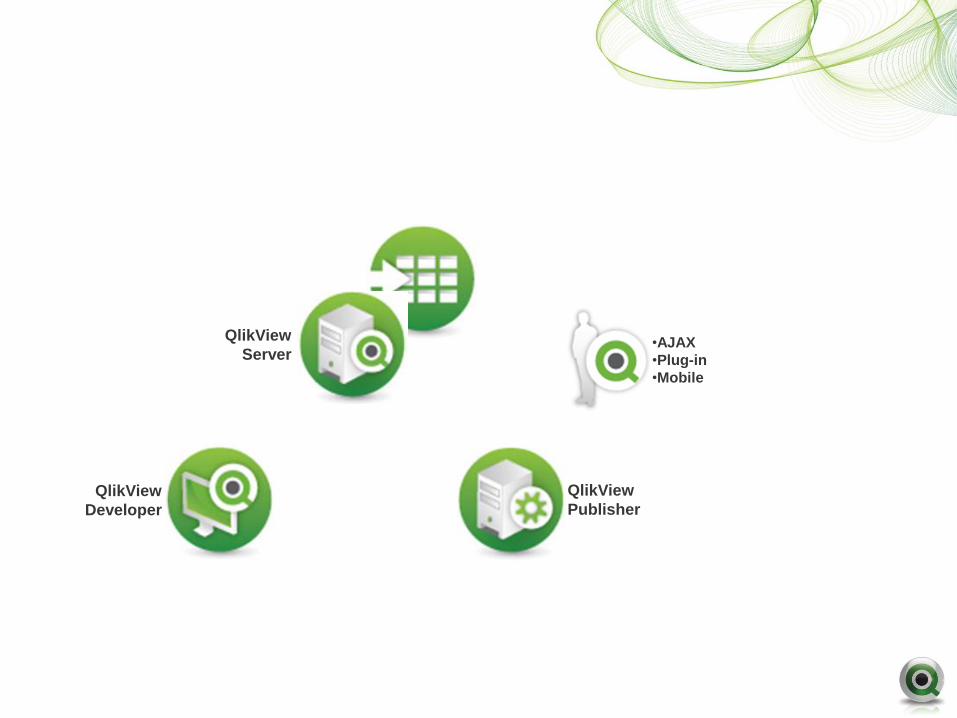
QlikView
Developer
QlikView
Publisher
•AJAX
•Plug-in
•Mobile
QlikView
Server
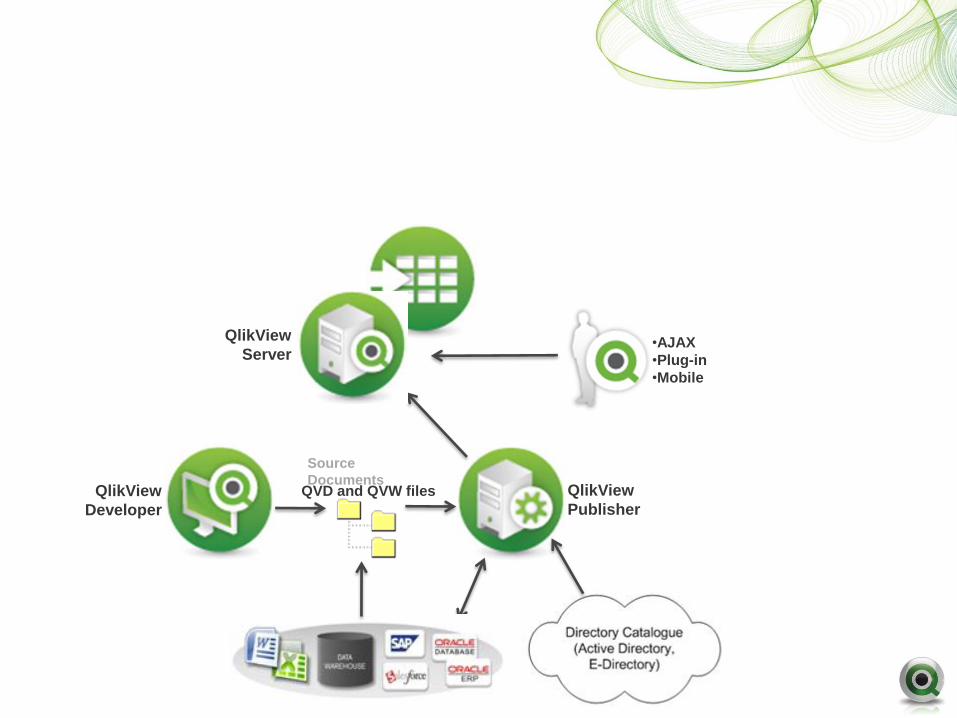
QlikView
Developer
QlikView
Publisher
•AJAX
•Plug-in
•Mobile
QVD and QVW files
Source
Documents
QlikView
Server
QlikView
Developer
QlikView
Publisher
•AJAX
•Plug-in
•Mobile
QVD and QVW files
Ba
ck E
nd
Source
Documents
QlikView
Server
Fro
nt
En
d
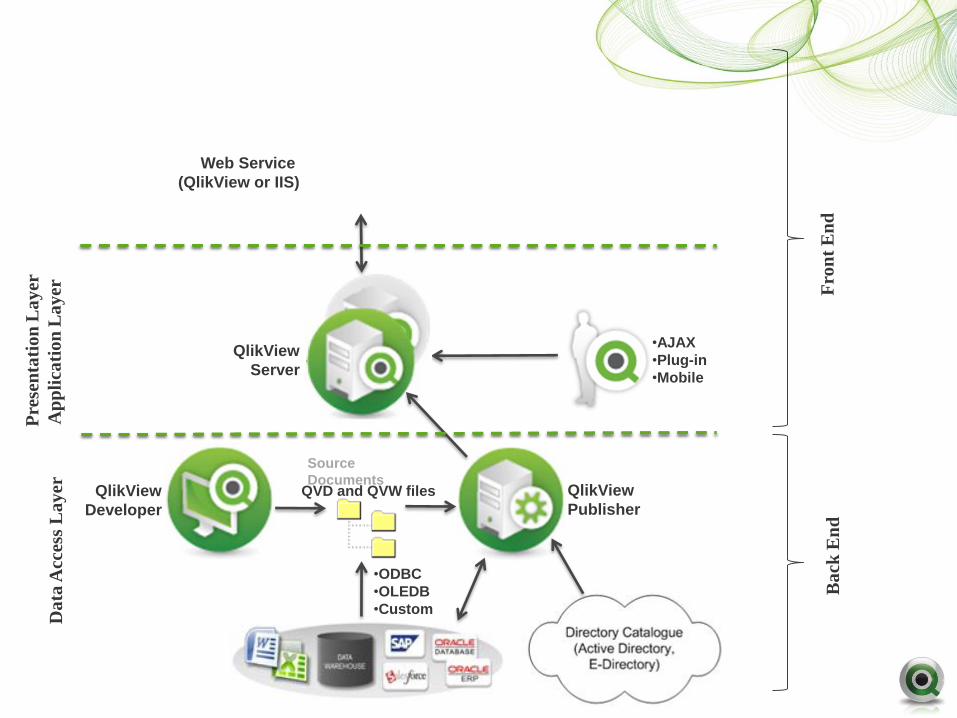
QVD and QVW files QlikView
Developer
QlikView
Publisher
QlikView
Server
Web Service
(QlikView or IIS)
Da
ta A
cces
s L
ay
er
Ap
pli
cati
on
La
yer
Pre
sen
tati
on
La
yer
•AJAX
•Plug-in
•Mobile
•ODBC
•OLEDB
•Custom
Fro
nt
En
d
Ba
ck E
nd
Source
Documents
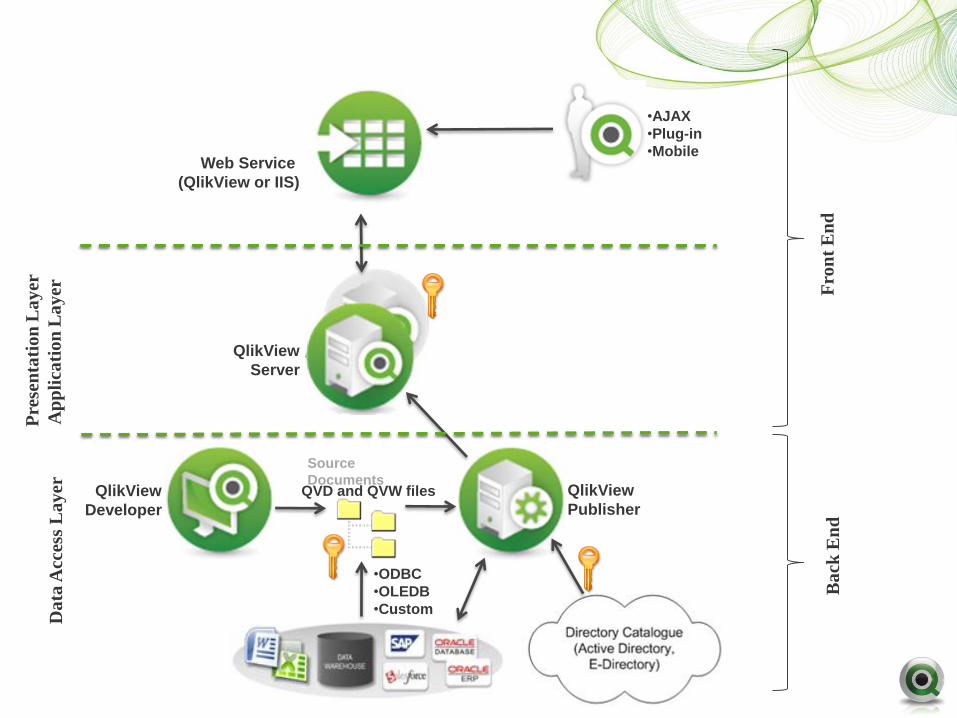
QVD and QVW files QlikView
Developer
QlikView
Publisher
QlikView
Server
Web Service
(QlikView or IIS)
Da
ta A
cces
s L
ay
er
Ap
pli
cati
on
La
yer
Pre
sen
tati
on
La
yer
•AJAX
•Plug-in
•Mobile
•ODBC
•OLEDB
•Custom
Fro
nt
En
d
Ba
ck E
nd
Source
Documents
QlikView
SAP Connector
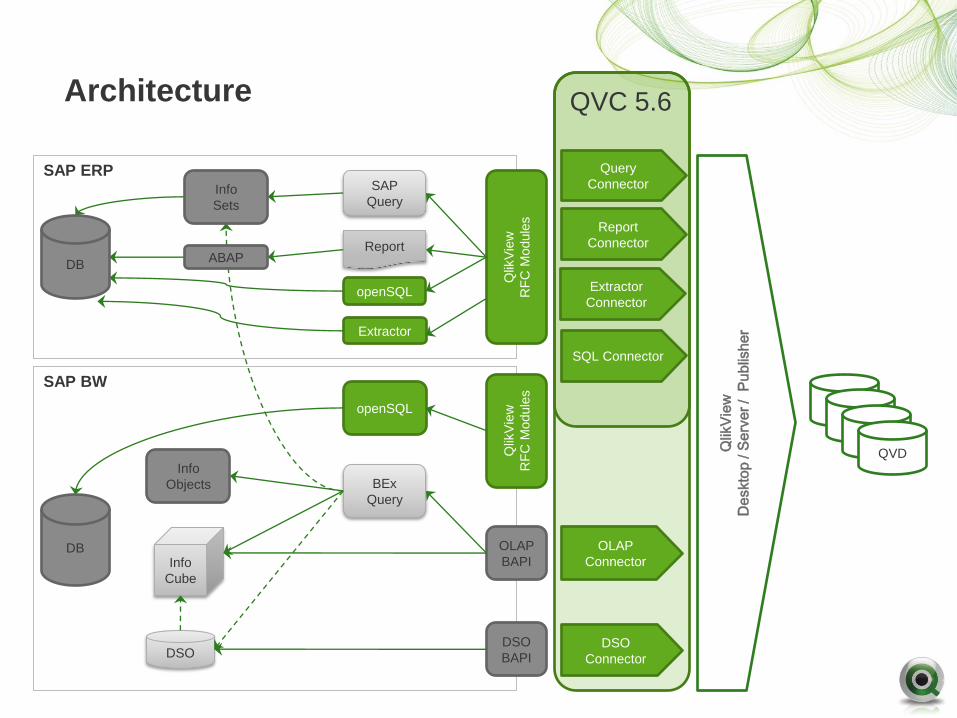
SAP BW
SAP ERP
Architecture
SQL Connector
Query
Connector
Report
Connector
OLAP
Connector
DSO
Connector
Qlik
Vie
w
RF
C M
odule
s
OLAP
BAPI
DSO
BAPI
Report
openSQL
SAP
Query
DSO
BEx
Query
Info
Cube
DB
openSQL
Qlik
Vie
w
RF
C M
odule
s
Info
Objects
QVD
QVD
QVD
QVD
Qlik
Vie
w
De
skto
p / S
erv
er
/ P
ub
lish
er
QVC 5.6
Info
Sets
ABAP DB
Extractor
Extractor
Connector
Coffee Break
The role of IT in the utility of the future
Stuart Ravens – Principal Analyst– Ovum
© Copyright Ovum. All rights reserved. Ovum is a subsidiary of Informa plc. 26
The role of IT in the Utility of
the Future
How location intelligence enables improved performance
Stuart Ravens
19 September 2012
© Copyright Ovum. All rights reserved. Ovum is an Informa business. 27
The utility of the future is an analytical utility
Unprecedented industry pressures
An exponential growth in data volumes
All this data can be referenced geographically
There’s a natural convergence of GIS and analytics
© Copyright Ovum. All rights reserved. Ovum is an Informa business. 28
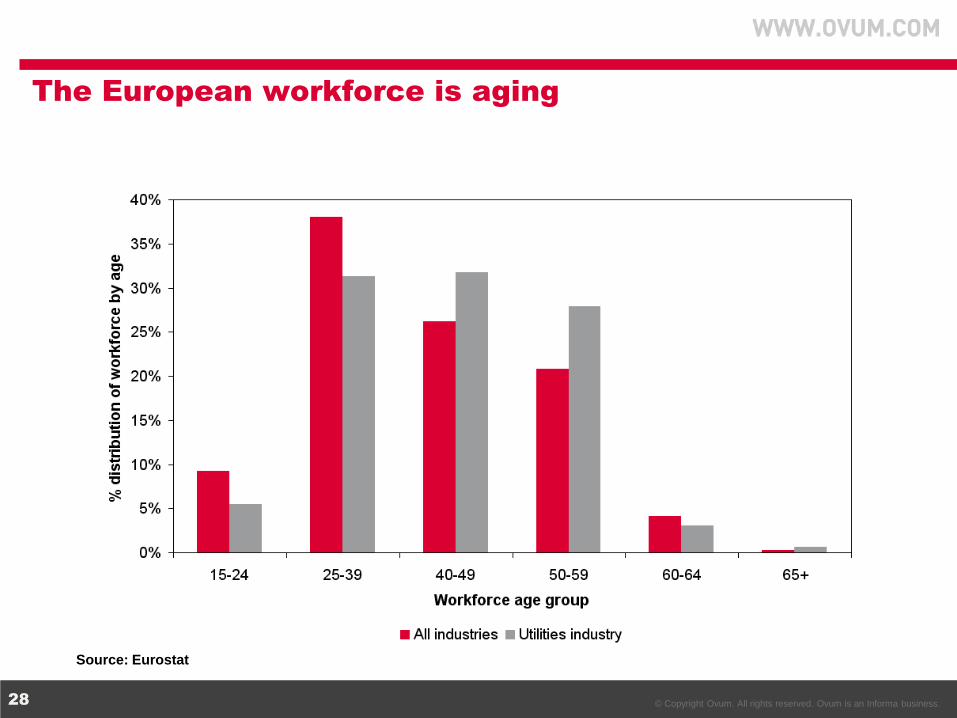
The European workforce is aging
Source: Eurostat
© Copyright Ovum. All rights reserved. Ovum is an Informa business. 29
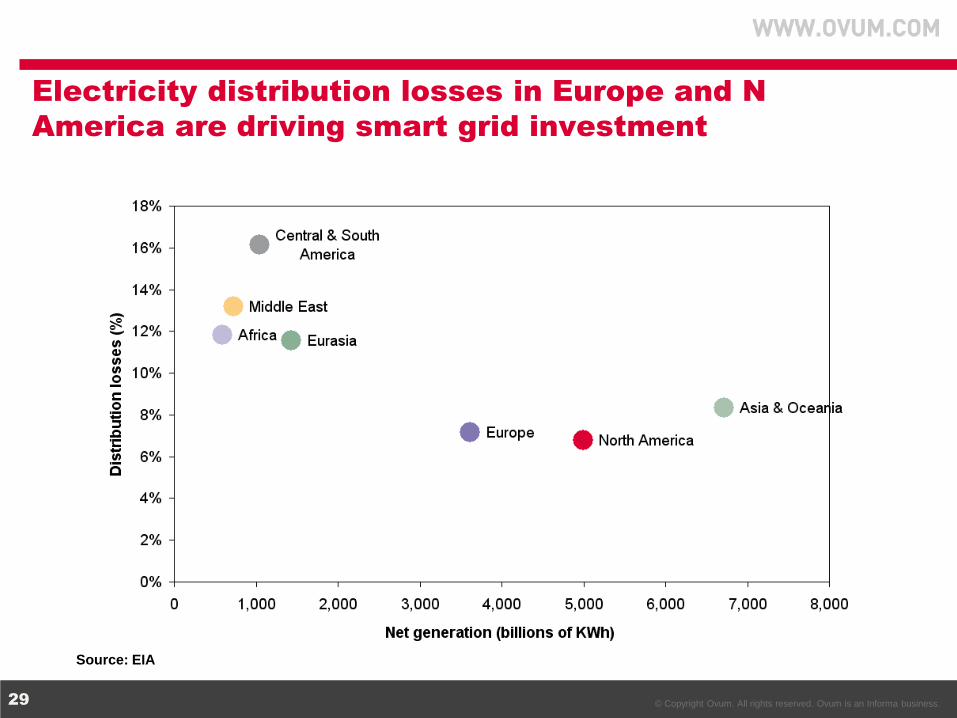
Electricity distribution losses in Europe and N
America are driving smart grid investment
Source: EIA
© Copyright Ovum. All rights reserved. Ovum is an Informa business. 30
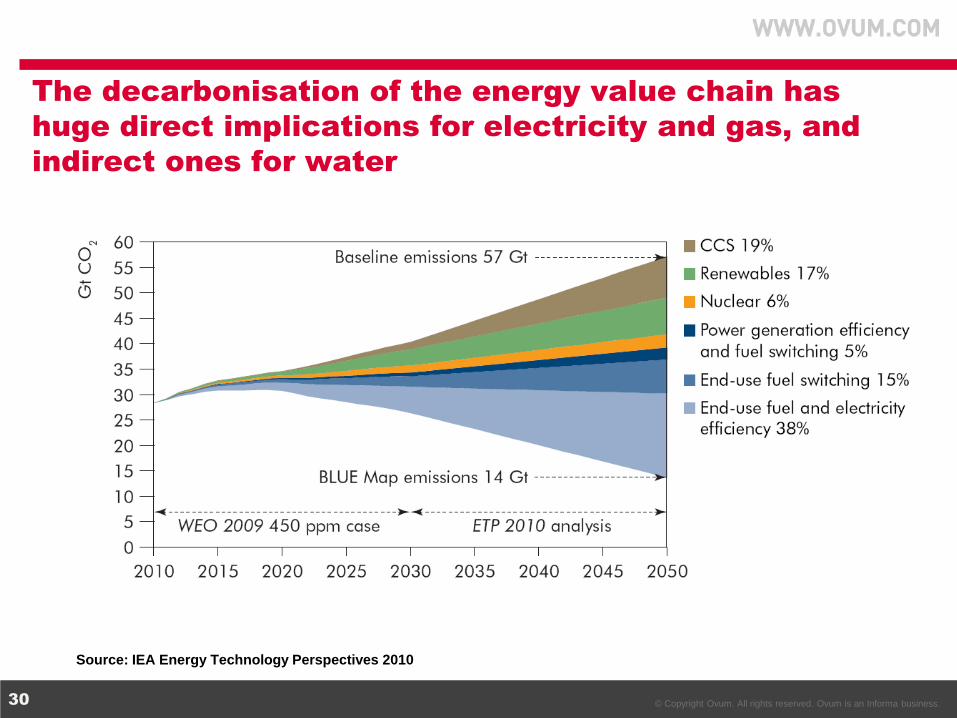
The decarbonisation of the energy value chain has
huge direct implications for electricity and gas, and
indirect ones for water
Source: IEA Energy Technology Perspectives 2010
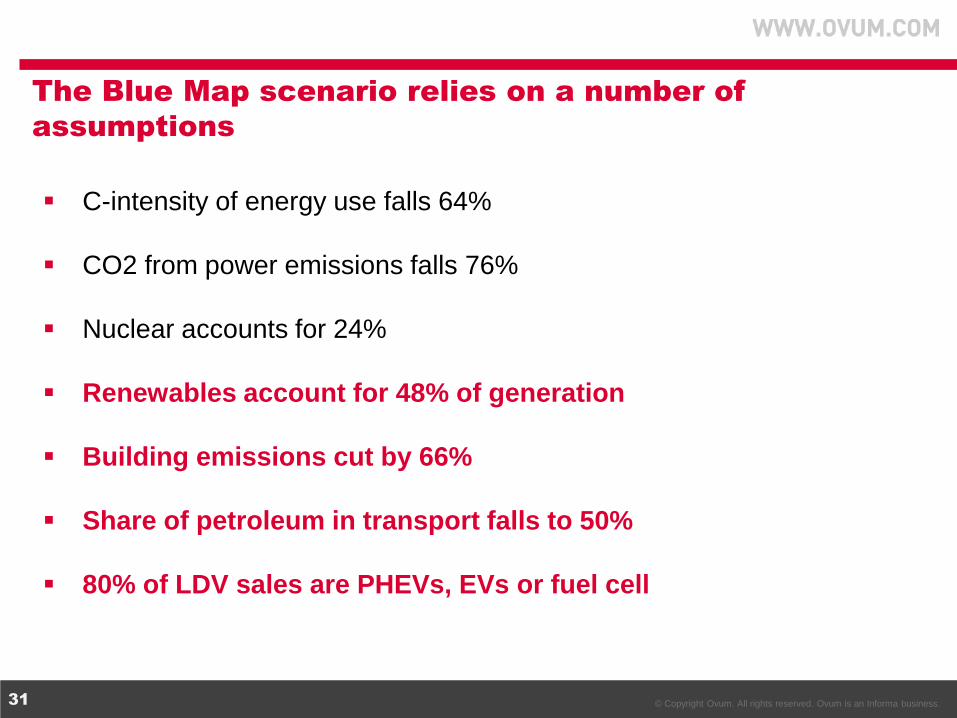
© Copyright Ovum. All rights reserved. Ovum is an Informa business. 31
The Blue Map scenario relies on a number of
assumptions
C-intensity of energy use falls 64%
CO2 from power emissions falls 76%
Nuclear accounts for 24%
Renewables account for 48% of generation
Building emissions cut by 66%
Share of petroleum in transport falls to 50%
80% of LDV sales are PHEVs, EVs or fuel cell
© Copyright Ovum. All rights reserved. Ovum is an Informa business. 32
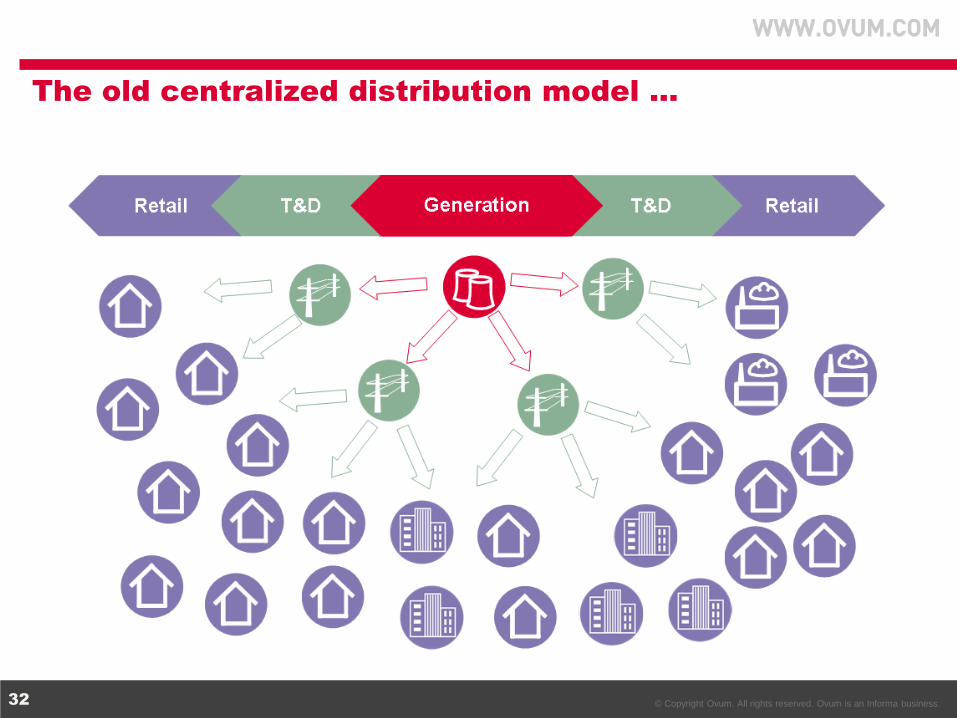
The old centralized distribution model …
© Copyright Ovum. All rights reserved. Ovum is an Informa business. 33
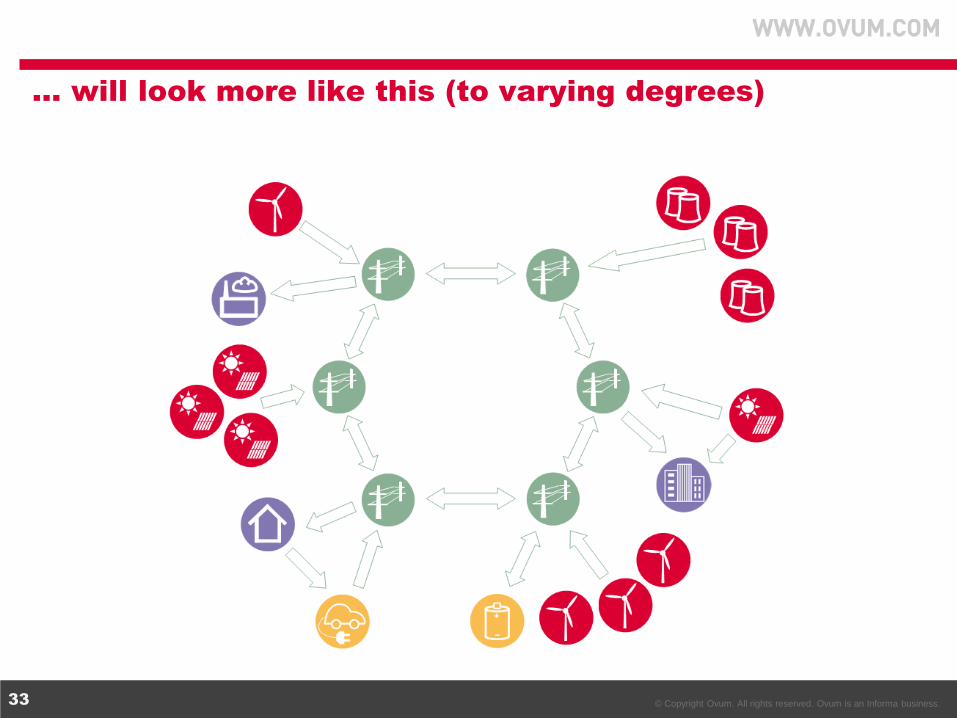
… will look more like this (to varying degrees)

© Copyright Ovum. All rights reserved. Ovum is an Informa business. 34
Smart grid is still at an early stage …
(SGMM v4 due September 2012)
Source: Smart Grid Maturity Model 2011
© Copyright Ovum. All rights reserved. Ovum is an Informa business. 35
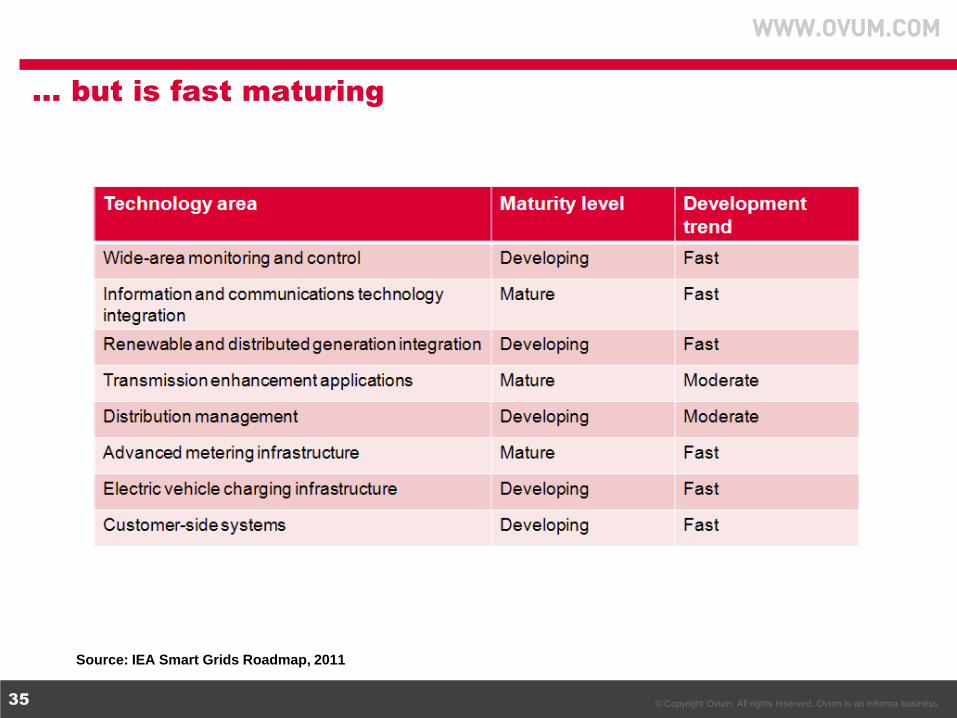
… but is fast maturing
Source: IEA Smart Grids Roadmap, 2011
© Copyright Ovum. All rights reserved. Ovum is an Informa business. 36
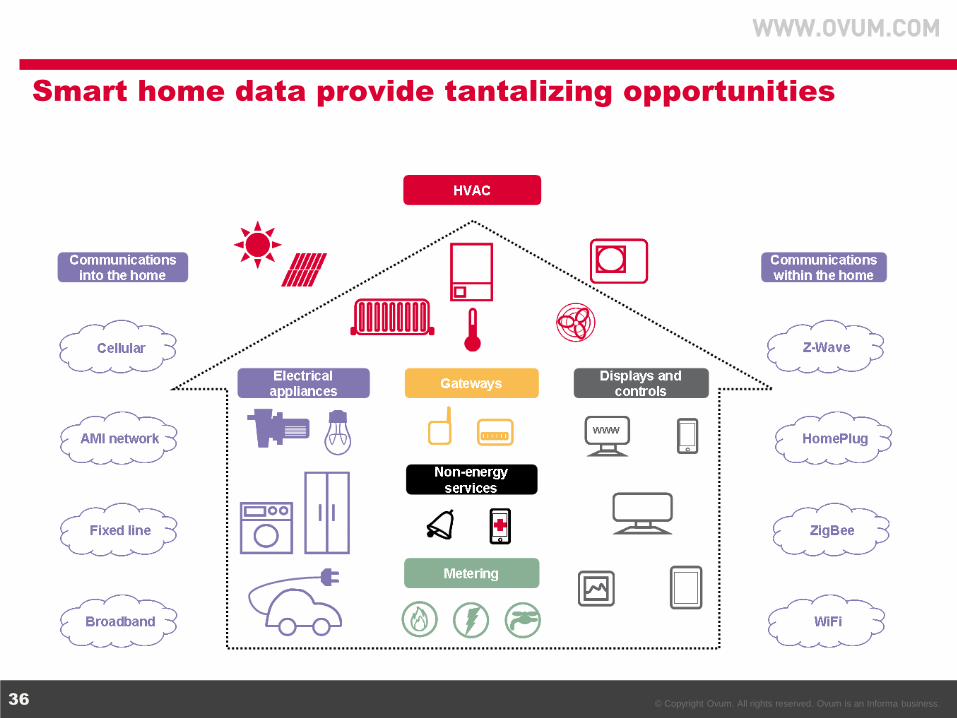
Smart home data provide tantalizing opportunities
© Copyright Ovum. All rights reserved. Ovum is an Informa business. 37
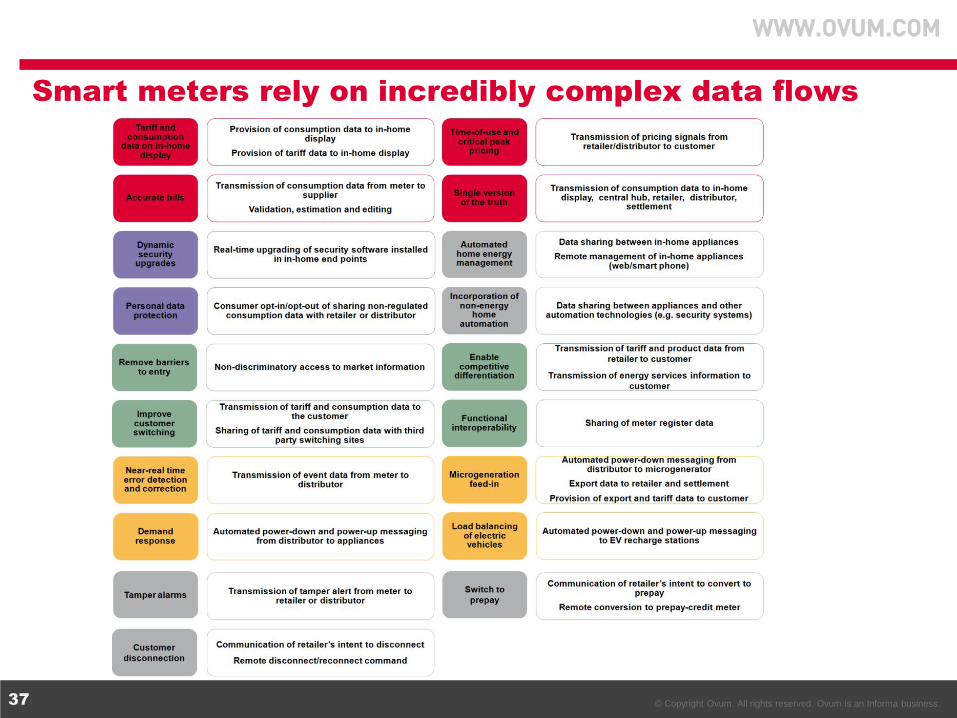
Smart meters rely on incredibly complex data flows
© Copyright Ovum. All rights reserved. Ovum is an Informa business. 38
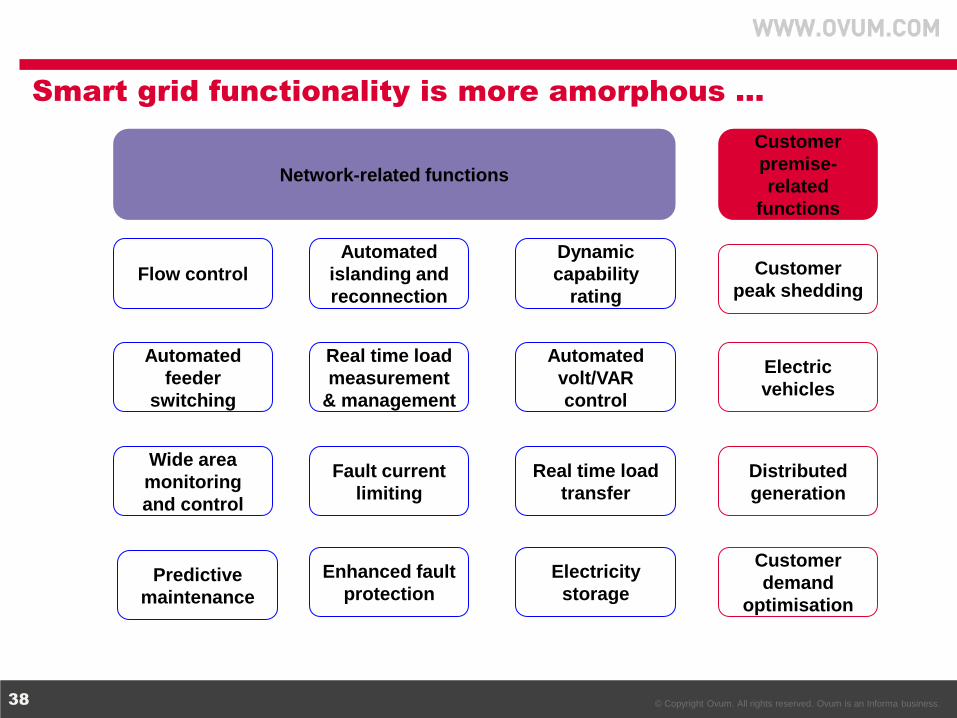
Smart grid functionality is more amorphous …
Fault current
limiting
Wide area
monitoring
and control
Dynamic
capability
rating
Flow control
Automated
feeder
switching
Automated
islanding and
reconnection
Automated
volt/VAR
control
Predictive
maintenance
Enhanced fault
protection
Real time load
measurement
& management
Real time load
transfer
Customer
demand
optimisation
Electric
vehicles
Electricity
storage
Distributed
generation
Customer
peak shedding
Network-related functions
Customer
premise-
related
functions
© Copyright Ovum. All rights reserved. Ovum is an Informa business. 39
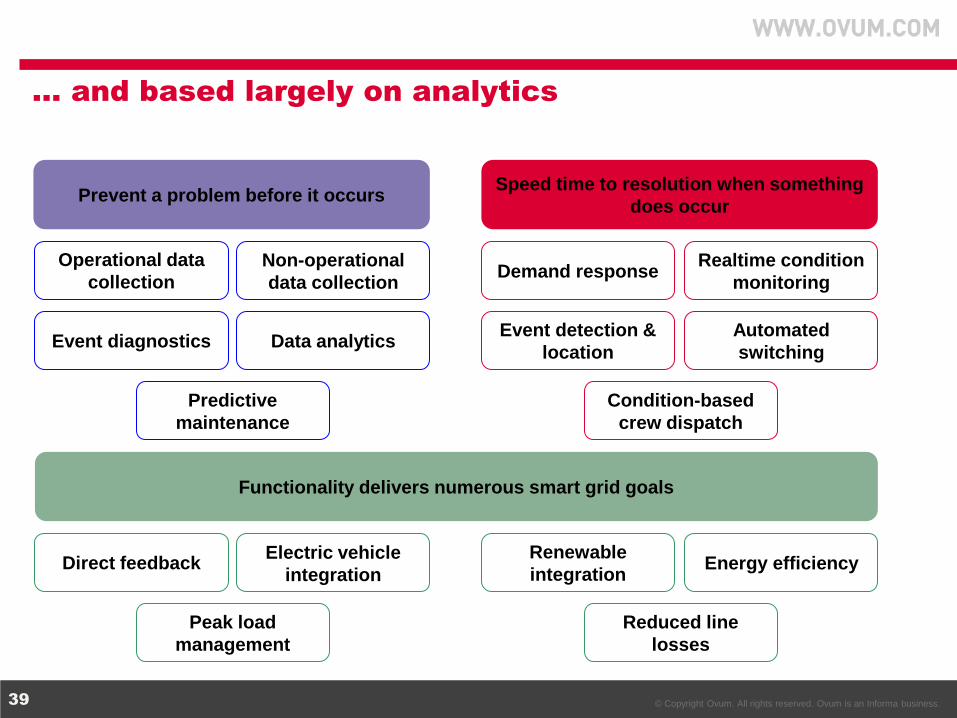
… and based largely on analytics
Operational data
collection
Realtime condition
monitoring
Prevent a problem before it occurs Speed time to resolution when something
does occur
Non-operational
data collection
Event diagnostics Data analytics
Predictive
maintenance
Demand response
Automated
switching
Event detection &
location
Condition-based
crew dispatch
Functionality delivers numerous smart grid goals
Direct feedback Energy efficiency Electric vehicle
integration
Renewable
integration
Peak load
management
Reduced line
losses

© Copyright Ovum. All rights reserved. Ovum is an Informa business. 40
Although analytics is not restricted to smart grid; it
extends across the entire value chain
© Copyright Ovum. All rights reserved. Ovum is an Informa business. 41
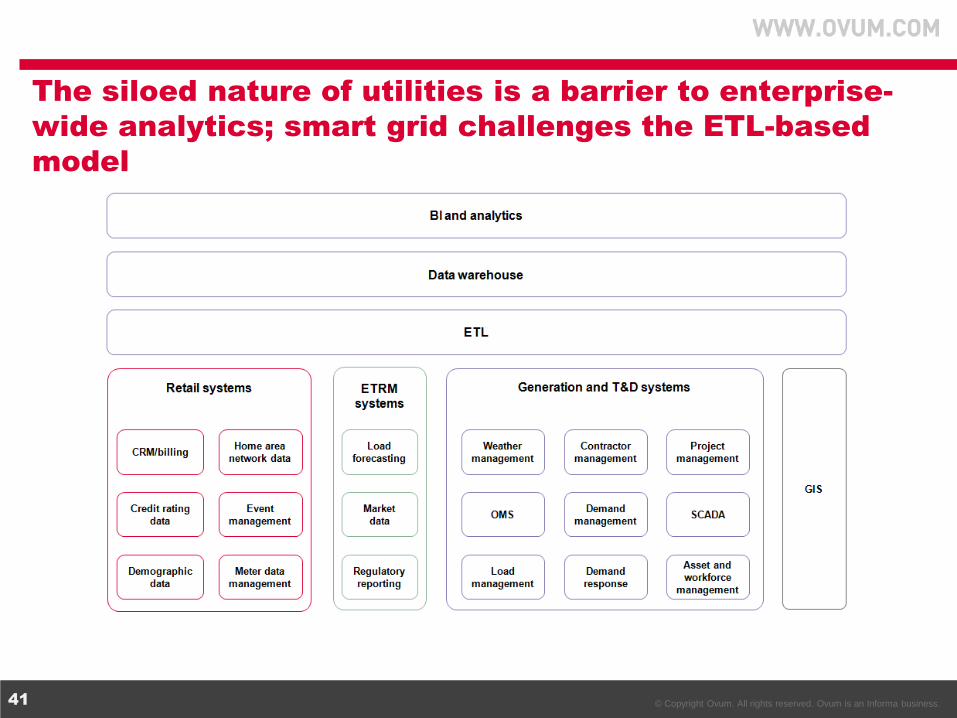
The siloed nature of utilities is a barrier to enterprise-
wide analytics; smart grid challenges the ETL-based
model

© Copyright Ovum. All rights reserved. Ovum is an Informa business. 42
Analytics became realtime in Ausgrid’s DM&C project
© Copyright Ovum. All rights reserved. Ovum is an Informa business. 43
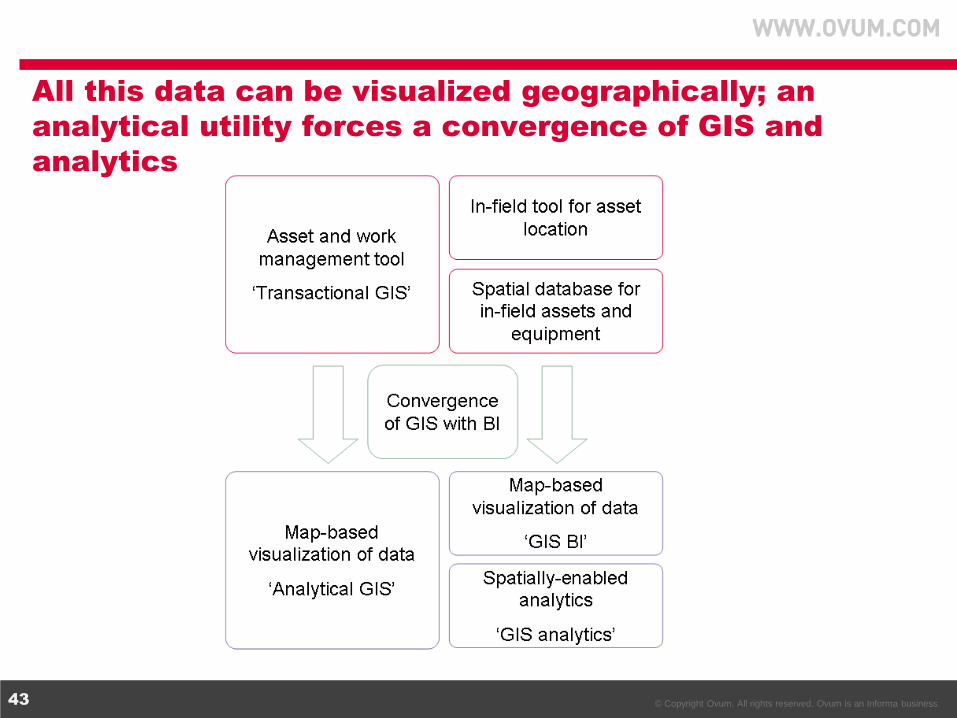
All this data can be visualized geographically; an
analytical utility forces a convergence of GIS and
analytics
© Copyright Ovum. All rights reserved. Ovum is an Informa business. 44
Expect a second wave of better, scalable, GIS-
enabled mobile applications …
Hardware developments
Device proliferation
Consumerisation of applications
Vendor investments in assets
PAS55
SIM
© Copyright Ovum. All rights reserved. Ovum is an Informa business. 45
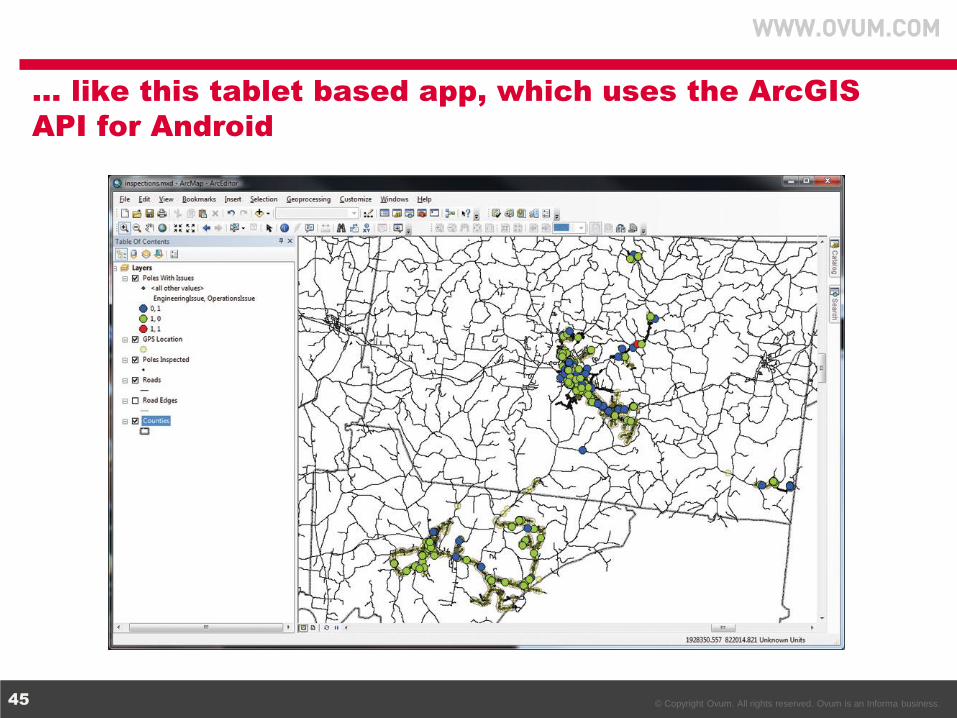
… like this tablet based app, which uses the ArcGIS
API for Android
© Copyright Ovum. All rights reserved. Ovum is an Informa business. 46
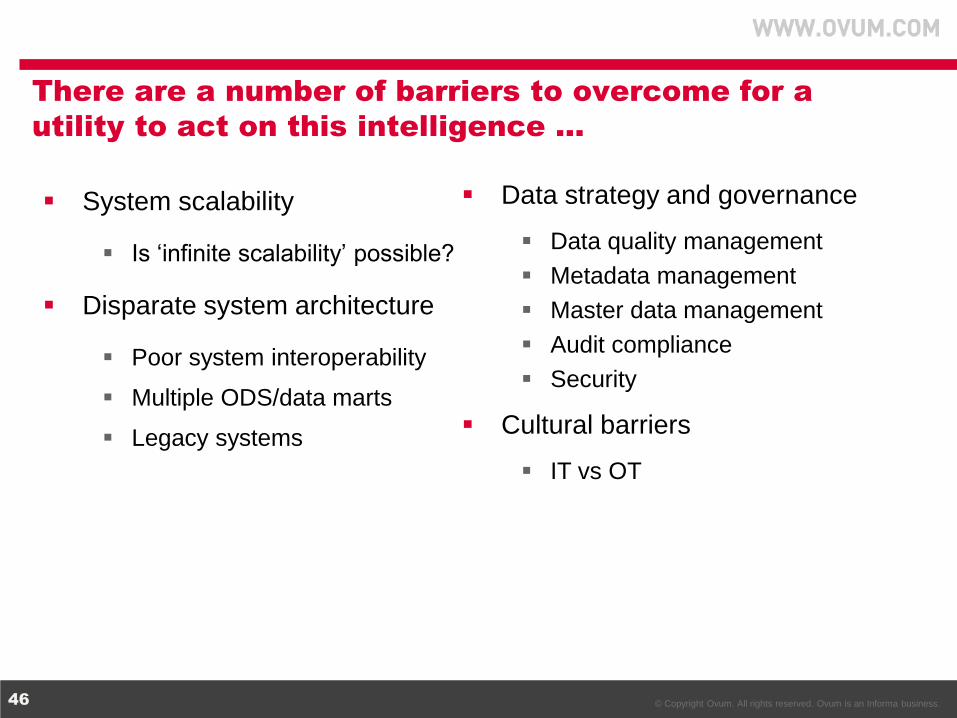
There are a number of barriers to overcome for a
utility to act on this intelligence …
System scalability
Is ‘infinite scalability’ possible?
Disparate system architecture
Poor system interoperability
Multiple ODS/data marts
Legacy systems
Data strategy and governance
Data quality management
Metadata management
Master data management
Audit compliance
Security
Cultural barriers
IT vs OT
© Copyright Ovum. All rights reserved. Ovum is an Informa business. 47
Disclaimer
All Rights Reserved.
No part of this publication may be reproduced, stored in a retrieval system or transmitted in any form by any means, electronic, mechanical, photocopying, recording or otherwise, without the prior permission of the publisher, Ovum (an Informa business).
The facts of this report are believed to be correct at the time of publication but cannot be guaranteed. Please note that the findings, conclusions and recommendations that Ovum delivers will be based on information gathered in good faith from both primary and secondary sources, whose accuracy we are not always in a position to guarantee. As such Ovum can accept no liability whatever for actions taken based on any information that may subsequently prove to be incorrect.
Location Based Dashboards
Kevin Doughty – Head of Business, Utilities, Esri UK
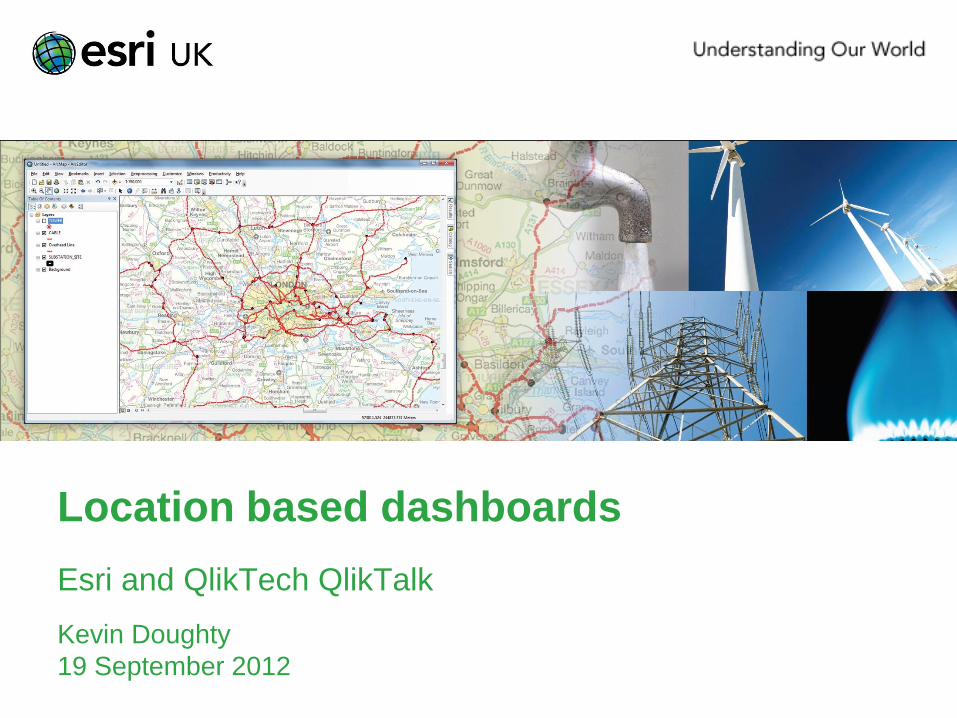
Esri and QlikTech QlikTalk
Location based dashboards
Kevin Doughty
19 September 2012

Are women better than men at
navigating?
50
Which way am I looking?
First Generation – Location Intelligence
51

Trends
Big Data (Smart Grids, Smart metering etc – the three V’s
Real time GIS – SCADA, Weather...
The Cloud – new ways to deploy
Mobile – efficiency, access
Integration - efficiency
Usability - efficiency
Case Studies – Location Dashboards
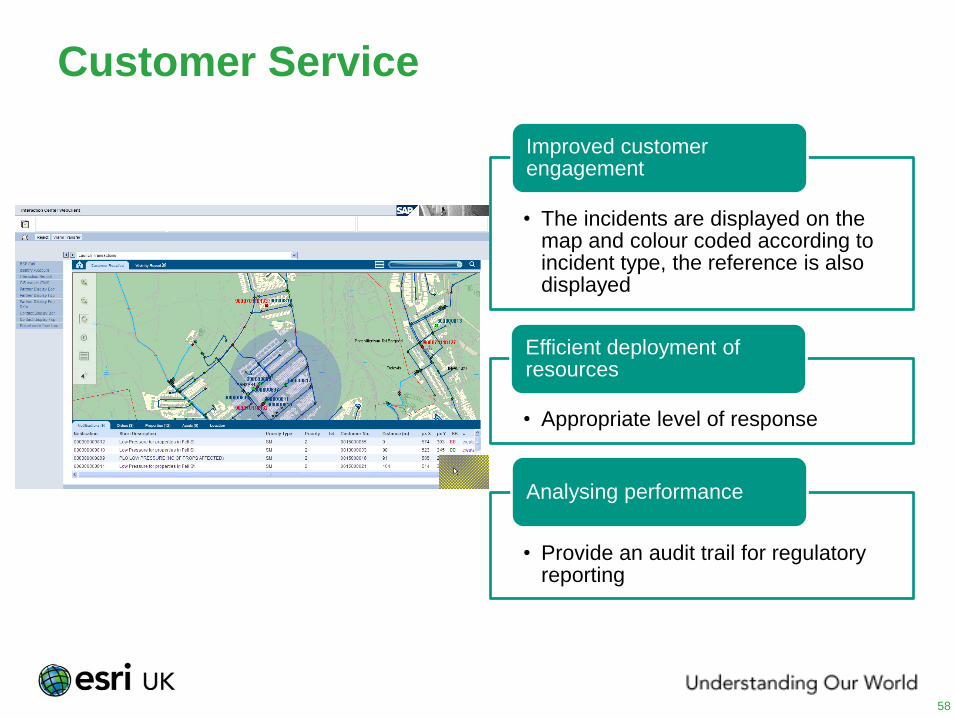
Customer Service
• The incidents are displayed on the map and colour coded according to incident type, the reference is also displayed
Improved customer engagement
• Appropriate level of response
Efficient deployment of resources
• Provide an audit trail for regulatory reporting
Analysing performance
58
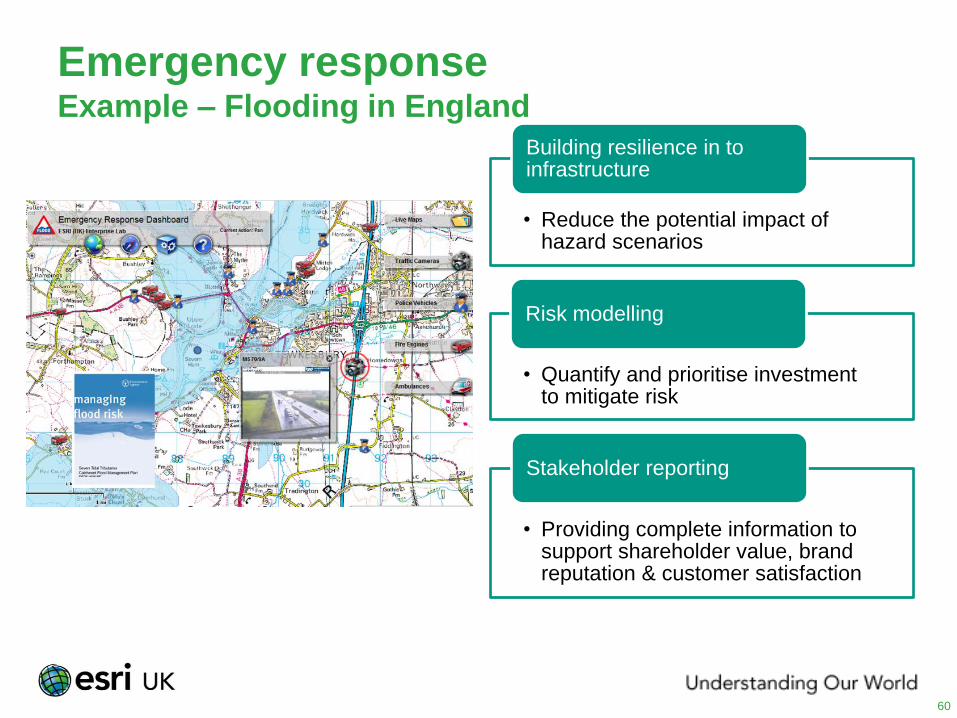
Emergency response Example – Flooding in England
• Reduce the potential impact of hazard scenarios
Building resilience in to infrastructure
• Quantify and prioritise investment to mitigate risk
Risk modelling
• Providing complete information to support shareholder value, brand reputation & customer satisfaction
Stakeholder reporting
60
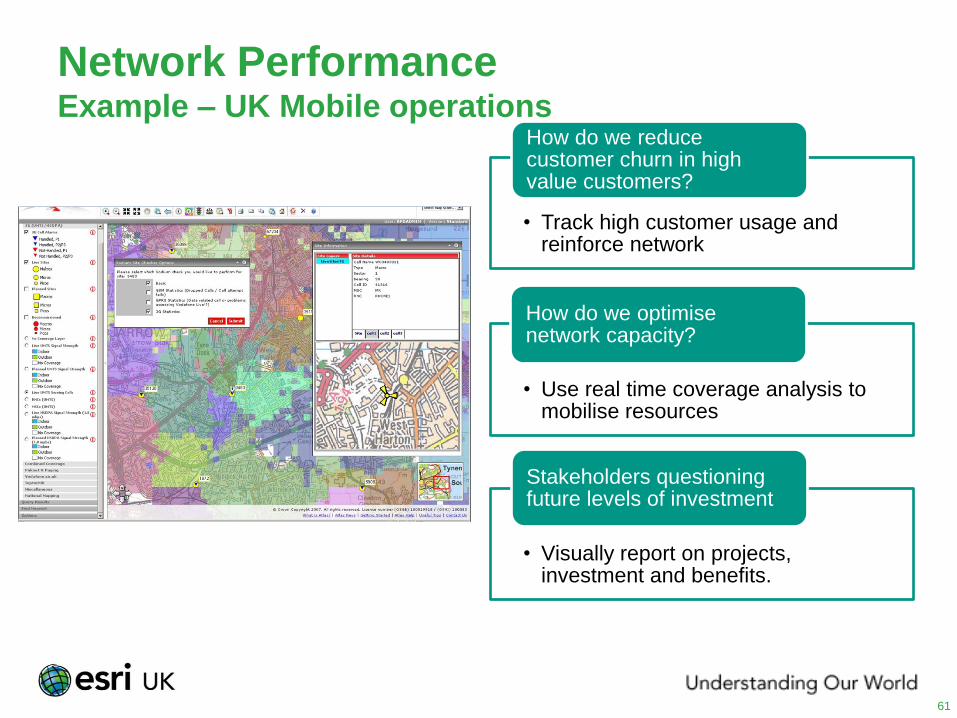
Network Performance Example – UK Mobile operations
• Track high customer usage and reinforce network
How do we reduce customer churn in high value customers?
• Use real time coverage analysis to mobilise resources
How do we optimise network capacity?
• Visually report on projects, investment and benefits.
Stakeholders questioning future levels of investment
61
What happens next?
62
GIS turns big data into information
Information enables better strategic and operational decision
making
See the detail, find your way!
Example QlikView applications in Energy and Utilities
Kit Mundy – Director – Differentia Consulting
Dean Ansermoz – Solutions Architect - QlikTech
• Independent consulting firm, specialising in ERP and BI (QlikView)
• ex KPMG Consulting
• Leading QlikView partner in the UK (#1in the UK in 2011, #2 in 2010)
• Providing a full service for QlikView
– Consulting / applications development
– Software licences
– Training (Certified QlikView training partner)
– Applications and technical support
– Technical architecture / hardware sizing
• Currently working with a number of leading companies in the energy and
utilities sector
Differentia Consulting
QlikView Elite Solution Provider
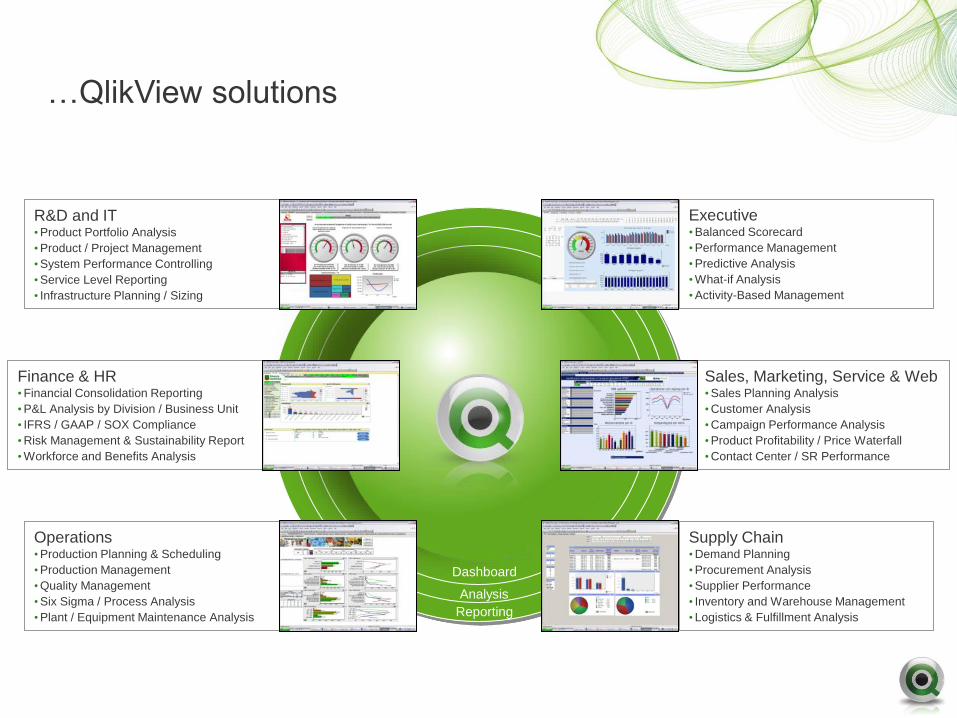
…QlikView solutions
Dashboard
Analysis
Reporting
Executive •Balanced Scorecard
•Performance Management
•Predictive Analysis
•What-if Analysis
•Activity-Based Management
Sales, Marketing, Service & Web •Sales Planning Analysis
•Customer Analysis
•Campaign Performance Analysis
•Product Profitability / Price Waterfall
•Contact Center / SR Performance
Supply Chain •Demand Planning
•Procurement Analysis
•Supplier Performance
• Inventory and Warehouse Management
•Logistics & Fulfillment Analysis
Operations •Production Planning & Scheduling
•Production Management
•Quality Management
•Six Sigma / Process Analysis
•Plant / Equipment Maintenance Analysis
R&D and IT •Product Portfolio Analysis
•Product / Project Management
•System Performance Controlling
•Service Level Reporting
• Infrastructure Planning / Sizing
Finance & HR •Financial Consolidation Reporting
•P&L Analysis by Division / Business Unit
• IFRS / GAAP / SOX Compliance
•Risk Management & Sustainability Report
•Workforce and Benefits Analysis
…example QlikView applications
• Asset Management
• Regulatory reporting
• Customer Service
• Debt Management
Applications of QlikView within Utilities Organisations
• Contact Centre Analytics - Customer Service / Complaints / Outbound Sales
• Unbilled Analysis
• Metering
• Sales Analytics
• Campaign Analytics
• Commercial Finance Decay Modelling/Campaign Analysis
• Bad Debt Reporting
• Health & Safety
• Energy Trading
• Project Costing
• Finance / HR
• Asset Maintenance / Workforce Planning
Implementation approach
Kit Mundy – Director – Differentia Consulting
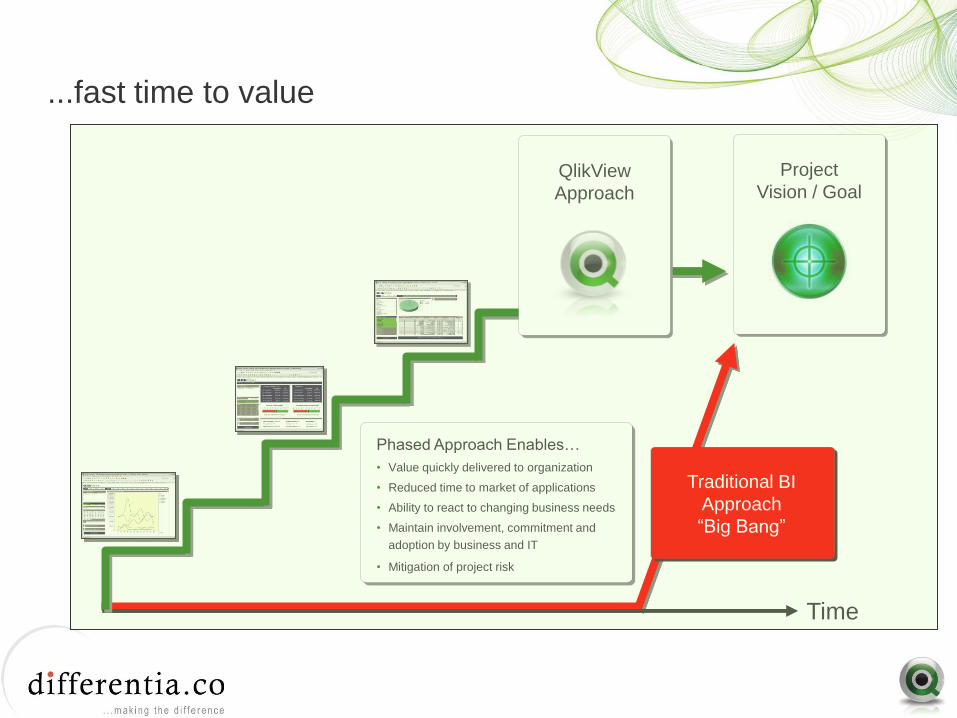
...fast time to value
Time
Project
Vision / Goal
Phased Approach Enables…
• Value quickly delivered to organization
• Reduced time to market of applications
• Ability to react to changing business needs
• Maintain involvement, commitment and
adoption by business and IT
• Mitigation of project risk
Traditional BI
Approach
“Big Bang”
QlikView
Approach
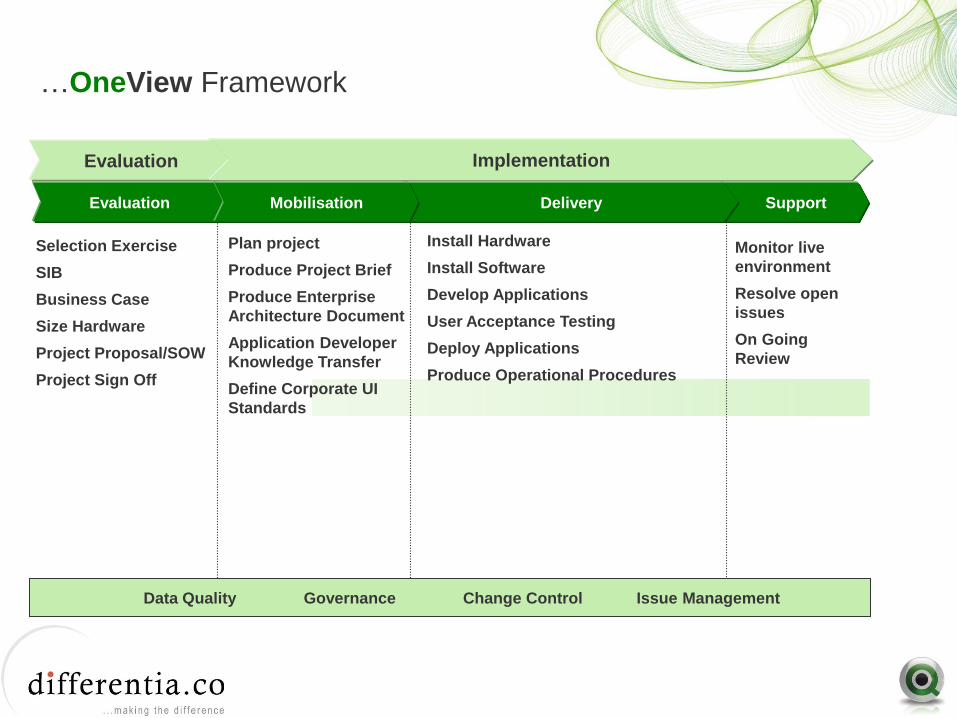
…OneView Framework
Plan project
Produce Project Brief
Produce Enterprise
Architecture Document
Application Developer
Knowledge Transfer
Define Corporate UI
Standards
Monitor live
environment
Resolve open
issues
On Going
Review
Support
Selection Exercise
SIB
Business Case
Size Hardware
Project Proposal/SOW
Project Sign Off
Evaluation
Evaluation Implementation
Delivery Mobilisation
Install Hardware
Install Software
Develop Applications
User Acceptance Testing
Deploy Applications
Produce Operational Procedures
Data Quality Governance Change Control Issue Management
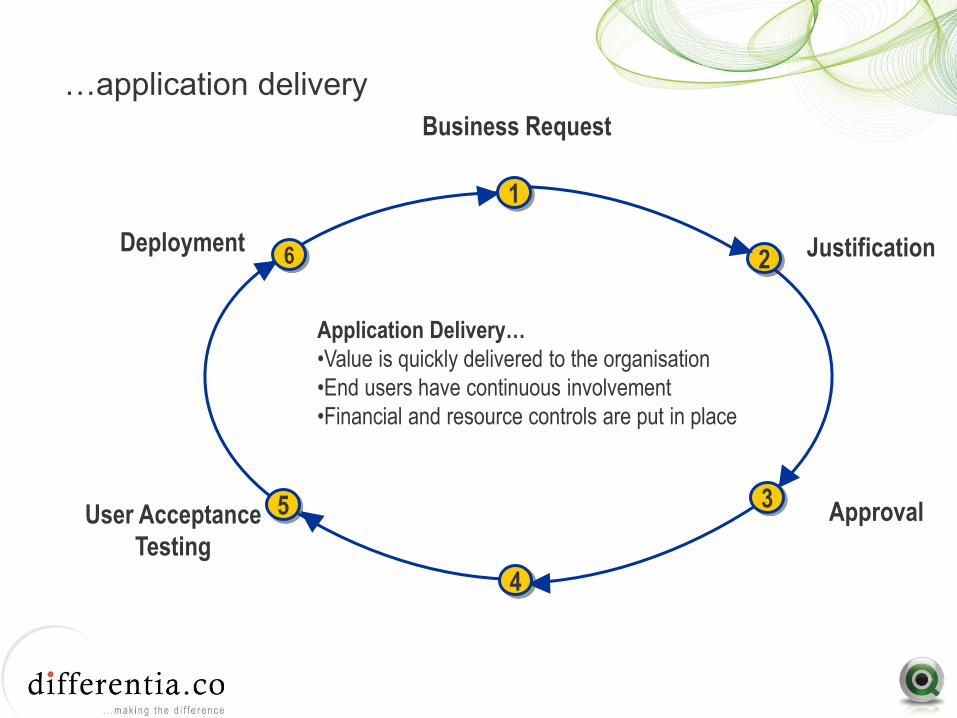
…application delivery
Business Request
Approval
Justification
1
3
2
5
6
4
User Acceptance
Testing
Deployment
Application Delivery…
•Value is quickly delivered to the organisation
•End users have continuous involvement
•Financial and resource controls are put in place
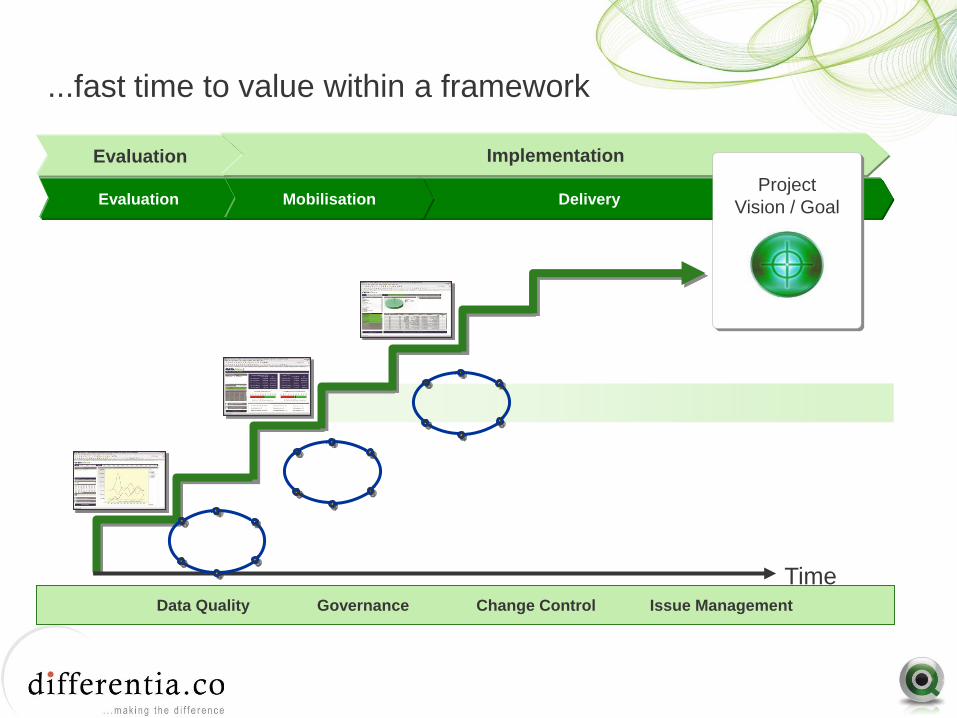
...fast time to value within a framework
Support Evaluation
Evaluation Implementation
Delivery Mobilisation
Data Quality Governance Change Control Issue Management
Time
Project
Vision / Goal
1
3
2
5
6
4
1
3
2
5
6
4
1
3
2
5
6
4

Lunch
Smart metering application using QlikView
- integrated with ESRI UK ArcGIS
Kit Mundy – Director – Differentia Consulting
Alasdair Hind – Presales Consultant – ESRI UK
Andrea Traverso – Director – KT Labs
…Smart Metering demo
• Integration between QlikView and ArcGIS, delivered in conjunction
with Differentia Consulting
• Utilises the KliqMap extension object from KT Labs
• Objective is to demonstrate the power of combining QlikView
business discovery with ArcGIS geographic information to create
location intelligence
• This allows you to map multiple layers of geographic information
and properties from ArcGIS based on selections made from within
QlikView
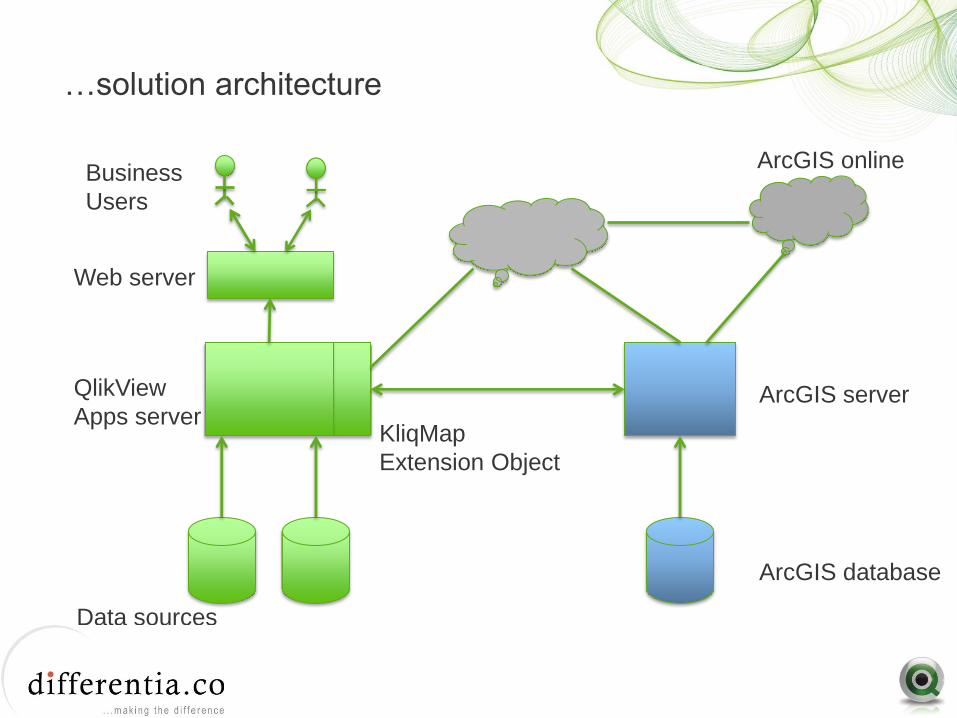
…solution architecture
ArcGIS server
ArcGIS database
KliqMap
Extension Object
Web server
QlikView
Apps server
Data sources
Business
Users
ArcGIS online

77
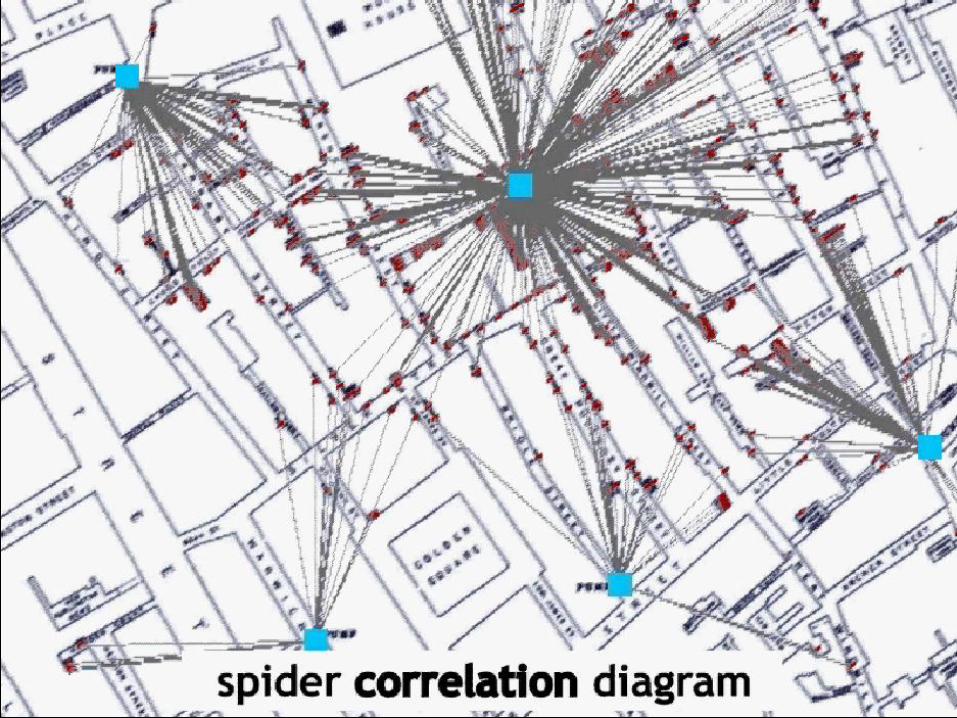
Death per pump: 64.2 Crapulation: 4 Dirty Water?: 4


