UTILITY OF INFLATION ACCOUNTING DATA TO INVESTORS Marann Byrné B.Comm., M.Mgt.Sc., F.C.A., A.I.T.I. submission for a degree of Doctor of Philosophy Dublin City University Supervisor: Prof. J. A September 1992 Walsh DECLARATION: This thesis is entirely the candidate's own work.
Transcript
UTILITY OF INFLATION ACCOUNTING DATA TO INVESTORS
Marann Byrné B.Comm., M.Mgt.Sc., F.C.A., A.I.T.I.
submission for a degree of Doctor of Philosophy
Dublin City University Supervisor: Prof. J. A
September 1992
Walsh
DECLARATION:This thesis is entirely the candidate's own work.
T A B L E OF C O N TE N TSPage
Acknowledgements iAbstract iiAbbreviations iiiList of Tables vList Of Appendices viii
THE NATURE AND SCOPE OF THE STUDY 1
1.1 Introduction 11.2 Background to the study 21.3 Definitions 91.4 Objectives of the study 101.5 Research methodology 111.6 Limitations of the study 131.7 Plan of the study 151.8 Summary
17
OBJECTIVE OF FINANCIAL REPORTING AND THE CASEFOR INFLATION ACCOUNTING DATA 18
2.1 Introduction 182.2 Objective of financial reporting 202.3 Qualitative characteristics of financial
reports 222.4 Financial reports and investors'
information needs 242.5 Financial reporting, capital and income 262.6 Limitations of the HCA model in periods
of unstable prices 312.7 Alternative valuation models and the
development of inflation accounting 362.8 SSAP 16 422.9 Summary 48
3. THE CAPITAL MARKET, SHARE PRICING ANDACCOUNTING DATA 50
3.1 Introduction 503.2 Capital market efficiency 513.3 Evidence of market efficiency 533.4 Implications of market efficiency for
financial reports 573.5 Portfolio theory and the pricing
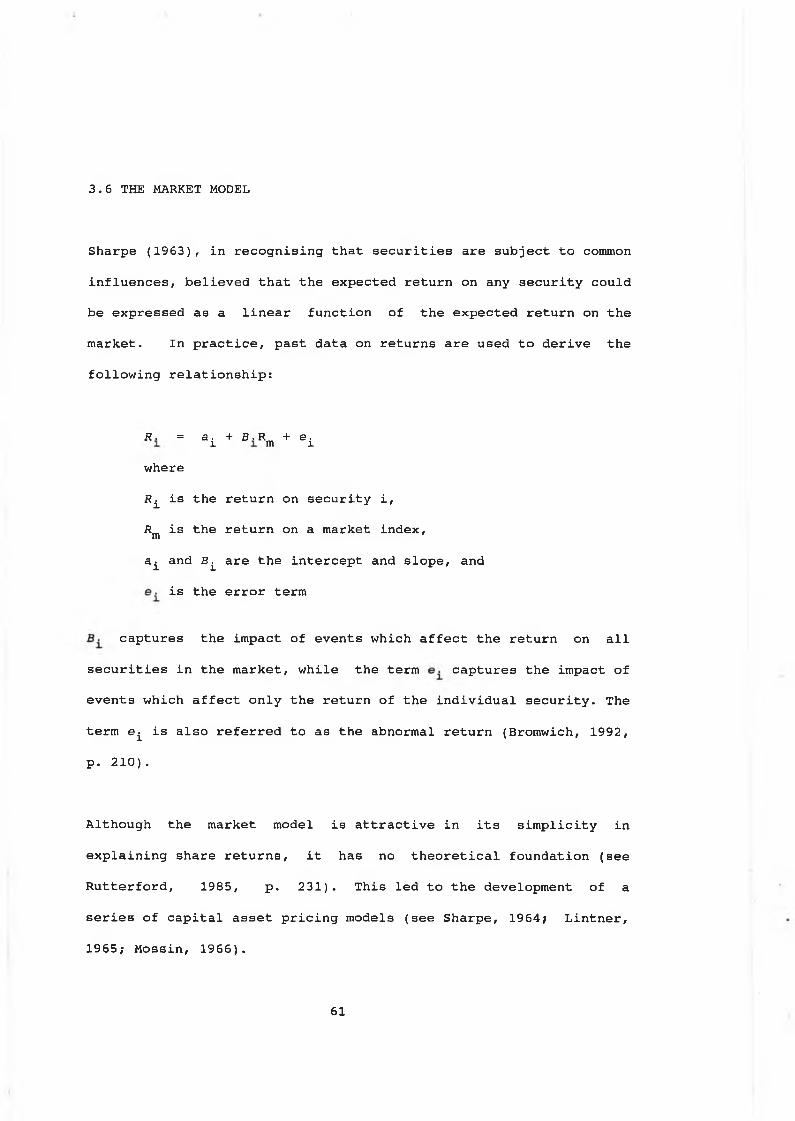
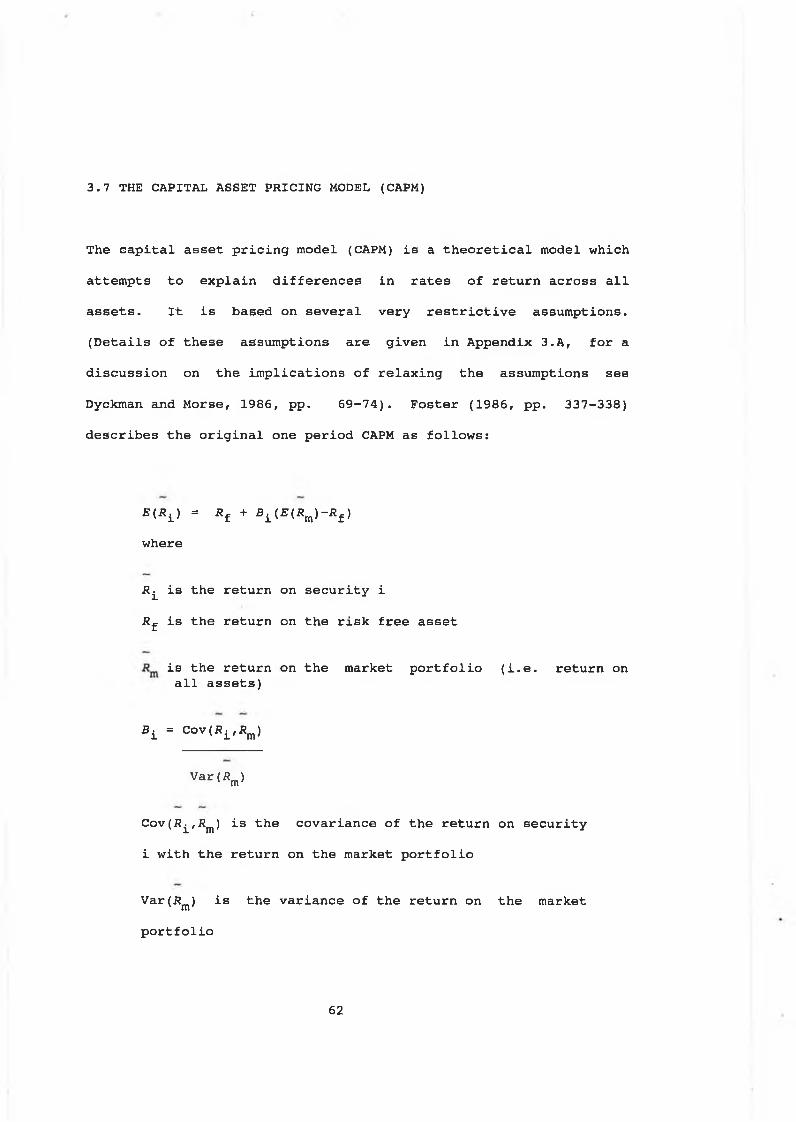
mechanism 583.6 The market model 613.7 The capital asset pricing model 623.8 Share prices and accounting data 643.9 Information content studies 65
t
3.10 Is the relationship between share pricesand accounting data mechanistic? 75
3.11 Accounting data and systematic risk 783.12 Explanatory power of accounting data 823.13 Predictive ability of accounting numbers 923.14 Summary 95
4 LITERATURE REVIEW OF THE RELEVANCE OF INFLATIONACCOUNTING DATA TO THE SECURITIES MARKET 98
4.1 Introduction 984.2 Information content studies 994.3 Inflation accounting data and its
association with systematic risk 1194.4 Inflation accounting data and share
prices/returns 1234.5 Predictive ability of inflation
accounting data 1524.6 Summary 154
5 NON MARKET BASED EVIDENCE ON THE ATTITUDE TORELIABILITY OF INFLATION ACCOUNTING DATA 157
5.1 Introduction 1575.2 Commitment and attitude to inflation
accounting data 1585.3 Problems of measurement errors in
computing inflation accounting data 1695.4 Summary 176
6 CASE FOR A VALUATION APPROACH 178
6.1 Introduction 1786.2 Problems associated with information
content studies 1796.3 The valuation approach 1916.4 Share valuation approach and inflation
accounting data 1996.5 Summary 210
7 MODEL BUILDING AND DATA COLLECTION 213
7.1 Introduction 2137.2 The valuation model 2147.3 Application of Ohlson's model and
definitions of the variables 2187.4 Selecting the sample 2267.5 Sample period 2327.6 Summary 233
8 E M P IR IC A L R E S U L T S 2 3 4
8.1 Introduction 2348.2 Specification of valuation model 2358.3 Building the valuation models 2398.4 Results from models 2838.5 Examining the relative importance of the
independent variables 2858.6 Interpreting the results 2948.7 Implications of models for the utility of
inflation accounting data 3078.8 Summary 315
9 CONCLUSIONS, IMPLICATIONS AND DIRECTIONS FORFUTURE RESEARCH 317
9.1 Introduction 3179.2 The study's objectives and how they
were achieved 3189.3 Research findings and their implications 3269.4 Implications of the limitations of
Ohlson's model 3339.5 Conclusions and directions for future
research 335
APPENDICES
BIBLIOGRAPHY
340
448
ACKNO W LED G EM ENTS
The researcher wishes to express her appreciation to all those who
contributed to the completion of this study.
She is particularly indebted to her supervisior, Professor Anthony
Walsh for his invaluable support, guidance and encouragement
throughout the study.
She would like to warmly acknowledge the interest and
administrative support of her colleagues at Dublin City University.
Finally, the researcher is especially grateful to her family, for
their constant support and understanding.
i
A B S T R A C T
UTILITY OF INFLATION ACCOUNTING DATA TO INVESTORS
Marann Byrne
Dublin City University, 1992
The objective of financial reporting is to provide information about an entity which is useful to a wide range of users in making economic decisions. This study empirically investigates theutility of inflation accounting data to investors, by examining the ability of this data to explain the share prices of UK listedcompanies. Previous research supports a relation betweenhistorical cost accounting data and share prices from a conceptual and empirical perspective. Prior evidence from studies on the utility of inflation accounting data to investors is mixed.However, many of these suffer from methodological problems which cast doubts on their ability to evaluate the utility of inflation accounting data. This study overcomes some of the problems encountered in earlier studies and incorporates additional research design features.
In evaluating inflation accounting data, this study exploreswhether or not company policy towards the disclosure of inflation accounting data in the premandatory period is associated with the explanatory power of this data. The investigation was undertaken for 2 periods to discover whether or not a learning lag exists in relation to the inflation accounting data.
To achieve the objectives of this study, a recently developed cross sectional valuation model was used. The model incorporates measures from both the balance sheet and income statement, which allows the value relevance of key financial report disclosures to be assessed.
The analysis reveals evidence supporting the utility of inflation accounting data to investors. The results show that a company's policy towards disclosing inflation accounting data in the premandatory period is associated with the explanatory power of this data. The significance of the inflation accounting data appears to be greater for the companies disclosing inflation accounting data in the premandatory period (Supportive Companies), than for companies which commenced disclosure in the first mandatory period (Reluctant Companies). There is also, evidence showing a differential response to the inflation accounting data for the Supportive and Reluctant Companies. The analysis fails to find any evidence of a learning effect in respect of the inflation accounting data.
A B B R E V IA T IO N S
AICPA American Institute of Certified PublicAccountants
ASC Accounting Standards Committee
ASB Accounting Standards Board
ASSC Accounting Standards Steering Committee
ASE American Stock Exchange
ASR Accounting Series Release
CAPM Capital Asset Pricing Model
CAR Cumulative Abnormal Return
CC Current Cost
CCA Current Cost Accounting
CPP Current Purchasing Power
ED Exposure Draft
EMH Efficient Market Hypothesis
E/P Earnings/Price Ratio
FASB Financial Accounting Standards Board
GAAP Generally Accepted Accounting Principles
HC Historical Cost
HCA Historical Cost Accounting
IASC International Accounting Standards Committee
IEP Incremental Explanatory Power
MBAR Market Based Accounting Research
NIH Naive Investor Hypothesis
NYSE New York Stock Exchange
OLS Ordinary Least Squares
i i i
OTC Over The Counter
PAT Positive Accounting Theory
P/E Price/Earnings Ratio
PhD Doctor of Philosophy
PSSAP Provisional Statement of Standard AccountingPractice
SAB Staff Accounting Bulletin
SEC Securities and Exchange Commission
SFAS Statements of Financial Accounting Standards
SPSSx Statistical and Presentation Software Systems Version x
SSAP Statement of Standard Accounting Practice
UK United Kingdom
US United States of America
VIF Variance Inflation Factor
i v
Page
2.1 Qualitative characteristics of financialreports 23
4.1 Appleyard and Strong's company classification 114
5.1 Enthusiasm for SSAP 16 166
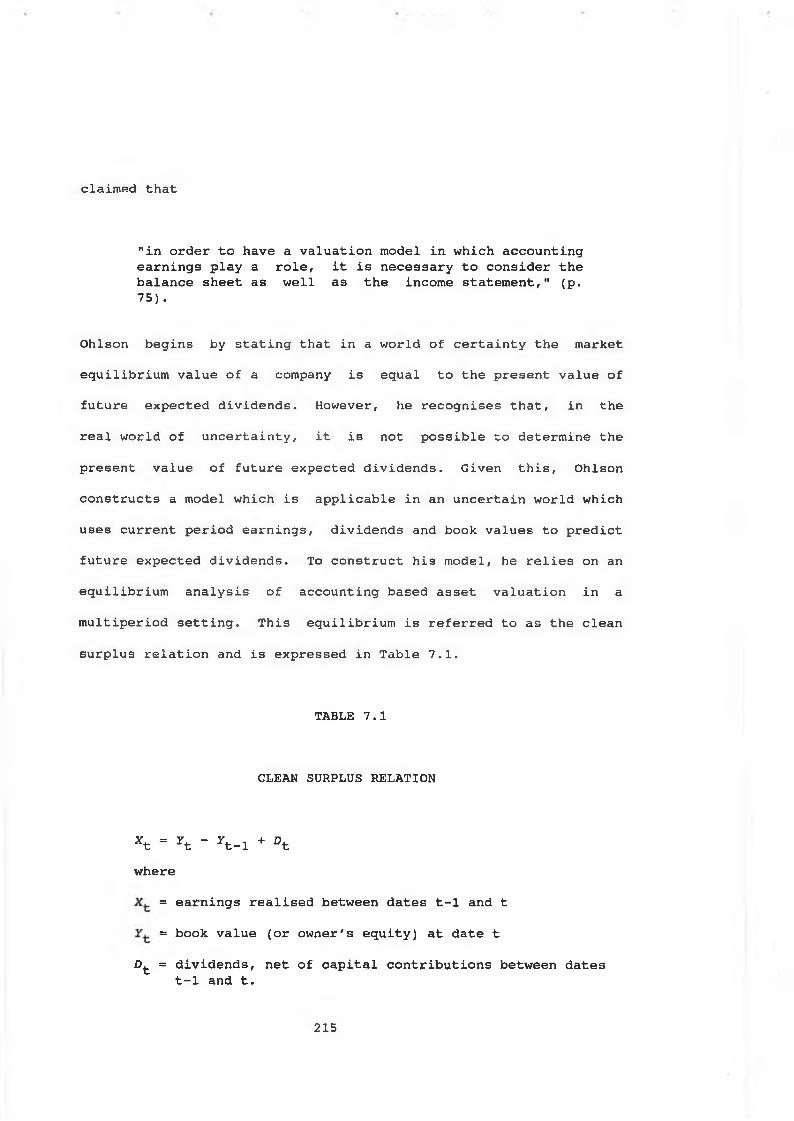
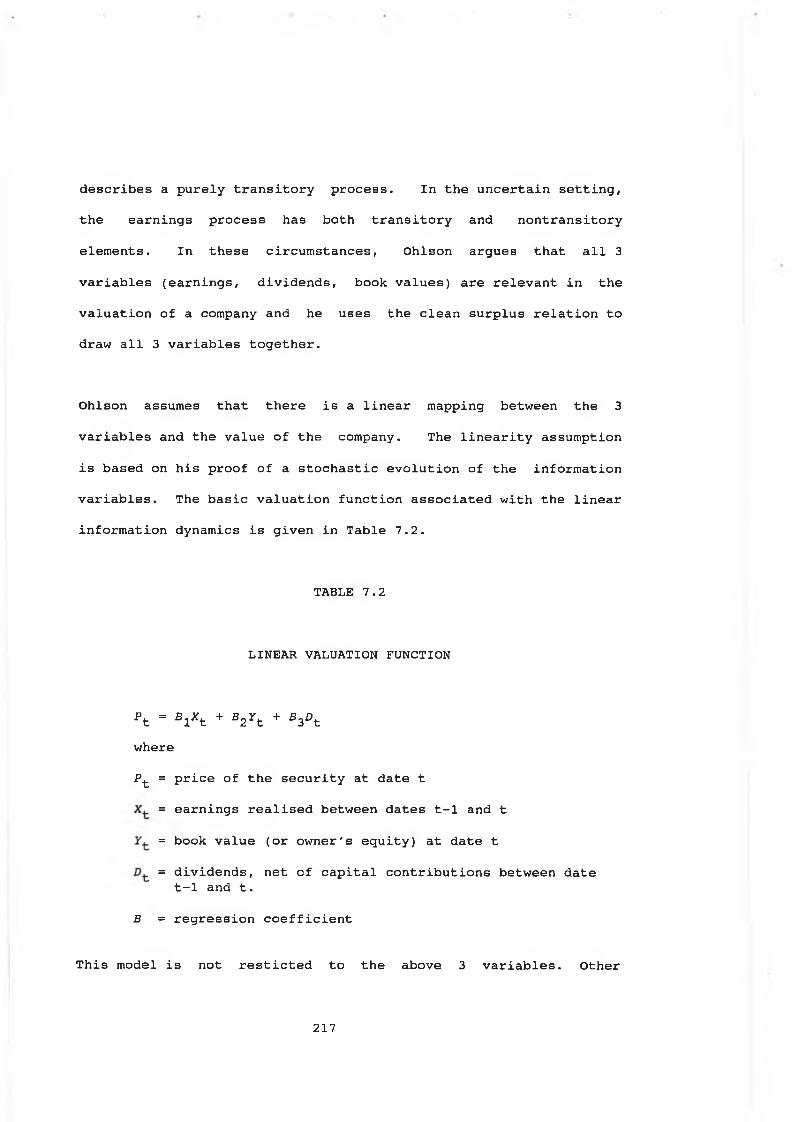
7.1 Clean surplus relation 215
7.2 Linear valuation function 217
7.3 Valuation model 219
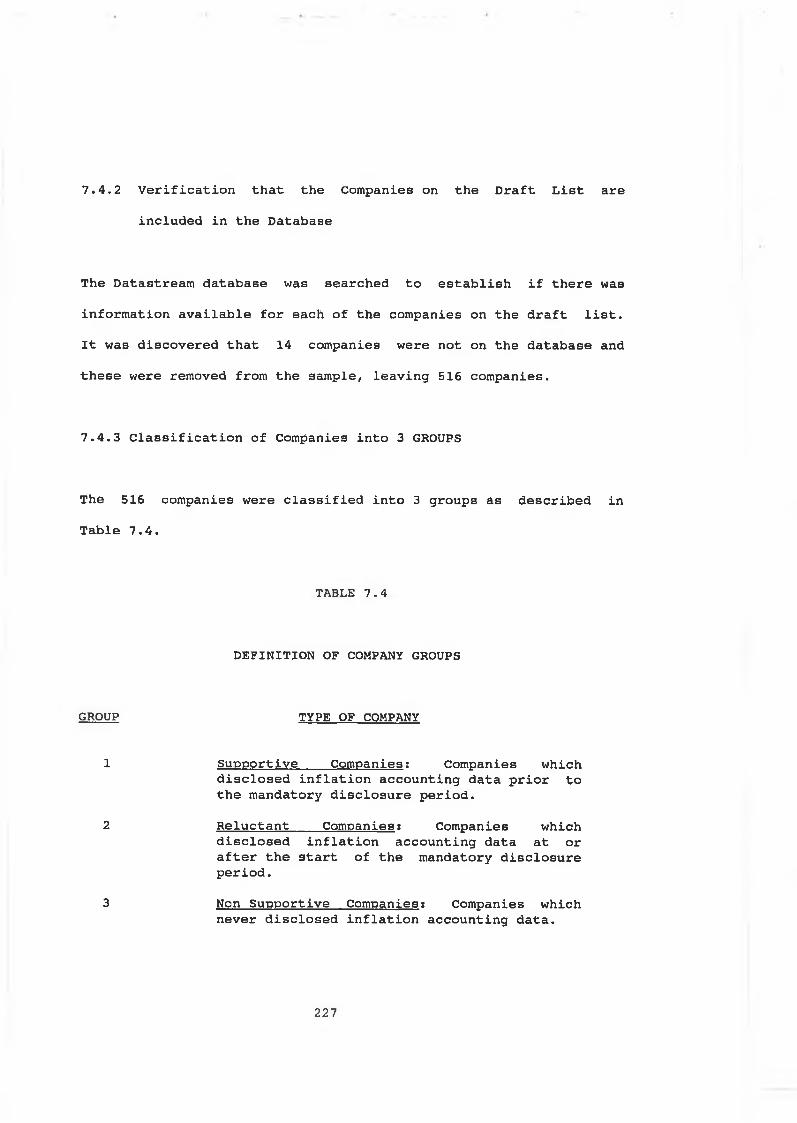
7.4 Definition of company groups 227
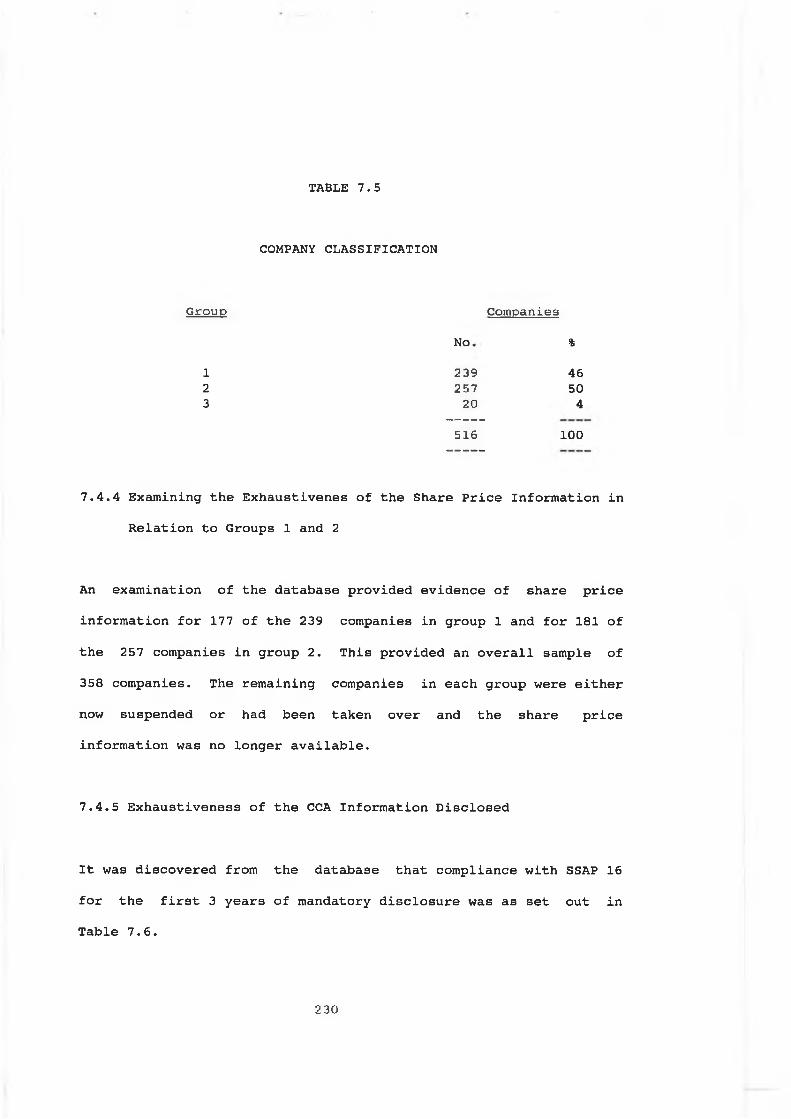
7.5 Company classification 230
7.6 Compliance with SSAP 16 231
8.1 Valuation model 240
8.2 Basic model formatted to include dummy variables 241
8.3 Regression results including dummy variables:basic models 243
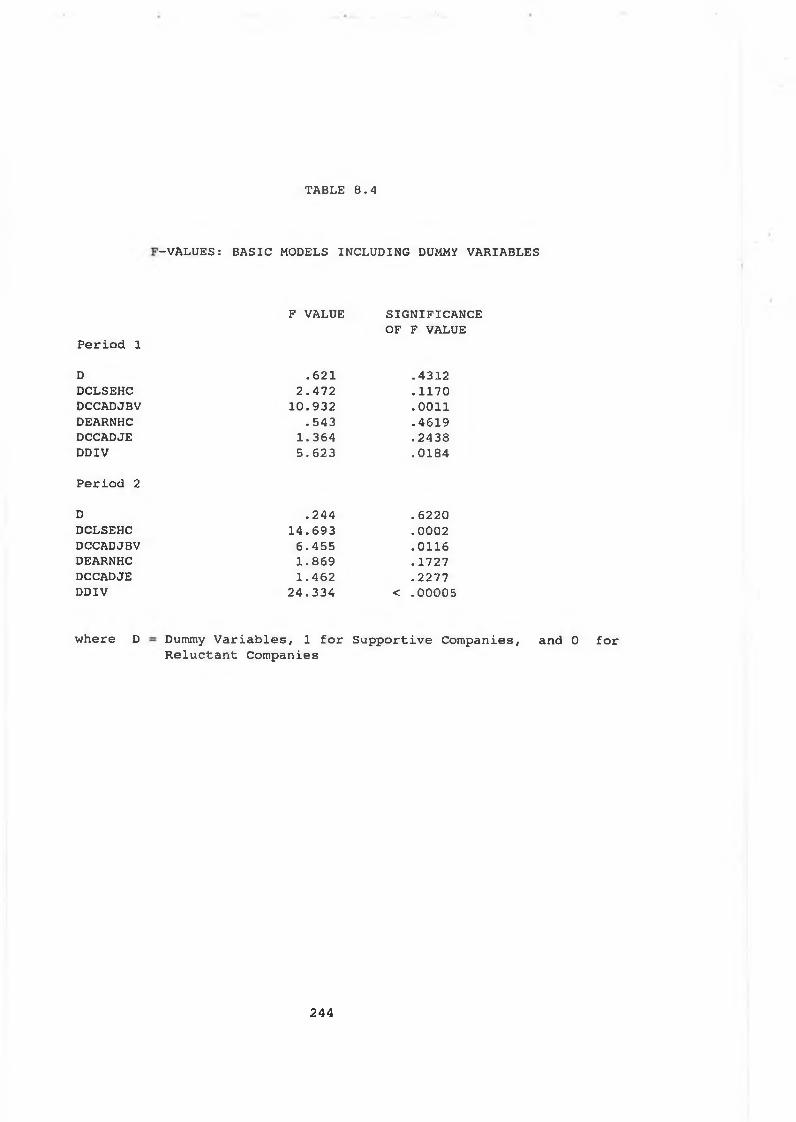
8.4 F values; basic models including dummy variables 244
8.5 Regression results: basic models 245
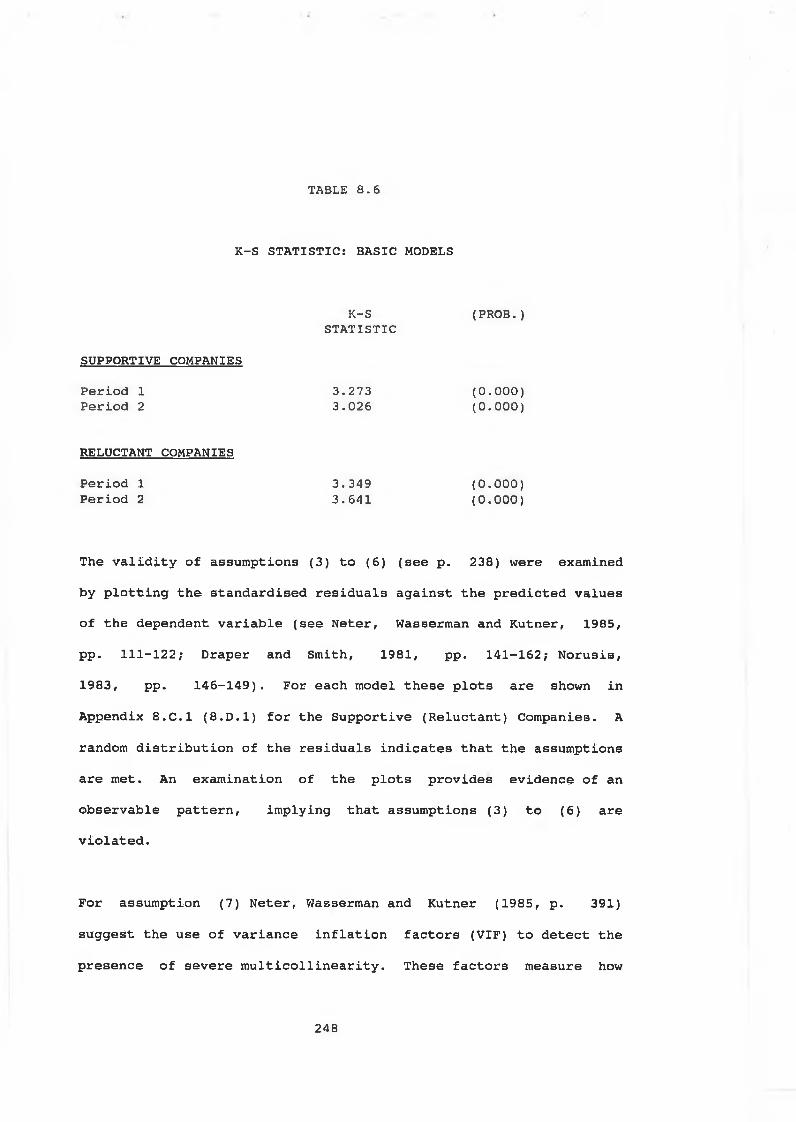
8.6 K-S statistic: basic models 248
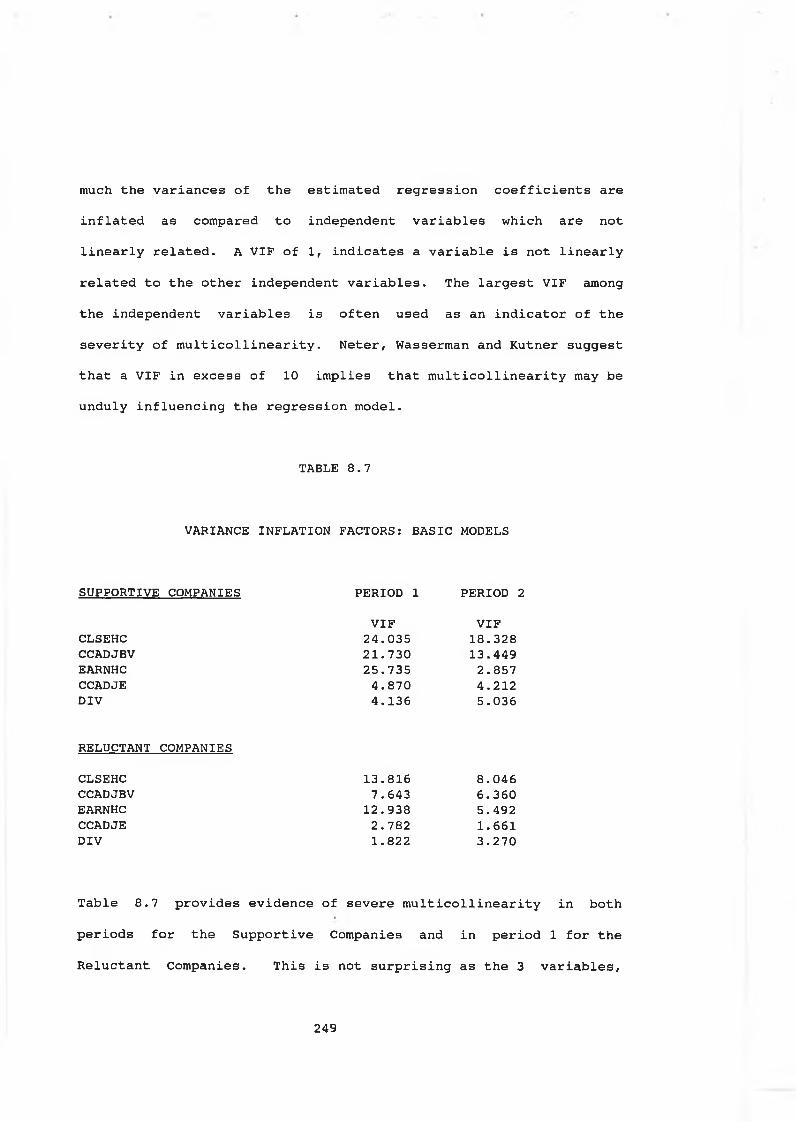
8.7 Variance inflation factors: basic models 249
8.8 First difference models including dummyvariables 253
8.9 Regression results: first difference models 255
8.10 T value: first difference models 256
8.11 Variance inflation factors: first differencemodel, supportive companies 257
8.12 Variance inflation factors: first differencemodel, reluctant companies 258
L I S T O F T A B L E S
v
8.13 K-S statistics: first difference models 259
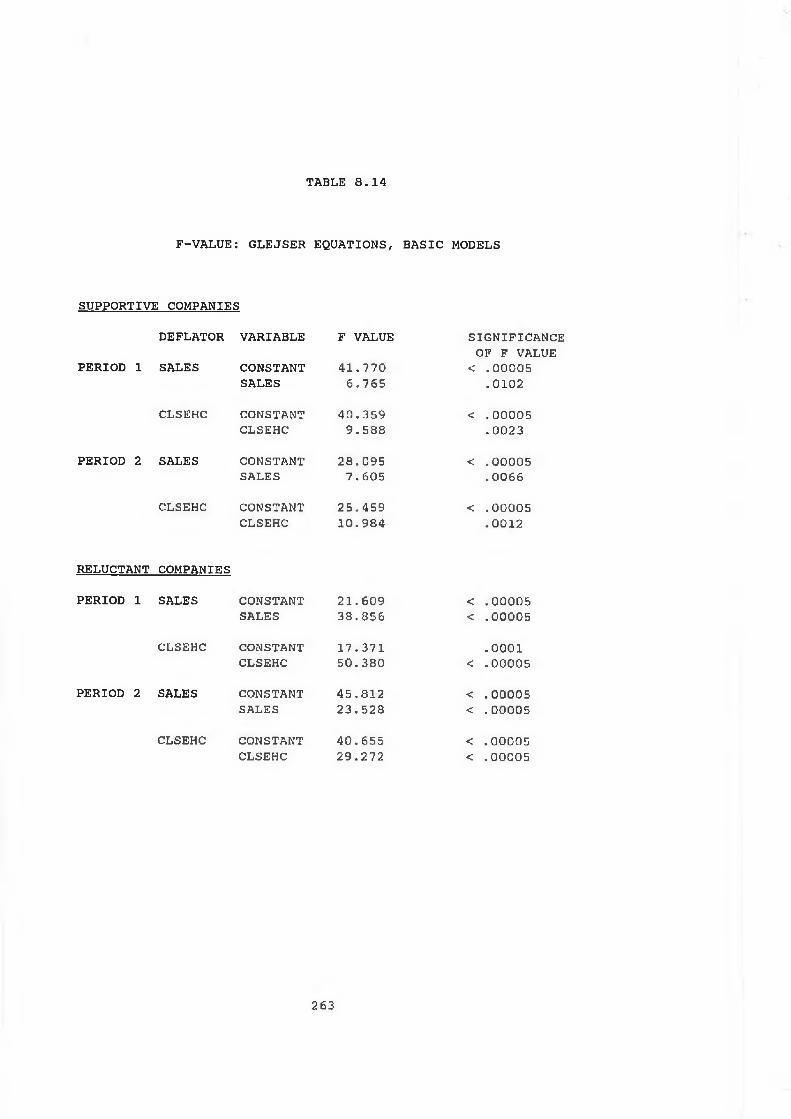
8.14 F value: Glejser equations, basic models 263
8.15 F value: Glejser equations, first differencemodels 264
8.24 Summary of Supportive and ReluctantCompanies' models 277
8.25 Extent to which the analysed models satisfy theregression assumptions 278
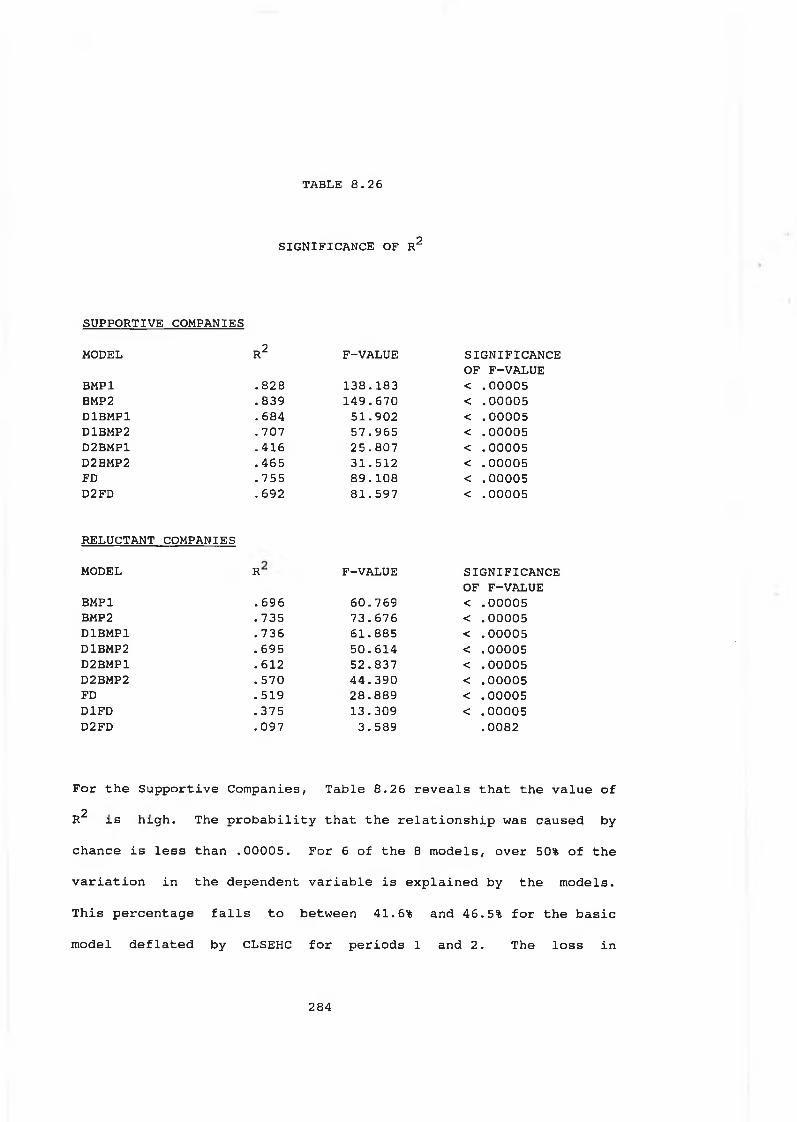
8.26 Significance of R 284
8.27 F value associated with the independent variable 287
8.28 Examining the relative importance of theindependent variables 289
8.29 Relationship between the dependent andindependent variables 295
28.30 Comparision of the R of the full models and thereduced models 306
8.31 Comparision of the VIF for the CCADJBV andCCADJE variables 310
8.32 Comparision of the F values for the CCADJBV andCCADJE variables 312
v i
8.L.1 Supportive companies: HC residual income model 436
8.L.2 Reluctant companies: HC residual income model 437
8.L.3 Supportive companies: CC residual income model 440
8.L.4 Reluctant companies: CC residual income model 441
8.L.5 Return model 446
8.L.6 2Comparrsion of the R reduced model
of the full model and the447
v i i
L I S T OF A P P E N D IC E S
2.A US proposals on inflation accounting
2.B UK proposals on inflation accounting
3.A Assumptions of the CAPM
4.A Important event dates used in Ro's studies (1980 & 1981)
7.A Data extracted from Datastream to derive theindependent variables
7.B Sample of companies
7.C Questionnaire and letters used to determinecompanies' policy on the disclosure of inflationaccounting data prior to the mandatoryperiod
7.D Companies classified by industry
7.E Reporting dates of the sample companies
8.A Supportive Companies - Plots of the observed cumulative distribution of the residuals against the distribution expected under the assumption of normality
8.B Reluctant Companies - Plots of the observedcumulative distribution of the residuals against the distribution expected under the assumption of normality
8.C Supportive Companies - Scatterplots ofstandardised residuals against predicted values of Y
8.D Reluctant Companies - Scatterplots ofstandardised residuals against predicted values of Y
8.E Correlation coefficients
8.F Glejser's regression equations
Page
340
342
345
347
350
352
360
364
366
368
377
387
396
406
412
v i i i
1
8.G Definition of the abbreviated model titles 415
8.H Per share basic models: variance inflationfactors 417
8.1 Beta distributions 419
8.J Beta groups; variance inflation factors 422
8.K Beta groups: standardised residual plots 424
8.L Alternative specifications of Ohlson's model 433
i x
C H A P TE R 1
THE NATURE AND SCOPE OF THE STUDY
C H A P T E R 1
THE NATURE AND SCOPE OF THE STUDY
This study investigates the utility of inflation accounting data
for investment decision making by examining the ability of this
data to explain share prices. The inflation accounting variables
examined were disclosed in compliance with Statement of Standard
Accounting Practice (SSAP) 16. This chapter presents the rationale
and framework for the study. It considers:
the background to the study (1.2);
definitions of key terms (1.3);
the study's objectives (1.4);
an overview of the research methodology used (1.5);
the limitations of the study (1.6); and,
the plan of the study (1.7).
1 . 1 IN T R O D U C T IO N
1
1.2 BACKGROUND TO THE STUDY
Since the early 1970s, considerable emphasis has been placed on the
utilitarian nature of financial reporting. This is recognised in
both the British and Americian literature, e.g., Accounting
Standards Steering Committee (ASSC) (1975, p. 28), Accounting
Standards Board (ASB) (1991), Americian Institute of Certified
Public Accountants (AICPA) (1973, p. 13) and Financial Accounting
financial reporting as "the measurement and communication of
financial and economic information to decision makers" (p. 1).
Users of financial reports include present and potential investors,
employees, lenders, suppliers and other trade creditors, customers,
governments and their agencies, and the public (e.g., ASB, 1991).
The diverse information needs of these users pose major
difficulties for the development of a single universally accepted
normative theory of financial reporting (see Demski, 1973).
In the absence of a general theory of financial reporting, some
accounting researchers have turned to the market mechanism to
provide insight to the development of accounting theory. Walker
(1992) asserts that theories need to be tested empirically before
they can be adopted as a reliable basis for policy making and
2
market based accounting research (MBAR) provides one framework
within which some of the ideas propounded by accounting theorists
can be tested.
A major thrust of MBAR (May and Sundem, 1976) has been concerned
with assessing the utility of accounting data to decision makers.
This utility is measured by examining users' reactions to
accounting disclosures, and by assessing the explanatory power of
these disclosures in relation to market variables. These measures
are studied as a means of inductively deriving preferred reporting
alternatives (O' Brien, 1979, p. 3).
MBAR has been particularly concerned with the reaction of investors
to accounting data. The investor group comprises the providers of
capital and their advisers (ASB, 1991). Revsine (1973, p. 29)
commented that investors are generally presumed to be the most
important readers of financial reports, both in terms of numbers
and magnitude of transactions. Recently, the ASB (1991) and the
Financial Reporting Commission (1992) confirmed the investor as the
primary user of financial reports. Tisshaw (1982, p. 2) stated
that this group is regarded as the most skilled and dynamic of all
users, and their needs subsume those of most other user groups.
Thus, the issue of relevance is particularly important to this
category of users. For this reason, this study focuses on this
user group to evaluate the utility of inflation accounting data.
3
I
Although financial reports are based on past events, investors use
them to predict the future performance of a company as a basis for
decision making (Beaver, Kennelly and Voss, 1968). Baxter (1986,
p. 290) suggested that accounting provides a framework of
background information that may be helpful to decision making.
Prediction of a company's future performance is used by investors
to assess that company's ability to generate future cash flows and
their variability. The finance literature reviewed in Chapter 3
establishes that cash flows and their related risk (i.e.
variability) are the measures of principal interest to investors.
This future flow concept is relevant for accounting policy makers.
However, the predictive ability of accounting measures may be
seriously impaired if conventional accounting practices are
employed in periods of unstable prices. Arnold, Boyle, Carey,
Cooper and Wild (ABCCW) (1991) stated that
I"financial reports must now meet the wider need of informing present and future economic decisionsJ This is not the purpose for which the historical cost model was designed, and it is an objective which it is unlikely to achieve." (p. 14).
The high rate of inflation during the 1970s prompted close scrutiny
of conventional accounting practices. By ignoring the effects of
inflation, accounts prepared under the historical cost accounting
(HCA) convention deduct acquistion costs incurred in earlier
4
periods from current revenues as if both were expressed in a
homogeneous unit. This practice gives rise to the reporting of
misleading information because of inflation induced distortions in
accounting measurements. These distortions are discussed in detail
in 2.6 (pp. 33-34).
Furthermore, Cross (1982, p. 109) pointed out, since inflation
affects companies differently, the accounting measurement errors
will not be systematic across companies. Therefore, financial
reports which ignore the impact of inflation undermine the utility
of reported income and balance sheet totals. This led to criticism
of conventional reporting practices and these are discussed in
2.5 and 2.6 (pp. 30-31 & pp. 33-34).
It was widely believed that inflation accounting data would improve
the predictive ability of accounting measures. This is reflected
in the FASB's (1979) standard on inflation accounting, Statement of
Financial Accounting Standards (SFAS) 33, which states that
"the board has concluded that there is an urgent need for enterprises to provide information about theeffects on their activities of general inflation andother price changes. It believes that users' . ability to assess future cash flows will be severely limited until such information is included in financial reports." (pp. 4-5).
In the United States of America (US), this thinking resulted in
large companies being required to disclose replacement cost and
constant dollar information (see Accounting Series Release (ASR)
5
190, Securities and Exchange Commission (SEC), 1976; and SFAS 33,
FASB, 1979). Their counterparts in the United Kingdom (UK) were
required to disclose current cost accounting (CCA) information for
accounting periods beginning on or after 1 January, 1980 (see SSAP
16, Accounting Standards Committee (ASC), 1980).
Accounting policy makers acknowledged that their pronouncements on
inflation accounting would involve a substantial learning process
on the part of preparers and users. For example, the FASB (1979,
SFAS 33, para. 14) allowed more flexibility within the guidelines
of SFAS 33 than was customary in Board Statements. It encouraged
preparers to develop techniques that would further the
understanding of the effects of price changes on companies. It also
recommended that the inflation accounting data should be presented
in supplementary statements, as it felt users understanding of this
data might be enhanced if they were able to compare it with the HCA
measurements included in the primary statements. Similarly, in the
UK, the ASC (1980) allowed for the supplementary disclosure of CCA
data. Also, when SSAP 16 was published it was accompanied by a
statement from the ASC recommending that no changes should be made
to the Standard for at least 3 years, to
"enable producers and users to gain uninterrupted experience in dealing with the practical problems of implementation and interpretation of the information"
(Carsberg, 1984, p. 1).
6
No other subject in accounting has caused as much debate and
controversy as the problem of accounting in periods of unstable
prices. However, today, accounting policy makers are no nearer to
finding a generally acceptable solution. The business community
and many academics have questioned the utility of inflation
accounting data. Empirical studies on the utility of the data have
yielded mixed findings (see Chapter 4). However, many of the
earlier studies suffered from several deficiencies. These included
the absence of a well developed theory linking inflation accounting
data to share values, difficulties in the sample selection
process, the limited availability of time series data, and
shortcomings in the methodological design used (see Chapter 6).
Unfortunately, commitment to resolving the inflation accounting
problem seems to be a function of the level of inflation. For
example, periods of high inflation generally evoke an abundance of
comments in the media and critical debate in the accounting
literature (see Financial Times editorial, Feb. 8, 1971 and Tweedie
and Whittington, 1984, p. 346). However, in periods of low
inflation, the issue is pushed to the background. In the US and
the UK, when the inflation rate dropped in the 1980s, interest in
inflation accounting disclosures waned, while the critics of the
standards became more vocal. But, Baxter (1984, p. viii) warns
that only a bold man would say that we shall never again see high
levels of inflation.
7
Therefore, continued discussion and research are needed. Otherwise,
policy makers will be forced once again to respond within a limited
time scale. The need for continued research is endorsed
emphatically by ABCCW (1991, p. 34) in their recent paper entitled
"The Future Shape of Financial Reports11. These writers asserted
that evolutionary reform of financial reporting is critical if a
new system of financial reporting is to be developed which meets
users' needs. They view further work in testing the market's
reaction to the use of current values as a critical part of this
process.
To date, the majority of research on the utility of inflation
accounting data has focused on identifying a market reaction to the
disclosure of this data. However, a review of these information
content studies shows that they suffer from methodological problems
(see 6.2, pp. 179-191) and, therefore, cannot solely be relied
upon in deciding on the utility of inflation accounting data. For
this reason, other researchers (e.g., Lev and Ohlson, 1982;
Atiase and Tse, 1986) have suggested the use of a valuation
approach. This approach offers a potentially useful perspective
that is different from and complementary to that provided by
information content studies. A small number of studies (see 4.4)
have used the valuation approach, and the findings from these
studies are more promising in relation to the utility of inflation
8
accounting data. The recent literature (e.g., Walker, 1992) also,
suggests that researchers should take greater care and attention in
the development of theoretical foundations of their research.
In the light of the above comments, additional research,
incorporating improved methodogical design, appears warranted. It
is hoped that the additional evidence provided by this study will
contribute to the discussion on inflation accounting. Before
describing the objectives of the study, the next section defines
key terms used throughout the thesis.
1.3 DEFINITIONS
Inflation Accounting is any method of accounting which takes
account of the effects of changes in the purchasing power of money,
either specific or general price changes.
Financial Reporting is the external disclosure of financial
information by entities to external users.
Financial Reports are the means usually used by entities to
disclose financial information externally and include financial
statements consisting of a balance sheet, profit and loss account,
funds (or cash) flow statement together with explanatory notes and
other financial data.
9
1.4 OBJECTIVES OF THE STUDY
This study aims to provide an insight to the explanatory power of
inflation accounting data in relation to the share prices of UK
listed companies. It is hoped that the findings will serve as a
useful input to the deliberations of accounting policy makers in
their considerations of inflation accounting.
The specific objectives of this research are set out below.
To examine the conceptual framework within which the
utility to investors of accounting data in general,
and inflation accounting data in particular, might be
evaluated.
To critically assess those studies which evaluated the
utility of inflation accounting data to the securities
markets.
To provide additional empirical evidence on the
incremental explanatory power (IEP) of inflation
accounting data in relation to the share prices of UK
listed companies.
10
To determine whether or not company policy towards the
disclosure of inflation accounting data in the
premandatory period is associated with the explanatory
power of this data.
To discover whether or not a learning lag exists in
relation to the inflation accounting data.
1.5 RESEARCH METHODOLOGY
To achieve the objectives of this study, a valuation model is used
to explore the relationship between accounting variables and share
prices. The model used in the study is based on a model of
accounting based asset valuation, developed by Ohlson (1989). An
explanation of the model together with a discussion of its
advantages in the context of the objectives of this study are
presented in Chapters 6 and 7.
The valuation model is used to determine the explanatory power of
historical cost (HC) and inflation accounting variables. The
inflation accounting variables are derived from current cost (CC)
measures disclosed in compliance with SSAP 16. The use of share
prices as a test of the utility of accounting data to investors is
justified in Chapter 3 by reference to developments in capital
market theory.
11
The methodology employed in this study overcomes some of the
problems encountered in earlier studies (see 6.4.1, pp. 200-205)
and has the additional features outlined below.
The valuation model used is based on Ohlson's (1989)
model. The model incorporates measures from both the
income statement and the balance sheet, which allows
for the value relevance of key financial report
disclosures to be assessed. Recent articles, e.g.,
Brennan and Schwartz (1982a, 1982b), Ou and Penman
(1989) and Brennan (1991) have recommended this form of
model. Furthermore, as very few studies have
empirically tested Ohlson's model, this study will
provide evidence on its practical application.
A large number of industrial UK listed companies, drawn
from a wide range of industries, is included in the
sample.
The sample of companies is divided into 2 groups based
on the companies' policy towards the disclosure of
inflation accounting data in the premandatory period.
Under the requirements of SSAP 16, companies were
required to disclose CCA data for accounting periods
beginning on or after 1 January 1980. For the purposes
of this study, companies were classified as being
12
'Supportive' if they disclosed inflation accounting
data prior to the mandatory period and 'Reluctant' if
disclosure commenced in the first mandatory period.
Separate cross sectional models are derived for the
Supportive and Reluctant companies.
The models test the IEP of cumulative unrealised
holding gains and unrealised holding gains arising in
the period.
The analysis is performed for 2 periods to help
determine if there is a learning effect associated with
inflation accounting data.
1.6 LIMITATIONS OF THE STUDY
The limitations of this study are now listed.
The sample is limited to large industrial UK listed
companies required to comply with SSAP 16. Accordingly,
any inferences drawn are limited to this population.
13
The study is concerned only with assessing the extent
to which the variables included in the model meet the
information needs of 1 user group, namely investors. It
is possible that the data may be of use to other users,
as financial decision makers are a heterogeneous group
potentially possessing different abilities and decision
models.
The analysis focuses only on the information needs of
the investor group with respect to determining an
investment's value. Furthermore, the variables
included in the model are but a subset of the total
information available to the investment community.
Thus, the model may suffer from an omitted variable
problem. However, this approach was adopted to keep the
study within reasonable bounds.
The analysis is confined to 2 periods. Therefore,
conclusions drawn must be qualified in this respect.
The length of the test period is a function of the
availability of inflation accounting data.
Despite these limitations, this research has the potential to
provide additional evidence on the relationship between share
prices and inflation accounting data.
14
1.7 PLAN OF THE STUDY
To achieve the objectives set out in 1.4 (pp. 10-11), this
research is organised in the manner outlined below.
Chapter 2 provides the framework for examining the utility of
accounting data to investment decision making. It begins by
examining the objective of finacial reporting. It identifies the
provision of decision relevant information to users as the
objective of financial reporting. In this context, investors'
informational needs are examined together with the qualitative
characteristics of financial reports which help meet these needs.
The chapter discusses the limitations of HCA and puts forward the
case for the disclosure of inflation accounting data. The
literature on inflation accounting is reviewed and a brief outline
is provided of the major UK and US regulatory prouncements on
inflation accounting. The final section reviews SSAP 16, the UK
standard on inflation accounting.
Chapter 3 examines the developments in capital market theory and
explores the implications of these developments for evaluating the
utility of accounting data to investors. It describes the share
pricing mechanism and identifies the key factors which determine a
share's value. It discusses why it is reasonable to expect a
relationship between share values and accounting data in an
efficient capital market.
15
A number of empirical studies are then reviewed which confirm a
relationship between HCA information and share prices.
Chapter 4 examines empirical studies which explored a relationship
between inflation accounting data and share prices and evaluated
the decision utility of inflation accounting data from an
investor's perspective.
The findings from empirical studies which assessed users' and
preparers' perceptions of the relevance and reliability of
inflation accounting data are presented in Chapter 5.
Chapter 6 provides a critical evaluation of the methodologies used
in the studies reviewed in Chapters 3 and 4. The chapter also
presents the case for the valuation approach used in this study, to
explore the utility of accounting data to investors.
A description of Ohlson's model and its application in this study
is provided in Chapter 7. The sample selection procedures and the
sample period are explained.
The model is derived in Chapter 8 and its statistical validity is
tested. In addition, the chapter reports the results of the
empirical analysis and offers an interpretation of the findings.
16
Finally, Chapter 9 sets out a summary of the research, its major
findings, implications and conclusions. Directions for further
research are highlighted.
1.8 SUMMARY
This chapter provided the background to and rationale for the
study. It set out the study's objectives, its limitations and the
contribution it will make to knowledge. The research methodology
was described briefly as was the organisation of the remainder of
the study.
Following this introduction, the next chapter describes the
objective of financial reporting and the measures taken to achieve
this objective. In the light of this objective it examines the case
for inflation accounting.
17
CHAPTER 2
OBJECTIVE OF FINANCIAL REPORTING AND THE CASE FOR INFLATION
ACCOUNTING DATA
CHAPTER 2
OBJECTIVE OF FINANCIAL REPORTING AND THE CASE FOR INFLATION
ACCOUNTING DATA
2.1 INTRODUCTION
The background to the demand for inflation accounting is first
examined in the wider context of financial reporting.
Financial reporting is a function of the economic, legal, political
and social environment in which it operates. Changes in this
environment create a need for persistent development, this is
recognised in the Trueblood Report (AICPA, 1973), which states that
"the objectives of financial statements are not and should not be static, just as the business andfinancial environment in our country is not static."(p. 5).
This chapter examines the objective of financial reporting and the
attributes which financial reports should possess to achieve this
objective. Investors' decision needs and the role of financial
reporting in meeting them are considered. The decision relevance of
the HCA model is explored and its limitations in periods of
unstable prices are examined. The case for inflation accounting is
18
presented and the literature and proposals on the subject are
discussed. Specifically, the principle issues explored in this
chapter ares
the objective of financial reporting (2.2);
the qualitative characteristics of financial reports
(2.3) ;
financial reports and investors' information needs
(2.4);
financial reporting, capital and income (2.5);
the limitations of HCA model in periods of unstable
prices (2.6);
alternative valuation models and the development of
inflation accounting (2.7); and,
the requirements of SSAP 16 (2.8).
19
2.2 OBJECTIVE OF FINANCIAL REPORTING
The FASB (1974a) defines an objective as "something toward which
effort is directed, an aim or end of action, a goal." (p. 13)
The early objective of financial reporting was to present the
results of the stewardship of management to the owners of the
business (see Whittington, 1983, p. 23). As businesses
expanded, the objective of financial reporting changed to reflect
the changing nature of the business environment. Carsberg, Hope
and Scapens (1978) give an historical account of this development.
Dearing (1988) emphasises this feature of accounting, noting that
"with a fast-moving worldwide financial community, the need for clear, unambiguous and widely understood accounts has become still more important to the effective working of the economy." (p. 2).
Today, accounting is essentially an utilitarian discipline, whose
function is to serve user needs. Recognition of this responsibility
is found in the Corporate Report (ASSC, 1975), which states that
the fundamental objective of financial reports is
"to communicate economic measurements of and information about the resources and performance of the reporting entity useful to those having reasonable rights to such information." (p. 28).
In the US, the Trueblood Committee (AICPA, 1973) suggested a
similar objective. They agreed that
20
"the basic objective of financial statements is to provide information useful for making economic decisions" (p. 13).
As part of its task of developing a conceptual framework for
financial accounting, the FASB (1978a), detailed the objectives of
financial reporting as follows:
to provide information that is useful to present and
potential investors and creditors and other users in
making rational investment, credit, and similar
decisions (paragraph 34);
to provide information to help investors, creditors,
and others to assess the amounts, timing, and
uncertainity of perspective net cash inflows to the
related enterprise (paragraph 37); and,
to provide information about the economic resources of
an enterprise, the claims to those resources, and the
effects of transactions, events and circumstances that
change its resources and claims to those resources in a
manner that provides direct and indirect evidence of
cash flow potential (paragraphs 40 and 41).
21
The user orientated approach towards financial reporting was
confirmed recently by Solomons (1989, p. 9), the International
Accounting Standards Committee (IASC) (1989) and the ASB (1991).
Thus, financial reports are vehicles of communication, intended to
convey information
"about the financal position, performance and financial adaptability of an enterprise that is useful to a wide range of users in making economic decisions."
(ASB, 1991, para. 12)
2.3 QUALITATIVE CHARACTERISTICS OF FINANCIAL REPORTS
Attributes which financial reports should possess to enable them to
fulfil their objective have been identified by the ASSC (1975, pp.
28-29), the FASB (1980), Solomons (1989, pp. 29-41), and the ASB
(1991). These attributes are called qualitative characteristics
and a similar list of attributes has been suggested by UK and US
accounting policy makers. Table 2.1 lists the qualitative
characteristics proposed by Solomons (1989, pp. 30-31).
22
Table 2.1
QUALITATIVE CHARACTERISTICS OF FINANCIAL REPORTS
RelevancePredictive value Confirmatory value Corrective value Timeliness
Subject to considerations of cost, financial reports should
possess the maximum level of these attributes. Relevance and
reliability are regarded as the 2 primary attributes (FASB, 1980,
p. 2; Solomons, 1989, p. 30; ASB, 1991). Solomons (1989, p. 30)
stated that relevance must come first, on the grounds that if
information is irrelevant, it does not matter what other qualities
it possesses.
Information is relevant to a decision making situation if it has
the capacity to help a decision maker to form, confirm or revise
expectations about the future, or to confirm or correct prior
expectations about past events (Solomons, 1989, p. 31). Accounting
23
reports are reliable if the user has reasonable assurance that they
faithfully represent what they purport to represent (Solomons,
1989, p. 32).
Although financial reports must be both relevant and reliable to be
useful, they may possess both characteristics to varying degrees.
The problem of accounting for inflation has brought into prominence
the question of the relative importance of these 2 attributes.
Their significance to the inflation accounting debate is considered
in 5.3.
Any definition of relevance assumes an awareness of the information
needs of users. As mentioned in 1.2 (p. 3) this study is concerned
with the investor user group. The next section examines the role
of financial reports in providing decision relevant information to
investors.
2.4 FINANCIAL REPORTS AND INVESTORS' INFORMATION NEEDS
Investors are concerned with whether they should buy, hold or sell
investments (ASB, 1991). This decision is based on the risk
inherent in, and return provided by, the investments. The return
and risk of an investment is determined by the amount and
uncertainity of the cash flows which that investment can generate
(see 3.5 pp. 58-60). Thus, investors need information to help
24
them assess an enterprise's ability to generate cash flows.
Consequently, the utility of financial reports can be judged by
their ability to provide information which assists in estimating
the amount and timing of cash flows. The IASC (1989) claims that
"users are better able to evaluate this ability to generate cash and cash equivalents if they are provided with information that focuses on the financialposition, performance and changes in financial position of an enterprise." (para. 14).
Finanical reports will be useful if they provide a track record
upon which forward looking estimates can be based. When
considering present financial reporting, Solomons (1989) states
that
"its value for decision-making lies largely in the information it provides about an enterprise's present financial position and its recent past operatingresults as a basis for drawing conclusions about its probable future results and future financial position."(p. 12).
Empirical evidence (see Lee and Tweedie, 1981; Anderson, 1981;
Hines, 1982; Chang, Most and Brain, 1983; Arnold and Moizer, 1984;
Day, 1986 Cready and Mynatt, 1991) has shown that investors view
financial reports as important sources of information about an
enterprise. Based on their analysis of trading, Cready and Mynatt
(1991) concluded that the annual report was a particularly
significant source of information for the small investor. Given
investor's reliance on financial reports the next section examines
their effectiveness in measuring an enterprise's financial position
25
(capital/value) and performance (income). Recently, the ASB
(1991) confirmed its view, that users are better able to evaluate
a company's ability to generate cash flows if they are provided
with information that focuses on the financial position,
performance and cash flows of the company.
2.5 FINANCIAL REPORTING, CAPITAL AND INCOME
2.5.1 Introduction
Information about a company's financial position is primarily
provided in a balance sheet. Information about the performance of a
company is primarily given in a profit and loss statement. The
financial position of a company is normally described in terms of
the shareholders' equity (capital), which is represented by the
value of the net assets of the company (Lee, 1985, p.5). If it is
desired to convey information on a company's capital and
performance (income), the selection of a basis of measurement which
captures this information is required. The 2 main approaches
discussed in the literature are the economist's and the
accountant's approach. The main features of both these approaches
are outlined.
26
2.5.2 Economist's Approach
Lee (1985 p. 68), Kam (1990, p. 136) and Bromwich (1992, p. 32)
suggested that the economist's approach to the measurement of
capital and income is the ideal measure. Bromwich (1992, p. 69)
commented that the widespread advocacy of portfolio theory for
investment decisions (see 3.5, pp. 58-60) supports the economic
approach to capital and income measurement. The economic model
values capital on the basis of discounted future net cash flows
(Lee, 1985, p. 13). In deriving this value, cash flows expected
from both tangible and intangible assets are taken into account.
Although Fisher (1906) is credited with formulating the present
value approach in a way that is serviceable to accountants, it was
Canning (1929) who demonstrated its relationship to accounting
concepts showing that at least in theory, the value of an asset or
liability is the present value of the future net cash flows related
to it (see Kam, 1990, p. 142).
Under the present value approach, income for a period is given by
the net increase in the economic value of capital after adjusting
for net capital movements. This reflects Hicks's (1946, p. 171)
widely accepted definition of income (Lee, 1985, pp. 7-8).
27
Hicks's definition, applied to a company, defines income as
"the maximum value which a company can distribute during a period, and still expect to be as well off at the end of the period as it was at the beginning."
(see Edwards, Kay & Mayer, 1987, p. 2)
Eonomists compute capital in order to measure income (Lee, 1985, p.
7). However, the practical application of the present value
approach is frequently impossible (see Shwayder, 1967; Barton,
1974). The principal problem lies in estimating the size and the
duration of future cash flows and deciding on the appropriate
discount rate. Furthermore, Kam (1990, p. 145) asserted that it
is virtually impossible to identify the specific stream of net cash
flows for a particular asset used in conjunction with other assets.
Harvey and Keer (1983, p. 26) claimed that the value in use of
any asset will be dependent upon other assets, some of which may
be intangible. Given these difficulties, accountants have
effectively rejected the economic approach to capital valuation and
income measurement.
2.5.3 Conventional Accountant's Approach
Conventional accounting practice uses past transactions as its
foundation. These are generally recorded using the HC basis of
valuation. The approach relies on a series of principles and rules
such as the realisation principle and the concepts of matching and
prudence.
28
The realisation principle means that changes in the value of
capital are not recognised in the accounts until there is objective
evidence of a market valuation through a business transaction. This
is normally taken as the point of sale or purchase. Conventional
accounting income excludes unrealised holding gains. This results
in periodic income containing a heterogeneous mixture of current
and prior period gains (Lee, 1985, p. 53). Several writers (e.g.,
Myers, 1959; American Accounting Association Committee, 1965,
Horngren, 1965) claim that application of the realisation principle
leads to a misleading computation of accounting income and capital.
The situation is further confused by the application of the
prudence concept which requires accountants to recognise unrealised
losses prior to realisation, while ignoring unrealised holding
gains.
Once the revenues and costs have been recognised, they are then
matched to derive the income for the period. This matching gives
rise to judgemental problems in deciding on the allocation of costs
to an accounting period. Hence, the validity of conventional
accounting measures, depends on the soundness of the judgements
made in revenue recognition and cost allocation. A major
consequence of the matching principle is that it relegates the
balance sheet to a repository of unallocated costs (Kam, 1990, p.
178). Thus, the balance sheet's use as a measure of a company's
financial position is seriously impaired. Sprouse (1973) described
29
the balance sheet as a "dumping ground for balances that someone
has decided should not be included in the income statement" (p.
173) .
Although the basic inputs into the computation of accounting income
are net cash flows, the application of the realisation, prudence
and matching principles yields a measure of periodic income which
is likely to be considerably different from economic income
(Edwards, Kay and Mayer, 1987, p. 18). However, there is
evidence to suggest that accounting income may be useful in
predicting permanent economic income (see Rees, 1990, pp. 272-273;
Beaver, 1989, pp. 98-101).
2.5.4 Demand for Change
Given the imperfections of the conventional HCA model, some
writers have suggested the use of alternative valuation models.
They believed these latter models have greater utility as they
incorporate economic thinking into the conventional accounting
model without making it wholly prediction based (Lee, 1985, p.64).
A discussion of these models and their relevance to inflation
accounting is presented in 2.7 (pp. 36-42).
In periods of unstable prices, the limitations of the conventional
HCA model are more apparent and its decision utility is seriously
impaired (Kam, 1990, p. 176). The presidents of 5 leading
3 0
accountancy bodies of the Consultative Committee of Accountacy
Bodies (ASC, 1986) asserted that where a company's performance and
financial position are materially affected by changing prices, HC
accounts alone are insufficient, and information on the effects of
changing prices is vital for an appreciation of a company's
performance.
The FASB (1979) believed that the absence of inflation accounting
information could lead to the following difficulties
"resources may be allocated inefficiently, investors' and creditors' understanding of the past performance of an enterprise and their ability to assess future cash flows may be severely limited." {p. 2)
The deficiencies of HCA in periods of unstable prices are described
in the next section.
2.6 LIMITATIONS OF THE HCA MODEL IN PERIODS OF UNSTABLE PRICES
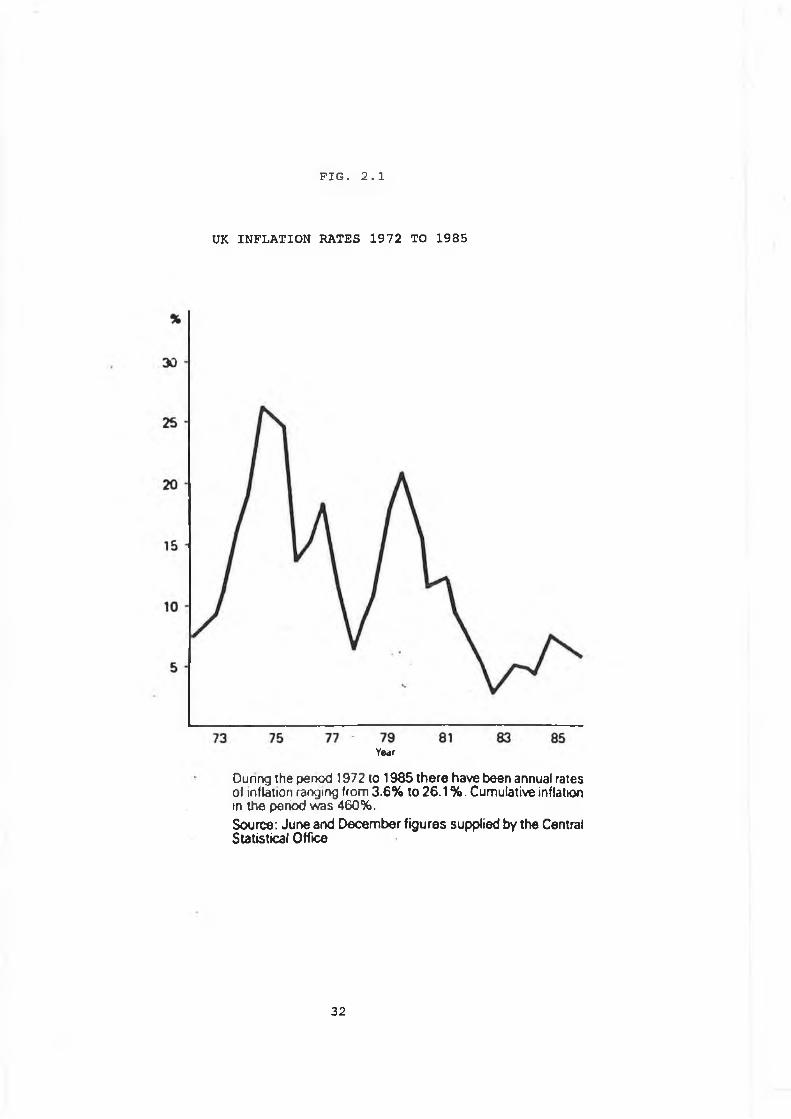
In the period from the early 1970s to the mid 1980s the UK
experienced the highest inflation (i.e. general reduction in the
purchasing power of money) rates in its modern history (see Fig.
2.1) .
31
FIG. 2.1
UK INFLATION RATES 1972 TO 1985
Year
During the penod 1972 to 1985 there have been annual rates of inflation ranging from 3.6% to 26.1 % . Cumulative inflation in the period was 460%.Source: June and December figures supplied by the Central Statistical Office
32
The seriousness of these price rises, compared with other periods,
is well documented by Myddelton (1984, pp. 1-6). The period
experienced inflation rates ranging from 3.6% to 26.1%, with
cumulative inflation in the period 1972-1985 reaching 460%.
Given that accountants rely on the monetary unit as a common
denominator to record past transactions, its instability in periods
of unstable prices can have serious implications in interpreting
the results of this process. Moonitz (1961, p. 18) pointed out
that 2 or more objects must be expressed in identical units before
any meaningful mathematical operations, such as addition or
subtraction, can be performed. However, in an economy with large
changes in the purchasing power of money, the summation,
subtraction or comparison of accounting figures in terms of an
unadjusted monetary unit is meaningless. Thus, the suitability of
money as a common denominator over time is called into question.
In periods of unstable prices, accounts prepared under the HC
convention are considered to suffer from serious deficiencies
described by the ASC (1986, p. 9) as follows:
(1) reported results may be distorted as a result of the
matching of current revenues with costs incurred at an
earlier date. The full distribution of profits
calculated on that basis may result in the distribution
of sums needed to maintain capital;
3 3
(2) the amounts reported in a balance sheet in respect of
assets may not be realistic, up to date measures of the
resources employed in the business;
(3) as a result of (1) and (2), calculations to measure
return on capital employed may be misleading;
(4) because holding gains or losses attributable to price
level changes are not identified, management's
effectiveness in achieving operating results may be
concealed;
(5) there is no recognition of the loss that arises through
holding assets of fixed monetary value and the gain
that arises through holding liabilities of fixed
monetary value; and,
(6) a misleading impression of the trend of performance
over time may be given because no account is taken of
changes in the real value of money.
A major consequence of these limitations is that HCA provides
unsatisfactory guidance for decision making. In particular, the ASC
(1986, p. 11) commented that dividend payments, investment and
financing decisions, and pricing and pay policies should not be
decided upon without taking account of the effects of changing
34
prices. The serious consequences of ignoring price changes is
demonstrated by the statistics released by the FASB (1981, p.2) on
corporations subject to the requirements of SFAS 33, where for
1980, on a CC basis, dividends exceeded profits, resulting in a
disinvestment rate of 2.4%.
Some companies have attempted to compensate for the imperfections
of HCA by adopting modified HC accounts, under which certain
assets are included in the balance sheet at revalued amounts.
However, most of these companies undertake revaluations
comparatively infrequently and do not revalue all their assets
(ASC, 1986, p. 13). This results in many of the limitations of
pure HCA remaining.
These limitations led to the consideration of the use of valuation
models which would be more decision relevant in periods of unstable
prices. The review which follows examines these alternatives and in
particular, considers their contributions to the debate on
inflation accounting. A more detailed consideration of the subject
is given by Whittington (1983).
35
2.7 ALTERNATIVE VALUATION MODELS AND THE DEVELOPMENT OF INFLATION
ACCOUNTING
As early as 1918, William Paton (1918) recognised the problems
caused by an unstable monetary unit in understanding unadjusted
financial reports. He viewed conventional accounting practices as
failing to meet users needs, arguing that
"accounting systems must become more sensitive and accurate gauges of economic data - and certain long-standing theories and policies of accountants must undergo modifications if the purposes of the various interests in the business enterprise are to be adquately served."
(Paton, 1920, p. 30)
Paton was concerned with maintaining the economic well being of the
business unit. Replacement cost was identified as the appropriate
basis of valuation. In his first paper (1918), he advocated the
separate reporting of unrealised holding gains in the income
statement. Such a proposal was revoluntionary as it violated the
cherished realisation principle. Scapens (1981, p. 12) observed
that the publication of Paton's views evoked little response from
other American accountants, except to give rise to some objections
to the use of replacement costs as a basis for depreciation. Paton
(1920) was forced to take a more conservative posture in his
subsequent work.
36
Sweeney, (1936) proposed a systematic recognition of price level
changes to adjust for the distortion caused by changes in the
purchasing power of money. In 1936 he developed a technique which
is referred to as stablised accounting, which is the antecedent of
constant purchasing power (CPP) accounting. He provided detailed
descriptions and numerical examples of how to stablise either
historical costs or replacement costs by adjusting for general
price level movements. He believed that the capital, to be
maintained intact, should be measured as a proprietory concept in
terms of real command over goods and services in general, rather
than in terms of the specific assets owned by the company. His
preferred approach was to apply the CPP adjusment to replacement
cost values rather than HC values, as this took account of both
specific and general price level changes. However, Sweeney's
approach was rejected by several writers (e.g., Griffith, 1937;
Bowers, 1950; Bell, 1953; and Warner, 1954) on the grounds that it
was impossible to determine which price index should be used. It
was argued that the use of an inaccurate index would obscure the
company's real performance (see Kirkman, 1974, pp. 52-64 for a
discussion of UK indices).
In 1961, Edwards and Bell (1961) advocated the merits of
replacement cost accounting as a method of splitting conventional
accounting income. They chose replacement cost on the grounds that
replacement is generally more relevant to a business which will
continue its operations in the foreseeable future. Income derived
37
on this basis is referred to as business income. The system
proposed by them segregates operating gains from holding gains, and
also abandons the realisation principle. Business income is equal
to the aggregate of (a) current operating income of the period, (b)
realised holding gains of the period, and (c) unrealised holding
gains of the period. Edwards and Bell claimed that this analysis
of income facilitated the prediction of a company's cash flows as
"current operating profit can be used for predictive purposes if the existing production process and the existing conditions under which that process is carried out are expected to continue in the future" (p. 99).
Finally, Edwards and Bell (1961, p. 278) suggested adjusting
business income to allow for general price level changes. The
resulting measure they referred to as Real Business Income. By
implementing this approach, Edwards and Bell proposed to show,
within a single set of accounting statements, a variety of
information which they considered to be necessary for a full
evaluation of a company's activities. The approach draws attention
to the multiple dimensions of a company's performance and
de-emphasises the "bottom line" of the income statement. Other
early contributions on replacement cost accounting came from
Sprouse and Moonitz (1962), American Accounting Association (1966)
and Revsine (1973).
38
Because of the numerous measurement problems, Drake and Dopuch
(1965) and Prakash and Sunder (1979) argued against the potential
usefulness of replacement cost income. They argued that it involved
subjective judgments and unrealistic assumptions. However,
Chambers (1965) was Edwards and Bell's greatest critic.
Chambers asserted that replacement cost measures are irrelevant to
users. He stated that users make decisions in order to adapt
themselves to the environment, so they need to know their present
position in relation to the environment. He suggested that
replacement cost, or indeed any entry value, does not measure such
a position. Rather, current cash equivalent or any exit value is
what is relevant to users. Chambers presented a comprehensive
proposal for exit value accounting which is referred to as
"continuously contemporary accounting". Although Chambers is
regarded as the principal proponent of exit value accounting,
MacNeal (1929) is accredited as the orginator. Other writers of
the period who supported exit value accounting for financial
reports were Thomas (1969 and 1974) and Sterling (1979). Recently,
the 1CAS (1988) advocated net realisable valuation.
It is generally agreed among its advocates, that the exit values
used should be those assuming orderly rather than forced resource
realisations, and be based on market prices existing at the time
of measurement for the resources in their existing state (Lee,
1985, p. 91). The model is based on the economic concept of
39
opportunity cost. For practical purposes, the net realisable
value is usually commended as the most reasonable opportunity cost
to use. The approach maintains capital in terms of its generalised
command over goods and services (Lee, 1985, p. 101). Under this
approach, both realised and unrealised holding gains are included
in income as they both represent an increase in potential
purchasing power. Advocates of exit value accounting also
recommended adjusting exit values for general price level changes
(see Sterling, 1980).
However, exit value accounting did not go unchallenged, the main
attack coming from writers who support "deprival value" (value to
the business). The major criticism levelled against the approach
is that it implies liquidation rather than continuity of a business
entity (see Solomons 1966a and 1966b; Baxter 1967 and 1975; Largay
and Livingston 1976, p. 141).
In addition, insisting that value is determined by exchange,
Chambers (1966) defines an asset as the "severable means in the
possession of an entity" (p. 103). Critics of exit value
accounting find the stipulation of severability to be unduly
restrictive. Kam (1990, p. 475) commented that a company can
consider an asset to have value because of its use in the business
rather than its sale. He stated that its economic value is
determined by its scarcity and utility, not its exchangeability. In
40
this respect, specialised assets may have very little resale value,
but may be of considerable value in generating future cash flows if
used in the company.
Wright (1964), Solomons (1966a and 1966b), Stamp (1971) and Baxter
(1975) advocated using "value to the business". The approach uses
mixed values to measure the performance (income) and financial
position (capital) of an enterprise. Believing that assets are
normally held for either use or resale, an asset's value is the
lower of its replacement cost and the higher of its economic value
and net realisable value. The approach has been attacked by a
number of writers, e.g., Chambers (1971), Gray and Wells (1973),
and Whittington (1974), who suggested it is more suitable to entity
management than to investors and other external users of financial
reports. It is critised for its assumption of continuous entity
equilibrium and profitability (see Wanless, 1974). Furthermore,
the practical difficulties of deriving replacement values in an
advancing technological environment can result in major measurement
problems and tremendous reliance on subjective judgements (Ma,
1976).
Despite the objections to "value to the business" as a valuation
basis, it was this approach which pervailed in the CCA standards of
the UK and the US. The approach is described in greater detail
later in this chapter when the requirements of the UK Standard
(SSAP 16) on CCA are examined.
41
Apart from a normative approach to developing a system to account
for price level changes, accounting policy makers have made
numerous recommendations. The pronouncements of UK and US policy
makers are of interest to the present study as most of the studies
reviewed in Chapter 4 use data disclosed in accordance with these
pronouncements. A chronological review of the US and UK proposals
is presented in Appendices 2.A and 2.B respectively. This review
is confined to the period from the early 1970s to the late 1980s,
as the studies in Chapter 4 and the present study use inflation
accounting data released in this period. An examination of the
review shows that, in both countries, accounting policy makers
found it extremely difficult to develop a standard which met with
general acceptance. The efforts of the ASC were finally reflected
in SSAP 16. Its requirements are now examined as the present study
uses data derived from SSAP 16 disclosures in its valuation model
described in 7.3 (pp. 218-220).
2.8 SSAP 16
SSAP 16 was published in March 1980 on the basis that no material
changes would be made for at least 3 years. Its principal feature
was that companies coming within its scope were required to produce
CC accounts. This requirement applied for accounting periods
beginning on or after 1 January, 1980 until the mandatory status of
42
the Standard was removed in June, 1985. The objective of CCA was
"to provide more useful information than that available from historical cost accounts alone for the guidance of the management of the business, the shareholders and others on such matters as: (a) the financial viabilityof the business; (b) return on investment; (c) pricing policy, cost control and distribution decisions; and (d) gearing." (para. 5).
The standard applied to all financial reports intended to give a
true and fair view, unless the entity concerned was specifically
exempted. The entities exempted were:
companies which were not listed on the Stock Exchange
and which satisfied at least 2 of the following 3
criteria:
(i) turnover was less than £5,000,000 per annum,
(ii) the historical cost balance sheet total at the
beginning of the accounting period was less
than £2,500,000,
(iii) the average number of employees was less than
2 50;
wholly owned subsidiaries where the parent presents CC
accounts;
authorised insurers and property companies; and,
43
entities such as charities and building societies whose
long terra financial objective was other than to achieve
an operating profit.
Compliance with SSAP 16 could be achieved in one of the following
ways j
by presenting HC accounts as the main accounts with
supplementary CC accounts which were prominently
displayed;
by presenting CC accounts as the main accounts with
supplementary HC accounts; or,
by presenting CC accounts as the main accounts
accompanied by adequate HC information.
The principal feature of CCA as proposed by SSAP 16 was to maintain
the "net operating assets" of the business. SSAP 16 defined net
operating assets as fixed assets (including trade investments),
stock and monetary working capital. To maintain this operating
capability SSAP 16 required 3 adjustments to be made to the HC
operating profit as follows:
a depreciation adjustment in relation to fixed assets;
44
a cost of sales adjustment in relation to stock; and,
an adjustment based on the monetary working capital of
the company.
These adjustments represented the additional resources required to
meet the change in prices of resources consumed in the period. They
produced a measure of income which was derived by matching against
revenues the value of the assets consumed in generating those
revenues.
If the net operating assets were partly financed by external
borrowings, the Standard required a gearing adjustment to be made
to determine the CC income attributable to shareholders.
Assets and liabilities were to be included in the balance sheet at
their "value to the business". This term "value to the business"
was of fundamental importance to CCA. It is based on the concept
of "deprival value" first expounded by Bonbright ( 1937, p. 71).
He applied the principle in considering compensation for the loss
of property and stated that
"the value of a property to its owner is identical in amount with the adverse value of the entire loss, direct and indirect, that the owner might expect to suffer if he were deprived of the property." (p. 71).
45
Application of this valuation concept means that an asset is stated
at its net current replacement cost, or, if there is a permanent
diminution in the asset's value, at its recoverable amount. The
recoverable amount is the greater of the net realisable value of
the asset or the expected proceeds from future use. Simply
expressed, value to the company is the lowest cost avoided by
owning the asset.
All unrealised value to the business changes, and all income
statement provisions (in excess of the equivalent HC data, and net
of the gearing factor), were to be transferred to a CC reserve.
Thus, holding gains were to be excluded from income, as they
represented amounts which must be retained in the business.
Implementation of SSAP 16 valuation principles resulted in a
company retaining sufficient resources in the business to maintain
the shareholders' proportion of its operating capability. Thus, a
physical capital maintenance concept was followed by SSAP 16 which
supports an entity approach to income measurement and asset
valuation.
However, SSAP 16 has been severely criticised, the main criticisms
relating to the gearing and monetary working capital adjustments.
Edwards, Kay and Mayer (1987, p. 93) claimed that the combination
of the monetary working capital and gearing adjustments produced a
financial correction which was sensitive to the allocation of items
46
between the 2 components. Kennedy (1978) argued that the gearing
adjustment should reflect the debt financed proportion of total
holding gains (realised plus unrealised gains). However, SSAP 16
limited the gearing adjustment to the 3 CC operating adjustments on
the basis that this conforms with the fundamental accounting
concept of prudence (SSAP 16, para. 19).
Edwards, Kay and Mayer (1987, p. 90) regarded the exclusion of
unrealised holding gains from CC income as a major deficiency of
this income measure. They asserted that unrealised holding gains
represented actual economic phenomena which occurred in the period
and should be included in the accounts. In contrast, SSAP 16
considered these gains as amounts which must be retained within the
business if it was to maintain its operating capability. The
arguments concerning the treatment of holding gains are examined in
greater detail in 7.3.1 (pp. 220-226).
Tweedie and Whittington (1985) also criticised SSAP 16 for its
inconsistency in applying the gearing adjustment. Under SSAP 16 a
gearing adjustment was not required if a company had negative net
borrowings. Thus the fall in the real value of excess monetary
assets was not included in the measurement of income. Furthermore,
application of the gearing adjustment assumed that the proportion
of assets financed externally would remain the same. Lee (1985, p.
112) suggested that this may be an unreasonable assumption.
47
Although SSAP 16 was introduced by accounting policy makers to take
account of the effects of inflation, it ignored general price level
changes, as it only adjusted for the effects of specific price
changes. Edwards, Kay and Mayer (1987, p. 73) argued that to
measure income which is relevant for economic analysis, it is
necessary to combine the "value to the business" model with a
general index adjustment to capital which allows for the effects of
inflation. This would allow a company to preserve its operating
capability in real terms. On the other hand, Gynther (1974)
asserted that general price level restatement is meaningless, as
the resulting measures are difficult to comprehend and there is a
problem in selecting the appropriate index.
An additional problem associated with SSAP 16 disclosures was their
reliability. Many of the studies reviewed in Chapter 5 show that
the difficulties encountered in deriving SSAP 16 current value
measures led preparers and users to doubt their utility.
2.9 SUMMARY
This chapter identified the provision of decision useful
information to users as the major objective of financial reporting.
The qualitative characteristics likely to affect the utility of
financial reports were discussed and relevance and reliability were
identified as being of primary importance.
48
The users of financial reports include investors who require
information on a company's financial position and performance as a
basis for predicting the cash flows associated with their
investment. The ability of conventional accounting data to provide
this information was considered. In particular, the chapter
examined the limitations of HC data in periods of unstable prices.
The case for financial reports which incorporate adjustments for
price level changes was presented and a review of the relevant
literature showed that the debate yielded many proposals.
Accounting policy makers found it extremely difficult to develop a
generally accepted standard. Finally, the chapter examined SSAP
16, the major policy document issued by the UK policy making body
on inflation accounting.
The next chapter presents details of the share pricing mechanism
and identifies the determinants of share prices. It describes the
framework within which the utility of accounting data to investors
can be assessed.
49
CHAPTER 3
THE CAPITAL MARKET, SHARE PRICING AND ACCOUNTING DATA
CHAPTER 3
THE CAPITAL MARKET, SHARE PRICING AND ACCOUNTING DATA
3.1 INTRODUCTION
Chapter 2 established that the objective of financial reporting is
to provide decision relevant information to users of financial
reports. Investors have been identified as the primary users of
financial reports (see 1.2 p. 3). Attempts have been made to
assess the utility of accounting data in meeting their information
needs. This chapter focuses on 2 issues which impinge on that
assessment - developments in capital market theory and the
relationship between accounting data and share prices/returns. The
empirical evidence supporting a relationship between accounting
data and share prices/returns is also examined.
Particularly, this chapter:
describes the efficient market theory (3.2), the
evidence supporting market efficiency (3.3) and
explores the implications of market efficiency for
financial reports (3.4);
50
provides an insight to portfolio theory and the pricing
mechanism (3.5) and examines the market model (3.6) and
the capital asset pricing model (CAPM) (3.7);
explores the basis for the expectation of a link
between share prices/returns and accounting data in an
efficient capital market (3.8); and,
reviews the empirical evidence on the information
content (3.9) explanatory power (3.11 & 3.12) and
predictive ability (3.13) of accounting data, and
evaluates whether or not the relationship between share
returns and accounting data is mechanistic (3.10).
3.2 CAPITAL MARKET EFFICIENCY
The capital market describes the market in which securities are
traded. Its objective is to facilitate the transfer of funds
between investors and borrowers and to set the price at which
securities are exchanged. The efficiency of this process of
pricing is significant in ensuring an optimal allocation of scarce
capital resources (see Firth, 1986, p. 1). Fama (1970)
describes the capital market as being efficient when share prices
'fully reflect' all available information. This definition has
been operationalised to mean that all available information is
51
impounded in share prices immediately and in an unbiased manner
(Hendriksen, 1982, p. 89, Foster, 1986, p. 301). As Jensen
Watts and Zimmerman, 1986, p. 19). The categories are set out
below.
Weak Form Tests which test whether current prices fully reflect all
past prices so that it is impossible to develop superior security
trading rules based solely on a knowledge of past prices.
Semistronq Form Tests which test whether or not current prices
fully reflect all publicly available information and adjust rapidly
to new information so that no trading rules or strategies based on
such information will permit the earning of excess returns.
Strong Form Tests which test whether superior trading rules exist,
even for those having insider information.
3.3.1 Evidence of the Weak Form of the EMH
In general, weak form tests fall into 2 groups. The first group
examines the degree of statistical independence between share price
movements and movements in share price indices, while the second
53
group investigates the ability of mechanical trading strategies to
out perform random selection procedures. The main finding from
these studies is considered below. A detailed review is provided
by Henfrey, Albrecht and Richards (HAR) (1986, pp. 262-265), Keane
(1983, pp. 120-128) and Dyckman and Morse (1986, pp. 27-31).
Statistical Dependence Tests: These studies considered if the
dependence in successive price changes was sufficient to permit the
existence of consistently profitable trading rules. Studies in the
US (Schwartz and Whitcomb, 1977a and 1977b; Rosenburg and Rudd,
1982) and in the UK (Brealey, 1986, pp. 312-329; Kemp and Reid,
1971; Grimes and Benjamin, 1975) found some serial dependence in
share prices. However, other studies (Solnick, 1973; Rozeff and
Kinney, 1976) found that the possibility of earning abnormal
returns was eliminated when returns were adjusted for risk. (A more
detailed dicussion on risk is provided in 3.5, pp. 59-60).
Trading Rule Tests; These studies tested whether mechancial
investment strategies can earn abnormal returns. Amongst the
various investment strategies tested were filter rules, fixed
proportion maintenance strategies, moving averages and relative
strength tests. The majority of studies in the US and the UK (see
Jensen and Bennington, 1970; Dryden, 1970; Beaver and Landsman,
1981) found the strategies to be unprofitable. Indeed, many of the
strategies consistently performed below the market index,
54
especially when transaction costs and risk adjustments were
included in the analysis. Keane (1987), in a summary of this
research, offers the following observations:
"It should be said, however, that the statistical tests that have been carried out (fairly intensively since the 1950s) strongly support the view that the market is in fact efficient in the weak sense." (pp. 7-8).
3.3.2 Evidence of Semistrong Form Market Efficiency
Tests of the semistrong form of the efficient market hypothesis
(EMH) have studied the reaction of share prices to information
announcements. These tests are based on the premise that if the
market is semistrong efficient, the disclosure of economically
significant information which revises expectations should give rise
to a share price reaction. The EMH predicts that this reaction will
occur prior to or almost immediately after the public announcement.
As the investment community may learn of the information prior to
its public disclosure, the existence of a price reaction before
that date would not be unusual. A reaction on the announcement
date would be caused by information not anticipated by, or
previously disclosed to, market participants. However, if the
market is semistrong efficient, there should be an immediate
reaction following the announcement, thereby removing any
possibility for future abnormal returns (Dyckman and Morse, 1986,
p. 31) .
55
The studies reviewed by Keane (1983, pp. 128-153), HAR (1986, pp.
265-268), Dyckman and Morse (1986, pp. 31-39) suggest that the
market is semistrong efficient. Many of these studies used
accounting data in their testing and some of them are examined
later in this chapter.
3.3.3 Evidence of Strong Form Market Efficiency
A market is strong form efficient if both public and private
information are quickly impounded in share prices. This implies
that holders of private information cannot consistently earn
abnormal returns. A problem with testing this level of efficiency
is that private information, by its nature, is unobservable.
Indirect methods are used; for example, researchers examine
portfolio returns likely to reflect private information, such as
mutual funds and the returns earned by insiders. Another indirect
approach used is to examine returns and trading volume prior to
public announcements.
Tests in the UK and US on Mutual Fund and Pension Fund performance
have generally shown that such funds failed to make abnormal
returns (see Keane, 1983, pp.136-137; Dyckman and Morse, 1986, pp.
40-41; HAR, 1986, pp. 269-275; Rees, 1990, p. 242). However,
this may be due to their inability to obtain private information.
Tests in the US into whether "insiders" (defined by the SEC as
directors, managers and owners of not less than 10 per cent of the
56
shares of the company) can earn abnormal returns have shown that
insiders appear to have information that is not impounded in share
prices (see Dyckman and Morse, 1986, pp. 41-42).
The findings from studies by Morse (1980), Keown and Pinkerton
(1981) and Abdel-Khalk and Ajinkya (1982) into price and volume
changes prior to an information announcement suggest that the
market is not strong form efficient. As most of these studies are
American, the extent to which the findings can be applied to the UK
market is not clear. Therefore, further research work is needed to
determine the extent to which the UK market is strong form
efficient.
3.4 IMPLICATIONS OF MARKET EFFICIENCY FOR FINANCIAL REPORTS
A semistrong efficient market implies that all publicly available
data which captures value relevant factors is impounded in share
prices. As financial reports are part of the public information
set, this provides a setting within which their utility to the
securities market can be assessed. This assessment requires a
model which identifies the determinants of share prices in
equilibrium. The relevance of accounting data can then be inferred
by examining the relation between the accounting disclosures and
the determinants of share prices.
57
2 models which capture the determinants of share prices are the
market model and the capital asset pricing model (CAPM). Both
models are extensively used to investigate the information content
of accounting data. A brief description of these models is
presented in sections 3.6 (pp. 61) and 3.7 (pp. 62-64). For a
more detailed discussion, see Sharpe (1963, 1964). The models
originate from developments in portfolio theory which are now
considered.
3.5 PORTFOLIO THEORY AND THE PRICING MECHANISM
The origins of portfolio theory dates back to the eighteenth
century work of Bernoulli (1954) on the theory of risk. It was
first applied rigorously to the analysis of the investment decision
in the work of Tobin (1958) and Markowitz (1959).
The major decision facing an investor is whether to buy, hold or
sell shares in a company (ASB, 1991). To make that decision an
investor must estimate the value to himself of owning shares in the
company. That value is determined by the expected return and risk
associated with that investment (see Dickinson, 1986, p. 18;
Rutterford, 1985, p. 29). The return is calculated as follows;
58
R V. + D - Vn o
Vowhere
R return on the investment
Vo the value of the share holding at the beginning of the investment period
V,n the value of the share holding at the end of the investment period
D dividends received in the period
This calculation requires a value for the share holding at the
start and end of the investment period. Various approaches have
been used to estimate a share's value (see Foster, 1986, pp.
422-426; Davis, 1986, pp. 193-206). The most widely advocated
normative share valuation model involves discounting the expected
cash flows from the share holding to their present value, using a
rate of interest which is appropriate for the risk attaching to
that investment (see Arnold, 1984, p. 105).
The valuation process requires the estimation of cash flows and
their associated risk (i.e. their uncertainty). Portfolio theory
is particularly important in the estimation of risk.
The portfolio model of investment behaviour is based on a theory of
rational choice under uncertainty, i.e., the expected utility
hypothesis. This hypothesis, developed by Von Neumann and
Morgenstern (1944, ch. 3), implies that investors are risk averse
59
and prefer a greater return for a given level of risk or a lower
risk for a given level of return (Hendriksen, 1982, p. 94). This
implies that a rational investor will hold a portfolio of
securities, as diversification offers the opportunity for risk
reduction. Therefore, portfolio return and risk are the key
factors in valuation analysis (Hendriksen, 1982, p. 94).
A portfolio return is measured by the weighted average return of
the individual securities in the portfolio. The portfolio risk is
measured by the variance of the portfolio return. However, this
variance is not usually the weighted average of the variances of
the individual security returns. For large portfolios, the
portfolio risk is measured by the average of the covariances among
the securities in the portfolio, as a portion of the variance of
the individual security returns can be eliminated by
diversification. The risk which can be eliminated is referred to
as "unsystematic risk", while the undiversified component is
referred to as "systematic risk" (Dyckman and Morse, 1986, p. 13).
Application of the portfolio model was very cumbersome until it was
facilitated by advances in computer technology. Instead, the market
model developed by Markowitz (1952, 1959) and Sharpe (1963) was
used to estimate a share's return.
60
3.6 THE MARKET MODEL
Sharpe (1963), in recognising that securities are subject to common
influences, believed that the expected return on any security could
be expressed as a linear function of the expected return on the
market. In practice, past data on returns are used to derive the
following relationship:
R. = aL + B.Rm + eL
where
R^ is the return on security i,
R„ is the return on a market index,ma^ and B^ are the intercept and slope, and
is the error term
captures the impact of events which affect the return on all
securities in the market, while the term captures the impact of
events which affect only the return of the individual security. The
term e^ is also referred to as the abnormal return (Bromwich, 1992,
p. 210).
Although the market model is attractive in its simplicity in
explaining share returns, it has no theoretical foundation (see
Rutterford, 1985, p. 231). This led to the development of a
series of capital asset pricing models (see Sharpe, 1964; Lintner,
1965; Mossin, 1966).
61
3.7 THE CAPITAL ASSET PRICING MODEL (CAPM)
The capital asset pricing model (CAPM) is a theoretical model which
attempts to explain differences in rates of return across all
assets. It is based on several very restrictive assumptions.
(Details of these assumptions are given in Appendix 3.A, for a
discussion on the implications of relaxing the assumptions see
Dyckman and Morse, 1986, pp. 69-74). Foster (1986, pp. 337-338)
describes the original one period CAPM as follows:
E{Rl) = Rf + b l (E(Rm )-Rf)
where
.R is the return on security i
Rç is the return on the risk free asset
is the return on the market portfolio (i.e. return on all assets)
BL = Cov(RitRm )
Var(Am)
Cov(i?i,i?m ) is the covariance of the return on security
i with the return on the market portfolio
Var(R„) is the variance of the return on the market' m'portfolio
62
B is the systematic risk which cannot be eliminated by
diversification. It is worth noting that unsystematic risk does not
enter the pricing model as it can be eliminated by diversification
and is not compensated for in the market.
The multiperiod derivation of the CAPM "values an asset based on
its expected cash flows and the expected rate of return the market
requires for the risk of those cash flows" (Watts and Zimmerman,
1986, p. 29). Essentially, this means there is no contradiction
between the CAPM and the widely advocated normative share valuation
model discussed in 2.4 (pp. 24) and 3.5 (pp. 58).
A major problem in using the above CAPM in empirical work is
quantifying the return on the market portfolio. To overcome this
problem, stock market indices have been used as a surrogate for
the return on the market portfolio (Bromwich, 1992, p. 209).
Also, there is evidence which suggests that the CAPM may be
misspecified and the implications of this for studies which assess
the information content of accounting data are discussed in 6.2.3
(pp. 188-191).
Despite the foregoing difficulties, numerous empirical market based
accounting research studies have relied on the descriptive validity
of the market model or the CAPM. In particular, studies which
examine the information content of accounting numbers (these are
63
reviewed in 3.9, pp. 65-75). However, first consideration is
given as to why a relation between accounting data and share prices
can be expected.
3.8 SHARE PRICES AND ACCOUNTING DATA
The potential for accounting data to assist investors depends on
how well it conveys information on value relevant factors (cash
flows/return and risk). Chapter 2 (see 2.5.3, pp. 28-30) examined
the approach adopted by accountants to measure the value (financial
position/capital) and change in value (income) of a company. In an
efficient capital market, share prices and returns also reflect
value and changes in value. Therefore, it is not unreasonable to
expect some association between accounting data and share prices.
Rees (1990, p. 312) stated that even if shares are traded in an
efficient market, accounting data can act as a useful supplement to
capital market data in estimating return and risk. Firth (1977)
asserted that all knowledge relating to the value of a company
should be known if securities are to be accurately priced. This
requirement stems from market imperfections and the real world of
uncertainty.
64
Arnold (1984, p. 108) also argued that accounting data aids
investors by confirming their beliefs, or, by causing a revision
in these beliefs.
The remainder of this chapter focuses on those studies which
provide empirical confirmation of the utility of HCA data to the
investors. Studies of this nature are relevant to this study as
they provide empirical evidence on the validity of some theoretical
issues and indicate which accounting variables are important to
investors. A critical evaluation of the methodologies used in
these studies is presented in Chapter 6.
3.9 INFORMATION CONTENT STUDIES
The objective of these studies is to establish if accounting
disclosures are of sufficient economic importance to cause a market
reaction. Gonedes (1973) stated that this research is important to
accounting policy makers as
"the extent to which accounting numbers reflect information that is impounded in market prices serves as a means of empirically evaluating the information content of accounting numbers, (p. 407).
Beaver (1968a) defined information as a change in expectations
about the outcome of an event. Accounting data possesses
65
information content
"if it leads to a change in investors' assessment ofthe probability distribution of future returns (orprices), such that there is a change in equilibriumvalue of the current market price."
(Beaver, 1968a, p. 68)
Accounting data are also considered to be informative if "this
information helps individual investors select an optimal portfolio
of securities" (Beaver, 1974, p. 564).
Thus, accounting data convey information if they cause a share
price reaction or lead investors to alter their portfolio position.
Failure to find a market reaction suggests that the disclosure is
irrelevant and/or that it merely confirms market expectations. This
led researchers to select the behaviour of share prices as an
operational test of the information content of accounting data.
In share price reaction studies the information content of
accounting numbers is assessed by examining the link between the
accounting disclosures and abnormal rates of return. This
methodology requires a model to predict expected share returns.
Expected rates of return are typically determined using the market
model or the CAPM. The difference between the expected return and
the actual return is the abnormal (unexpected/excess) return.
66
An early study of the relationship between share prices and
accounting numbers is provided by Ball and Brown (1968) who
investigated the relation between the sign of unexpected earnings
changes and abnormal returns. They predicted that unexpected
increases in earnings are accompanied by positive abnormal returns
and unexpected decreases by negative abnormal returns.
They selected a sample of 261 New York Stock Exchange (NYSE)
companies over the period 1957-1965. An index model and a random
walk model were used to compute expected earnings. Then the
companies were classified as producing unexpectedly good or
unexpectedly bad earnings. An abnormal performance index was
derived for both groups of companies, over an 18 month period,
commencing 12 months before the earnings announcement and ending 6
months after the announcement. Findings showed that companies with
positive earnings changes had positive cumulative abnormal returns,
while negative earnings change companies had negative abnormal
returns and a statistically significant relationship between the
sign of unexpected earnings changes and the sign of the abnormal
returns was reported.
Ball and Brown observed that the market continually adjusted for
new information. They found that 85-90 per cent of the share price
change occurred before the month of the earnings announcement while
67
the remaining 10-15 per cent occurred in the month of the
announcement. This suggests that annual earnings releases are not
a timely source of information.
Brown and Kennelly (1972) and Foster (1977), using similar
methodologies to Ball and Brown, found that quarterly earnings
announcements contained information that led to share price
changes. Foster used several earnings expectation models to test
the sensitivity of the Ball and Brown methodology to model
specification errors. In addition, he used daily price data which
improved the sensitivity of the test procedure. His analysis
showed that the security market reacted to the size as well as the
sign of the earnings change.
Beaver, Clarke and Wright (1979) also found that the market reacted
to the sign and magnitude of the earning's change. Using
observations of annual earnings for 2 76 companies for the period
1965 to 1974, they formed 25 portfolios of companies/years based on
the magnitude of each observation's percentage unexpected earnings.
The mean annual abnormal return was calculated for each portfolio
for a 12 month period ending 3 months after the companies' fiscal
year. The results showed a significant relationship between the
magnitude of the unexpected annual earnings change and the annual
abnormal return, but the relationship was not one to one. Beaver,
Lambert and Ryan (1987) confirmed that prices move in the same
direction as earnings but not on a one to one basis.
68
Watts and Zimmerman (1986, p. 55) suggested several reasons for
the relation being less than one to one, namely that earnings
measure cash flows with error, that uncorrelated factors are
present, and that earnings are transitory in nature. Beaver (1989)
viewed the transitory nature of earnings as the most likely reason
and provided supporting evidence in the Beaver, Lambert and Morse
(1980) study.
Earlier, Beaver (1968a) developed 2 additional methods to examine
the information content of earnings - a price variability test and
a volume test. These tests do not require an earnings expectation
model. Beaver used the annual earnings of 143 US companies over
the period 1961-1965. In selecting his sample, he attempted to
control for the effects of non earnings factors on trading volume.
The price variability test is based on the premise that if
accounting earnings lead to changes in the equilibrium prices of
shares, then the variance of price changes should be greater in
periods when earnings are reported than in nonreport periods. The
price change variable used in the study was the residual e^t, from
a market model. Beaver observed that the magnitude of the price
change in the report week was 67 per cent higher than the average
during the nonreport weeks. The evidence also indicated that the
adjustment to earnings was rapid and that there was no abnormal
price variability in the weeks following the announcement.
69
Beaver's volume test showed that the trading volume was 33 per cent
higher in the week of announcement than during other periods and
that the effect was largely dissipated by the end of the
announcement week. This is consistent with investors using the
earnings information to adjust their portfolio positions. Lev and
Ohlson (1982) regard this as an indication of better risk sharing.
Beaver (1968a) highlighted the importance of the distinction
between the price test and the volume test claiming that
"the former reflects changes in the expectations of the market as a whole while the latter reflects changes in the expectations of individual investors." (p. 83).
Beaver stated that the volume test provides a good insight to the
extent to which investors hold heterogeneous expectations. However,
Verrecchia (1981) and Hakansson, Kunkel and Ohlson (1984) have
questioned the suitability of the volume test as a means of
measuring the degree of consensus among investors.
Commenting on Beaver's 1968 study, Chambers (1974) argued that his
results merely confirmed that the announcement of earnings causes a
market reaction, but it did not specifically prove that earnings
per se were the cause of this reaction. However, Foster (1973)
found that the market reacts to the information contained in the
announcement of earnings rather than to the announcement per se.
70
Beaver's methodology has been applied to earnings announcements of
companies listed on other stock exchanges in the US. May (1971)
applied it to the quarterly earnings announcements of American
Stock Exchange (ASE) companies over the period 1964-68. Hagerman
(1973) tested the earnings announcements of 97 bank shares listed
on the Over the Counter (OTC) market over the period 1961-1967.
Both studies found results similar to Beaver's. Morse (1981),
Patell and Wolfson (1979, 1981) applied the methodology to daily
return data and found evidence supporting the information content
of earnings.
Information content studies have been replicated in other
countries. Using the Ball and Brown methodology, Brown (1970)
monitored share price movements for Australian companies. His
results confirmed the importance of earnings for investment
decision making, and indicated that new information is quickly
discounted. In a UK study, Firth (1981) examined the information
content of interim and annual accounts. He concluded that these
reports conveyed substantial information to the security market. In
another UK study, Maingot (1984) found that
"the annual earnings numbers released by U.K. companies do possess information. However, while the maximum response did take place at Week O there did appear to be some anticipatory reaction in the week preceding [week - 1] the announcement week." (p. 57).
71
To date the studies examined have focused on earnings'
announcements. Further studies investigated the information content
of other accounting disclosures. Studies by Aharony and Itzhak
(1980), Asquith and Mullins (1983), Brickley, (1983), and Dielman
and Oppenheimer (1984) examined the behaviour of share prices when
dividends were announced. A significant positive association was
found to exist between share price movements and dividend
announcements. Also, earning forecast announcements have been
shown to convey information to the security market (Patell, 1976;
Waymire, 1984). Foster, Jenkins and Vickey (1986) examined the
information content of incremental information in financial
reports. The incremental information set included: segmental data;
replacement cost data; and details of accounting changes. Earnings
and dividends were excluded from the information set. The results
showed that the incremental information in financial reports did
not induce revisions in share prices.
As financial reports are not the only source of information
available to investors, researchers have examined the variation in
information content of annual earnings announcements. Grant (1980)
investigated the relative information content of annual earnings
announcements of NYSE and OTC companies. His results were
consistent with the view that the information content of earnings
announcements varies with the number of alterntive sources of
information. McNicholas and Manigold (1983) observed a reduction
in the relative information content of annual earnings
7 2
announcements following the 1962 requirement that ASE companies
report quarterly earnings. Jennings and Starks (1985) tested the
speed of the share price adjustment, and concluded that
"although we are able to distinguish between the price adjustment process of low and high information content news events, the difference in adjustment times was not extreme. . . . Even the high information content priceeffects dissipated in less then two trading days, on average. Thus it appears the market is able to adjust to even high information content news items in a reasonably timely manner." (p. 349).
Many of the early information content studies (e.g. Ball and
Brown, 1968; Beaver, 1968a) found that abnormal returns could not
be earned after the announcement. Subsequent studies by Jones and
Litzenberger (1970), Joy, Litzenberger & McEnally (1977), Watts (1978), Brown (1978), Latane and Jones (1979), Rendleman, Jones
and Latane (1982), and Foster, Olsen, and Shelvin (1984) reported
abnormal returns following annual or quarterly earnings
announcements. Initially, it was suggested (see Ball 1978, Foster,
Olsen and Shevlin, 1984; Bernard and Thomas, 1989) that these
studies suffered from methodological problems. In particular, misspecification of the pricing model, failure to control fully for
risk, absence of transactions costs were offered as explanations
for the post earnings announcement drift. However, Bernard and
Thomas (1990) suggested that research design flaws were unlikely to
account for the post earnings announcement drift. Instead,
evidence from studies by Freemen and Tse (1989) and Bernard and
Thomas (1989 and 1990) are consistent with share prices reflecting
73
naive earnings expectations. Bernard and Thomas (1989) also
observed that the delayed reaction to earnings was quite
significant.
In addition, DeBondt and Thaler (1985 & 1987) have reported
evidence which suggests that the market tends to over react to
corporate news. Studies by Basu (1983), and Jaffe, Keim and
Westerfield (1989) have also, found that smaller firms tend to earn
higher returns than larger firms with equivalent systematic risk.
Furthermore, Ou and Penman (1989) have shown that the nonearnings
information in financial reports can be used to construct forecasts
of future earnings which can be used as a basis for developing
trading rules which earn abnormal returns. The results from the
latter study suggests that, at least for the years covered by the
study, the NYSE was informationally inefficient to the nonearnings
information contained in the financial reports of US companies.
Brennan (1991) commented that the findings from the forementioned
studies, offers a severe challenge to market efficiency, however,
Ball (1990) cautioned that any conclusions on market efficiency
cannot be divorced from some assumed model of market equilibrium,
the correctness of which is not only unknown, but unknowable.
Despite this recent evidence challenging market efficiency, the
findings from the information content studies suggest a strong
association between accounting data and share price changes. It
74
has been argued throughout this study that underlying this
association is the notion that accounting data convey information
on cash flows in terms of their amount and/or risk. It is this
characteristic of accounting data which makes it relevant to the
securities market. This suggests that manipulation of reported
accounting data which have no cash flow consequences should not
cause a reaction in the securities market. The market's ability to
discriminate between real and cosmetic earnings changes has been
extensively researched. The next section reviews some of these
studies.
3.10 IS THE RELATIONSHIP BETWEEN SHARE RETURNS AND ACCOUNTING DATA
MECHANISTIC?
The question now being considered is whether the association
between accounting data (in particular earnings) and share prices,
as identified in the previous studies, is a mechanistic one. In
other words does the market react naively to a positive (negative)
reported earnings change with an upward (downward) revaluation of
the share price, or does it look at the economic aspects underlying
the reported earnings number? In discussing this topic Lev and
Ohlson (1982) state that
"the basic idea is straight forward: Rationalindividuals are not concerned with the 'packaging' of information, their beliefs about future states are unaffected by the form of disclosure. Hence, if there
75
are no effects on firms' cash flows, then it follows that market values should be unperturbed by firms' choices of (cross-sectional differences) or changes in (time-series differences) accounting techniques." (p.298) .
A mechanistic perspective has been advanced by some writers, e.g.,
Sterling (1970), who supports the Naive Investor Hypothesis (NIH).
This states that investors are conditioned to react to, say, an
accounting earnings number and may continue to react in the same
manner even if the measurement method underlying the earnings
number changes. Belief in the NIH is implicit in the actions and
statements of many company officials.
"In summary, the author's conclusions are that as a group the corporation managers responsible for the choice of financial accounting methods did indulge in a type of financial statement income manipulation whereby accounting changes were introduced in relatively unsuccessful years to boost financial statement income."
(Blain, 1970, p. 201)
Naive behaviour at the individual level does not necessarily imply
naive behaviour at the market level. The existence of a few
sophisticated investors who have access to large amounts of capital
may be sufficient to guarantee market efficiency. However, if the
NIH does occur at the market level, then cosmetic accounting
changes could cause share price changes.
76
While early research (Jensen, 1966; Greenball, 1968) was conducted
in the form of experimental and simulation studies, there is now a
considerable body of empirical research available (see O' Donnell,
1965; Archibald, 1972; Ball, 1972; Beaver and Dukes, 1973; Good
and Meyer, 1973; Sunder, 1973, 1975, Cassidy, 1976; Abdel-Khalik
and McKeown, 1978; Biddle and Lindahl, 1982). These studies show
that investors can distinguish between real and cosmetic accounting
policy changes. However, recent evidence casts some doubt on the
market's ability to adjust fully for the effects of accounting
policy changes (see e.g., Ricks, 1982; Hand, 1990; Harris and
Ohlson, 1990; and Tinic, 1990). So, the percise extent of the
market's ability to see through accounting policy changes is still
an open question.
For a proper understanding of the results from the forementioned
studies, the market's reaction to the accounting changes would have
to be predicted. This requires the development of a theory which
explains accounting practice variations. This would involve
establishing the motivation of individuals responsible for
selecting accounting policies. Any hidden but significant cash
flow consequences associated with the accounting change would have
to be uncovered, e.g., the effect of the accounting change on
borrowing costs, management compensation costs and political costs.
This area of research is strongly supported by Watts and Zimmerman
(1986) but it is still in the early stages of development.
77
So far the studies reviewed have relied on accounting data
conveying information about the amount of cash flows as the basis
for their utility in determining share prices. The earlier
discussion on share pricing also identified risk (uncertainity of
future cash flows) as central to the share pricing process. This
led researchers to investigate the relation between accounting data
and risk. These studies are considered next.
3.11 ACCOUNTING DATA AND SYSTEMATIC RISK
Earlier, in the discussion on portfolio theory, systematic risk
(beta, i.e., B) was identified as the appropriate risk measure in
the return equilibrium process. In this context Beaver (1972)
describes the importance of accounting data as being
"its predictive ability with respect to B (systematic risk coefficient). Hence B analysis becomes extremely important as a research method if one wishes to assess the value of accounting information to the individual investor (p. 24).
The earliest published study which examined the association between
accounting data and beta was by Ball and Brown (1969). Using a
sample of 261 companies over the period 1946-1966, they computed an
estimate of beta for each company based on share price data and an
78
analogous beta measure based on 3 different definitions of
accounting earnings. The analysis showed that the accounting betas
were highly correlated with the market beta estimates.
An influential study by Beaver, Kettler and Scholes (BKS) (1970) extended the Ball and Brown study by examining the associations
between 7 accounting risk measures and the market beta. The
analysis used data from 307 NYSE companies over 2 periods:
1947-1956 and 1957-1965. The accounting based risk measures
considered in the study were: liquidity, asset size, asset growth,
leverage, dividend payout, earnings variability, and accounting
beta.
Correlations were derived between each of the 7 accounting
variables and the market beta for each company and for portfolios
of 5 companies for the 2 sample periods.
The signs of all the correlation coefficients were in the predicted
direction with the exception of the liquidity measure in period 2.
The correlation coefficients for leverage, dividend payout,
earnings variability and accounting beta were significant in both
periods at the 99% confidence level. In addition, the correlation
coefficients for the 5 security portfolios were larger than those
79
for individual securities. BKS concluded that
" accounting data do reflect the underlying events that determine differential riskiness among securities in the market prices of securities." (p. 679).
The second part of the BKS study examined the ability of accounting
risk measures to predict the market beta. The researchers found
that
"accounting data provided superior forecasts of the market determined risk measure for the time periods studied." (p. 681).
BKS's results were challenged by Gonedes (1973). Using a sample of
99 companies, Gonedes found a statistically significant
relationship between market based and accounting based beta values
when the accounting income numbers were transformed into first
differences. Accounting beta values based upon untransformed
accounting income data were not significantly associated with
market beta values. This finding is inconsistent with the results
obtained by BKS. Gonedes suggested that the inconsistency could be
due to differences in the scaling methods used for the accounting
income numbers. BKS used share prices as the scaling factor, while
Gonedes used total assets, and so developed a pure accounting
variable. This led Gonedes to posit that BKS's results might be
spurious as both the market and accounting beta values incorporated
share price data.
80
In trying to resolve the controversy, Beaver and Manegold (1975)
used 3 scaling factors to construct accounting betas: share
prices; the book value of equity; and total assets. They found
that while accounting betas based on the BKS definition tended to
be more highly correlated with contemporaneous market betas than
pure accounting betas, the latter betas were also significantly
correlated with market betas.
Other studies by Hamada (1969, 1972), Lev (1974), Thompson (1976),
Bildersee (1975), Eskew (1979), Rosenberg and Me Kibben (1973),
Rosenberg and Guy (1976a, 1976b),and Hill and Stone (1980) have
confirmed an association between accounting data and systematic
risk and the superiority of models based on accounting variables in
forecasting the market risk. However, Elgers (1980) found that
after controlling for measurement errors in estimated ordinary
least squares (OLS) market beta's using Bayesian statistical
techniques, accounting variables did not produce more accurate
estimates of the market beta.
Furthermore, using data on 25 UK companies, Capstaff (1991) found
no evidence of a relationship between accounting risk measures and
the market beta. Instead, he found that both the market beta and
accounting risk measures were used to derive analysts' risk
perceptions. He suggested that this implied that analysts use
accounting data for information on company specific elements of
risk and use the information in ex-post market betas in their
81
assessments of the market based elements of risk. However,
Capstaff recommended that, before firm conclusions are made with
respect to the relationship between the market beta and accounting
risk measures in the UK market, further analysis is needed using a
larger sample of companies.
It is apparent from the weight of evidence in the forementioned
studies that accounting variables are associated with the
market based risk measure. This association was found to exist for
a broad range of accounting risk measures as well as for different
methods of defining such measures.
To date the informativeness of accounting data has been assessed by
examining the relation between one accounting variable and share
prices/returns and trading volumes. The next section examines
multivariate studies which provide evidence on the significance of
accounting numbers in explaining share prices/returns.
3.12 EXPLANATORY POWER OF ACCOUNTING DATA
Multivariate studies have attempted to model the investor's
decision making process. The objective of these studies was to
develop a share valuation model which could be used to identify
over and under valued shares. Chapter 6 (see 6.3, pp. 191-199)
discusses in detail the merits and limitations of this approach and
82
its relevance to the present study. The aim of this review is to
examine the findings from these studies as they indicate which
accounting numbers are relevant in explaining share prices/returns.
The review begins by looking at those studies which used accounting
data to explain share price movements (returns). Studies using
accounting data to explain relative share prices are then
as a function of dividends, earnings, market conditions and
accounting numbers such as sales and net income. He found very
little, if any, relationship between the share returns and the
independent accounting variables and concluded that
"the information contained in published accounting reports is a relatively small portion of the information used by investors." (p. 28).
Benston's results may have been affected by methodological problems
as he used lagged variables in his models. However, Ball and Brown
(1968) showed that share prices are continually moving to take
account of new information.
83
O'Connor (1973) used financial ratios as the independent variables
to test the relationship between accounting data and share returns.
The study covered the period from 1950-1966, with financial ratios
for 127 companies being used as the explanatory variables. The
dependent variables were the share returns for holding periods of
1, 3, and 5 years. Univariate and multivariate approaches were
used to investigate the explanatory power of the accounting
variables. The univariate analysis revealed that ratios used
singly were not effective in differentiating between high and low
return shares. The multivariate models explained between .08 and
.3 of the variance. O'Connor concluded that "explanatory variables
have some ability to explain the variation in the explained
variable." (p. 348).
He also tested the predictive ability of his models and found that
they performed no better than a naive investment strategy. This led
O'Connor to doubt the utility of financial ratios to investors for
predicting future returns. Again, the poor results may have been
caused by methodological problems. His tests might have yielded
more meaningful results if changes in the ratio values had been
used rather than the absolute values themselves.
Gonedes' (1974) study used multiple discriminant analysis to test
if financial accounting ratios could discriminate between companies
with positive and negative abnormal returns. Estimated accounting
84
ratios were used as discriminatory variables and the results showed
that the multivariate model appeared to have weak discriminatory
power.
Further analysis revealed that the power of the multivariate model
over the univariate model in generating abnormal returns was minimal. However, Gonedes noted that his results were conditional
upon the models and estimation procedures used.
In a recent US study, Easton and Harris (1991), used univariate and
multivariate models and showed that the current earnings levels
variable and the earnings change variable were significant in
explaining share returns. They observed that for the period
1969-1986, for the pooled sample and for several individual years,
the multivariate model explained significantly more of the
variation in the returns, suggesting a role for both variables in
share valuation. However, the overall explanatory power of the2individual models was relatively low, R ranged from .008 to .231
for the multivariate models.
The above studies provide very little support for the explanatory
power of accounting data in relation to share returns. The studies
which follow examine the association between accounting variables
and relative share prices.
85
3.12.2 Explaining Share Prices
Attempts to construct share valuation models date back to the early
part of this century. Meader (1935) formulated a regression model
to explain share prices where the independent variables were stock
turnover, book value per share, net working capital per share,
earnings per share and dividends per share. Although the study was
replicated by Meader (1940) in 1940, the results from both studies
were disappointing. The models' explanatory power were weak and
parameter estimates were unstable over time, the main problem being
that the variables were not adjusted for the size of the company.
To overcome this problem most researchers deflate the share price
into a measure of relative valuation. The most commonly used
measures are the price earnings ratio (P/E) or its reciprocal, the
earnings yield.
Walter (1959) used linear discriminant analysis to identify which
accounting measures could discriminate between high and low
earnings yield companies. 2 samples were selected from the largest
500 industrial companies in the US: 50 companies with the highest
earnings yields and 50 companies with the lowest earnings yields.
Discriminating variables were: average dividend payout; change in
the return on investment; average current ratio; change in sales;
average interest cover; and the market beta.
86
The analysis showed that dividend payout and beta were the only
significant explanatory variables. The model was applied to the
original data and it correctly classified 87% of the companies into
their original groups. When the model was used to classify a
further 60 companies its accuracy fell to 80%. Eisenbris (1977)
and Altman (1981) have questioned the suitability of multiple
discriminant analysis for this type of study. Furthermore,
Walter's use of 5 year averages may have diluted any differences
which may have existed between the 2 groups. However, his results
do suggest that dividends and systematic risk are significant
factors in determining share prices. Gonedes (1974) confirmed the
importance of dividends in share valuation models.
Benishay (1961) formulated a model to examine the determinants of
the differences in rates of return of corporate equities. The rate
of return was hypothesised to be a function of 7 variables - the
earnings trend, the share price trend, the payout ratio, the
expected stability of future income streams, the expected share
price stability, company size, and the debt/equity ratio. Average
values of the independent variables were used in the analysis. The
cross sectional regression results revealed company size, share
price stability, and earnings stability as the most significant
variables. However, the use of averages may have diluted any
possible relationship between the dependent and the independent
variables. This may explain why the dividend variable was found to
be an insignificant explanatory variable.
87
Whitbeck and Kisor (1963) used forecasted data in their valuation
model. The P/E ratio was regressed on expected growth in earnings,
the expected dividend payout ratio and the expected standard
deviation of earnings about a trend line. The model was developed
using data for 135 US companies. The model's ability to identify
over and under valued shares was tested on 4 different dates. They
found that shares whose actual P/E ratio was below 85 per cent of
the estimated P/E ratio outperformed the market and that shares
whose actual P/E ratio was greater than 115 per cent of the
estimated P/E ratio underperformed the market. The extent of this
abnormal performance was weak as it ranged from only 1% to 12% over
the period covered. Malkiel and Craig (1970) performed further
tests on the Whitbeck and Kisor model. They tested the cross2sectional explanatory power of the model and found R s ranging
between .7 and .85. But the coefficients of the model,
particularly the earnings per share growth variable, were unstable
over time. The temporal instability in the relationship between
share prices and earnings is a major stumbling block in the
construction of share valuation models (see Keenan, 1970, Lev,
1989).
Another study using forecasted data was undertaken by Ahlers
(1966). The independent variables were: estimated earnings growth;
dividend yield; and earnings variability. The model was derived
88
using quarterly data for a small sample of 24 companies. Although
Ahlers claimed that his model was able to outperform the market by
a substantial amount, supporting evidence was not given.
Focusing on the electric utilities industry, Miller and Modigilani
(1966) constructed a share valuation model for the years 1954, 1956
and 1957. They regressed market value of the companies on the
latest earnings figure and average total asset growth rates. The2R s associated with the models ranged between .56 and .77. The
earnings coefficient was highly significant and reasonably stable
over time.
In a UK study, Weaver and Hall (1967) developed a share valuation
model which was subsequently reported to be in active use by their
employers. They selected the dividend yield as the dependent
variable. The independent variables were: the dividend payout
ratio; forecasted short term earnings growth; the forecasted long
term dividend growth; earnings variability; and the historical
earnings growth rate. The model explained 58.7 per cent of the
variance in the dividend yield and outperformed a simple buy and
hold policy when used to make investment decisions. The dividend
payout ratio was identified as the most relevant explanatory
variable. However, in selecting the dividend yield as the
dependent variable the analysis could have been biased in favour of
the dividend payout ratio.
89
Martin (1971) developed a model to explain relative earnings yield
using current and lagged independent variables selected on the
basis of the results of a questionnaire sent to Chartered Financial
Analysts. The explanatory variables included: rate of growth in
earnings plus depreciation; capital expenditure to sales; a measure of sales stability; dividend payout ratio; total assets; income
plus depreciation to debt; operating income to sales; and net
income to book equity. The tests were carried out on 98 companies
from 4 different industries. The analysis confirmed that published
financial statements convey decision relevant data for equity
investment decisions. Specifically, the historical earnings growth
rate, the operating margin, and book return on capital were
identified as significant variables.
Beaver and Morse (1978) regressed earnings price (E/P) ratios
against systematic risk and 3 earnings growth measures. These
explanatory variables accounted for approximately 50 per cent of
the cross sectional variation in E/P ratios over the period 1956 to
1970.
With the exception of the Weaver and Hall (1967) study, the studies
so far have concentrated on the P/E ratio or its reciporcal as the
relative measure of market valuation. This may cause a spurious
relationship between the dependent variable and the independent
earnings variable. Dopuch (1971) considered this problem in his
90
review of Martin's (1971) study and commented that
"I am not as confident as Martin that this study demonstrates the utility of accounting information ... since his empirical model uses the accounting variable (smoothed earnings) on both sides of the regression equation, he ends up testing the relationship of accounting data to both stock prices and accounting data." (p. 38).
In response to Dopuch, Martin referred to Kuh and Meyer (1955) who
claimed that the question of spurious correlation "does not arise
when the hypothesis to be tested has initially been formulated in
terms of ratios." (p. 407).
To test the sensitivity of the valuation model to spurious
correlation Tisshaw (1982) used 2 measures of relative stock market
valuation, the earnings yield and the valuation ratio. The latter
was defined as follows:
Book Value of Equity
Valuation Ratio = _______________________
Market Value of Equity
The analysis was applied to a sample of 547 UK companies for the
period 1st August 1976 to 31 July 1977. 3 analytical techniques
were employed - Multiple Regression Analysis (MRA); Linear
Discriminant Analysis (LDA); and Automatic Interaction Detector
(AID).
91
The analysis revealed a statistically significant relationship
between accounting information and share prices which was stronger
when the valuation ratio was used as the dependent variable. This
result was independent of the methodology employed. The accounting
numbers identified as being significant were: earnings; the
dividend payout ratio; the marketability of the shares; and short
term liquidity. A surprising omission was the absence of any
measure of risk in any of the models.
The previous review has demonstrated that accounting information is
impounded in share prices. In particular, earnings, earnings
growth, dividends and a measure of risk were identified as
significant explanatory variables.
3.13 PREDICTIVE ABILITY OF ACCOUNTING NUMBERS
This final section reviews research studies which examined the
utility of accounting data in predicting corporate failures.
Although these studies are not capital market studies, they are
relevant to the present study because they provide evidence on the
utility of accounting data in measuring corporate health, a factor
of major importance in determining a company's value.
92
The objective of empirical research on corporate failure was to
compare the financial ratios of failed companies with those of
nonfailed companies in order to detect systematic differences which
might assist in predicting failure.
The first main study to focus on the predictive abilities of
accounting ratios was by Beaver (1966). He computed 30
conventional ratios for 79 failed and 79 nonfailed companies. His
findings showed that the failing companies had poorer ratios than
the successful companies and that the warning signs were evident 5
years prior to actual failure. On subsequent application of his
model he found that it was 90 per cent accurate in classifying
companies. However, this analysis was an ex-post discrimination and
not a prediction of corporate failure.
Beaver (1968b) and Aharony, Jones and Swary (1980) compared the
predictive power of accounting ratios with that of share prices.
Both studies observed very little difference in the predictive
ability of the ratios and the share prices. The evidence indicated
that the market was revising downward its performance expectations
for bankrupt companies 5 years before bankruptcy.
Altman (1968) used multiple discriminant analysis to distinguish
between failed and nonfailed companies in the period 1946 to 1965.
His final model comprised 5 ratios: working capital/total assets;
retained earnings/total assets; earnings before interest and
93
taxes/total assets; market value of equity/book value of debt; and
sales/total assets. The model correctly classified 96 per cent of
the sample companies into their respective groups but it proved
unreliable when applied to earlier data. Also, the small sample
size casts doubts on the general application of the model.
Taffler (1976) also used a multivariate approach to derive a
bankruptcy prediction model for UK companies. Since the
development of his original model Taffler (1983a and 1983b) has
developed a second model which is reported to have undergone a
considerable amount of testing and general assesment in several
practical situations. The key variables identified by the model
measured profitability, working capital position, financial risk
and liquidity. The model was 98 per cent accurate in categorising
all quoted industrial companies that failed since 1976 at least 1
year prior to failure.
In a more recent study El Hennaway and Morris (1983)(described in Taffler, 1984) tested if the predictive ability of the models could
be improved by the inclusion of general economic and industry
indicators in the model. A number of models were derived and they
all highlighted the significance of the profitability ratio.
Industry membership was also identified as a significant factor.
94
Watts and Zimmerman (1986) identified one major problem common to
the above prediction studies, i.e., the ad hoc selection of
independent variables. They commented that
"there isn't an underlying theory of accounting ratios' magnitudes prior to bankruptcy. Hence, the selection of variables depends on the researcher's intuition and, more often than not the availability of the data." (p.117) .
Despite this problem, the previous empirical evidence suggests
that, for a period of at least 5 years prior to failure, the
financial ratios of failed companies are significantly different
from those of nonfailed companies. This finding supports the claim
that financial ratios, and profitability ratios in particular,
are useful in measuring the financial health of a company.
3.14 SUMMARY
This chapter reviewed developments in capital market theory which
provide the foundation for empirically based market research
studies in accounting. A description of the share pricing mechanism
was given and return (cash flows) and risk were identified as the
fundamental determinants of a share's value. 2 models which capture
these factors - market model and the capital asset pricing model
were described.
95
The basis for the expectation of a link between share
prices/returns and accounting data in an efficient capital market
was explained. Studies which used the market model or CAPM to test
the information content of accounting data by detecting a price and
volume reaction to this data were reviewed. The review revealed
that generally, the market response to this data is rapid and
unbiased. Studies which investigated whether or not the market is
misled by accounting policy changes were also reviewed. The
evidence from these studies suggest, that although the precise
extent of the markets ability to see through accounting changes is
in question, it appears that the market does not passively accept
published accounting data. Other studies showed that accounting
numbers are highly associated with and useful in predicting a share's systematic risk.
Studies which evaluated the explanatory power of accounting data
identified certain accounting variables, especially earnings and
dividends, as being significant in explaining share
returns/prices. Accounting ratios were also found to be useful in
measuring the financial health of a company.
The studies reviewed in this Chapter focused on the utility of HCA
data to the capital market. However, in high inflation periods the
limitations of HCA measures (see 2.6, pp. 33-34) may diminish the
utility of this information. Adjusting financial reports to take
account of the affects of inflation may give a more meaningful
96
measure of a company's performance and financial position. The
extent to which this is true can be empirically assessed by examining the capital market's response to inflation accounting
data. The next chapter reviews those studies which undertook this
empirical investigation.
97
CHAPTER 4
LITERATURE REVIEW OF THE RELEVANCE OF INFLATION ACCOUNTING
DATA TO THE SECURITIES MARKET
CHAPTER 4
LITERATURE REVIEW OF THE RELEVANCE OF INFLATION ACCOUNTING DATA TO
THE SECURITIES MARKET
4.1 INTRODUCTION
In periods of high inflation, the utility of financial reports
prepared under the HC convention is seriously impaired (see 2.6,
pp. 33-34). Therefore, to improve the utility of financial
reports, companies began disclosing inflation accounting data.
This chapter presents the findings from empirical studies which
assessed the utility of these disclosures to the securities market.
(While a number of methodological issues are raised in this
discussion, a general appraisal of the methodologies used is
deferred to Chapter 6.) The studies reviewed are classified intot
the following 4 groups:
studies which tested the information content of
inflation accounting data (4.2);
studies which examined the association between
inflation accounting risk measures and systematic risk
(4.3);
98
studies which evaluated the explanatory power of
inflation accounting data in relation to share prices/returns (4.4); and,
studies which investigated the predictive ability of
inflation accounting data (4.5).
4.2 INFORMATION CONTENT STUDIES
4.2.1 Introduction
The review in 3.9 (pp. 65-75) illustrated that accounting data
possesses information content if it causes a market reaction. The
latter was identified as including, a price reaction and/or an
increase in the volume of trading. This approach has been used to
assess the information content of inflation accounting data.
Whereas the relevant studies had a shared focus, in terms of their
ultimate aim, there was considerable variation in the approaches
adopted, making it difficult to review this research in an
aggregate manner. Therefore, an overview of some of the major
studies now follows.
99
4.2.2 Arbel and Jaggi (1978)
In a US study, Arbel and Jaggi (1978) tested the information
content of replacement cost disclosures. They formed 2 portfolios
consisting of 99 reporting companies and 81 nonreporting companies.
Using daily return data for a 21 day period beginning 10 trading days prior to disclosure, the cross sectional average residual for
each day and the cumulative abnormal return (CAR) for each
portfolio was computed. The average residuals for the reporting
companies and nonreporting companies were examined and no
significant difference in the residual distributions around the
announcement date was found. This may be explained by some
companies being unfavourably affected by the disclosures while
others were favourably affected. However, their analysis revealed
that the CAR for the nonreporting companies was slightly larger
than the CAR for the reporting companies, but no statistical test
was performed to determine the significance of the difference.
The daily residuals of each company were then compared to their
standard expected residuals. Using binomial and nonparametric
tests, any differences in this statistic between the reporting and
non reporting companies was investigated. The evidence showed that
the abnormal returns of reporting companies were not significantly
different from the abnormal returns of the nonreporting companies.
100
To determine if there was a relationship between the magnitude of
the replacement cost disclosures and investors' reactions, the
reporting companies were partitioned into 5 subgroups on the basis
of the difference between HC net income and replacement cost net
income. The residual analyses were performed for each subgroup,
but no significant differences were found. Finally, when the
correlation between the cumulative return for each share and the replacement cost income adjustments was computed, the test showed
an insignificant relationship.
Based on their analysis, Arbel and Jaggi concluded that replacement
cost information does not induce investors to revise their
expectations. They suggested that the lack of an observed reaction
could be explained by the information being already impounded in
share prices, the existence of a learning lag, or the unreliability
of the replacement cost data.
4.2.3 Beaver, Christie and Griffin (1980)
Beaver, Christie and Griffin (BCG) (1980) who focused on 3
important announcement dates (the ASR 190 proposal date, the ASR
190 adoption date and the 10-K release date), investigated the
information content of ASR 190 data. In their first test, their
sample of reporting companies were partitioned into 8 equal beta
portfolios. Portfolio returns were computed, and each portfolio
was paired so as to maximise the difference between the HC and the
101
replacement cost data. Using Hotellings T statistic, they found no
statistical differences in the portfolio returns for the period
surrounding the 3 dates nor for the cumulative period.
To test the sensitivity of the results to the matching procedure
the tests were replicated using the difference between the actual
replacement cost adjustments and Value Line estimates of these
adjustments as the basis for pairing. Using a Hotelling T test no
significant differences in returns were found. Then a t test was
used to compare the returns of reporting and nonreporting
companies, which revealed no significant differences in the
returns.
Finally, BCG compared the price volatility of the share returns in
the weeks surrounding the announcement dates with the price
volatility in nonreport periods for both reporting and nonreporting
companies. The analysis revealed no significant differences in the
volatility ratio for either group.
When analysing their results, BCG questioned the validity of
their matching procedure which they believed may have been
inappropriate given the size differences between reporting and
nonreporting companies (see 6.2.2, pp. 183-185 for a discussion of
the size effect). They also suggested that it was impossible to
determine whether the lack of significance was due to the ASR 190
disclosures or the Value Line data. Furthermore, the length of
102
the test periods used may have prevented the detection of an impact
to the replacement cost data as the 31 day period may have been too
short and the 480 day period too long. In a study reviewed later,
Lustgarten (1982) illustrated that a reaction to replacement cost
disclosures occurred over a 10 month period.
4.2.4 Gheyara and Boatsman (1980)
Gheyara and Boatsman (1980) used a variety of methodologies to
assess the information content of ASR 190 data. Using the market
model the abnormal return for each day of a 50 day period (-30 to
+19) surrounding the announcement date was computed for 106
reporting companies and 83 nonreporting companies. The residual
was then squared and deflated by the residual's variance in the
nonreport period. The resulting deflated residuals were then
averaged across the 2 samples of companies. In the absence of
abnormal returns, the expectation of the resulting statistic is
approximately unity. Using graphic analysis, they found no
evidence supporting the information content of replacement cost
disclosures. In a later US study, Soroosh Joo (1982) used this
approach to test the information content of CC and constant dollar
data. As in the Gheyara and Boatsman study, he failed to detect a
market reaction to either set of disclosures.
103
Gheyara and Boatman also used a matched pair design approach to
test for differences in the returns of reporting and nonreporting
companies which were matched on the basis of their systematic risk.
The analysis was performed over periods of 5, 30, 40 and 50 days
around the 10-K release date. No significant differences in
returns were detected for any of the periods.
In a final test, Gheyara and Boatsman partitioned the reporting
companies into high and low holding gain groups. They calculated
the abnormal return associated with a trading strategy of buying
the high gain companies and selling short the low gain companies
for each day of the 19 day period covering the announcements. The
average abnormal return was then computed and, based on a t test no
evidence of a significant abnormal return was found.
The consistency of the above results, across a variety of testing
procedures, suggests that replacement cost disclosures do not
provide information to the securities market. However, Gheyara and
Boatsman commented that their study suffered from methodological
problems, in particular their use of historical costs to generate
expectations and the comparison of reporting and nonreporting
companies without controlling for possible size effects.
104
4.2.5 Grossman, Kratchman and Welker (1980)
Using weekly return data, Grossman, Kratchman and Welker (GKW)
(1980) assessed the information content of replacement cost
disclosures for the years 1976 and 1977. They partitioned a sample
of 72 reporting companies into 2 groups, using the unexpected
replacement cost income adjustment divided by sales as the
partitioning variable. Companies with a large value of this
variable were placed in group A, while companies with a small value
were placed in group B. The cumulative average weekly abnormal
returns of the two groups for a period of -13 to +26 weeks either
side of the company's 10-K release date were then compared using
graphic analysis. The comparision revealed no significant
differences in 1976, but large differences were found in 1977.
Despite the lack of explicit statistical tests, this study
presented evidence which appears to support the information content
of replacement cost disclosures. However, GKW suggested that their
results may have been biased because of the assumptions used to
partition the companies. Their results are also suspect, as the
CAR experienced by group B persisted for several weeks after the disclosure date.
105
4.2.6 Friedman, Buchman and Melicher (1980)
A study by Friedman, Buchman and Melicher (FBM) (1980) also found
evidence of a reaction to replacement cost disclosures. FBM
examined the relationship between abnormal weekly returns and
unexpected replacement cost earnings over the period October 1976
to July 1977. The sample of 54 companies was divided into 3
portfolios. 39 of the companies that had positive unexpected HC
earnings were split into portfolios 1 and 2 using the variable:
%CH — Replacement cost adjustment HC income
Portfolio 1 contained the companies with higher than average values
of %CH and portfolio 2 contained the companies with lower than
average values. Portfolio 3 contained 15 companies with negative
unexpected HC earnings.
An examination of the CAR indicated a market reaction to the
replacement cost disclosures for the companies in portfolios 1 and
2. The analysis also revealed that portfolio 1 had significantly
larger abnormal returns than portfolio 2. Given the small sample
size, these finding must be considered highly tentative.
106
4.2.7 Ro (1980)
Ro (1980, 1981), in 2 separate studies, investigated the
information content of replacement cost data and the effect of
compliance costs on the securities market. In his first study, he
used a matched pair design approach to test for the effect of
compliance costs on share returns. A sample of 83 reporting
companies was matched with 83 nonreporting companies on the basis
of: their market beta; the sign of their HC earnings per share
change between 1975 and 197 6; the week of release of their 10-K
reports; and industry membership.
Ro identified 8 events (see Appendix 4.A) which served as signals
for revaluing the companies affected by ASR 190. The effect of
compliance costs was investigated by comparing the returns of the
reporting and nonreporting companies at each event date. Using a t
test, Ro found no evidence that ASR 190 imposed significant
compliance costs on the companies.
To test for the information content of the replacement cost data,
Ro classified 78 of his paired companies into 2 subgroups using the
sign of their unexpected replacement cost earnings per share
(EPSrc) variable. He derived the average return difference between
the good news (+EPSrc) and bad news (-EPSrc) pairs for the 26 weeks
surrounding the ASR 190 events. Using a t test, he found a
statistically significant difference in returns at the 10 per cent
107
level. However, Ro was unable to determine if this return
difference was due to unexpected RC data or unexpected HC data. To
explore this issue he repeated his test using a 52 week and a 10
week test period. The results for both these tests showed an
insignificant t value at the 10 per cent level.
4.2.8 Ro (1981)
In his second study, Ro (1981) investigated whether weekly trading
volume changed as a result of the release of replacement cost data.
To identify a trading reaction reporting companies were matched
with nonreporting companies using the same criteria as in Ro's 1980
study and the additional criterion of a share's volume beta. This
yielded 73 pairs of companies.
The reporting and nonreporting companies were also separated into 2
subgroups (High and Low) using the following classification
variables: volume beta, price beta, and 5 ratios based on
historical and replacement cost data. Ro identified 9 events (see
Appendix 4.A) associated with the implementation of the disclosure
of replacement cost data and each event week was selected as a test
period. Using a paired t test, Ro compared the cross sectional
average weekly transaction volume of the nonreporting companies
with those of reporting companies. The tests were performed on the
73 pairs of firms and repeated for each of the subgroups.
108
A significant reaction was observed for the week in which ASR 203
was announced which Ro argued should be ignored as it was in the
wrong direction. He found that the transaction volume was higher
for the nonreporting companies than for the reporting companies.
However, this may have been caused by investors in nonreporting
companies altering the balance of their portfolios between
nonreporting companies and reporting companies in the light of the
protection offered by ASR 190.
A significant reaction was also observed in the week in which ASR
190 was adopted and Staff Accounting Bulletin (SAB) No. 7 was
released. This time the reaction was in the hypothesised direction.
However, Ro concluded that this result alone was not sufficient
proof that replacement cost disclosures led to a change in the
volume of trading. Commenting on Ro's study, Freeman (1981)
questioned Ro's use of the matched pair design because of size
differences between the nonreporting and reporting companies (see
6.2.2, pp. 183-185).
4.2.9 Noreen and Sepe (1981)
Noreen and Sepe (1981) used a price reversal method to identify a
share price reaction to FASB deliberations on inflation accounting.
This approach avoided many of the limitations associated with
previous studies. The analysis concentrated on 3 specific events
associated with the FASB deliberations: the report in January
109
1974, stating that compulsory inflation accounting disclosures had
been placed on the FASB agenda; the report in November 1975,
stating that the FASB had decided not to issue a statement in 1975;
and the report in January 1979, stating that the FASB had once
again proposed that inflation accounting disclosures be required.
Noreen and Sepe's approach was based on the proposition that companies favourably (unfavourably) affected by the initial
proposal to disclose inflation accounting data would be favourably
(unfavourably) affected by events that increased the probability of
that disclosure and would be unfavourably (favourably) affected by
events that decreased the probability.
To test their hypothesis, they identified the events in January
1974 and January 1979 as increasing the probability of requiring
inflation accounting data and the event in November 1975 as
decreasing that probability. They hypothesised that the
correlation between the abnormal returns for the events in January
1974 and January 1979 should be positive and the correlation
between the event in November 1975 and each of the other two events
should be negative. The analysis was performed on a sample of 578
US companies. The results showed a negative correlation between
the event in November 1975 and each of the events in January 1974
and 1979, and a positive correlation between the events in January
1974 and January 1979.
110
To further their investigations, Noreen and Sepe selected a
subsample of 100 companies which were best capable of showing the
impact of the FASB deliberations. The analysis revealed that the
impact of the FASB deliberations was greater for these companies.
To detect the cause of the market's reaction to the FASB
deliberations, Noreen and Sepe re-ran their test using a sample of
exempt companies. They found weaker evidence of a market reaction
by the exempt firms to the deliberations. However, due to the
inherent differences between the affected and exempt subsamples,
they noted that it would be premature to draw conclusions regarding
the cause of the market reaction.
Using a research design complemetary to Noreen and Sepe's approach,
Basu (1981) found evidence supporting Noreen and Sepe's results.
4.2.10 Board and Walker (1984)
Tests to detect a market reaction to the disclosure of inflation
accounting data have not been confined to the US securities market.
In a UK study, Board and Walker (1984) assessed the information
content of SSAP 16 earnings changes. Following Ball and Brown
(1968), they investigated if companies whose CC reports contained
"good news" experienced a superior stock market performance.
Initially, the study covered a sample of 52 companies whose
accounting year ended on 31st December. The companies were
111
classified using the sign of the change in their earnings per share
figures between 1980 and 1981. The classification was performed
using HC earnings and CC earnings. The market model was used to
construct two measures of abnormal return for each company. Measure
1 covered the period January 1981 to December 1981 and measure 2,
May 1981 to April 1982. However, both measures yielded identical
results.
The analysis began by examining the association between HC earnings
and abnormal returns. In the case of HC earnings the hypothesised
result was observed for 32 of the companies, i.e., favourable
earnings changes were allied with high share returns or
unfavourable earnings changes were allied with low share returns.
This result was significant at the 90 percent level. The results
for SSAP 16 earnings were slightly less impressive. Only 30
companies had the expected result and this was not significant at
the 90 percent level.
The incremental information content of HC earnings and CC earnings
was investigated. Using simple regression, the extra information
e^ which is provided by changes in CC earnings was isolated by
eliminating the part of the change association with HC earnings.
The part of the stock market return that is not associated with
changes in HC earnings was also derived. Then the association
between e^ and was examined. The results showed no evidence
that CC earnings had incremental information content over HC
112
earnings. When the procedure was reversed to assess the incremental information content of HC earnings over CC earnings,
again, no incremental information content was found. This finding
is consistent with a high correlation between CC earnings changes
and HC earnings changes, this was confirmed by a correlation
coefficient of .89 between both variables.
To test the sensitivity of their results to the sample size, the
tests were repeated on a sample of 164 companies. This time the
results showed a significant association between HC earnings
changes and returns and CC earnings changes and returns. Again,
there was no evidence of HC earnings having incremental information
content over CC earnings or of the reverse situation.
4.2.11 Appleyard and Strong (1980)
Using the same general approach as BCG (1980), Appleyard and Strong
(1984) examined the market's reaction to SSAP 16 disclosures. Their
selected sample consisted of 52 UK companies reporting CCA
information for the first time and with accounting years ending on
or around 31 December 1980. The study concentrated on the
depreciation adjustment and the working capital adjustment. Both
variables were scaled by total shareholders' interest. They used 2
approaches to measure the unexpected information content of the CCA
disclosures. Firstly, it was assumed that the entire CCA
adjustments were unexpected and secondly, unexpected CCA
113
adjustments were taken as the difference between the actual CC
numbers and estimates of these numbers. Using each unexpected measure, the sample of companies was partitioned as follows:
TABLE 4.1
APPLEYARD AND STRONG'S COMPANY CLASSIFICATION
GROUP DEPRECIATION WORKING CAPITALADJUSTMENT ADJUSTMENT
1 High High
2 High Low
3 Low Low
4 Low High
The companies in each group were partitioned into equal beta
portfolios and portfolio returns were computed. The portfolio
return of companies in group 1 were compared with the portfolio
return of companies in group 3, and the portfolio return of group 2
companies with that of group 4 companies. Using Hotelling's T
test, they found no statistical differences in returns for any of
the partitioning schemes, a result similar to the BCG study.
However, as in the BCG study, the failure to detect a price
reaction may be attributed to the partitioning scheme adopted, the
small sample size, the information being already impounded in the
share price, a learning lag, and/or investors' lack of confidence
114
in the CCA disclosures. This latter point may be particularly
significant in this study as all companies were disclosing the CCA
information for the first time.
4.2.12 Brayshaw and Miro (1985)
Employing a matched pair design, Brayshaw and Miro (1985) examined
if the CC adjustments made in response to the Hyde Guidelines (ASC,
1977) had an impact on share prices. A sample of 112 UK industrial
and commerical reporting companies was matched with 112
nonreporting companies.
The reporting companies were partitoned into 2 subgroups - those
with CC earnings higher than the estimated industry average and
those with CC earnings below the estimated industry average. This
resulted in 35 reporting companies in the former group and 75
reporting companies in the latter. Nonreporting companies were
then partitioned into 2 similar subgroups by matching them with
their respective reporting company.
Using the market model, CAR was derived for 3 periods of 11, 21,
and 30 weeks centering on the annual report release date. For the
3 periods the results revealed no significant difference in the
cumulative returns of the reporting and nonreporting companies for
either subgroup. As this result may have been caused by the
disclosure of other relevant items during the test period, Brayshaw
115
and Miro compared the return of reporting companies which reported
above average CC earnings with the returns of companies which
reported below average CC earnings after controlling for the
effects of other influences. This was accomplished by computing
the difference in mean returns between the former group and their matched companies and the latter group and their respective matched
companies and then comparing the cumulative return differences of
both groups. Again, the tests failed to show a significant
difference in returns.
4.2.13 Matolcsy (1984)
In an Australian study, Matolcsy (1984) examined the joint and
incremental information content of inflation accounting and HCA
numbers. Tests were performed on a sample of 197 companies for the
total period of 1970-1978, and 2 subperiods of 1970-1974 and
1975-1978. His analysis showed that the joint information content
of HC and inflation accounting income numbers was significant at
the 1 percent level. However, the incremental information content
of the inflation accounting income numbers was zero. These results
were evident for the total period and each of the subperiods.
116
4.2.14 Summary
So far the studies described in this chapter have concentrated on
identifying a price reaction or an increase in the volume of
trading as evidence of the information content of inflation accounting data. A variety of testing procedures were used and
many of the studies assessed the sensitivity of their results to
the length of the test period. The analysis was also performed in
different capital markets. Despite this, the majority of these
studies found no statistically significant market reaction specific
to the disclosure of inflation accounting data. This result is
consistent with a number of possible explanations which are set out below.
The market lacked the expertise and experience to
respond to the inflation accounting information.
The research designs were inadequate. Chapter 6
critically assesses the appropriateness of the
procedures used in the previous information content
studies. However, at this point, it can be stated that
the results were consistent across a wide range of
alternative research designs and markets.
117
Inflation accounting information is not relevant to the
market's needs, as it is a poorer measure of economic
reality than HCA data, this suggests that the advocates
of inflation accounting were wrong.
The market did not accept the inflation accounting
information because it believed that the information
was not reliably prepared. (Studies reviewed in
Chapter 5 examine the reliability of the inflation
accounting disclosures).
The market has already discounted the effects of
inflation accounting information prior to its
disclosure in financial reports.
The purpose of the next 2 sections is to examine evidence from
studies which are helpful in deciding to what extent the last
explanation holds. The review begins by focusing on those studies
which investigated the association between inflation accounting
risk measures and systematic risk.
118
4.3 INFLATION ACCOUNTING DATA AND ITS ASSOCIATION WITH SYSTEMATIC
RISK
4.3.1 Introduction
As discussed earlier in 3.11 (pp. 78-82), studies by Ball and Brown
(1969), Beaver Kettler and Scholes (1970), Gonedes (1973), Beaver
and Manegold (1975) showed that HCA risk measures were associated
with the market risk measure (beta). This led researchers to
consider testing the association between inflation accounting risk
measures and the market beta.
4.3.2 Short (1978)
In an early study, Short (1978) investigated if accounting risk
ratios derived using general price level adjusted HC (GPLAHC) data
explained a greater proportion of the variation in market risk than
their HC counterparts. His analysis was applied to a sample of 259
US companies for the year 1972. In this study, it was necessary to
estimate the price level adjusted data due to its absence in
financial reports. Using a cross sectional regression model to
explain the market beta, Short found that the model with the
greatest explanatory power included the GPLAHC ratios. However, no
statistical tests were performed to determine the significance of
the difference in the explanatory power of the HC and GPLAHC
models.
119
4.3.3 Baran, Lakonishok and Ofer (1980)
Using cross sectional correlation analysis Baran, Lakonishok and
Ofer (BLO)(1980) explored the extent to which general price level
accounting betas contained information not provided by HCA betas.
Again, it was necessary to estimate the price level adjusted data.
The tests were performed on a sample of 242 US companies. Using
time series regression analysis the different accounting betas and
the market beta were estimated. To reduce the possibility of
measurement errors in estimating the betas, Bayesian adjustment
procedures at the portfolio level (1, 5, and 10 securities) were
employed. The analysis was carried out for the total period of
1957-1974 and 2 subperiods of 1957-1965 and 1966-1974.
Inflation was relatively low in the first subperiod, while, in the
second, it was high. For the total period, the analysis revealed a
higher association between the market beta and the price level
accounting betas than between the market beta and the HCA beta.
This was true for the 2 beta specifications (Bayesian and
non-Bayesian) and the 3 portfolio sizes. Similar results were
found for the second subperiod. However, in the first subperiod,
the HCA beta showed the highest association with the market beta.
This may be explained by the poorer price level estimation
procedures in this period as fewer observations were available to
derive the estimates, or, by the relatively low rate of inflation.
120
Studies by Yohe and Karnosky (19 69), and Gibson (1972) showed
investors' awareness of the effects of inflation increased during
the 1960s.
4.3.4 Cooper (1980)
Cooper (1980) examined the relationship between market beta and
unrealised holding gains. This study was based on the premise that
financial leverage is an economic determinant of systematic risk,
and that unrealised holding gains reduce financial leverage by
increasing a company's equity base. Coopers's analysis revealed a
significant negative relationship between systematic risk and
unrealised holding gains. Cooper believed this implied that
financial leverage measures derived using a replacement cost model
would correlate more closely with the market beta than their HC
determined counterparts.
4.3.5 Nunthirapakorn and Millar (1987)
A more recent study by Nunthirapakorn and Millar (1987) again
examined the association between accounting betas and the market
beta. The accounting betas were determined using the following
measures of income: historical cost/nominal dollar (HC), historical
cost/constant dollar (HC/CD), current cost/nominal dollar (CC), and
current cost/constant dollar (CC/CD). To derive the accounting
betas, estimated data was used for the period up to 1978 and actual
121
data for the period 1979 to 1981. It was decided to include only
companies for which this estimation procedure appeared reasonable,
which resulted in the sample of companies being reduced from 235 to
74. Using the Spearman's rank coefficient of correlation, the
researchers found at the individual security level, and the 5 and
10 portfolio level there was a statistically significant
association between the accounting betas and the market beta.
Applying the Friedman test, it was then shown that the ability of
historical cost/ nominal dollar income to explain systematic risk
was equal to or greater than the alternative accounting beta
measures. This conflicts with the results from the earlier studies,
but the divergence may be explained by the small sample of 74
companies spread across 46 industries. Perhaps statistically
significant results would have been found if the analysis had been
applied to companies from a single industry (see Lobo and Song,
1989 and Hopwood and Schaefer, 1989). In the studies by Short
(1978) and BLO (1980) the sample sizes were over 200. Furthermore,
the estimation procedures used in the Nunthirapakorn and Millar
study appear to be unreliable, as the number of companies for which
they were reasonable was quite low.
122
4.3.6 Summary
The previous studies show that there is evidence supporting a
relationship between inflation accounting risk measures and the
market measure of risk. However, whether this relationship is
stronger than for HCA risk measures is still unclear. More research
is needed to determine the relative explanatory power of inflation
accounting risk measures and HCA risk measures in relation to the
market beta.
4.4 INFLATION ACCOUNTING DATA AND SHARE PRICES/RETURNS
4.4.1 Introdu ct ion
The objective of the studies reviewed in this section is to provide
evidence of the ability of inflation accounting data to explain
share returns/prices, and to examine the incremental explanatory
power (IEP) of this data.
4.4.2 Easman, Falkenstein and Weil (1979)
Easman, Falkenstein and Weil (EFW) (1979) examined the correlation
between generally accepted accounting principles (GAAP) income,
sustainable income and economic income, and share returns.
Sustainable income was measured as revenues less the CC of goods
123
sold, less CC depreciation, less all other expenses conventionially
measured. Economic income was equal to conventional GAAP income
plus unrealised holding gains on inventory and plant. A sample of
80 US companies was selected and the annual change in the income variables was measured for the period 1972-1977. EFW found that
the correlation between GAAP income changes and share returns was
0.12, compared to 0.19 for sustainable income. The difference in
correlation was significant at the 12 per cent level. When they
extended their sample to 125 companies, they still found that
sustainable income yielded the best correlation with share returns.
The correlation between economic income and share returns was not
reported, possibly because the relationship was negative for the
majority of companies.
4.4.3 Beaver, Griffin and Landsman (1982)
Beaver, Griffin and Landsman (BGL) (1982) used cross sectional
regression analysis to investigate the explanatory power and the
IEP of replacement cost earnings variables. The analysis was
applied to 313 US companies whose accounting year ended on 31st
December. Returns for the calender years 1977 and 1978 were
derived and their association with: percentage changes in
historical cost earnings (HC); percentage changes in pre holding
gain net income (PRE); percentage changes in cash flow (CF); and
124
post holding gain net income (POST) was determined. The results
revealed that HC earnings had the highest correlation with returns
for both 1977 and 1978.
Two stage regression analysis was used to test the IEP of the
various earnings variables. This involved taking one of the
inflation accounting earnings variables and regressing it on HC
earnings to obtain a residual Z. Then the security return was
regressed on HC and Z. The IEP of the inflation accounting
earnings variable was determined by testing the significance of Z's
regression coefficient. The approach was adopted to test the IEP
of each inflation accounting earnings variable and the HC earnings
variable. The analysis showed that HC earnings had additional
explanatory power over all other earnings measures, but the reverse
did not hold in any of the cases.
To test the sensitivity of their results to the holding period, BGL
repeated their tests using 6 different 1 year holding periods. For
all periods HC earnings had the highest correlation with returns.
They also found that altering the dependent variable to the
abnormal returns for each of the 6 holding periods did not revise
their earlier results. Furthermore, when the two stage regression
was applied to data pooled for 1977 and 1978 the initial results
were confirmed.
125
Commenting on the difference in their results from the results of
the EFW (1979) study, BGL suggested that the difference could be
attributed to the following factors.
They used a cross sectional regression approach while
EFW used a time series approach.
Their inflation measures were based on ASR 190
replacement cost data, while EFW used estimates.
The years studied were different.
Different companies were included in the 2 samples.
The definition of the variables and the rules for
deletion of observations were also different for the
2 studies.
To try and explain the different results BGL applied their research
design to the EFW data and applied the EFW approach to their data.
This led them to conclude that the different findings was probably
due to their use of a cross sectional approach as opposed to a time
series approach.
126
4.4.4 Lustgarten (1982)
Lustgarten (1982) used multiple regression to test the relation
between CARs and unexpected RC and unexpected HC earnings. The
study was based on a sample of 581 US companies. The CARs were
derived from the CAPM using monthly data. To ensure that his results were not affected by the choice of deflator, his regression
model was computed using 5 different deflators.
Initially, the regression equations were derived using only the
deflated HC earnings variable. In this case each deflated model
yielded a statistically significant relationship between HC
earnings and the CAR. However, the overall explanatory power of2the models was very low, the highest R value was .042 when assets
were used as the deflator.
The replacement cost variable (depreciation adjustment) and the
sales variable were then added to the regression equation. The
results showed that the significance of the replacement cost
variable was affected by the choice of deflator. The variable was
significant at the 1 per cent level in 3 of the 5 models. In a
later study, Christie (1987) shows that Lustgarten should have used
the market value of the company as the deflator.
127
To address the problem of heteroscedasticity, weighted least
squares were used to estimate the regression functions. This time,
the replacement cost variable was significant in 4 of the 5 models,
being insignificant when the market value of the company was used
as the deflator.
Lustgarten believed that the difference between his results and
those of Gheyara and Boatsman (1980), BCG (1980), and Ro (1980)
could be attributed to his research methodology. He claimed that
the power of the abnormal performance index to detect small price
effects is limited. This factor was considered in a study by Brown
and Warner (1980) who reported in their simulations of a 5% (1%)
share price reaction to an informational signal, that the very best
of the tests captured the effect only 28% (9%) of the time.
To help identify the reasons for the difference in his results from
those of the earlier studies, Lustgarten decided to replicate the
analysis using a technique which closely resembled the research
design of the earlier studies. Using dichotomous partitioning, the
sample of companies was partitioned into 4 portfolios and the
average abnormal return for each portfolio was computed. However,
unlike the results from the earlier studies, both parametric and
nonparametric tests indicated significant differences in the
abnormal returns of each of the portfolios at the 1 per cent level.
Lustgarten attributed this inconsistent finding to his partitioning
of the companies into 4 portfolios as opposed to the usual 2 used
128
in the earlier studies. He also observed some evidence of a
threshold effect below which no reaction took place and argued that
this effect may obscure the impact of CCA information when 2
portfolios are used.
An examination of the timing of the market's reaction to
replacement cost disclosures showed that its effects were observed
8 or 9 months before the data was filed. He offered 2 explanations
for this early response. First, the publicity surrounding the
announcement of ASR 190 stimulated the production of similar
information from other sources. Second, the replacement cost
variable used was a proxy for some determinant of share price
response that had been omitted from the study.
Lustgarten noted further limitations of his study. His choice of
the RC variable was only decided after 2 alternative measures had2failed to yield significant results. The R statistics derived
from fitting his regression equation were all less than 0.1,
implying that many significant determinants of abnormal return had
been omitted, perhaps causing biased regression coefficients.
Furthermore, Lustgarten offered no explanation for the inclusion of
the sales variable in his regression equation.
129
4.4.5 Beaver and Landsman (1983)
In 1983, Beaver and Landsman (BL) applied the approach they adopted
in the BGL (1982) study to SFAS 33 disclosures. A sample of 731 US
companies whose accounting year ended on 31st December was selected
for analysis. The tests were performed for each of the years 1979to 1981. They found that the SFAS 33 disclosures did not provide
significant information over and above that provided by the HC
data. In addition to the tests undertaken in the BGL study they
applied a multivariate approach to determine which variables were
significant in explaining differences in share returns. The
independent variable set included 6 earnings percentage change
variables determined using HC and inflation accounting data.
It was the residual form of these variables which was used in the2multivariate analysis. An examination of the R associated with
each of the multivariate equations showed that there was a2significant increase in the R value when the SFAS 33 variables
were included in the regression equation for 2 of the 3 years.
However, BL rejected this finding as evidence of the SFAS 33
variables having significant explanatory power. They argued that
the F ratio was likely to be biased due to the possible existence
of positive cross sectional dependence in the residuals. In
addition, they observed that the signs and magnitudes of the t
values of the individual variables provided mixed results.
130
Beaver and Landsman extended their research design to examine the
ability of various earnings measures to explain differences in
companies' market values. The following 7 earnings variables were
selected as the independent variables!
historical cost earnings (HCE);
income from continuing operations under current cost(PRE);
income from continuing operations under current cost
plus purchasing power gains (PREP);
income from continuing operations under current cost
plus gross holding gains (POST);
income from continuing operations under current cost
plus purchasing power gains plus net holding gains
(POSTP);
income from continuing operations plus constant dollar
(CD); and,
income from continuing operations under constant dollar
plus purchasing power gains (CDP).
131
The market value of common equity was the dependent variable. All
variables were deflated by the sales figure to adjust for
differences in companies' sizes. They derived 4 cross sectional
regressions models for each earnings variable for each year. The
significance of the earnings variable was determined by examining 2the R associated with each regression equation. In all years, the
models including the HC earnings variable had the greatest
explanatory power.
Beaver and Landsman then used the two staged regression analysis
approach to determine the IEP of the earnings variables. The
results revealed that 5 of the 6 SFAS 33 variables failed to yield
regression coefficients of a consistent sign across years or of a
"correct" (predicted) sign. The exception was the CD variable
which had a small amount of additional explanatory power. Beaver
and Landsman were hesitant to accept the superior performance of
the CD variable. Instead, they argued that its performance could
be due to chance and was unlikely to be sustained in subsequent
years. To provide evidence on this issue, they derived a
multivariate regression model which incorporated all variables from
the two stage approach. The resulting regression equation for each
year showed that none of the coefficients of the SFAS 33 variables
were consistent across the years and their signs were frequently2incorrect. An examination of the R associated with each
regression equation showed that the inclusion of the SFAS 332variables led to an increase in R . Despite this evidence, Beaver
132
oIEP, as the increase in R was only accomplished by placing
negative coefficients on many of the SFAS 33 variables.
To complete the analysis, they repeated the procedures and tested
the IEP of the HC earnings variable. In all years, the evidence
confirmed the IEP of the HC variable.
Beaver and Landsman's findings were upheld when several extensions
were applied to the initial valuation tests. These extensions
included examining the sensitivity of their results to the choice
of deflator, increased sample sizes and the deletion of utility
companies. However, when interpreting their results, BL suggested
that the possible existence of measurement errors in the SFAS 33
data results in this data being "garbled", leaving it difficult to
interpret.
4.4.6 Schaefer (1984)
Schaefer (1984) investigated whether CC income from continuing
operations (CCIFCO) provided information content beyond
contemporaneous dividends and historical income. The tests were
performed separately for the 2 years 1980 and 1981, with 121
companies being studied in the first year and 262 in the second
year. For the purposes of the study, Schaefer derived unexpected
measures of historical income, dividends, CCIFCO and returns.
and Landsman concluded that none of the SFAS 33 variables possessed
133
His analysis revealed that, once the information provided by
unexpected dividends and historical income was taken into account,
the information content of unexpected CCIFCO tended to disappear.
For the first year, neither unexpected dividends nor unexpected
CCIFCO demonstrated information content beyond one another,
although individually both variables demonstrated significant
explanatory power. The second year results showed both unexpected
CCIFCO and unexpected dividends to have incremental information
effects beyond one another. However, for both years, unexpected
CCIFCO did not provide incremental effects beyond historical
income.
In analysing his results, Schaefer questioned the validity of the
assumptions made in defining the variables and the grouping
techniques. He noted also that the problem of cross sectional
dependencies may not have been adquately dealt with, and its
continued existence could have distorted the results.
4.4.7 Page (1984a)
In a UK study, Michael Page (1984a) explored the explanatory power
of CCA information using a sample of 25 companies in the Brewery
sector, 33 Mechnical Engineering companies and 41 Electrical
companies. Data was extracted using the most recent financial
reports for the period prior to the 30 April 1983. Initially,
regression models were derived with HC earnings or CC earnings as
134
the independent variable and share prices as the dependent
variable. These models revealed that the explanatory power of CC
earnings and HC earnings was similar.
The analysis was then repeated, this time the variables being
deflated by shareholders' equity per share, dividends per share, or
turnover per share. Overall, the results indicated that CC
earnings performed as well as HC earnings in explaining the share
prices of Breweries and Electrical companies and that neither of
the earnings variables was significant in explaining the share
prices of Mechanical Engineering companies. The analysis also
revealed that the relative importance of the 2 earnings measures
varied with the deflator used.
Page then used the two stage regression approach to investigate the
IEP power of CC and HC earnings for Breweries and Electrical
companies. For Breweries, the results showed that CC earnings had
IEP in the unsealed and in 2 of the 3 scaled models. HC earnings
had IEP in the unsealed model and in 1 of the scaled models. For
Electricals, the significance of CC earnings was greater than HC
earnings in all 4 models. However, the t statistic exceeded 2 only
once, when dividends were used as the deflator.
Page's findings on the IEP of the variables is inconsistent with
the findings from the studies by BGL (1982) and BL (1983) who also
applied the two stage approach. This difference may be attributed
135
to, first, the use of different companies and different markets in
the studies, or, second, Page's use of regression equations for
each industry, in contrast to the cross sectional regression models
used in the BGL and BL studies. The importance of this latter
point is illustrated in Page's study as CC earnings appeared to be
significant for 2 out of the 3 industries studied (also, see Lobo
and Song, 1989; and Hopwood and Schaefer, 1989).
In his final test, Page used stepwise regression to investigate the
explanatory power of the individual CCA adjustments. The cost of
sales adjustment was shown to be the most significant variable,
followed by the depreciation adjustment and the monetary working
capital adjustment, while the gearing adjustment provided little
explanatory power.
Page extended his analysis to 49 companies classified as Stores in
the Times 1000. Using 1981 and 1982 data, he found HC earnings
had greater explanatory power in 1981 while CC earnings had greater
explanatory power in 1982. He also repeated his test for the
Mechanical Engineering, Electrical and Brewery companies using
1981 data and share prices at 30 April 1982. The results of these
extensions confirmed the previous analysis, but the explanatory
power of CC earnings was shown to be greater for Breweries in 1982
than in 1981. The improvement in the explanatory power of CC
136
earnings in 1982 for Stores and Breweries may indicate that
investors' confidence in this information increased, or may be
taken as evidence of a learning effect.
4.4.8 Peasnell, Skerratt and Ward (1987)
Peasnell, Skerratt and Ward (PSW) (1987) extended the study of
Skerratt and Thompson (1984) which had uncovered small but
significant associations between share returns and CC disclosures.
In the 1984 study, the analysis had been carried out on a sample of
17 UK companies using data for the years 1981 and 1982. In the PSW
study, the sample was increased to cover approximately 200
companies between 1980 and 1984.
The model regressed share returns on the HC earnings forecast error
per share, CC earnings per share and the return on a market index.
The CC variable was expressed as the proportionate cha.nge in CC
earnings per share over the previous year. The model was estimated
for holding intervals of 1, 5, 10, 15, 25, and 35 days up to the
announcement date. The tests confirmed the results of the earlier
study - a share price effect for both HC and CC information.
However, the significance of the CC variable was less than the HC
variable.
137
The tests were then repeated using the annual change in the CC rate
of return on capital as the CC variable. The results were similar
to those based on the earnings per share measurements. In
addition, the robustness of the results was tested to variations in
the deflator employed and to adjusting the model to take account of
cross company variations. In all cases, the general findings
remained the same.
PSW then regressed the share returns on the return on the market
index, the HC forecast error and their estimates of the CC
adjustments. The results showed that the impact of the CC
disclosures was greatly reduced, with the CC coefficients being
statistically significant over the 5 and 10 day holding periods
only. When CC capital employed and sales were used as deflators,
the CC effect completely disappeared. However, when the model was
run having weighted the market index by the companies' beta (to
account for cross company variations), the CC effect was
significant over 1, 5 and 10 day holding periods. This was the
case even when alternative deflators were used.
To compare the results of this study with earlier studies, PSW
employed an experimental design similar to the approach taken in
the earlier studies. The results showed when there was good news on
the basis of HC information, the market appeared to distinguish
further between shares on the basis of the CC information. However,
138
if there was HC bad news no further discrimination occurred. This
result is consistent with a risk averse market in which current
costs act as a marginal correction to the primary HC signal.
PSW's final test study investigated the potential of CC earnings to
drive share prices over a longer period. This issue had been
considered by BGL (1982), but, unlike BGL who used a 1 year holding
period to determine share returns, PSW used a 2 year holding
period. As in the BGL study, the results showed that the
proportionate change in HC earnings per share was the only
significant influence on long run share returns. Both the
proportionate change in CC earnings per share and the market
variable were insignificant as evidenced by their related t values.
However, the lack of significance of the market factor in the model
casts doubts on the appropriateness of the regression model.
To test the sensitivity of the results to a 2 year holding period,
PSW replicated the test using a 1 year holding period. Again, the
results showed that the CC variable did not increase the
explanatory power of the regression equation and, in this instance,
the market factor was significant.
139
In concluding their study PSW listed the limitations set out
below.
They did not consider the extent to which their results
were driven by outliers. They hoped their use of
different deflators in the regression models and the
employment of the abnormal performance index would
reduce the impact of extreme observations.
They had no strong theoretical justification for the
form of the model adopted. This may have resulted in a
loss of statistical power due to model
misspecification.
Their model did not take account of any industry
effect. This omission could be significant as Page's
(1984a) study suggested that the responsiveness of
share prices to CG disclosures varies between
industries.
Their method of estimating the CC profit may be
inappropriate.
Despite these limitations, PSW provide evidence that the market
does react to CC disclosures, even though the information is viewed
as being supplementary to HC disclosures.
140
4.4.9 Bublitz, Frecka and McKeown (1985)
Bublitz, Frecka and McKeown (1985) tried to resolve the conflict
between the findings of the earlier studies by BGL (1982) and BL
(1983) and those of Lustgarten (1982). Their objective was to
reexamine the issue of whether ASR 190 and SFAS 33 income variables
add explanatory power to models containing HC variables. They
derived cross sectional regression models for each of the years
1978 through to 1983, using samples of manufacturing companies.
They measured the IEP of the inflation accounting variables by
focusing on whether the addition of these variables to a regression
equation including HC variables leads to a significant increase in2the adjusted R .
Their results showed that the ASR 190 variables possessed little
incremental explanatory power beyond that provided by HC income
measures. This is consistent with the results of BGL (1982). In
contrast, they found that the SFAS 33 data possessed IEP and this
remained unchanged when industry indicator variables were added to
the regressions. However, when separate industry regressions were
run, the results were not very convincing. This could have been
caused by the smaller sample sizes reducing the power of the
industry tests. The results were also tested for their sensitivity
to different variable deflators, extreme observations and
alternative market return metrics. In most cases these factors did
not cause a revision of earlier results. However, when they
141
replicated a portion of the BL (1983) study on their sample, they
found that their results were virtually equivalent to the findings
of BL. Thus, they believed that the difference in their findings
was due to their use of additional variables and performing the
tests for 2 additional years. The difference may also be explained2by their use of the adjusted R s to investigate the IEP of
inflation accounting variables, instead of examining the
significance of the regression coefficients as in earlier studies.
The analysis also revealed that several SFAS 33 variables had
stable correlations with the dependent variables. In particular,
the evidence relating to the realised holding gains variables was
very encouraging. The good performance of these variables can
possibly be attributed to the low correlation between them and the
HC variable. The poor results associated with the other regression
coefficients may have been caused by multicollinearity.
4.4.10 Murdoch (1986)
Another study, prompted by the Beaver and Landsman (1983) study was
undertaken by Murdoch (1986). When reviewing the Beaver and
Landsman (1983) study, he observed that their data suggested that
SFAS 33 return on equity variables possessed greater IEP than most
of their earnings change variables. This led Murdock to examine the
explanatory power of SFAS 33 returns on equity, relative to the
explanatory power of historical returns on equity.
142
The analysis was undertaken for the years 1980, 1981 and 1982.
Companies were matched using beta to control for cross sectional
correlation of the dependent and independent variables. The final
number of pairs in each year were 161 for 1980, 168 for 1981, 167
for 1982 and 159 for the three year mean. For each pair of
companies, in each year, the difference in share returns and the 5
accounting returns were calculated.
First, simple regressions were used to regress the difference in
share returns on the differences in each accounting return. The
analysis showed a stronger correlation between HC returns and share
returns than any other accounting return measure. However, the
difference in the explanatory power of the HC return model and the
CC return model was significant in only 1 of the years.
To test whether SFAS returns data possessed IEP, differences in
share returns were regressed on differences in the HC return and2each SFAS 33 return variable. The r of the simple regression
2models were compared to the adjusted R of the multiple regression
models. The results showed that difference in purchasing power
returns was the only variable which possessed explanatory power
beyond the HC returns variable. Tests for the IEP of constant
dollar returns were inconclusive, but there was no evidence that CC
or net holding returns possessed IEP. This conflicts with the
results of the Bublitz, Frecka and McKeown (1985) study which used
143
a similar approach to assess the IEP of inflation accounting data.
The difference may be due to Murdoch focusing on differences in
returns of matched companies.
When the IEP of HC returns was tested, the results showed that HC
returns possessed explanatory power beyond that provided by
constant dollar, purchasing power, and net holding returns.
However, HC returns failed to demonstrate IEP relative to CC
returns.
4.4.11 Darnell and Skerratt (1989)
Darnell and Skerratt (1989) used a valuation approach to assess the
importance of CCA information in determining relative share values.
They used the same data as the PSW (1987) study. A simple share
valuation model was derived using data over the years 1980-1983.
The form of the model used was as follows:
Pjt = a + bHCA.t + cADJ.t + ejt
where
Pj^ = closing price of share j on the announcement day of the annual earnings of year t;
HCAjt = the annual historical cost earnings per share for year t;
CCA.. = the annual current cost earnings per share for year t;
ADJjt = ffCAjt - CCAjt; and
e .. = error term.
144
The results from the simple pricing model showed that both
variables were significant at the 5% level of significance. This
result was confirmed when the White (1980) correction to the OLS
standard errors was made to adjust for heteroscedasticity.
4.4.12 Lobo and Song (1989)
Many of the previous studies (e.g., Murdoch, 1986) failed to
identify the actual disclosure date of the inflation accounting
information. This failure was citied as an explanation for the
apparent irrelevance of this information in determining share
prices. Aware of this situation, Lobo and Song (1989) identified
the dates on which both HC income and inflation acccounting income
was released to the securities market. They investigated the IEP
of alternative measures of constant dollar and CC operating income
over HC income. The empirical findings showed that the inflation
income measures had IEP over HC income. The analysis also showed
significant differences across industries in the relationship
between unexpected returns and unexpected inflation accounting
income, as for some industries the regression coefficients for the
inflation variables were negative. They attributed this to
companies' abilities to respond to price level changes. This issue
is considered in greater detail in the review of the next study.
145
4.4.13 Hopwood and Schaefer (1989)
Hopwood and Schaefer (1989) considered the extent to which a
reaction to inflation accounting information is company specific.
The analysis is based on Revsine's reasoning (1973, pp. 108-116),
which states that, if companies can pass on price increases, then
the disclosure of CCA information may be viewed positively, as it
indicates future cash flows increases while, if companies cannot
pass on price increases, the information may be viewed negatively,
as it indicates future cash flows decreases, while for some
companies, future cash flows will remain the same. Thus, they
hypothesised a positive association between CC adjustments and
returns for some companies and, ceteris paribus, a negative (zero)
association for others. Based on this reasoning, they argued that
traditional cross sectional analysis, which assumes a homogeneous
response from companies, is unsuitable for assessing the IEP of CC
accounting information.
Hopwood and Schaefer tested their hypothesis on a sample of 402,
402, and 395 US companies in 1981, 1982, and 1983 respectively.
They began by measuring companies' responses to price changes. The
companies were then ranked from the highest to lowest, based on
this response. Share returns models were then derived for all
companies, and for 2 separate groups comprising the companies with
the highest and lowest 1/3 of the price response measure. They
found that the association between the CC income variable and
146
security returns differed significantly across the groups. In
particular, they observed that the sign of the CC coefficient for
the high and low cost subgroups was different, this was consistent
with their reasoning.
Furthermore, the models used to test the IEP of CC income showed
these variables possessed IEP for each of the subgroups, but this
was not the case when the analysis was performed on all companies.
The evidence also indicated that companies within an industry
tended to be categorised in either the low or high price response
group. This suggests, that although the information contained in CC
adjustments is not company specific it is largely industry specfic.
4.4.14 Bernard and Ruland (1987)
Bernard and Ruland (1987) took a different approach from many of
the previous studies in assessing the IEP of CC income. They
examined the explanatory power of CC and HC income within a time
series context, believing that this approach overcame serious
limitations associated with previous cross sectional studies.
Criticising these studies for assuming a homogeneous response to
price level changes, they argued that the presence of severe
multicollinearity in these studies distorted the results. Bernard
and Ruland hoped to reduce the severity of these problems in their
147
study by using time series analysis which focused on a subset of
industries where the correlation between unexpected HC income and
unexpected CC income was relatively low.
Their sample consisted of 113 US companies from 27 major
industries. The analysis was performed on data for the years
1961-1980. The CC income figures were estimated and compared with
actual figures (when available). The researchers found their
estimations to be highly correlated with reported CC income. Time
series regressions were derived for each industry. They found some
evidence of IEP associated with CC data for industries where the
correlation between unexpected CC income and unexpected HC income
was lowest. However, this result only applied to a small subset of
industries. Furthermore, only a small number of companies was
included in each industry group. Thus the assumption that the
variables in the model are stationary over time is unlikely to
hold. The results also indicated that the degree of collinearity
between unexpected HC and CC income was extremely high for most
industries. Bernard and Ruland's overall conclusion was that
"even though the incremental information in current cost data is more evident in a time-series analysis than in a cross-sectional analysis, it is still not strong." (p. 719).
148
4.4.15 Bernard and Ruland (1991)
Using data from their 1987 study, Bernard and Ruland (1991) used
cross sectional analysis to test the IEP of CC income. The tests
were performed for each year of the test period 1962-1980. First,
they regressed share returns on unexpected first differences in HC
and CC income. An examination of the t values showed that
unexpected HC income was positive and significant in 6 of the years
and unexpected CC income was positive and significant in 1 year.
They believed that the poor performance of the CC variable could be
attributed to its high collinearity with the HC variable.
To reduce the effects of high collinearity the second approach
pooled the data. They used 2 approaches to pool the data, and both
approaches provided evidence of IEP of HC income, but not CC
income.
The final approach used cross sectional valuation models to regress
the market value of the company against HC and CC income for each
year of the period 1961-1980. Results showed that HC income was
positive and significant in 10 of the years and CC income was
positive and significant in 11 of the years. Overall, Bernard and
Ruland suggested that although the evidence indicated that both
variables have IEP, econometric difficulties prohibited firm
conclusions being made.
149
Critically examining the Bernard and Ruland (1991) study, it is
possible that they may have been too quick to reject the IEP of CC
income. They used the first difference form of the variables in
their returns analysis. However, if the regression coefficients are
unstable, this approach may be unsuitable. Previous evidence
suggests that the coefficients of cross sectional valuation models
are unstable (see Lev, 1989 for a review of this evidence). There
is a strong probability that Bernard and Ruland's models were
affected by unstable regression coefficients, as the HC variable
was significant in only 6 of the 19 models and this could be
explained by unstable regression coefficients.
Furthermore, in their returns analysis, they found a negative
coefficient for the HC variable for 2 of the years and a negative
coefficient for the CC variable in 10 of the years. Bernard and
Ruland dismiss these findings and attribute the negative
relationship to high collinearity between the variables. However,
a negative relationship is also consistent with unstable regression
coefficients. A further explanation is also available for the CC
variable. A negative relationship is consistent with the findings
of the Hopwood and Schaefer (1989) study, where it was shown that
if companies are unable to pass on price changes, then the CCA
variables would be viewed negatively. If the feasibility of a
negative relationship is accepted, a reexamination of Bernard and
Ruland's study reveals that the CC variable was negative and
150
significant in 3 of the returns models. On this basis, the
information content of the HC variable is only slightly better than
the CC variable in the returns models.
Hopwood and Schaefer also found that companies' responses to the CC
adjustments was industry specific. As the Bernard and Ruland study
includes 113 companies spread across 27 industries, it is possible
that the differential response to the inflation accounting
adjustments offset one another, making it very difficult to detect
an informational effect.
Bernard and Ruland dismiss their findings from their valuation
models on the basis that the results may be seriously affected by
econometric problems. However, no firm evidence is given on the
extent to which their models were affected by econometric issues.
These criticisms of Bernard and Ruland's study suggest that their
overall conclusion that CC income has no IEP may be premature.
4.4.16 Summary
The previous review shows that studies which tested the explanatory
power of inflation accounting data have been performed in a number
of countries using a variety of inflation accounting variables.
Most of the studies investigated the ability of inflation
accounting data to explain share returns and the findings from
151
these studies were mixed. However, the findings from those studies
which tested the ability of inflation accounting data to explain
share prices was more promising. A number of the latter studies
showed that the inflation accounting variables possessed IEP. This
was particularly evident when more refined sampling techniques were
employed.
The final set of studies reviewed in this chapter evaluate the
utility of inflation accounting data by focusing on its predictive
ability. A brief review of some of these studies follows.
4.5 PREDICTIVE ABILITY OF INFLATION ACCOUNTING DATA
A number of studies evaluated the utility of inflation accounting
variables in predicting business failures. Ketz (1978) and Norton
and Smith (1979) tested the ability of general price level
accounting data to predict business failures. Ketz found evidence
that the predictive ability of the price level data was greater
than the HC data. However, Norton and Smith concluded that
"in spite of the sizable differences in the magnitude that existed between general price-level and historical cost financial statements, little difference was found in the bankruptcy predictions." (p. 72).
152
Mensah (1983), Keasey and Watson (1986), and Skogsvik (1990)
evaluated the utility of CCA data in predicting corporate failures.
In both Mensah's US study and Keasey and Watson's UK study there
was no evidence to suggest that CC ratios were better at predicting
bankruptcy than HC ratios. However, Skogsvik (1990) in his study
of Swedish industrial companies, found weak support for the
superior predictive performance of the CCA ratios in periods of
high inflation.
Sami and Trapnell (1987) examined whether SFAS 33 disclosures
improved the ability of changes in HC earnings per share (EPS) to
predict share price changes. They regressed cumulative returns on
precentage changes in HC earnings per share and a combination of
percentage changes in inflation accounting earnings per share. The
dollar (HC/CD); current cost (CC); and current cost / constant
dollar (CC/CD).
The cumulative returns were computed for an 11 week period
surrounding the dates of the company's 1980 and 1981 earnings
announcement and a 12 month period which included the annual
earnings announcement dates. Predictive models were estimated for
each industry group.
153
For both test periods, the analysis revealed that the model
including the HC variable only competed favourably with the models
which included both HC and inflation accounting variables.
In a recent US study, Bartley and Boardman (1990) tested the
utility of inflation accounting data in classifying companies as
takeover targets. Studies by Simkowitz and Monroe, (1971), Harris,
Stewart, Guilkey and Carleton (1982), Wansley, Roenfeldt and Cooley
(1983), and Palepu (1986) developed classificatory models using HC
data. Given the success of these studies, Bartley and Boardman
(1990) considered if a model incorporating CC and constant dollar
accounting data in conjunction with HCA data would have greater
predictive ability in classifying companies as takeover targets
than a model based solely on HCA data. They found that the
extended model had greater predictive power.
The implications from the above studies is that the predictive
ability of inflation accounting variables is still an unresolved
issue.
4.6 SUMMARY
This chapter reviewed those studies which assessed the utility of
inflation accounting data to the securities market. Most of the
early studies focused on identifying a market reaction to the
154
inflation accounting data. The vast majority of these studies
failed to observe a market response to this information. However,
this evidence should not be solely relied upon to assess the
utility of inflation accounting data. The market's failure to
react could be explained by the market having discounted the
information prior to the release of the financial reports.
Furthermore, there are methodological limitations associated with
market reaction studies which cast doubts on the appropriateness of
this approach for this type of research. These are reviewed in
detail in Chapter 6.
The studies reviewed in 4.3 examined the association of inflation
accounting risk measures and the market's risk measure (Beta) and
the evidence from these studies was mixed.
Other researchers used regression analysis to investigate the
explanatory power of inflation accounting information. Most of
these studies evaluated the ability of inflation accounting data to
explain share returns, while a smaller number were concerned with
explaining relative share prices. Again, the findings from these
studies were mixed. However, a reasonable number showed that the
inflation accounting variables had incremental explanatory power.
Chapter 6 examines the advantages and disadvantages of using this
latter approach to evaluate the utility of inflation accounting
data (see 6.4, pp. 199-210).
155
Many of the studies reviewed in this chapter cited lack of
confidence in the reliability of inflation accounting data as a
reason for its lack of utility. This issue is addressed in the
studies reviewed in the next chapter.
156
CHAPTER 5
NON MARKET BASED EVIDENCE ON THE ATTITUDE TO AND RELIABILITY
OF INFLATION ACCOUNTING DATA
CHAPTER 5
NONMARKET BASED EVIDENCE ON THE ATTITUDE TO AND RELIABILITY OF
INFLATION ACCOUNTING DATA
5.1 INTRODUCTION
The utility of inflation accounting data is likely to depend on
users' and prepares' attitudes towards this data. Their attitudes
will be influenced by their familiarity with and confidence in the
data. This led researchers to adopt alternative approaches to the
market based studies previously reviewed, to investigate the
utility of inflation accounting data. These alternatives are
explored in this chapter, which examines the following research:
studies which focused on users' and preparers'
commitment to and attitude towards inflation accounting
data (5.2) ; and,
studies which investigated measurement problems
associated with deriving inflation accounting data
(5.3) .
157
5.2 COMMITMENT AND ATTITUDE TO INFLATION ACCOUNTING DATA
Given the importance of users' and preparers' attitudes to the fate
of inflation accounting data, a number of empirical studies have
examined users' and preparers' commitment to this data in practice.
In a US study, Benston and Krasney (1978) examined the uses and
attitudes towards alternative financial accounting measurement
methods by 2 groups of sophisticated investors - common stock and
direct placement investment officers of life insurance companies.
Direct placement officers can request any financial data they
desire from companies with whom they negotiate loans. In contrast,
common stock investment officers can use only publicly available
data for their investment decisions. This selection offered the
following advantages:
the sample contained people who had the practical
experience to understand the alternative accounting
measurements;
the group consisted of people who had uses for
financial accounting information beyond supporting a
recommendation to buy or sell a share; and,
158
in the short term, at least some of the information
production costs would be internalised by the life
insurance companies, thus tempering their requests for
additional information.
Using a questionnare, the practices and opinions of the officers of
62 life insurance companies were surveyed. The response rate was
94 per cent. The direct placement officers were asked for their
preferred valuation bases for 17 specific financial report items
which they regularly requested as supplementary data for use in
lending decisions and their single preferred valuation basis for
financial reports. The common stock investment officers were also
asked to indicate their preferred valuation bases for the same 17
specific financial report items and for the reports as a whole. In
addition, they were asked to indicate the measurements they
preferred as supplements to the present GAAP. The results of the
questionnare showed that 89 per cent of the direct placement and 66
per cent of the common stock investment officers preferred GAAP as
the valuation basis for financial reports. GAAP was found to be
used overwhelmingly by the direct placement officers who can
request and legally obtain alternative valuations. In relation to
the 17 specific financial report items, the direct placement
officers showed very little enthusiasm for different valuation
bases. The common stock investment officers' preference for GAAP
generally concurred with those of the direct placement officers.
159
However, when they assumed that the data would be supplemental to
that presently reported, they exhibited a stronger preference for
additional valuations.
The impact of the scale of investment operations of the life
insurance companies, and the experience of the officers that
responded, was examined. It was found that the scale of the
investment operation as measured by portfolio size or total assets
was not a significant determinant of the demand for alternative
financial reporting measurements. The years of professional
experience of the direct placement officers was not significantly
related to their responses. However, the more experienced common
stock investment officers were much more GAAP oriented than were
their less experienced colleagues. Overall, the results of the
study showed very little support for the use of alternative
financial reporting measures.
In a UK study, Boys and Rutherford (1984) assesssed the use of
financial reporting data by institutional investors. Their report
dealt with the following issues:
the weight attached to CCA data in relation to HCA
data;
the particular uses made of CCA data;
160
analysts' attitudes to technical issues in CCA; and,
the reasons given by analysts for making little or no
use of CCA data.
A final sample of 13 institutional investors (i.e., 3 insurance
companies, 3 pension funds, 4 merchant banks, and 3 unit trusts)
was used. The study focused on discovering how analysts use
financial reporting data in making recommendations about investment
decisions and what information analysts need from financial
reports. This was achieved by presenting the analysts with the
reports of a manufacturing company, and observing them as they went
through the analytical process and then asking them a series of
questions. The analysts were unaware that the chief subject of
inquiry was the CCA data. This avoided leading analysts to
overemphasise the use of the data presented in the CC accounts.
The review of the analytical process showed that little attention
was given to CCA data. The only exception to this was the CC
dividend cover figure. The major reason given for this was that
the rest of the market reacts to HCA data and analysts do not want
to be out of line with the market since in the short term it is
unlikely to prove advantageous. This is consistent with the view
expressed by Peasnell Skerratt and Ward (1987) in their study. They
161
claimed that
"... since investors are unfamiliar with the CCA measurement system, it is difficult to see how they could realistically expect the expectations of others (and hence share prices) to be driven entirely by the new aggregation procedures for measuring corporate performance." (p. 4).
Other reasons given were:
the very weak support given to the CCA system by
companies' management and brokers' analysts;
the lack of knowledge and understanding of SSAP 16 on
the part of analysts;
the lack of sufficient years' figures to provide a long
term trend;
the analysts' belief that they can derive the same
information from funds flow data; and,
the likelihood of inflation being reduced to a level at
which analysts consider that it will no longer present
a problem for financial reporting.
162
In interpreting the preceding studies the possibility of bias
distorting the results must be considered. This could be caused by
the sample selection procedure used, the method of assessment
employed, and failure to control for the effects of nonresponse
bias. Boys and Rutherford considered the problem of bias and
asserted that
"... insofar as it is possible to identify the direction in which bias might occur, it appears that the use of current cost accounting information by investment institutions generally is likely, if anything, to be exaggerated by the present research."(p. 123).
Thus, the evidence suggests little use was made of CC accounts,
but, it must be remembered that these conclusions are based on a
small sample of only 13 institutional investors.
Carsberg and Day (1984) considered the use made of CCA data by
another group of analysts and stockbrokers. Using an approach
similar to Boys and Rutherford, a sample of 15 stockbrokers was
asked to openly examine the financial reports of 2 UK companies.
Again, the analysts were unaware that the main purpose of the study
was to assess the relevance of CCA data. The results indicated weak
support for this data. The majority supported continued disclosure
of the CCA information on a supplementary basis and, as in the
previous study, dividend cover was regarded as the most
significant figure. The study also showed that most of the
analysts accepted the maintenance of operating capability as a
163
useful basis for the computation of profits. Again, when
interpreting the results the presence of selection bias and the
small sample size must be considered.
Bayliss (1984) took a different approach to the previous 2 studies
in evaluating analysts' use of CCA data. He investigated the
importance attached to CCA data in comparision with HCA data in the
financial press and in stockbrokers' reports. This approach was
adopted as he believed the extent to which investors use CCA data
is likely to be conditioned by the way in which the data is treated
in the media which convey it. First, he examined 649 press
articles commenting on the annual results of 58 companies to
establish the extent of reference to CCA data. The analysis
revealed that even when references were made to CCA, they were
supplementary and of secondary importance to the HCA content. The
evidence also showed that the press coverage of CCA had fallen from
1982 to 1983.
In the second part of his study, Bayliss analysed stockbrokers'
circulars. The approach was designed to complement the
investigation undertaken by Carsberg and Day (1984), in that
circulars were obtained from the same companies that were included
in the Carsberg and Day study. In all, 66 circulars, representing
a cross section of companies of varying size and industrial
classification, were analysed for their CCA content. The findings
revealed that stockbrokers disseminate CCA data to a greater degree
164
than the press, as 50% of the cases mentioned CCA information.
But, again, the information was regarded as secondary to the HCA
data. In addition, the analysis showed that over time stockbrokers
consistently used the CCA data. Bayliss also showed that industry
classification, company size, and the share recommendation were
independent of the amount of CCA comment. Overall, the study
showed weak commitment towards the disclosure of CCA data. Again,
when interpreting the results, the presence of selection bias and
the small sample size must be considered.
It is highly likely that analysts' attitudes to inflation
accounting data will be partly conditioned by the attitude of the
companies required to disclose this data. This prompted Archer and
Steele (1984) to examine the attitude of UK companies towards
compliance with SSAP 16. Their analysis was based on a sample of
494 listed companies, which were surveyed by a postal
questionnaire. The examination of 484 usable replies showed that
there was widespread and increasing lack of enthusiasm for SSAP 16.
165
This may be observed from Table 5.1 below.
TABLE 5.1
ENTHUSIASM FOR SSAP 16
Initially(1980) (1983)
% %
Happy to comply 16 7
Lukewarm towards compliance 19 18
Sub-total 35 2 5
Complying from obligation 54 60
Failing to comply 7 11
Sub-total 61 71
Exempt 4 4
The above table illustrates how initially only 35% of respondents
reported a positive or fairly positive attitude to compliance and
that proportion had shrunk to 25% by mid 1983. Analysis of the
direction of nonresponse bias showed that there may be an
underestimation of the proportion of companies unhappy with SSAP
166
Archer and Steele tried to identify the factors influencing a
company's attitude towards compliance. The evidence suggested a
fairly strong relationship between a company's size and its
enthusiasm for SSAP 16, with smaller companies being less willing
to comply. It was also found that the degree of technological
stability was not a significant factor in influencing compliance.
The researchers tried to identify the reasons for respondents'
change in attitude towards compliance. They found the lack of
"robustness" of CCA data as the major factor leading to a reduction
in the popularity of SSAP 16. This stemmed from the persistent
need to make arbitary and subjective choices between alternative
methods of calculating CCA figures which undermines the credibility
and meaningfulness of the information disclosed.
The study also assessed company officials' perception of the
benefits of CCA data to external users of financial reports.
Findings showed that, on average, those who reported a positive
attitude towards compliance (happy or lukewarm) rated their CC
accounts more suitable than HC accounts for the following purposes:
and, estimating a company's capacity to support wage claims. Those
who reported negative attitudes (complying from obligation or not
complying), on average rated their CC accounts inferior to their HC
accounts for all financial reporting purposes. But, for
traditional stewardship purposes, and for purposes of assessing
liquidity and solvency, even the CCA enthusiast group rated HC
167
accounts as more suitable. It was observed also that although
company officials in different organisations had different
perceptions of SSAP 16, many of them believed that external users
of financial reports did not attach much significance to their CC
accounts.
Consideration was also given to examining the extent to which CCA
methods are used in management accounts. The evidence showed that
very few companies (8%) produced CCA based management accounting
information. This result is important, as it may indicate a
reluctance to CCA for financial reporting. Greater commitment to
CCA methods for internal reporting purposes could only improve
individuals' perceptions of the potential benefits of the approach
and perhaps reduce their scepticism about the reliability of the
data disclosed. It appears that the major problem preventing the
acceptance of SSAP 16 is that the methods used to circumvent the
technical difficulities are considered to be insufficiently
rigorous by preparers of financial reports.
The foregoing studies provide evidence that a large number of users
and preparers of financial reports have misgivings about the
utility of inflation accounting data due to the numerous
measurement problems encountered in their preparation. Thus, the
acceptance of inflation accounting data will depend on users' and
preparers' confidence in how well this data is measured. The next
section considers the importance of reliability and relevance in
168
determining the utility of inflation accounting data to users.
Studies which examine the potential for measurement error in
deriving this data are also reviewed.
5.3 PROBLEMS OF MEASUREMENT ERRORS IN COMPUTING INFLATION
ACCOUNTING DATA
Chapter 2 (see 2.2, pp. 20-22) states that the objective of
financial reporting is to provide information that is useful to
users in their economic decision making. It identified (see 2.3,
pp. 22-24) the qualitative characteristics which financial reports
should possess to help them achieve their objective. 2 of these
characteristics - relevance and reliability - were viewed as being
particularly important. Studies by Stanga (1980), and McCaslin and
Stanga (1983) have shown that these 2 characteristics are postively
correlated. In the latter study, McCaslin and Stanga concluded
that relevance may be determined in part by how much reliability
the information is perceived to possess. They suggested that, if
information is not "sufficiently" reliable, then it will not be
relevant for any decision. This view was also expressed by Ijiri
and Jaedicke (1966) in an early conceptual study.
Recognition of the importance of reliability in determining the
169
relevance of inflation accounting data led researchers to
investigate the impact of measurement errors on the utility of this
data. The evidence from some of these studies is now reviewed.
In a UK study, Carsberg (1984) examined the reliability of special
CCA measures. The approach taken in the study was to obtain
information on the technical difficulties of implementing SSAP 16,
by interviewing the preparers of financial reports and a number of
auditors. The information was obtained from large accountancy
companies and the study concentrated on identifying the problems
encountered and the actions taken to overcome them in the
following areas:
deriving the CC of an asset affected by technological
change;
deriving the recoverable amount of an asset and
deciding when this is the appropriate basis of
valuation; and,
deriving the CC of specialised assets.
Both preparers and auditors of financial reports expressed concern
about the utility of measurements of the recoverable amounts of
assets and of replacement costs for assets affected by
technological change. They believed that by applying the concepts
170
set out in SSAP 16 these measurements were excessively subjective,
or, if they relied on mechanical indexing, the accounts failed to
reflect economic reality. In the case of specialised industries,
they argued that extreme difficulties existed in valuing
specialised assets and that a capital maintenance concept based on
maintaining operating capability was inappropriate. The evidence
led Carsberg to conclude that the reliability of assets valued in
accordance with SSAP 16 was highly questionable, and that the
inappropriateness of the standard for some industries could cause
antagonism towards it.
In another UK study, Page (1984b) undertook 2 projects designed to
investigate the adequacy of data typically available for making
"routine" CC measurements in companies. One project considered the
procedures used in preparing CC accounts, and whether these
procedures were considered adequate by the companies and their
auditors. The other project investigated the problems encountered
by auditors in reporting on companies' CC accounts.
The approach adopted in the first project was to select 16 clients
of 3 firms of accountants and to prepare case studies on the
approach taken by each client in the preparation of CCA data. The
studies showed 3 different attitudes prevailing towards CCA
reporting. 4 companies were classified as having a positive
171
attitude, 5 a neutral attitude and 7 a negative attitude. Page then
considered the problems encountered by these companies in deriving
the CC of assets.
Despite the heavy reliance on external indices, the evidence
suggested that, for assets located in the UK, companies were
reasonably happy with the procedures used to derive their current
costs. However, for company assets located abroad, the measurement
of their replacement cost was a problem. There was a tendency to
use general price indices and companies were not really satisified
with the results.
Also, there were indications that companies with a negative
attitude towards SSAP 16 derived their CC measures with the minimum
of effort and expense. This may explain why these companies tended
to consider their CC measures as uncertain and subjective. In this
respect, negative attitudes towards CCA within companies may be
self reinforcing.
The second part of the project showed that the auditor's view of
the CCA data was influenced by clients' commitment to and opinion
of the CCA disclosures. In interpreting the results of this study,
consideration should be given to the small sample studied. However
the findings support the conclusions reached by Carsberg (1984).
172
Moving to the US, a study by Swanson and Shriver (1987) examined
the impact of measurement errors on the utility of SFAS 33
disclosures. Based on a review of the procedures adopted by
companies to derive the CC of assets, they concluded that
measurement errors do exist. These errors are caused largely by
inadequate adjustments for tecnological changes and the apparent
encouragement given in SFAS 33 to the use of indices. Swanson and
Shriver believed, in general, that these errors resulted in an
overstatement of the cost of plant and equipment and that their
impact was likely to be more substantial for companies employing
older assets, particularly assets in the high technology
industries. They strongly suggested that the existence of these
measurement errors could have impaired the validity of previous
inflation accounting studies and hence these studies were unable to
determine accurately the extent to which CC data has benefit.
Given the heavy reliance on external indices to derive the
replacement value of fixed assets, Shriver (1987) examined the
possibility of measurement errors in the index most frequently used
in the US to derive the replacement cost of machinery and
equipment. His examination revealed that measurement errors did
exist in the index and that the extent of these errors varied with
the age and type of asset.
173
In a New Zealand study, Duncan and Moores (1988) used a very
different approach to evaluate the relevance and reliability of CCA
information. Their objective was to measure the relevance and
reliability of CCA data by assessing the extent to which CCA leads
to "better" decisions as compared to relying solely on HCA data.
For this study, decisions were seen as "better" if they were
superior in terms of a decision criterion (i.e. maximisation of
return on investment) and if they resulted in greater prediction
accuracy.
An experimental design approach was used to achieve this objective.
120 final year undergraduate accounting students were selected as
surrogate investors and they were required to analyse the data
provided on 2 similar companies for investment decision making for
the 3 years 1979, 1980 and 1981. The CCA income was substantially
different from the HCA income for both these companies. The
students were divided into 3 treatment groups as follows: those who
received only HC accounts, those who received only CC accounts and
those who received both sets of accounts.
There were 2 parts to the experimental task. The first involved
deciding which company was the preferable investment on the basis
of their predicted return on investment. The second part involved
ranking the perceived reliability of the financial accounts
presented to each group of students. The findings of the
experminent were that CCA data were found to provide more relevant
174
information. This was because the treatment groups receiving such
data made different and "better" decisions than those receiving
only HCA data.
The results of this study are very different from the previous
studies which considered the reliability of inflation accounting
data. This may be attributed to the different approach used. The
use of an expermental design automatically limits the results and
conclusions to the subjects, treatments and environment of the
study. Furthermore, the selection of 2 companies for which there
was a substantial difference between the CC income and the HC
income would a priori increase the possibilty of the CCA
information being relevant. A further problem may be that the
student subjects may not be acceptable surrogates for real
investors. Firstly, given the existence of a student/teacher
relationship, the students may have felt that the information was
more reliable than if they themselves had randomly selected the
companies. Secondly, the motivational issues would be very
different between the students and real investors. The implicit
reward structure, satisfaction in completing the task, may not have
provided sufficient motivation for the students to perform the task
carefully. However, this latter affect is likely to be randomised
across each group of students.
175
The studies reviewed have shown that users and preparers of
accounts are concerned about the reliability of inflation
accounting data. It is the objective of this study to adopt an
approach which recognises that investors' willingness to use
inflation accounting data may be influenced by their perception of
the reliability of this data (see 7.4.3, pp. 227-228).
5.4 SUMMARY
This chapter considered whether the low information content/ or
explanatory power of inflation accounting data can be attributed to
users' and preparers' attitudes to this data and/or measurement
problems associated with this basis of valuation. The evidence
revealed that users' and preparers' perceptions of the utility of
inflation accounting data are fairly negative. Generally, this
negative perception could be attributed to their lack of confidence
in this data.
Studies which examined the reliability of the inflation accounting
measures showed that the reliability of these measures was
questionable and that this sapped confidence in the whole system of
inflation accounting. The review also indicated that confidence in
the reliability of the inflation accounting data was dependent on
176
preparers' attitudes towards disclosing this data. This factor is
taken into consideration when designing the research methodolgy to
be employed in the present study.
The next chapter assesses the implications of the methodological
weaknesses of earlier inflation accounting studies. It identifies
and critically examines the approach which is used in this study.
177
CHAPTER 6
CASE FOR A VALUATION APPROACH
CHAPTER 6
CASE FOR A VALUATION APPROACH
6.1 INTRODUCTION
This chapter critically evaluates the methodologies used in
previous market based accounting research studies to assess the
utility of inflation accounting data. This evaluation is presented
in the context of those studies which focused on inflation
accounting data. However, the criticisms raised apply to most
market based accounting research studies. In addition, the chapter
presents the case for the use of a valuation approach in assessing
the utility of inflation accounting data. In particular, the
following are considered:
problems associated with information content studies
(6.2);
the valuation approach (6.3); and,
the valuation approach and inflation accounting data (6.4).
178
6.2 PROBLEMS ASSOCIATED WITH INFORMATION CONTENT STUDIES
Much of the early research (see 4.2, pp. 99-118) on inflation
accounting data used the information perspective to investigate the
utility of this data to the securities market. These studies
focused on identifying a market reaction to the disclosure of
inflation accounting data. Most of these studies failed to detect
a market reaction to the disclosures. However, this type of
analysis alone cannot be relied upon to assess the utility of this
data as it suffers from methodological deficiencies which are now
considered.
6.2.1 Selecting the Test Period
In the case of information content studies, the determination of
the exact timing of the event is of key importance. Peasnell,
Skerratt and Ward (1987) claim that
"the power of tests to identify a market reactiondepends much more on the accuracy with which event dates can be determined." (p. 4).
In a series of simulations, Brown and Warner (1980) showed that
failure to pinpoint the exact timing of an event can result in
severe loss of statistical power when return analysis is used. When
reviewing the studies in Chapter 4, it was noted that many of the
179
studies failed to identify the exact timing of the disclosure of
the inflation accounting data and this may explain their failure to
detect a market response to these disclosures.
In addition, Reed Parker (1967) observed that
"knowledge affecting common stock prices is not perfectly disseminated at any one time but that it comes more as a steady flow than as intermittent jogs such as reporting dates of accounting data." (p. 17).
For this reason, Reed Parker believed that the "analysis of cause
and effect" is complicated and detection of a market response to
accounting data may be impossible.
In support of Reed Parker, Lustgarten (1982) found that the effects
of the ARS 190 disclosures were observed 8 or 9 months before the
filing date. This suggests that the inflation accounting data
disclosed in financial reports is not "new" information. However,
it may still be used by investors in their decision making. For
example, Hines (1982) found that shareholders do use financial
reports in their decision making, even though these reports
generally contain little that is "new" and so their release will
not cause a price response. In a comprehensive survey of financial
analysts, institutional investors and individual investors in the
USA, UK, and New Zealand, Chang, Most and Brain (1983) similarly
found that financial reports were a very important source of
information to each of these groups in all 3 countries. Cready and
180
Mynatt (1991) found that although there was no price response to
the disclosure of the financial report, there was evidence to
suggest that small investors used the information in the report to
adjust their portfolio position. Other studies which failed to
detect a price response to the release of financial reports include
Foster Jenkins and Vickrey (1986), Mynatt (1988), and Bernard and
Stober (1989).
Thus, as financial reports are likely to convey very little
information that is new to the capital market, Hines (1982)
suggested
"that short-term stock market reaction is not an adequate indication of the usefulness of accountinginformation to investors." (p. 309).
If the speed with which inflation accounting information is
anticipated by the market varies across securities, this causes a
further problem. In this situation the optimal time interval for
each company in the sample may be different. Freeman (1987) found
evidence which suggested that share prices of large companies began
to anticipate reported earnings much earlier than small companies'
share prices.
However, in defence of the information content studies, it should
be noted that many of the studies used CARs to detect a price
response to inflation accounting data. This approach recognises
181
that inflation accounting data becomes available to the market over
a period of time. Despite this, most of these studies concluded
that inflation accounting data did not possess information content.
Furthermore, many of the studies tested the sensitivity of their
results to the length of the test period and found that altering
the length of the test period did not affect their initial
findings.
An issue related to selecting the test period concerns the
magnitude of the effect of the inflation accounting disclosures. It
is possible that the effect may be small relative to the
variability of companies' share prices. Recognising this problem,
Soroosh Joo (1982), Beaver and Landsman (1983, p. 75) and Atiase
and Tse (1986) suggested that residual analysis may be
inappropriate. The problem is further complicated by the existence
of confounding events and for this reason Keane (1983) asserted
that
"it is a near impossible task to relate the price movements of individual securities with specific events or information data. There are potentially too many events affecting the value of a company at any given point in time to be confident that an observed price movement is in response to a specific item of information." (p. 142).
The next section considers the problems associated with the
technique used to control for confounding events.
182
6.2.2 Matched Pair Design
This technique was employed by several of the studies in Chapter 4,
e.g., Arbel and Jaggi (1978), Beaver Christie and Griffin, (1980),
Gheyara and Boatsman (1980), RO (1980, 1981), Noreen and Sepe
(1981), Appleyard and Strong (1984), and Murdoch (1986). The main
reason for adopting this approach is to control for the problem of
confounding events.
In each of the aforementioned studies, the samples of companies
were divided into 2 groups: reporting companies (companies
(companies not disclosing inflation accounting data) and matched on
the basis of a profile of characteristics which was considered
important in determining a share's return. It was hypothesised that
the expected return of each company in a pair should be equal. Any
differences in actual return could be attributed to the disclosure
of the inflation accounting data.
However, in reality this ideal case is unlikely to exist. For some
mandatory accounting standards (e.g. ARS 190, SFAS 33, and SSAP
16), the criterion for disclosure itself may be a significant
discriminating variable. Foster (1980), Beaver, Christie and
Griffin (1980) recognised the importance of this point in relation
183
to ARS 190 (it also applies to the other standards on inflation
accounting). Foster commented that, as only large companies were
required to comply with ARS 190,
"a firm profile analysis, between disclosing and nondisclosing firms, using these variables would likely not yield any new insights; by construction, the two groups are different. To argue that these differences do not damage the internal validity of a pre-test post-test control group design, one would need to argue that these variables (and those closely related to them, e.g. market capitalization) do not affect security returns." (p. 44).
Thus, if share returns and volumes vary systematically with company
size, then the matched pair design will not allow for any direct
conclusions regarding the effect of inflation accounting data.
Research evidence suggests that this may be the case, e.g., Atiase
(1985), Freeman (1987) and Ro (1988) found that company size and
information content were inversely related. Banz (1981) reported
that small companies tended to have higher abnormal returns than
larger companies. These studies suggest that a significant size
effect exists and several alternative hypotheses have been offered
to explain this effect (see Dyckman and Morse, 1986, pp. 36-39).
Given this evidence, Freeman (1981) argued that without direct
controls for size, any results from tests using the matched pair
design approach are indeterminate. However, most of the inflation
accounting studies which employed the matched pair design
considered the problem of the size effect on their results and, for
184
this reason they also analysed the differential returns of
reporting companies. Limitations associated with this approach are
considered in 6.2.3 (pp. 187-188).
A second problem associated with the matched pair design is that
the disclosure of inflation accounting data may have implications
for the nonreporting companies. Lustgarten (1982, p. 137)
referred to this as the "spill over effect". Earlier research by
Firth (1976) and Foster (1981) found that the disclosure of
accounting information by some companies had implications for
similar companies. If this is true, then the matched pair design,
by construction, is biased against detecting a differential market
response to inflation accounting data.
A third reason why the matched pair design approach may be
inappropriate is that companies' share returns within a group may
not be affected in a similar way. The approach assumes that the
share returns of companies in the same group are affected
similarily by the inflation accounting disclosures and that share
returns of companies outside that group are affected differently.
If this situation does not exist, then it is possible that the
differential effects on share returns within a group will tend to
offset one another and so the power of the test to detect an
informational affect is reduced. Evidence from studies by Page
185
(1984a), Lobo and Song (1989) and Hopwood and Schaefer (1989)
suggested that companies' share returns are affected differently by
inflation accounting data.
The problem of correctly grouping companies is compounded by the
absence of a developed theory which links inflation accounting data
to share prices. The lack of an articulated theory and the
difficulties it imposes in interpreting the results of inflation
accounting studies is considered by Foster (1980), Beaver Christie
and Griffin (1980), Watts and Zimmerman (1980), Hines (1984), and
Brayshaw and Miro (1985).
6.2.3 Model Specification
Information content studies not only require a theory which
predicts the market's response to inflation accounting data, but
also knowledge of investors' expectations of this information, as
an efficient market will only react to unrealised expectations.
This knowledge is required for tests which involve partitioning the
sample of companies. The importance of correctly formulating the
expectational model is recognised by Lev and Ohlson (1982) and
Beaver Christie and Griffin (1980). The latter claim that
"to the extent that the expectations model is poorly specified, partitioning by the difference between replacement cost and historical cost contains a "garbling" of the difference between the actual and the
186
expected replacement cost disclosure. Consequently, the association between the signal and the security return would be understated by the empirical study." (p. 132).
A number of researchers, e.g., Arbel and Jaggi (1978), Beaver,
Christie and Griffin (1980), Grossman, Kratchman and Welker (1980),
and Appleyard and Strong (1984) assumed a naive expectational
model, and partitioned the data based on the difference between
inflation accounting data and HC data. In other cases, Value Line
replacement forecasts or researchers' own forecasts were used as a
proxy for the market's expectation of the inflation accounting
data, e.g., Ro (1980), Beaver, Christie and Griffin (1980), and
Appleyard and Strong (1984).
Haw and Lustgarten (1988) stated that the failure of earlier
studies to find statistically significant coefficients for the
inflation accounting variables may be attributed to the use of
misspecified expectational models. However, given the absence of a
developed theory which allows us to determine investors'
expectations, the impact of this omission on the results of these
studies is indeterminable.
Apart from partitioning the data on the basis of the magnitude of
the difference between the actual inflation accounting data and HC
data (or forecasted inflation accounting data), other studies,
e.g., Gheyara and Boatsman (1980), Friedman Buchman and Melicher
(1980), Ro (1981), Peasnell Skerratt and Ward (1987), examined the
187
differential return behaviour among reporting companies. As
previously mentioned in 6.2.2 (p. 185), this avoids the problem of
controlling for the size effects associated with matched pair
design. In the forementioned studies, companies were partitioned
based on whether they ranked above or below a selected inflation
accounting variable. A major problem associated with this approach
is that the partitions employed have limited theoretical
underpinning. Lustgarten (1982) warned that, by using a dichotomous
partitioning variable, researchers can ignore potentially important
information contained in the partitioning variable. He commented
that
"it is quite possible, for example, that there was some threshold of unanticipated replacement cost below which the market did not react. If this threshold were far from the median value, then partitioning the sample atthe median could lead to insignificant statisticaltests when partitioning the sample at the thresholdwould produce significant results." (p. 134).
In fact, in his study, Lustgarten observed some evidence of a
threshold effect.
Model specification is not only required for determining investors'
expectations of inflation accounting data, but also for determining
share returns (or abnormal returns). Most information content
studies employed some form of the market model or CAPM to detect a
price reaction to inflation accounting data. Here the impact of
market wide influences on a share's return is isolated by using the
188
share's beta to adjust for market effects. This increases the
probability that the effects of information unique to a particular
company can be detected as this information is impounded in the
error term (i.e. residual) associated with the model.
A critical assumption of these models is the stability of beta.
Studies by Blume (1971), Sharpe and Cooper (1972), Jacob (1971),
and Cunningham (1973) examined the stability of betas over time for
both portfolios and individual securities. The research showed
that individual security betas were more unstable than portfolio
betas. This led Dyckman, Downes, and Magee (1975, p. 63) to
conclude that, as accounting information is security specific, the
difficulties of evaluating the information content of accounting
data is more complex than is suggested in most of the existing
research. The instability of beta at the company level may explain
why some of the earlier studies failed to detect a price reaction
to CCA information. Also, it may explain the conflicting results
from the studies reviewed in 4.3 (pp. 119-123) which examined the
association between inflation accounting betas and the market beta.
The instability of beta may not be the only problem associated with
the use of the market model. Soroosh Joo (1982) argued that the
model may be an oversimplified model of price formation. Using
weekly data, he found that only 25 percent of the changes in an
individual share's return was explained by changes in the market
factor { ) . Similar results were given in Beaver's (1968a) study
189
which employed weekly data and Roll's (1988) study which employed
weekly and monthly data. This implies that other important
variables are excluded from the market model, and that their
impact is impounded in the error term. In relation to SFAS 33,
this lead Soroosh Joo (1982) to conclude that the
"omission of these factors makes it more difficult todetect any price effects of the release of thesupplementary data required by the Statement. Ingeneral, the low explanatory power of Rmt for changesin i?it is a major deficiency in the general marketmodel to detect the price effects of different sets ofinformation." (p. 66).
However, the literature does not offer a consensus on which
variables are omitted. King (1966) found that the industry variable
had a direct relationship with share returns. Kraus and
Litzenberger (1976) added a measure of skewness to the general
market model and found this improved the explanatory power of their
model. In an early study, Douglas (1969) found a positive
relationship between residual variance and share returns.
Subsequent studies by Fama and MacBeth (1973) found no significant
relationship between the unsystematic risk and a share's return,
while Levy (1978) and Friend, Westerfield and Granito (1978) found
a positive relationship. When he controlled for different levels
of beta, Foster (1978) found that the relationship between the
residual variance and share returns was not significant. So, to
date any attempts made to determine the additional factors critical
to a share's return have proved inconclusive. Studies which apply
190
the Arbitrage Pricing Model to explain cross sectional variability
in security returns have also been unsuccessful in identifing the
additional relevant explanatory variables.
The implication for inflation accounting studies of using the
general market model or the CAPM to derive returns is that the
omitted variables may invalidate the results.
The methodologies reviewed so far have been associated with those
studies which tested the market's reaction to the disclosure of
inflation accounting data. The deficiencies of these methodologies
led researchers to investigate the power of inflation accounting
data to explain security returns/prices. As this form of research
is used in this study, the next section examines the valuation
approach from a conceptual perspective. 6.4 then discussess the
implications of this approach in evaluating the utility of
inflation accounting data to investors.
6.3 THE VALUATION APPROACH
6.3.1 Introduction
Lev and Ohlson (1982), Atiase and Tse (1986) have recommended the
use of a valuation approach, in addition to the information content
191
studies to assess the utility of accounting data to investors. This
approach and its potential contribution to financial reporting are
now considered.
6.3.2 Valuation Approach and Accounting Data
In the valuation approach, researchers attempt to find a
relationship between companies' prices and accounting variables.
2.2 (pp 20-22) established that the objective of financial
reporting is to provide decision relevant information to users.
Thus, any evidence of a link between share prices and accounting
data provides an insight to the utility of that data to investors.
Investors are interested in information which helps them decide
whether they should buy, hold or sell investments (ASB, 1991). This
decision is based on the expected return and risk associated with
the cash flows generated by the investment (see 3.5, pp. 58-60).
Thus, the potential for financial reports to assist investors
depends on how well they convey information on a company's ability
to generate cash flows. The extent to which financial reports
reflect value relevant information was discussed in 2.5.3 (pp.
28-30) .
Atiase and Tse (1986) protrayed the link between accounting data
Lev and Ohson (1982) described this mapping from fundamental
variables into share prices as "the reduced-form characterization
of a dividends-capitalization prediction" (p. 309). Lev and Ohlson
(1982) suggested that valuation analysis could be used to identify
which set of accounting variables "manifest itself on a valuation
level" (p. 309). In an earlier article, May and Sundem (1976)
suggested that the development of descriptive models of equilibrium
prices with accounting numbers among the explanatory variables is a
primary area of research. 3.12 (pp. 82-92) presented the findings
of empirical studies which used valuation models in accounting
research. These studies identified earnings, dividends, size and
growth rates of assets and earnings as being significant
explanatory variables.
Lev and Ohlson (1982) also argued that, if the purpose of
accounting is to facilitate decision making, then accounting
research must be defined to include any research efforts which help
identify the optimal information set for some defined class of
decision makers. Earlier, Beaver, Kettler and Scholes (1970)
recognised the importance of this form of analysis to investment
193
decision making and stated that
"we cannot hope to construct an accounting system or evaluate the current system in terms of adecision-making criterion without a knowledge of the interaction between the accounting data and the market price variables." (p. 654).
However, there are problems associated with the valuation approach
and these are considered in the next section.
6.3.3 Problems Associated with the Valuation Approach
Gonedes and Dopuch (1974) in a review of empirical research in
accounting identified 2 main problem areas in the valuation
approach.
The first is the lack of theory and the ad hoc nature of the
valuation models. Brennan (1991) suggested that the lack of an
adequate theoretical framework for specifying the structure of the
relationship between share prices and specific accounting variables
weakens much of the literature attempting to relate accounting data
to share prices. For this reason, Atiase and Tse (1986) suggested
that "there is still room for improvement in the theoretical
foundations and the empirical specification of valuation models"
(p. 21).
194
A review of valuation model development from a conceptual
perspective is presented in Atiase and Tse (1986). They commented
that virtually all valuation models rely on some notion of dividend
discounting and that the main differences in the approaches is in
the derivation of the dividend stream and the incorporation of risk
in the analysis. For a review of the main valuation models see
Atiase and Tse (1986), and Brennan (1991).
Recently, there has been some progress in the development of
theoretical models linking accounting variables to share prices
(see Brennan, 1991). One of these models is exploited in the
empirical stage of this study (see 7.2, pp. 214-218 and Chapter 8
where the theoretical framework for the relationship between share
prices and specific accounting variables is addressed again).
The second problem area pointed out by Gonedes and Dopuch (1974),
in the valuation approach concerns econometrical issues. These
include multicollinearity, heteroscedasticity, omitted variables
and the measurement of independent variables (these issues and
their implications to inflation accounting studies are discussed in
6.4.2 (pp. 205-210).
The effect of these econometrical issues is substantial for those
studies attempting to derive a valuation model which can be used to
predict share prices. However, it has been suggested that the
implications of these issues may not be as great for those studies
195
which investigate whether a particular set of variables provide IEP
for share prices relative to another set of variables (see Brennan,
1991, footnote).
Despite the problems associated with the valuation approach Lev and
Ohlson (1982) and Atiase and Tse (1986) asserted that this form of
analysis offers a potentially useful perspective that is different
from and complementary to that provided by information content
studies. The contribution that the valuation approach derives in
part from methological and econometrical differences between this
approach and that of the information content studies. Beaver and
Landsman (1983) stated as the limitations of the information
content studies' approach and the valuation approach are not
perfectly correlated, information from both tests can be greater
than that provided by either one approach. The benefits of using
the valuation approach to evaluate the utility of inflation
accounting data are discussed in 6.4.1 (pp. 200-205).
When discussing the potential contribution of the valuation
approach to accounting research, Lev and Ohlson (1982) recommended
a valuation approach which concentrates on explaining relative
share prices. The arguments for selecting relative share prices
over share returns are now considered.
196
6.3.4 Advantages of Focusing on Relative Share Prices
3.12.1 (pp. 83-92) reviewed the early research studies which
investigated the ability of accounting numbers to explain share
returns. The review showed that little insight was provided into
the share pricing mechanism. In a review of returns based studies
in 3 major accounting research journals for the period 1980-88, Lev
(1989) found that earnings only explained up to 10% of the cross
sectional variation in share returns. This finding was robust with
respect to the test period used. Researchers who used this
approach to assess the explanatory power of inflation accounting
data, also found little insight was provided into the determinants
of share prices. In general, no more than 10 to 20 percent of the
variation in share returns was explained by the independent
variables in these studies. This suggests that many important
determinants of share returns have been omitted from the regression
models. This omission of relevant explanatory variables results in
parameter estimators of the variables in the model being biased, if
the omitted variables are correlated with the variables in the
model (see Stewart, 1984, p. 126). Brennan (1991) also
commented that, omitted variables may explain the instability of
regression coefficients in valuation studies. (Note in a recent
study, Strong and Walker (1992) found that by allowing for cross
sectional variation in regression parameters, including an earnings
197
yield variable, and by partitioning earnings, their model
explained 42% of the variation in abnormal returns and 55% of the
variation in raw returns.)
Given the poor performance in general of models focusing on share
returns, Lev and Ohlson (1982) suggested consideration should be
given to alternative methods of relating share price
characteristics to accounting signals. They stated that
"if the relevance of accounting information toinvestors is at issue, surely the extent to which this information accounts for (explains) the values of stocks, rather than just triggers a change in these values, should be a major concern." (p. 305)
Similarly, Davidson (1968) commented that
"a definition of information content that demandsobservable change and presumably immediately observable change seems too restrictive." (p. 95).
These arguments support the use of share prices over share returns
in valuation models. The results from studies which concentrated on
explaining share prices have been more promising than those which
focused on share returns. The review in 3.12.2 revealed that the
models in the former studies explained at least 50 per cent of the
variation in share prices. However, only 4 of the inflation
accounting studies (Beaver and Landsman, 1983; Page, 1984a; Darnell
and Skerratt, 1989; Bernard and Ruland, 1991) reviewed in
Chapter 4 used this approach. Again, the explanatory power of
198
these models was generally over 50%. Bearing in mind the above
discussion, a valuation approach concentrating on relative share
prices is used in the present study.
The next section discusses the contribution which the valuation
approach can make to the debate on inflation accounting.
6.4 SHARE VALUATION APPROACH AND INFLATION ACCOUNTING DATA
As share prices represent the end result of an important decision
making process, evidence of a link between share prices and
inflation accounting data may provide an insight to the decision
utility of this data.
Lev and Ohlson (1982) regard the valuation approach as being of
particular importance to the debate on the utility of inflation
accounting data to investors. The approach has the potential to
overcome many of the methodological limitations associated with
information content studies. These methodological advantages are
now examined.
199
6.4.1 Methodological Advantages of the Valuation Approach
For information content studies, selecting the exact timing of the
event is critical to the analysis (see 6.2.1, pp. 179-180). Atiase
and Tse (1986) commented that this issue is not as crucial under
the valuation approach, for as long as the information item
(inflation accounting data) remains relevant, prices should
continue to reflect the data once assimilation has occurred.
Therefore, for valuation analysis it is only necessary to ensure
that the prices examined relate to a period that is clearly after
the information has been impounded in share prices.
With information content studies there is also the problem that the
researcher has a choice of several price observations (e.g., daily,
weekly, monthly) on which to base the analysis. This problem is
avoided in valuation studies.
Determining the length of the test period can also cause problems
in information content studies (see 6.2.1, pp. 180-181). It was
shown that the period may be too short to detect a price reaction
or conversely, too long, causing the impact of the information item
on share prices to be swamped by the impact of other information
items. The valuation approach avoids these problems. Atiase and
Tse (1986), Beaver and Landsman (1983) recognised that as inflation
2 0 0
accounting data is likely to have a cumulative effect on share
prices which will be reflected in their level, this effect can be
easily detected by using a valuation approach.
Another advantage of the valuation approach, suggested by Lev and
Ohlson (1982), is that it does not require an expectational
specification of the information item. The importance of an
expectational model to information content studies was considered
earlier in this chapter in 6.2.3 (pp. 186-188). The review showed
that a misspecified model may explain why some studies failed to
detect a market response to the inflation accounting data.
A number of the information content studies also used some form of
a market model to derive abnormal returns, to detect a price
reaction to the inflation accounting data. Again, this provides for
the opportunity for model misspecification, which increases the
difficulties of detecting a market response. This problem is
avoided when a share valuation approach is employed.
The valuation approach may be of particular importance to
accounting policy makers in helping them assess the consequences of
their decisions. Today, more and more attention is being focused
on the economic consequence and/or effectiveness of alternative
accounting procedures. In this respect, valuation analysis may be
preferable to information content studies as, using the results of
the latter studies, it may not be possible to distinguish between
2 0 1
the following explanations for the lack of a market reaction to
inflation accounting data, first, the information is not pertinent
to share valuation, or second, the information is relevant but it
has already been reflected in share prices. Clearly, these 2
explanations have significantly different implications for
accounting policy makers. If inflation accounting data are
irrelevant, its mandated disclosure should not be required. On the
other hand, if the data is already impounded in share prices, the
relevant issue becomes that of comparing the savings in social
costs from substituting mandated disclosure of inflation accounting
data for the private search effort of this data. Valuation analysis
has the ability to distinguish between the above explanations (see
Lev and Ohlson, 1982; Atiase and Tse, 1986).
Valuation analysis not only offers the opportunity to evaluate what
information should be disclosed but it may be used also to select
between alternative accounting valuation bases (e.g., inflation
accounting or HCA). Beaver and Dukes (1972) commented that
"the association (between the earnings numbers from alternative procedures) and the behavior of security prices will indicate which method the market perceives to be the most related to the information used in setting equilibruim prices." (p. 321).
They then suggested that the "association criterion"
"...provides a simplified method for preference ordering of alternative measurement methods." (p. 321).
2 0 2
However, care is required in applying the valuation approach to
the assessment of the relative desirability of alternative
accounting procedures. This form of research does provide the
opportunity of evaluating what accounting numbers are pertinent to
valuing companies, but it does not provide evidence on which
alternatives are socially desirable. It would be wrong to look at
the results of valuation studies in isolation when deciding between
alternative accounting procedures. To address the desirability
issue, Gonedes and Dopuch (1974) strongly argued that data is
needed on the cost of alternative information production systems
and on the social preferences for alternative accounting
procedures. In a recent review of MBAR, Walker (1992) stated that
the factors which should be taken into account when assessing
financial reporting alternatives are as follows:
the extent to which the alternative reporting system
satisfies the stewardship function;
the effect of the alternative system on the usefulness
of financial reports as a basis for the enforcement of
accounting based contracts;
the commerical sensitivity of the proposed new
reporting system; and,
203
the effect of the alternative reporting system on the
confidence of investors in the fairness of the stock
market.
Gonedes and Dopuch (1974) stated given the current institutional
setting, where financial information is freely provided, it is
impossible to use share prices to indicate the social desirability
of accounting information. However, Gonedes and Dopuch still
believed that this form of research can contribute to the decisions
of accounting policy makers and suggested that share prices can
"be used to assess the effects of these information production decisions. . . . Since assertions abouteffects are important parts of the justifications offered for recommendations and prescriptions, we can assess the strength of these justifications by evaluating the theoretical or empirical support for the assertion about effects. . . . I n short, assessmentsof the effects of alternative accounting procedures and regulations can be useful to accounting policymaking bodies in making their decisions and to their constituencies in evaluating decisions." (pp. 78-80).
In addition, given the profession's failure to successfully develop
a conceptual framework for financial reporting, valuation analysis
can make a contribution to the resolution of financial reporting
issues, as it provides policy makers with one approach, at least,
to evaluate the consequences of their decisions.
204
The foregoing discussion suggests that valuation analysis is of
considerable importance both from a policy point of view, and in
establishing the variables pertinent to a share's value. Section
4.4 (pp. 123-152) presented the findings from those studies which
used this approach to assess the utility of inflation accounting
data to the securities market. The next section examines the
attendant methodological problems in these studies.
6.4.2 Methodological Problems Associated with the Valuation
Approach
Generally, researchers used regression analysis to derive valuation
models which tested both the explanatory power and the IEP of
inflation accounting data. One of the major problems associated
with these regression models is the extent to which
multicollinearity distorts the results of the valuation model.
Severe mullticollinearity makes it extremely difficult to untangle
the relative influences of individual independent variables. Also,
coefficient estimates become highly sample dependent and point
estimates may vary greatly with the addition or deletion of a few
observations.
205
Many of the studies reviewed in 4.4 (pp. 123-152) addressed the
issue of multicollinearity. Beaver, Griffin and Landsman (BGL)
(1982), Beaver and Landsman (BL) (1983), and Page (1984a) employed
a two stage regression approach to deal with the effects of
collinearity between the independent variables. However, Christie,
Kennelly, King and Schaefer (CKKS) (1984) argued that this
procedure does not provide any additional insights to those
provided by a single multiple regression, viz.,
"no partitions of independent or dependent variables, orthogonal or otherwise, can provide insights into the relative influences of collinear variables." (p. 206)
CKKS showed that the coefficients of the transformed variables in
the two stage equations were equal to the coefficients obtained
from the single multiple regression equation. This occurs because
the multiple regression approach implicitly involves an
orthogonalization procedure, which is explicit in the two stage
approaches. (Beaver (1987) acknowledged this in a later article.)
Hence, the two staged approach may simply be viewed as more
cumbersome and likely to result in more computational errors. As
the two stage procedure fails to prevent the statistical biases
caused by the collinearity problem, CKKS suggested that the results
of the BGL (1982) study may be distorted by multicollinearity.
206
To establish the extent of the collinearity problem in the BGL
(1982) study, CKKS applied the Klein (1962) technique to the BGL
study. This technique claims that collinearity may be degrading the
estimates when a pairwise correlation exceeds the square root of
the coefficient of determination. In the BGL study, the pairwise
correlation between the replacement cost variable and the HC
variable was .84, whereas the square root of the coefficient of
determination was .37. This led CKKS to conclude that
"BGL may be finding apparently insignificantcoefficients on the replacement cost variable because their variability are collinear, rather than because the replacement cost variable is irrelevant." (p. 213).
In response to these criticisms, BGL argued that it was never their
intention to overcome the collinearity problem, but, to determine
the IEP of the supplementary ASR 190 data, which they believed can
be appropriately achieved through the use of the two stage
approach.
However, in a later study, Beaver (1987) identified a problem
associated with using the two stage approach, when the dependent
variable is the residual share return. In this instance, the use
of a sequential approach can lead to downward biased estimates of
the IEP of the variable introduced at the second stage.
207
Due to the failure of the two staged approach to improve on single
Skerratt and Thompson (1984), Peasnell, Skerratt and Ward (1987),
and Bernard and Ruland (1991) used the latter approach to derive
their valuation models. In these studies, the researchers focused
on the t value associated with the regression coefficients to
determine the significance of the explanatory variable. However,
the problem of multicollinearity has caused other researchers,
e.g., Murdoch (1986), Bublitz, Frecka and McKeown (1985), to
question the reliability of the conclusions from some of the
forementioned studies.
Given the distortions caused by multicollinearity, researchers
(e.g., BL 1983; Bublitz, Frecka and Me Keown 1985; and Murdoch
1986) concentrated on the overall explanatory power of the
regression model, as in this instance multicollinearity causes no
special problems (see Stewart, 1984, p. 135). Using an F test,
these studies considered whether the addition of inflation
accounting variables to a regression equation including HC2 2 variables led to a significant increase in R or the adjusted R . A
major limitation of this form of analysis is the problems caused by
the presence of cross sectional dependence in the residuals. This
problem caused BGL (1982) and BL (1983) to dismiss their findings
from their F tests. The problem of cross sectional dependence also
led Lustgarten (1982) to doubt the significance of his results on
the relevance of his replacement cost variable.
208
Cross sectional dependence in share returns/share price data is
likely to exist when the share returns/prices are sampled from
common time periods. It arises when a systematic relationship in
the independent variable is not captured by the independent
variables included in the regression model. The presence of cross
sectional dependence may lead to biased estimates of standard
errors and hence incorrect inferences. Furthermore, the coefficient
of multiple determination is overstated, thus t and F tests are no
longer strictly applicable. Bernard (1987) commented that previous
literature provides mixed predictions on the seriousness of the
bias that can arise when cross sectional dependence in the data is
ignored in market based accounting studies. To clarify this issue,
he attempted to assess the extent and impact of this bias in
accounting studies. In his analysis, he focused on a study similar
to the BL (1983) study. His findings led him to conclude that
"for studies involving cross-sectional OLS regressions of stock return metrics against firm-specific variables (e.g., Beaver and Landsman (1983)), it appears that the use of OLS might lead to serious bias in standard errors, depending on certain properties of the regressors, and the sample size." (p. 3).
Bernard's evidence suggested that the problems of inference were
more likely when the return interval is long and the sample size is
large. In view of these findings, he suggested that in the BL
209
(1983) study that
"elimination of bias of such magnitude could potentially reverse the conclusions of Beaver and Landsman. Specifically, it might not be possible to reject the hypothesis of no incremental information content not only for current cost income but for historical cost income as well; the two income measures might be nearly perfect substitutes." (p. 36).
This conclusion is supported by Murdoch's (1986) study in which he
employed an approach which was designed to reduce the impact of
cross sectional dependence.
Despite the problems associated with the valuation approach,
researchers (e.g., Lev and Ohlson, 1982; Atiase and Tse, 1986;
Brennan, 1991) strongly believe that further research is clearly
needed. It is this approach which is adopted in this study. The
next chapter describes the particular valuation model used.
6.5 SUMMARY
This chapter began by examining the problems associated with
information content studies. The major problems identified
includes selecting the appropriate test period and test data;
controlling for confounding events; and deriving an expectational
210
model for inflation accounting data and share returns. These
problems may have impaired the detection of a market reaction to
the release of inflation accounting data.
The chapter then considered the case for the use of a valuation
approach to assess the utility of inflation accounting data to
investors. The contribution which this approach can make to the
debate on inflation accounting was examined. However, 2 problems
associated with valuation models were identified, first, the lack
of a theoretical framework for specifying the relationship between
share prices and specific accounting variables, and second,
econometrical issues. This study employs a recently developed
theoretical model to assess the utility of inflation accounting
data to investors (see 7.2, pp. 214-218 and Chapter 8). The most
heteroscedasticity; the appropriate specification of the valuation
model; the measurement of independent variables; and omitted
variables. As these problems differ from those associated with
information content studies, evidence from both sets of studies can
provide complementary insights on the same issue.
The arguments were presented supporting the use of share prices as
the dependent variable in valuation studies. The analysis revealed
that the explanatory power of the latter models is far greater than
2 1 1
those models using share returns as the dependent variable. However
to date, few studies have adopted this approach to assess the
utility of inflation accounting data.
In view of the small number of valuation studies and their
potential to contribute to the inflation accounting debate, the
current study adopts this approach. The research design
incorporates features which build on earlier research findings.
These are detailed in the next chapter, together with the valuation
model used in the study.
2 1 2
CHAPTER 7
MODEL BUILDING AND DATA COLLECTION
CHAPTER 7
MODEL BUILDING AND DATA COLLECTION
7.1 INTRODUCTION
Having presented the case for adopting a valuation approach to test
the utility of inflation accounting data to investors, this chapter
describes the model used in this study and the data collection
procedures. The chapter contains:
a description of the model used in the study (7.2);
details on the application of Ohlson's model and
definitions of the variables selected (7.3);
the steps taken to derive the sample population (7.4);
and,
details on the sample period (7.5).
213
7.2 THE VALUATION MODEL
An objective of this study is to provide additional evidence on the
IEP of inflation accounting data in relation to share prices. The
previous chapter presents the theoretical justification (see 6.3,
pp. 191-194) and advantages (see 6.4.1, pp. 200-205) of using a
valuation approach to achieving this objective. It also stated
that a problem associated with this approach is the lack of
theoretically developed valuation models (see Atiase and Tse, 1986;
Brennan, 1991). However, a theoretical model which appears
appropriate for this study has recently been developed by Ohlson
(1989).
Ohlson's model incorporates measures from both the income statement
and the balance sheet. In recent times, researchers, e.g., Brennan
and Schwartz (1982a, 1982b), Ohlson (1989), Ou and Penman (1989),
have recognised that a valuation model incorporating both income
and balance sheet measures may possess greater explanatory power
than a model which focuses exclusively on the income statement or
the balance sheet. Brennan (1991) argued that, as unexpected
retained earnings increases the net assets available to generate
future earnings and pay dividends, the relationship between a
firm's book value and future cash flows cannot be ignored. He
214
claimed that
"in order to have a valuation model in which accounting earnings play a role, it is necessary to consider the balance sheet as well as the income statement," (p. 75).
Ohlson begins by stating that in a world of certainty the market
equilibrium value of a company is equal to the present value of
future expected dividends. However, he recognises that, in the
real world of uncertainty, it is not possible to determine the
present value of future expected dividends. Given this, Ohlson
constructs a model which is applicable in an uncertain world which
uses current period earnings, dividends and book values to predict
future expected dividends. To construct his model, he relies on an
equilibrium analysis of accounting based asset valuation in a
multiperiod setting. This equilibrium is referred to as the clean
surplus relation and is expressed in Table 7.1.
TABLE 7.1
GLEAN SURPLUS RELATION
Xt = yt * Yt-1 + *t where
= earnings realised between dates t-1 and t
= book value (or owner's equity) at date t
Dt = dividends, net of capital contributions between dates t-1 and t.
215
To derive the clean surplus relation, Ohlson invokes 2
propositions proposed by Modigliani and Miller (1958, and 1961).
The first is dividend payment irrelevance, i.e., an increase in
current dividends is exactly offset by a decrease in the firm's
current market value. The second states that expected future
earnings depend on current dividend payments, i.e., increases in
current dividends reduce expected future earnings.
Earnings and book value are shown to be value relevant as they are
related to future expected dividends. The book value of equity
represents assets that have the ability to generate future
earnings. As dividends reduce book values, they reduce future
earnings of the company. In this context, capital contributions
increase book values which results in an increase in future
expected earnings so new capital can be viewed as negative
dividends.
Ohlson shows that, under certainty, a model based on earnings or
dividends (cash flow model) and a model based on book values (stock
model) are essentially equivalent representations of a share's
value. However, when the analysis is extended to uncertainty a
cash flow model and a stock model are viewed as 2 extreme valuation
models. The uncertainty feature makes each model distinct, as they
capture different aspects of valuation, depending on the underlying
earnings process. The cash flow model describes an earnings
process with no transitory elements, while the book value model
216
describes a purely transitory process. In the uncertain setting,
the earnings process has both transitory and nontransitory
elements. In these circumstances, Ohlson argues that all 3
variables (earnings, dividends, book values) are relevant in the
valuation of a company and he uses the clean surplus relation to
draw all 3 variables together.
Ohlson assumes that there is a linear mapping between the 3
variables and the value of the company. The linearity assumption
is based on his proof of a stochastic evolution of the information
variables. The basic valuation function associated with the linear
information dynamics is given in Table 7.2.
TABLE 7.2
LINEAR VALUATION FUNCTION
P t = BlXfc + B 2 Yt + B 3 Dt
where
Pt = price of the security at date t
= earnings realised between dates t-1 and t
= book value (or owner's equity) at date t
= dividends, net of capital contributions between date t-1 and t.
B = regression coefficient
This model is not resticted to the above 3 variables. Other
217
variables are value relevant if they are useful in predicting
either future expected earnings or future expected book values.
Thus, the model allows for the addition of other value relevant
variables and, in this context, this study includes variables
derived from data disclosed in compliance with SSAP 16. The next
section discussess this application of Ohlson's model and defines
the variables selected.
7.3 APPLICATION OF OHLSON'S MODEL AND DEFINITIONS OF THE VARIABLES
Applying Ohlson's model to this study, the following basic model is
derived:
Company Value f(Book Value + Earnings + Dividends + Error Term)
To test for the utility of the inflation accounting data, an IEP
approach is employed. This approach is taken, as the vast majority
of companies disclosed this data in a supplementary statement. The
approach has also been adopted by Bublitz, Frecka and McKeown
(1985), Darnell and Skerratt (1989), and Bernard and Ruland
(1991), and these studies showed that inflation accounting data
added to the explanation of share prices given by HCA data.
Furthermore, both the FASB (1979) and the ASC (1980) in their
pronouncements on inflation accounting viewed this data as being
218
supplementary to HCA data. Adopting an IEP approach results in
Ohlson's model being formulated as set out in Table 7.3.
CVt = Share Price * Number of Ordinary Shares Outstanding atperiod t (Company Value).
CLSEHCt = HC Closing Book Value of Shareholders' Equity, (i.e.closing ordinary share capital plus reserves)*) atperiod t).
CLSECCt = CC Closing Book Value of Shareholders' Equity, (i.e.closing ordinary share capital plus reserves(*) atperiod t).
CCADJBVt = CLSECCt - CLSEHCt
OPSEHCt = HC Opening Book Value of Shareholders' Equity, (i.e.opening ordinary share capital plus reserves)*) atperiod t-1).
EARNHCt = CLSEHCt - OPSEHCj. + Dividends less New Capitalintroduced in period t.
OPSECCt = CC Opening Book Value of Shareholders' Equity, (i.e.opening ordinary share capital plus reserves(*) atperiod t-1).
EARNCCt = CLSECCt - OPSECCt + Dividends less New Capitalintroduced in period t.
CCADJEt = EARNCCt - EARNHCt
DIV^ = Dividends for the Ordinary Shareholders for period t,less for new capital introduced in the period t.
B = Regression coefficient
(Note * reserves are defined net of intangible assets)
219
The independent variables are computed from the data available on
the Datastream database. Appendix 7.A gives details of the data
extracted from the database.
The model given in Table 7.3 uses the company's market value as the
dependent variable. To derive this value the share prices used
were the closing prices on the day the financial reports were
considered to be publicly available. The public disclosure date
was assumed to be the date that the reports were received by the
Extel Group. This date was extracted from the Extel Analysts'
Service Cards. Identification of the exact date of public
disclosure of the financial reports is not critical to this study.
The critical factor was to ensure that the share prices used in the
model were after the release of the financial reports.
7.3.1 The Inflation Accounting Variables
An advantage of formulating the model in the above framework is
that it allows for the significance of unrealised holdings gains to
be tested - the variable CCADJE measures unrealised holding gains
of the period, and CCADJBV measures cumulative unrealised holding
gains.
220
Baillie (1987) defines a holding gain as:
"the increment arising from holding an asset during a period when the price increases" (p. 18)
Proponents of CCA point out that unrealised holding gains represent
actual economic phenomena occurring in the current period, and
therefore should be recognised (see Kam, 1990, p.434). Unrealised
holding gains are not equivalent to a reclassification of HC profit
but are an addition to this profit.
Separate disclosure of holding gains gives an indication of a
critical part of a firm's commerical activities, namely, the
quality of its buying performance. Edwards and Bell (1961, p. 73)
strongly supported the disclosure of holding gains. They believed
that a proper evaluation of past decisions requires dividing total
profits between profit from operating activities and gains (or
losses) from holding assets or liabilities while their prices
changed.
One way that management tries to enhance the firm's market position
is by holding a certain composition of assets and liabilities.
Hendriksen (1982, p. 229) and Kam (1990, p. 415) stated that
users want to know if these holding activities are successful. As
conventional HCA income consists of a mixture of current operating
profit and realised holding gains, it is impossible to determine
the success of managements' holding activities.
2 2 1
Edwards and Bell (1961, p. 115) referred to unrealised holding
gains as realisable cost savings. They believed this saving should
be separately identified and included in income, as it represented
an opportunity gain accruing to the firm, arising from purchasing
an asset whose price subsquently rises.
According to Edwards and Bell (1961, p. 224), the dichotomy of
income into operating income and holding gains would improve
inter period and inter company comparisons of productive
efficiency. Revsine and Weygangt (1974) jusified the
dichotomisation of operating and holding gains on the basis that
these components have different patterns of repeatability.
In contrast, in an assessment of the income dichotomisation case,
Praskash and Sunder (1979) argued that separate disclosure of
operating and holding gains offers no benefits. They believed
that, in the majority of situations, holding and operating
decisions are interdependent and that the dichotomisation of income
is meaningless. However, the extent of any interdependencies is an
empirical issue.
Details on holding gains may be of particular relevance to
investors if they reflect future earning power. Revsine (1973,
p.88) suggested that the inclusion of holding gains as income may
be justified on the grounds that changes in asset market values
reflect changes in future cash flows which are expected to be
2 2 2
generated from the use of that asset. This is based on the
assumption that an asset's market value is determined by
discounting at some appropriate rate, future operating cash flows
expected to be generated from using the asset. Therefore,
increases or decreases in an asset's market value represent
implicit changes in the asset's operating cash flow expectations.
This implies an asset's market value is equivalent to its economic
value.
As economic income embodies changes in the service potential of
assets, it is obviously an indication of future cash flows (see
Revsine, 1973, p. 93), and, thus, the measure of value most
relevant to investors. Proponents (see Alexander, 1962) of
replacement cost accounting argue that replacement cost income is a
more accurate approximation of economic income than HCA.
Revsine (1973, p. 96) defined economic income as the difference
between present (discounted) value of the expected net cash flows
of a company between two points in time, excluding additional
investments by and distributions to owners. He divided this income
into 2 components, first, distributable cash flows - expected
income, and, second, unexpected income. These components are
defined as:
Expected income = market rate of return * opening value of net
assets;
223
Unexpected income = sporadic increase in present value of net
assets due to changes in expectations regarding
the level of future cash flows.
Expected income measures the cash flows the company is capable of
generating into the indefinite future, whereas unexpected income
measures the changes in cash flows due to environmental factors not
anticipated at the start of the period.
Revsine (1973, pp. 99-104) demonstrated how, in a perfectly
competitive economy, replacement cost income is virtually identical
to economic income. The current operating income is equal to the
distributable cash flow component or expected income, and holding
gains are directly related to unexpected income.
When perfect competition does not exist replacement cost income is
an approximation of economic income. How good an approximation it
is, depends on the relationship between the prices of assets and
their corresponding future cash flows. Revsine (1973, p.107)
referred to this as the covariance between asset prices and
operating flow potential. At the aggregate level, he (p.108)
asserted that a positive covariance between asset prices and cash
flows was likely to exist and to the extent that a positive
covariance exists, unrealised holding gains can be justifiably
treated as income.
224
However, at the company level, Revsine recognised that there was no
necessity for such a positive covariance. He believed that as
asset prices increased the related operating cash flows could
either increase, decrease or remain constant. Revsine suggested
that
"from one perspective it might actually appear that the firm's position has worsened after the price rise. That is, all subsequent replacements of the asset after the price rise will necessitate a greater outflow than similar replacement before the price rise." (p. 88).
Thus, firms may differ in their ability to respond to asset price
changes. Where firms can successfully pass on price increases,
holding gains may reflect increased future operating cash flows. In
contrast, firms which cannot pass on input price increases will
suffer a decrease in their future operating cash flows.
Revsine (1973, p. 188) suggested that empirical research is needed
to discover the usefulness of replacement cost income in predicting
future earnings flows. Hopefully, the model used in this study will
provide some insight to this issue, by focusing on the utility of
unrealised holding gains in relation to company values.
An issue related to the separation of operating and holding gains
is whether these gains should be reported as income or capital
maintenance adjustments. The previous discussion suggests that
Edwards and Bell (1961) and Revsine (1973) supported treating these
225
gains as income. However, the approach taken in SSAP 16 is to
regard the holding gains as capital maintenance adjustments.
Although this issue is not directly considered in the present
study, an examination of the direction of the relationship between
Company Value and holding gains may offer some insight to the
discussion.
The sample selection procedures are described in the next section.
7.4 SELECTING THE SAMPLE
The study is based on a sample of 289 UK quoted industrial
companies covering the period 1980 to 1983 inclusive. A list of
the companies included in the sample is given in Appendix 7.B The
sample size and the sample period are a function of the nature and
objectives of the study and are discussed below.
7.4.1 Compilation of the Draft List of UK Quoted Companies
All UK industrial quoted companies were selected from The Times
1000 for the year 1982/83. This yielded 530 companies.
226
7.4.2 Verification that the Companies on the Draft List are
included in the Database
The Datastream database was searched to establish if there was
information available for each of the companies on the draft list.
It was discovered that 14 companies were not on the database and
these were removed from the sample, leaving 516 companies.
7.4.3 Classification of Companies into 3 GROUPS
The 516 companies were classified into 3 groups as described in
Table 7.4.
TABLE 7.4
DEFINITION OF COMPANY GROUPS
GROUP TYPE OF COMPANY
1 Supportive Companies: Companies whichdisclosed inflation accounting data prior to the mandatory disclosure period.
2 Reluctant Companies: Companies whichdisclosed inflation accounting data at or after the start of the mandatory disclosure period.
3 Non Supportive Companies: Companies whichnever disclosed inflation accounting data.
227
The division of the sample of companies into the above groups
arises from 1 of the objectives of this study (see 1.4, p. 11).
This objective derives from accounting policy makers belief that
the disclosure of inflation accounting data would involve a
learning process on the part of preparers (see 1.2, p. 6) and the
findings of Archer and Steele (1984), Page (1984b), and Carsberg
(1984). The forementioned studies showed that companies holding a
positive attitude towards compliance took greater care in deriving
the inflation accounting adjustments and that the management and
the auditors of these companies had greater confidence in these
adjustments. Given this evidence, it is possible that a
difference may exist in the explanatory power of the inflation
accounting adjustments for the Supportive and Reluctant Companies.
The database did not provide details on inflation accounting data
prior to the mandatory disclosure period. To complete the
classification, the steps set out below were undertaken.
(1) Newcastle University supplied microfiches containing
financial reports for 268 companies in the sample.
These microfiches were examined to determine a
company's policy towards the disclosure of inflation
accounting data in the premandatory period.
228
(2) A questionnaire was sent to the Financial Controllers
of the remaining 248 companies requesting details on
the companies' disclosure policy in respect of
inflation accounting data. A follow up letter,
together, with a second copy of the questionnaire was
sent two months later. (Copies of both letters and the
questionnaire are shown in Appendix 7.C). A total of
163 usuable replies was received, leaving the details
outstanding for 85 companies.
(3) Microfiches were acquired from Companies House, London,
for the remaining 85 companies. Again, the microfiches
were examined to determine a company's disclosure
policy in relation to inflation accounting data in the
premandatory period.
Having obtained the required information for the sample of 516
companies, it was analysed to ascertain the status of each company
with respect to the 3 groups described above. This yielded the
classification presented in Table 7.5.
229
TABLE 7.5
GOMPANY CLASSIFICATION
Group Companies
No %
123
239257
20
46504
516 100
7.4.4 Examining the Exhaustivenes of the Share Price Information in
Relation to Groups 1 and 2
An examination of the database provided evidence of share price
information for 177 of the 239 companies in group 1 and for 181 of
the 257 companies in group 2. This provided an overall sample of
358 companies. The remaining companies in each group were either
now suspended or had been taken over and the share price
information was no longer available.
7.4.5 Exhaustiveness of the CCA Information Disclosed
It was discovered from the database that compliance with SSAP 16
for the first 3 years of mandatory disclosure was as set out in
The regression coefficients are estimated using the observed values
of the dependent and independent variables. For the purposes of
this study, the estimates were made using the least squares
criterion. Koutsoyiannis (1977) described the rationale of this
technique as follows:
"It is intuitively obvious that the smaller the deviation from the line of regression, the better the fit of the line to the scatter of observations. Consequently from all possible lines we choose the one for which the deviation from the points is the smallest possible. The least squares criterion requires that the regression line be drawn in such a way as to minimise the sum of squares of the observations fromit." (p. 61).
To derive the regression models, the forced entry method of
variable selection was used. A description of this approach is
given in SPSSx manual (1988, p. 851). This selection procedure
allows all independent variables to enter the model, thereby making
it easier to analyse, interpret and compare the findings from the
valuation models.
237
The validity of the above procedure depends on the extent to which
the assumptions of the regression model are satisified. The
critical assumptions underlying the model, as discussed in Neter,
Wasserman and Kutner (1985, p. Ill), and Studenmund and Cassidy
(1987, p. 61) are:
(1) the observed values of the independent variables are
measured without error;
(2) the error term is normally distributed;
(3) the dependent variable is a linear function of the
constant and the independent variable;
(4) the variance in the dependent variable is constant for
all values of the independent variable, i.e.,
homoscedasicity exists;
(5) the error terms are independent, i.e., no serial
correlation;
(6) important variables appear explicitly in the model;
and,
(7) the independent variables do not show a high linear
correlation, i.e., multicollinearity does not exist.
238
The extent to which these assumptions hold and the measures taken
to avoid gross violations, are considered in 8.3 below.
8.3 BUILDING THE VALUATION MODELS
This section presents details of the models derived and the steps
taken to assess their statistical validity. The procedures resulted
in the derivation of 25 models and 17 were identified as being
suitable for detailed analysis. Given the extent of the procedures
used to derive a statistically valid model, this study, effectively
became a mini case study in the empirical application of Ohlson's
model. A discussion of the implications of the study for the
application of Ohlson's model is deferred to Chapter 9 (see 9.4,
pp. 333-335).
8.3.1 Basic Model
Chapter 7 described in detail the model used in this study. The
Table 8.7 provides evidence of severe multicollinearity in both
periods for the Supportive Companies and in period 1 for the
Reluctant Companies. This is not surprising as the 3 variables,
249
earnings, book value, and dividends are related in the financial
statements through the clean surplus relation which Ohlson derives
as an equilibrium condition of his model. Sougiannis (1990) also
found evidence of multicollinearity in his study, when he used
Ohlson's model to test for the relevance of research and
development expenditure in explaining company values.
Appendix 8.E.1 presents the correlation coefficients for each of
the variables for both periods for the Supportive and Reluctant
Companies. An examination of the simple correlations shows that
many of the intercorrelations are very high. For both groups and
in both periods, the correlation between some of the independent
variables is greater than the multiple correlation coefficient
(Klein (1962) test for multicollinearity). The severity of the
multicollinearity may explain the switch in the sign of the
coefficients of a number of the variables when they are included in
the multivariate model. This occurred in each model in both
periods, which makes it very difficult to identify the influence
of the individual variables in each of the models.
As the previous models suffered from severe multicollinearity,
consideration was given to remedial action, which is now outlined.
250
8.3.2 First Difference Models
Deriving models using first differences of the variables, is one
solution suggested by Studenmund and Cassidy (1987, p. 195) for
severe multicollinearity. In the present study, this was defined as
the value of the variable at the end of the third mandatory period
less its value at the end of the second mandatory period.
Before deriving the model based on first differences, again
consideration was given to whether separate models should be
derived for the Supportive and Reluctant Companies. As before this
was achieved by including dummy variables in the first differences
model.
When deriving the model based on first differences the constant
(intercept) term should be excluded from the regression equation if
Ohlson's model is assumed to be stationary over time (see also,
Maddala, 1977, p. 192). Ohlson asserts that his model is
stationary over time if the model is perfectly defined in terms of
book value, earnings and dividends. However, he acknowledges that
his model can be extended to allow for other valuation relevant
information and he makes no comments about the stability of this
other information over time. Furthermore, Neter, Wasserman and
Kutner (1985, pp. 163-164), and Studenmund and Cassidy (1987,
251
pp. 163-164) stated that, even if the theory specifically supports
the ommission of the constant term, it is more prudent to include
the constant in the regression equation. Neter, Wasserman and
Kutner (1985) stated that
"even when it is known that the regression function must go through the origin, the function might not be linear or the variance of the error terms might not be constant. Often one cannot be sure in advance that the regression function goes through the origin, and it is then safe practice to use the general model. If the regression does go through the origin, bo will differ from 0 only by a small sampling error, and unless the sample size is very small, use of the model has no disadvantages of any consequence. If the regression does not go through the origin, use of the general model will avoid potentially serious difficulties resulting from forcing the regression through the origin when this is not appropriate." (pp. 163-164)
As a result of the above discussion, the model based on first
differences was derived with and without a constant term in the
regression equation. Details of both models are set out in Table
Despite the reduction in the severity of the multicollinearity
problem in the deflated models, other violations of the regression
assumptions are still present. In a recent article, Barth, Beaver
and Stinson (1991) suggested that estimation in per share form may
273
be a more appropriate adjustment for heteroscedasticity than book
value deflation. Given this view, the basic model for periods 1
and 2 for the Supportive Group was derived using a per share form
of the model. Although, there is less evidence of
heteroscedasticity the models showed evidence of severe
multicollinearity. Details of VIFs for each of the models are
given in Appendix 8.H. In view of the level of multicollinearity
in these models, further analysis of the models in per share form
would appear to be unhelpful.
Generally, violations of the regression assumptions (e.g.,
nonlinearity, multicollinearity, heteroscedasticity) are dealt with
by applying transformation to the variables in the model (see
Neter, Wasserman and Kutner, 1985, pp. 132-133). Given that this
approach assumes that the original relationship between the
accounting data and share prices is nonlinear, it is in direct
conflict with Ohlson's model, which is derived from a linear
mapping from accounting data to share prices. Thus, in the
context of the present study, transformation is not an acceptable
solution. In a final attempt to improve the statistical validity
of Ohlson's basic model, a further classification of the companies
was undertaken.
274
8.3.4 Valuation Models for each Beta Category
The Supportive and Reluctant Companies were classified into similar
risk categories. The systematic risk (beta) associated with each
company was used to classify the companies. Each company's beta
was extracted from the Datastream database. Appendix 8.1 shows the
distribution of beta for the Supportive and Reluctant Companies.
For both groups, the distributions approximate a normal
distribution, as shown by the K-S test in Appendix 8.1. Using the
range from each distribution, the sample of companies in each
group was divided into 5 risk categories. Details of the beta
range and the number of companies in each category are given in
Table 8.23.
TABLE 8.23
COMPANIES CLASSIFIED BY BETA
SUPPORTIVE COMPANIES RELUCTANT COMPANIES
Beta Range No. of Cos Beta Range No. of Cos
CATEGORY12345
<.511.511-.725 .726-.940 .941-1.155 >1.155
713506020
.528-.707
. 708-.888
.889-1.069 >.1.069
<•528 921484219
275
and 5 is too small for meaningful regression analysis. So, the
basic model was derived for categories 3 and 4 (above), using data
from the first period. An examination of the 4 models reveals
evidence of severe multicollinearity and heteroscedasticity.
Appendix 8.J presents details of VIF's associated with each of
these models and the standardised residual plots are given in
Appendix 8 .K. As this approach failed to provide improved
statistical models, no further analysis of these models was
undertaken.
Given the issues raised in relation to the empirical application of
Ohlson's model in its basic form, alternative specifications of the
model were investigated in an attempt to derive a better specified
model. Details of the specific results are presented in Appendix
8 .L. Overall the outcome of these investigations provided no
significant additional conclusions nor was it possible to derive a
consistently better specified model.
Table 8.24 presents a summary of the models derived for the
Supportive and Reluctant Companies which relied on the basic form
of Ohlson's model. It identifies which models are analysed in
detail in the remainder of this chapter. Excluded models are
identified and the reasons why a model is excluded are given.
Table 8.23 shows that the number of companies in categories 1, 2
276
TABLE 8.24
SUMMARY OF SUPPORTIVE AND RELUCTANT COMPANIES' MODELS
Included/ Reason why a Model is Included/ Excluded Excluded
Supportive Companies
BMP1 Included Basic theoretical modelBMP2 Included Basic theoretical modelFD (with constant) Excluded Theoretically unsoundFD Included Less evidence of multicollinearityD1BMP1 Included Severe multicollinearity eliminatedD1BMP2 Included Severe multicollinearity eliminatedD2BMP1 Included Severe multicollinearity eliminatedD2BMP2 Included Severe multicollinearity eliminatedD2FD Included Improved scatterplotPSBMP1 Excluded Severe multicollinearityPSBMP2 Excluded Severe multicollinearityB3BMP1 Excluded Severe multicollinearityB4BMP1 Excluded Severe multicollinearity
Reluctant Companies
BMP1 Included Basic theoretical modelBMP 2 Included Basic theoretical modelFD (with constant) Excluded Theoretically reasonsFD Included Severe multicollinearity eliminatedD1BMP1 Included Severe multicollinearity eliminatedD1BMP2 Included Severe multicollinearity eliminatedD2BMP1 Included Severe multicollinearity eliminatedD2BMP2 Included Severe multicollinearity eliminatedD1FD Included Severe multicollinearity eliminatedD2FD Included Severe multicollinearity eliminatedB3BMP1 Excluded Severe MulticollinearityB4BMP1 Excluded Disimproved scatterplot
NoteDefinitions of abbreviated titles are given in Appendix 8 .G
A summary of the extent to which the analysed models satisfy the
assumptions of the regression model is given in Table 8.25.
277
TABLE 8.25
EXTENT TO WHICH THE ANALYSED MODELS SATISFY THE REGRESSIONASSUMPTIONS
REGRESSION ASSUMPTIONS (p. 238)
(2) (3)-(6) (7)Supportive Companies
BMP1 BMP 2 FDDlBMPl D1BMP2 D2BMP1 D2BMP2 D2FD
Reluctant Companies
BMP1 BMP2 FDDlBMPl D1BMP2 D2BMP1 D2BMP2 D1FD D2FD
where
V = regression assumption/s is/are violated.
S = appears to be no gross violation/s of the regression assumption/s.
Given the problems encountered in deriving a statistically valid
model before presenting and interpreting the results, the next
section dicusses the implications of the regression assumptions
being violated.
V V VV V SV V SV V sV V sV V sV V sV V sV s s
V V VV V VV V VV V sV V sV V sV V sV S V
278
8.3.5 Implications of Violations of the Regression Assumptions
Table 8.2 5 shows that the assumption that the error term is normal
is breached in all the models analysed. However, with large sample
sizes, the Central Limit Theorem tends to justify the assumption of
normality for the error term. Thus, in this study it is possible
that the nonnormality of the error term can be attributed to
misspecification of the model, and/or heteroscedasticity rather
than nonnormality (see Norusis, 1983, p. 149).
Table 8.25 shows for the majority of the models assumptions (3) to
(6) are violated. As the plot of the standardised residuals
against the predicted value of the dependent variable was used to
test all of the forementioned assumptions it is difficult to
determine precisely which assumption/s is/are violated. In the case
of the linearity assumption the underlying theory (i.e. Ohlson's
(1989) model) specified this functional form. The problem
associated with using the incorrect functional form is that an
explanatory variable may appear to be insignificant or have an
unexpected sign (see Studenmund and Cassidy, 1987, p. 144).
Again, based on the evidence in Table 8.25, it is likely that,
for a large number of the models, heteroscedasticity exists (i.e.
assumption 4 is violated). Studenmund and Cassidy (1987, p. 245)
commented that this problem is particularly pertinent in cross
279
sectional studies. When using ordinary least squares (OLS) to
derive a regression model, heterosecdasticity gives rise to the
following consequences:
it does not cause bias in the OLS coefficients
estimates; but,
it causes OLS to underestimate standard errors of the
estimated coefficients, leading to overestimated t
values.
The possibility that the error terms are serially correlated (i.e.
assumption (5) is violated), generally occurs in time series
studies (see Studenmund and Cassidy (1987, p. 209). However, with
cross sectional data, the error terms may be affected by general
economic conditions which cause the error terms to be correlated.
In essence, the latter point can be viewed as an omitted variable
which is now considered.
The analysed models may suffer from an omitted variable problem
(i.e. assumption (6) is violated). The omission of an important
variable causes bias in the estimates of the coefficients of the
variables included in the equation, to the extent that the omitted
variable is corelated with included variables. If included
280
variables are positively correlated with an omitted variable, this
causes upward bias in the estimated coefficients. A negative
correlation reverses the direction of the bias.
As multicollinearity remains a problem for some of the models
analysed, its consequences are now considered. Studenmund and
Cassidy's (1987, pp. 184-187) overview of these consequences is
summarised below.
The estimates of the regression coefficients remain
unbiased.
The variances of the estimated regression coefficients
increase. As a result, the estimated coefficients,
while still unbiased, now come from distributions with
much larger variances. This is the major consequence
of multicollinearity which makes it very difficult to
identify precisely the separate effects of highly
correlated variables.
The computed t values tend to be distorted. As the
variances are increased, this causes the standard
errors to be increased which leads to a fall in the
t values. Furthermore, as the increased variances
causes the estimated coefficients to be further from
the true parameter value this "pushes" a portion of the
281
distributions of the estimated coefficients towards
zero, making it more likely that the t values will be
insignificant or have an unexpected sign. This
"pushing" can be in both directions, so
multicollinearity can also lead to higher than expected
estimated coefficients and thus, higher t values. The
latter effect is usually overshadowed by the increased
standard errors.
The estimated coefficients are very sensitive to
changes in the explanatory variables and the sample
observations.
2The overall fit of the equation, as measured by R or
the F test will be largely unaffected.
The estimation of the coefficients and standard errors
of orthogonal variables in the model will be
unaffected.
The previous discussion shows that the implications of the
regression assumptions being violated are varied. This makes any
interpretation of the results very difficult, as it is not possible
to determine which violation is dominant.
The next section gives a detailed presentation of the results.
282
8.4 RESULTS FROM MODELS
When examining the results, the varying implications of violations
of the regression assumptions (as discussed in 8.3.5, pp. 279-282)
on the results must be kept in mind.
The commonly used measure of goodness of fit of a linear model is2 2 R (see Neter, Wasserman and Kutner, 1985, p. 241). The R is
the proportion of the variation in the dependent variable explained
by the set of independent variables. If all the observations fall2on the regression line, R is 1. If there is no linear
2relationship between the dependent and independent variables, R
is 0 (see Neter, Wasserman and Kutner, 1985, pp. 96-97).
2An F test is used to test the significance of R . When the
regression assumptions are met, the ratio of the mean square
regression to the mean square residual is distributed as an F
statistic with p and n-p- 1 degrees of freedom (where p = number of
variables in the regression equation and n = the number of
observations). Where the probability associated -with the F
statistic is small, the hypothesis that the relationship proposed2is caused by chance may be rejected. Details of R and the
associated F statistic for each of the models for the 2 groups of
companies are presented in Table 8.2 6 (figures have been rounded to
Note * denotes variables which are significant at the 5% level of significance, and
** denotes variables which are significant at the 1 % level of significance.
The analysis now focuses on each independent variable and on the
models in which the variables were significant.
295
8.6.2 CLSEHC
The previous section identified CLSEHC as the most significant
explanatory variable for both groups of companies. The variable is
significant in each model. Thus, the major explanatory variable
for a company's value is consistent across the 2 groups of
companies. Table 8.29 reveals a positive relationship for both
groups between this variable and the dependent variable in each
model. This is supported by the simple correlation coefficient
given in Appendix 8 .E for each of the models. Thus, the higher the
value of CLSEHC the higher the Company Value. This appears
reasonable. Ohlson (1989) described book value as an anchor in the
valuation of a company. The finding in this study cannot be
compared directly with other valuation studies as the variable
CLSEHC has not been widely used in other studies.
8.6.3 CCADJBV
8.6.3.1 Supportive Companies
CCADJBV which measures cumulative unrealised holding gains is
significant in 5 of the 8 models (see Table 8.29). A negative
relationship between this variable and the dependent variable is
observed in 4 of the models and a positive relationship in the 5th
model. To assess the reasonableness of this result, the findings
from the individual models are considered.
296
The basic models for both periods show a negative relationship
between CCADJBV and Company Value. However, an examination of
Appendix 8.E.1 reveals that the simple correlation coefficient is
positive. The switch in the sign may be caused by severe
multicollinearity in both of these models. Table 8.7 shows that
the VIFs associated with CCADJBV is over 10 in both models.
The basic model deflated by Sales in period 1 also reveals a
negative relationship between CCADJBV and the dependent variable.
Again, this may be caused by multicollinearity as the sign switched
when the variable was included in the multivariate model. However,
the degree of multicollinearity in this model is not as high as in
the undeflated basic models. Table 8.20 shows that 7.079 is the
maximum VIF associated with any variable in the model, and the VIF
for CCADJBV is 5.358. So, it is possible that the true relationship
is negative.
The model based on first differences also shows a negative
relationship between (changes in) CCADJBV and Company Value. Again,
the results of this model may be distorted by severe
multicollinearity. Table 8.11 reveals the VIF associated with
CCADJBV is 10.67 in this model. However, the sign of the
relationship remains unchanged when CCADJBV is included in the
multiple regression model.
297
The basic model deflated by CLSEHC in period 2 is the only model
which shows a significant positive correlation between CCADJBV and
the Company Value. In the case of this model there is no evidence
of a multicollinearity problem (see Table 8.20) and Appendix 8.E.4
which shows that the simple correlation coefficient is positive.
The 4 models showing a negative relationship included the variable
CLSEHC. It was observed earlier that this variable is significant
in all models and captures the HC value of a company's net assets.
Appendix 8 .E reveals that with the exception of the first
difference model, there is a very high correlation between the
variables CCADJBV and CLSEHC. Thus, it is possible that the
incremental influence of CCADJBV on Company Value is negative. The
reasonableness of this possibility is now considered.
The discussion in Chapter 7 (see 7.3.1, pp. 220-226) on holding
gains revealed that a negative relationship between input price
changes and operating cash flows may exist for some firms. Where
firms are not in a position to pass on price increases, holding
gains are regarded in a negative light. Evidence of this situation
was observed by Hopwood and Schaefer (1989) (see Chapter 4. pp.
146-147). Thus, the findings in the present study suggest that
Supportive Companies may have been unable to pass on price
increases, so a negative relationship may be valid.
298
The model which shows a positive association between CCADJBV and
Company Value excluded the variable CLSEHC. Here CCADJBV may be
measuring not just cumulative unrealised holding gains but also
reflecting the value of the company's net assets. As the
relationship is positive, this suggests that the latter influence
is the stronger in the valuation model.
8.6.3.2 Reluctant Companies
The analysis of CCADJBV shows that the variable is significant in 4
of the 9 models and it has a positive coefficient in all 4 models
(see Table 8.29). Furthermore, multicollinearity appears to be a
problem for only 1 of these models (i.e., BMP1, see Table 8.7). 3
of the 4 models (i.e., D2BMP1, D2BMP2, D2FD) exclude CLSEHC. In
addition, an examination of the simple correlation coefficient in
Appendix 8.E for each of the models shows a positive association
between CCADJBV and Company Value.
Based on earlier comments, a positive relationship is reasonable.
It is also possible that the Reluctant Companies may have viewed
cumulative unrealised holding gains in a positive light. The
discussion in Chapter 7 (see 7.3.1 pp. 220-226) showed that where
companies can respond positively to price increases, holding gains
may reflect increased future operating cash flows. In this
situation, a positive association between unrealised holding gains
and Company Value is reasonable.
299
In the case of both the Supportive and Reluctant Companies, it is
not possible to determine the extent to which a company's ability
to respond to price changes explains the direction of the
relationship between CCADJBV and Company Value, as this study did
not isolate a company's ability to respond to price changes. The
importance of undertaking such a step in future research studies is
discussed in Chapter 9 (see 9.5, pp. 336-337).
8.6.4 EARNHC
8.6.4.1 Supportive Companies
For the Supportive Companies, EARNHC is significant in 6 of the 8
models (see Table 8.27) and overall it is ranked second (see Table
8.28). The variable is significant in the deflated basic models
for both periods. These 4 models show a positive association
between EARNHC and the dependent variable, this agrees with the
simple correlation coefficients presented in Appendices 8.E.3 and
8.E.4. Numerous other research studies (see Chapters 3 and 4)
provide evidence of a positive association between accounting
earnings and company values. These studies are based on the
premise that accounting earnings are useful in predicting cash
flows (see Watts and Zimmerman, 1986, pp. 65-66).
300
EARNHC (i.e., change in) is a significant variable also in the
first difference model and the first difference model deflated by
CLSEHC. In both these models the (change in) EARNHC coefficient is
negative. The negative relationship may be caused by
multicollinearity as the VIF associated with 1 variable in each
model is over 10 (see Tables 8.11 & 8.20), and VIF associated with
EARNHC is 4.534 (FD) and 5.507 (D2FD). However, an examination of
the simple correlation between (change in) EARNHC and Company Value
reveals a negative relationship for both models (see Appendices
8.E.2 and 8.E.5). It does not appear economically reasonable that a
(change in) EARNHC is negatively associated with a (change in)
Company Value. However, it is possible that it may be caused by
the instability of Ohlson's (1989) model over time (see Chapter 9,
9.4, pp. 334-335).
8.6.4.2 Reluctant Companies
EARNHC is significant in 4 of the 9 models analysed and overall, it
is ranked third (see Tables 8.29 and 8.28). It appears that EARNHC
is less significant for the Reluctant Companies than the Supportive
Companies. The variable is statistically important in the deflated
basic models for both periods and the coefficient is positive in
each of the models. As previously noted, a positive relationship
accords with the results from previous empirical studies. Also,
an examination of the VIFs (see Table 8.21) associated with the 4
deflated basic models suggests that the results are not distorted
301
by severe multicollinearity and the simple correlation coefficients
given in Appenices 8.E.3 and 8.E.4 are positive.
8.6.5 CCADJE
8 .6.5.1 Support ive Compan ie s
Table 8.29 shows that CCADJE which measured unrealised holding
gains of the current period was statistically significant in the
first difference model and the sign of the relationship is
positive. However, an examination of the simple correlation
coefficient (see Appendix 8.E.2) reveals a negative relationship.
In this case the switch in sign may be caused by severe
multicollinearity, as Table 8.11 shows high VIFs associated with
some of the variables in the model and a VIF of 8.414 for CCADJE.
Therefore, it is not possible to interpret the findings in
meaningful way in respect of CCADJE. A negative relationship would
be consistent with the earlier evidence for the Supportive
Companies relating to cumulative unrealised holding gains (see
8 .6.3.1. pp. 296-299).
302
8.6.5.2 Reluctant Companies
CCADJE is significant in the basic model deflated by sales for
period 2. This model shows no evidence of severe multicollinearity
(see Table 8.21) and a positive association is observed between the
dependent and independent variable. Appendix 8.E.3 also shows that
the simple correlation coefficient is positive. This accords with
the evidence discussed previously for Reluctant Companies relating
to cumulative unrealised holding gains (see 8 .6.3.2, pp. 299-300).
8.6 .6 DIV
In accordance with Ohlson (1989), the DIV variable is defined as
dividends for ordinary shareholders net of capital contributions.
Viewing DIV from Ohlson's (1989) perspective, a negative
relationship between DIV and Company Value would be expected.
According to Ohlson, the prediction of future earnings depends
partially on current dividends. He comments that book values
relate directly to current dividends, as dividend payments reduce
current book values. In this context, an increase in current
dividends would reduce future earnings as the earnings base of the
company would be reduced. Therefore, a negative relationship
between DIV and Company Value is predicted. Following Ohlson's
reasoning, new capital increases book values, which results in an
303
increase in the company's earnings potential and so new capital
(negative dividends) would be positively correlated with Company
Value.
However, other research studies e.g., Aharony and Itzhak (1980),
Asquith and Mullins (1983), Brickley (1983), and Dielman and
Oppenheimer (1984), which focused on the relationship between cash
dividends and share returns, found a positive association between
the variables. Tisshaw (1982), in his valuation study, found a
positive association between dividends and share values. These
findings can be explained by investors viewing dividends as a
return on their investment. In addition, Tisshaw (1982, p.159)
asserted that investors have a preference for immediate income due
to their desire to reduce uncertainty. Furthermore, Foster (1986,
p. 388) commented that a positive association is consistent with
the capital market using dividend releases as a positive signal
from management about the future earnings prospects of the company.
The latter comments suggest that increases in cash dividends would
be viewed favourably by the capital market. This conflicts with
Ohlson's views.
An examination of Table 8.29 shows that for the Supportive
Companies, the DIV variable is insignificant in all models and it
is ranked last (see Table 8.28).
304
In the case of the Reluctant Companies, DIV is a significant
variable in all models (see Table 8.29) and Table 8.28 shows that,
overall, it ranks second. All the models show a positive
relationship between DIV and Company Value. An examination of the
simple correlation coefficient (see Appendx 8.E) supports this
positive relationship.
The earlier analysis of Table 8.28 indicates that EARNHC is less
significant to the Reluctant Companies than to the Supportive
Companies. Therefore, for the former group of companies, it is
possible that, empirically, DIV is capturing an income effect
normally associated with the earnings variable. In this instance a
positive relationship between DIV and Company Value would not be
unreasonable.
8.6.7 Joint Influence Of CCADJBV and CCADJE
The previous analysis considered whether CCADJBV and CCADJE had
significant explanatory power as individual variables. It is
possible that jointly they may have incremental explanatory power.
To test this, the models showing insignificant coefficients for
both inflation accounting variables were re-examined. For each of
these models, new regression equations were derived which excluded2the inflation accounting variables (Reduced Model). The R2associated with each of the reduced models was compared with the R
of the corresponding original models (Full Model). An F test was
305
performed to determine if there was a significant difference in the2R s. Details of the differences and the associated F test are
presented in Table 8.30 (figures are rounded to 3 decimal places).
TABLE 8.30
COMPARISION OF THE R2 OF THE FULL MODELS AND THE REDUCED MODELS
SUPPORTIVE COMPANIES
MODEL
D1BMP2D2BMP1D2FD
FULL MODEL REDUCED MODEL CHANGE IN CHANGE IN SIGN. OF
.707
.416
.692
.700
.410
.691
-.007-.006- . 0 0 1
1.772.698.245
F CHANGE
.174
.499
.783
RELUCTANT COMPANIES
MODEL FULL MODEL REDUCED MODEL CHANGE IN CHANGE IN SIGN. OF
F CHANGE
BMP2D1BMP1FDD1FD
.735
.736
.519
.375
.730
.727
.519
.357
.005
.009
. 000
.018
1.3002.231.013
1.971
.276
. 1 1 1
.987
.143
An examination of Table 8.30 reveals that jointly the inflation
accounting variables do not appear to possess IEP.
306
The next section examines the implications of the evidence
discussed in 8.5 and 8 .6 for the utility of inflation accounting
data to investors.
8.7 IMPLICATIONS OF MODELS FOR THE UTILITY OF INFLATION ACCOUNTING
DATA
Any discussion on the implications of the previous models' findings
for the utility of inflation accounting data, must keep in mind
that these models suffered from econometrical problems. For
example, multicollinearity may have caused some variables to appear
insignificant or have an unexpected sign, while heteroscedasticity
may have lead to the t values of some variables being overstated
(see 8.3.5, pp. 279-282). Table 8.25 revealed for all but 1 model,
there was evidence that more than 1 regression assumption was
breached. This makes it difficult to draw any firm conclusions on
the utility of inflation accounting data. Despite this difficulty,
given the number of models examined, it is hoped that the analysis
will provide insight to the utility of inflation accounting data.
For 13 of the 17 models analysed, the models explain over 50% of
the variation in the dependent variable. This suggests that the
independent variables included in Ohlson's model reflect
characteristics which investors consider relevant in company
valuation. The Historical Cost Value of Closing Shareholders'
307
Equity is the most significant explanatory variable, followed by
Historical Cost Earnings for the Supportive Companies and Dividends
for the Reluctant Companies. Thus, for both groups a stocks and
flow measure are value relevant. This implies that both balance
sheet items and income statement variables are useful in assessing
future cash flows, this concurs with the views of Brennan and
Schwartz (1982a, 1982b), Ohlson (1989), Ou and Penman (1989) and
Brennan (1991).
This study sought to provide evidence on the IEP of inflation
accounting data (see 1.4, p. 10). The balance of evidence from the
models analysed, suggests that the inflation accounting variables
studied, have IEP. In particular, the variable measuring
cumulative unrealised holding gains (CCADJBV) is significant in 9
(53%) of the 17 models analysed. This supports the view that
information on holding gains is relevant to investors' information
needs.
The variable (CCADJE) measuring unrealised holding gains of the
period is significant in only 2 (12%) of the models. The poorer
performance of current unrealised holding gains may be caused by
considerable "noise" in the measurement of current unrealised
holding gains. The effect of measurement errors may be diminished
over cumulative periods, thereby making cumulative unrealised
holding gains a more reliable measure. For example, in a single
period, under/over estimation of the effects of price changes may
308
prevent the estimates from being used, while over a number of
periods, less than perfect correlation between the estimation
errors over time, would lead to the estimation errors being
randomised, and therefore, the utility of the cumulative measures
could be improved.
Another objective of the study was to determine whether or not
company policy towards the disclosure of inflation accounting data
in the premandatory period is associated with the explanatory power
of this data (see 1.4, pp. 11 ). This was achieved by dividing the
sample of companies into 2 groups, i.e., companies which
voluntarily disclosed inflation accounting data prior to the
mandatory period (Supportive Companies) and companies which
commenced disclosure in the first mandatory period (Reluctant
Companies). The analysis showed that separate models were required
for the 2 groups of companies. There is some evidence showing a
difference in the importance of the inflation accounting
disclosures between the 2 groups. CCADJBV is significant in 5
(62.5%) of the 8 models for the Supportive Companies, but only in 4
(44%) of the 9 models for the Reluctant Companies (see Table 8.30).
Also, CCADJBV is ranked 1 place higher for the Supportive Companies
than the Reluctant Companies. CCADJE is significant in only 1 model
for both groups of companies, it also received a higher ranking
for the Supportive Companies than the Reluctant Companies.
309
The earlier analysis showed (see Table 8.22) that multicollinearity
is less evident in the Reluctant Companies' models. Table 8.31
shows the VIFs associated with the inflation accounting variables
in each of the models analysed.
TABLE 8.31
COMPARISION OF THE VIF FOR THE CCADJBV AND CCADJE VARIABLES
recognised that inflation accounting would involve a substantial
learning process on the part of preparers and users. In addition,
many of the inflation accounting studies reviewed in Chapter 4
(e.g., Beaver and Landsman, 1983, Appleyard and Strong, 1984)
cited the possible existence of a learning lag as the reason for
the lack of evidence supporting the utility of inflation accounting
data. To test for evidence of a learning effect the valuation model
was derived for 2 periods for the Supportive and Reluctant
325
Companies. The empirical findings of the study regarding whether or
not a learning lag exists in relation to inflation accounting data
are presented in 9.3.4 (p. 331).
Having set out the objectives of the study and how these were
achieved the next section presents a summary of the findings from
the empirical analysis. It considers the implications of these
findings for the utility of inflation accounting data, while
keeping in mind the study's limitations.
9.3 RESEARCH FINDINGS AND THEIR IMPLICATIONS
9.3.1 Introduction
Given the difficulties encountered in deriving a statistically
valid model, it was decided to focus on the findings from 17
models. Although, these models still suffered from econometric
problems, it was hoped, by examining the results from a number of
models, that overall, an opinion could be formed on the
significance of the accounting variables.
326
9.3.2 Evidence on the Explanatory Power of the Accounting Variables
The analysis revealed that separate models were required for the
Supportive and Reluctant Companies. This suggests an underlying
difference in the determinants of share prices for each group.
Of the 17 models selected, 8 related to the Supportive Companies
and 9 to the Reluctant Companies. A statistically significant
relationship existed between Company Value and the accounting
variables for all of the Supportive Companies' models and 8 of the
Reluctant Companies' models.
Over 50% of the variation in the dependent variable was explained
by 6 of the Supportive Companies' models and 7 of the Reluctant
Companies' models. This evidence appears to indicate that, for
both groups of companies, the model captures accounting variables
which are used by investors in setting share prices.
The analysis showed that, for both groups, the Historical Cost
Value of Shareholders' Equity is the most value relevant variable,
followed by a historical cost measure of income. This supports the
relevance of both balance sheet and income statement measures in
determining share values.
327
In addition, evidence was found supporting the IEP of the inflation
accounting data. The variable measuring cumulative unrealised
holding gains was significant in 5 models for the Supportive
Companies and in 4 models for the Reluctant Companies. This
supports the assertion that the variable cumulative unrealised
holding gains is important to investor decision making.
Evidence supporting the IEP of unrealised holding gains for the
current period is very weak. For both groups of companies, the
variable is significant in only 1 model. It is possible that
measurement errors may significantly distort the assessment of this
variable when the measurement is for 1 period, while these errors
may be randomised when cumulative unrealised holding gains are
being measured.
Another finding emerging from the analysis is that the direction of
the relationship between the inflation accounting variables and
Company Value was not consistent across the 2 groups. In general,
a negative relationship was observed for the Supportive Companies.
This may be explained by these companies being unable to respond
positively to price increases. In this situation, price rises
reflect future input costs which must be borne by the companies and
which are likely to result in decreased future operating cash
flows, which would have a negative impact on share prices.
328
Therefore, for these companies, there is a strong case for treating
unrealised holding gains as capital maintenance adjustments and
excluding them from income.
For the Reluctant Companies, the results showed a positive
correlation between the inflation accounting variables and Company
Value. This evidence suggests that, for these Companies, price
increases reflect future increases in operating cash flows, which
would have a positive impact on share prices. In this instance, the
holding gains could justifiably be included in income.
The finding that the direction of the relationship between the
inflation accounting variables and Company Value varied across the
2 groups has implications for research designs which seeks to
assess the utility of inflation accounting data. If a cross
sectional approach is used, it should be applied to companies with
a homogeneous response to price changes. Otherwise, any
differential responses to the inflation accounting data within a
group will tend to offset one another, thereby reducing the power
of the cross sectional model to detect an IEP for the inflation
accounting data.
In the context of this study, as data were not gathered to allow
the sample companies to be split on the basis of their ability to
respond to price changes, it is likely that both groups of
companies contain companies with differential price responses. If
329
this is the case, then the ability of the models to detect
evidence supporting the IEP of the inflation accounting variables
may have been diminished. Furthermore, the extent to which this has
occurred may have varied across the 2 groups of companies.
Therefore, any inferences regarding the utility of inflation data
for the 2 groups are potentially subject to this limitation of the
study.
9.3.3 Findings Relating to a Company's Policy Towards the
Disclosure of Inflation Accounting Data
The results showed that a company's policy towards disclosing
inflation accounting data may be associated with the explanatory
power of this data. There is some evidence suggesting that the
significance of the inflation accounting disclosures is greater for
the Supportive Companies than for the Reluctant Companies. CCADJBV
was found to be significant in 5 (62.5%) of the 8 models for the
Supportive Companies, but only in 4 (44%) of the 9 models for the
Reluctant Companies. Furthermore, CCADJBV and CCADJE received a
higher ranking for the Supportive Companies than the Reluctant
Companies. The forementioned evidence implies that commitment
towards disclosure appears to result in more reliable estimates
which are then used by investors.
330
9.3.4 Evidence of a Learning Effect
There is no evidence of a learning effect for either group of
companies. This may be explained by the use of a relatively short
test period. The study was limited to 2 test periods as the number
of companies disclosing inflation accounting data thereafter,
dropped significantly (see 7.5, p. 232). On the other hand, it must
be recognised that the Supportive Companies disclosed inflation
accounting data in the premandatory period. However, it is likely,
that they only disclosed the data for a few years prior to the
mandatory period. It is also, possible that the disclosures may
have been significantly different from the disclosures required
under SSAP 16.
9.3.5 Impact of the Study's Limitations
In interpreting the above findings, in relation to the utility of
inflation accounting data, it should be noted that the limitations
of the study prevent generalisations. First, the analysis was
limited to large UK industrial companies required to comply with
SSAP 16. Thus, generalisations to companies that differ
economically from those used in the present study may be
inappropriate.
331
Second, the study was only concerned with assessing the utility of
inflation accounting data to investors. Although, there is
evidence supporting the utility of this data to investors this does
not test the relevance of the data to other users. As users of
financial reports are a heterogeneous group, possessing potentially
different abilities and decision models, it is possible that the
inflation accounting data may be of greater/lesser importance to
these other user groups.
Third, as the analysis is confined to 2 test periods the findings
must be qualified in this respect. It is still feasible that over
a longer time period, preparers and users would become more
familiar with inflation accounting data and this would lead to
greater utilisation of the data.
Fourth, this study confined itself to testing the explanatory power
of unrealised holding gains. Other inflation accounting variables
may have explanatory power (e.g., current cost operating profit).
So, when evaluating the utility of inflation accounting data, the
fact that this study was limited to unrealised holding gains should
be borne in mind.
Finally, in interpreting this study's findings, the implications
of the econometrical problems encountered in empirically applying
Ohlson's model must be considered. As it was very difficult to
pinpoint the impact of the econometrical problems measures, it was
332
decided to analyse the results from 17 models. It was hoped by
observing consistency in the models' findings that conclusions
could be drawn on the utility of inflation accounting data.
9.4 IMPLICATIONS OF THE LIMITATIONS OF OHLSON'S MODEL.
9.4.1 Introduction
Chapter 6 identified the absence of theoretically developed
valuation models as a major problem with the valuation approach. By
using Ohlson's model, this study provides evidence on the practical
application of this theoretical model. As few studies have applied
Ohlson's model a general discussion on the implications of the
limitations of Ohlson's model appears warrented. This discussion
considers the implications for - the model's validity, and its
application.
9.4.2 The Validity of Ohlson's Model
Ohlson assumes a linear relationship between share values
(dependent variable) and book values, earnings, and dividends
(independent variables). However, the specification analysis
performed on all models in this study questions the validity of
this assumption. The plots of the standardised residuals against
the predicted values of the dependent variable show evidence of an
333
observable pattern in these plots (see Appendices 8.A and 8.B) This
could be attributed to a nonlinear relationship existing between
the dependent and the independent variable. It may be that the
linearity assumption is unsatisfactory as it allows for the
possibility of negative share values which is inappropriate in the
context of limited liability (see Brennan, 1991). Accordingly,
Ohlson's model may be suited only to successful companies as it
fails to consider the possibility of bankruptcy.
The evidence from the first differences models indicated that
Ohlson's model may not be stationary over time. The constant term
was found to be a significant variable for both groups of
companies. This suggests that the mean effect of the variables
captured by the constant term is not stationary. A further
indication that Ohlson's model is not stationary over time is that
the direction of the relationship between EARNHC and Company Value
is not always in the predicted direction. In particular, in the
first differences models, a negative relationship is observed
between the variables. This association could be attributed to the
instablity of the EARNHC coefficient. Instability in the model may
also explain the variation in the significance of the individual
variables in the test periods. Evidence of instability in Ohlson's
model is consistent with the findings from other valuation studies
(see Lev, 1989). Brennan (1991) suggested that the instability of
regression coefficients across years is symptomatic of the
omission of important variables. In Chapter 8 (see p. 251) it was
334
noted that Ohlson acknowledges that his basic model can be extended
to include additional valuation relevant variables. However, he
makes no comment on the implications of the omission of these
variables for his basic model.
9.4.3 The Application of Ohlson's Model
Despite using a wide variety of measures, it was not possible to
derive a statistically sound form of the model within Ohlson's
theoretical framework. The analysis in Chapter 8 and Appendix 8.L
revealed that the models derived suffered from econometrical
problems. As the consequences of these problems are difficult to
specify, this makes it difficult to interpret the models findings.
When drawing conclusions on the utility of inflation accounting
data the limitations of Ohlson's model should be kept in mind. The
next section presents the conclusions that may be drawn from the
empirical analysis.
9.5 CONCLUSIONS AND DIRECTIONS FOR FUTURE RESEARCH
The evidence presented in this study provides some support for the
IEP of inflation accounting data. This suggests that the inflation
accounting data contains information relevant to investors for
investment decision making in addition to HCA data.
335
This conclusion should be of interest to accounting policy makers.
In promulgating the disclosure of inflation accounting data, both
the ASC and the FASB expressed their desire for research to assess
the utility of this data.
Evidence in this study supporting the utility of inflation
accounting data is in contrast with the findings of the majority of
inflation accounting studies reviewed in Chapter 4. However, many
of the previous studies were subject to several methodological
problems, as discussed in Chapter 6. The present study attempted
to minimise these problems and employed an approach which built on
the findings of earlier studies. As the research design used in
this study is quite different from the approaches taken in the
earlier studies, its findings are not directly comparable with
those of previous studies.
However, this study's findings suggest that the debate on
inflation accounting is far from closed. More research is needed
before any final conclusions can be drawn. In particular, the
present study provides a basis for further exploration, as
discussed below.
This study confirms that the evaluation of the utility of inflation
accounting data is a complex issue. Differences in commitment
towards disclosure and ability to respond to price changes lead to
different implications for companies. Studies which ignore these
336
differences by indiscriminately grouping companies, may be biased
against detecting evidence supporting the utility of inflation
accounting data. Diversity with respect to the effects of
inflation means that future studies should use greater refinement
in the classification of companies to effectively assess the
utility of inflation accounting data.
Finding that some companies were committed to the disclosure of
inflation accounting prior to the mandatory period suggests a
differential behaviour among companies with respect to inflation
accounting. This study provides evidence which indicates that this
differential behaviour may have effected the utility of the
inflation accounting data. This finding has implications for
accounting policy makers, as it implies that commitment among
companies to accept accounting policy decisions may vary and this
variation may affect the utility of the accounting disclosures.
Research should be undertaken which would help accounting policy
makers to predict the response of companies to accounting policies
decisions on inflation accounting. Developments in the area of
positive accounting theory (PAT) provides a framework for this
research - (see Watts and Zimmerman, 1986 for a discussion of this
theory). Identification of the factors which determine a company's
policy towards the disclosure of inflation accounting data, would
337
help accounting policy makers to predict the economic and social
consequences of their policy decisions in respect to inflation
accounting.
Furthermore, the evidence may be useful in classifying companies
into more homogeneous groups. For example, by grouping together
companies that are favourably/unfavourably disposed towards the
disclosure of inflation accounting data may increase the power of
the tests used by researchers to evaluate the utility of this data.
This study suggests that more evidence is required on assessing the
utility of cumulative inflation accounting adjustments. Previous
studies have focused on the utility of inflation accounting
adjustments to HC income measures. As these are single period
adjustments it is possible that they may be severely distorted by
measurement errors. The effect of these errors may be randomised
over a number of periods, which may make the cumulative inflation
accounting adjustments more reliable.
Although this research provides evidence supporting the utility of
inflation accounting data to investors, the previous comments
indicate that the topic warrants further consideration. More
research is needed if accounting policy makers are to improve the
quality of the information disclosed in financial reports. Although
inflation accoounting is only 1 factor to be considered in the
338
development of financial reporting, Arnold, Boyle, Carey, Cooper
and Wild (1991) regard it as being central to ensuring that
financial reporting meets its objective.
In the final analysis, it is hoped that the results from this
study, along with the findings from other studies, will contribute
to developing theories that may be used by accounting policy makers
to resolve the issue of inflation accounting. May and Sundem
(1976) suggested that this is "the most promising use of any given
research strategy" (p. 747). In this context perhaps, the words
of Santayana should be remembered
"Our knowledge is a torch of smoky pineThat lights the pathway but one step ahead"
339
APPENDICES
APPENDIX 2.A
US PROPOSALS ON INFLATION ACCOUNTING
340
US Proposals on Inflation Accounting
December 1974The Financial Accounting Standards Board (FASB, 1974a) issued an Exposure Draft which required manadatory presentation of supplementary price level adjusted financial statements. However, the Exposure Draft was never issued as an official pronouncement.
March 1976The Securities and Exchange Commission (SEC, 1976) issued Accounting Series release (ASR) 190 which required the disclosure of replacement cost accounting information. In particular, it required SEC registrants with inventories and gross property, plant and equipment exceeding $100 million and constituting more than 10% of total assets, to disclose information about the replacement cost of inventories, cost of goods sold, the productive capacity of fixed assets, and depreciation. This requirement was the first mandatory requirement imposed by an authoritative rule making body on inflation accounting.
December 1978The FASB (1978) issued an Exposure Draft which required certain large, publicly held companies to disclose supplementary information showing the effect of inflation on a general purchasing power basis or on a CC basis.
September 1979The FASB (1979) promulaged SFAS 33 which required large companies to disclose certain CC and constant dollar information in supplementary form. This statement applied to enterprises that had either (i) inventories and property, plant and equipment amounting to more than $125 million or (ii) total assets amounting to more than $1 billion.
November 1984FASB (1984) issued SFAS 82 which eliminated the constant dollar income disclosures previuosly required by SFAS 33.
October 1986FASB (1986) issued SFAS 89 to replace SFAS 33, detailing the change from mandatory to voluntary disclosure of inflation accounting data.
341
APPENDIX 2.B
UK PROPOSALS ON INFLATION ACCOUNTING
342
UK Proposals on Inflation Accounting
January 1973The Accounting Standards Steering Committee (ASSC, 1973) issued Exposure Draft 8 (ED 8) proposing a system of current purchasing power (CPP), requiring supplementary statements incorporating both a balance sheet and a profit and loss account drawn up on a CPP basis.
July 1973The government announced its intention to set up a committee to look into the problem of inflation accounting. In December 1973 the membership of the Sandilands Committee was announced.
May 1974PSSAP 7 was issued by ASSC (1974) as a provisional standard pending the report of the Sandilands Committee. It followed ED 8 in laying down a system of supplementary CPP accounting.
September 1975The Sandilands Report (Sandilands, 1975) rejected CPP and recommended that CC accounts should replace HC accounts
November 1976The Inflation Accounting Steering Group (ASC, 1976) presented ED 18 containing detailed proposals for the implementation of a CCA system.
Mav 1977The Inflation Accounting Steering Group announced that, in response to strong criticism of ED 18, the proposals would be considerably simplified and subjected to further debate.
July 1977A special meeting of the Institute of Chartered Accountants in England and Wales voted for the resolution "That the members of the Institute of Chatered Accountants in England and Wales do not wish any system of Currrent Cost Accounting to be made compulsory".
343
November 1977The ASC (1977) published an interim statement, the "Hyde Guidelines", which recommended the disclosure of supplementary CCA information dealing only with the profit and loss account and applying only to listed companies.
April 1979ED 24 was issued by the ASC (1979) proposing that listed and certain other large companies should be required to present supplementary CC accounts.
March 1980SSAP 16 was issued by the ASC (1980). This was based on ED 24 with minor adjustments and prescribed a minimum of supplementary abridged CC accounts dealing with both the profit and loss account and the balance sheet.
July 1980The Stock Exchange issued a letter requiring listed companies to comply with SSAP 16 and also to include CCA information in the preliminary announcement and the interim report. In response to representations from listed companies the Stock Exchange agreed that CCA information was only required in the interim report after companies had prepared 2 sets of annual accounts on the basis of SSAP 16, i.e. the interim reports for accounting periods starting on or after 1 January 1982.
June 1985The mandatory status of SSAP 16 was withdrawn.
July 1988SSAP 16 was formally withdrawn.
344
APPENDIX 3.A
ASSUMPTIONS OF THE CAPM
345
ASSUMPTIONS OF THE CAPM
All investors are single period expected utility of terminal wealthmaximizers who choose among alternative portfolios on the basis ofthe mean and variance of return.
All investors can borrow or lend an unlimited amount at anexogenously determined risk free rate of interest.
All investors have identical subjective estimates of the means, variances and covariances of return among all assets, that is, they have homogenous expectations.
The capital markets are perfect in the sense that:
there are no transaction costs;
there are no taxes;
all investors have equal and costless access to information; and,
competition is atomistic, that is, all investors are price takers.
346
APPENDIX 4.A
IMPORTANT EVENT DATES USED IN RO'S STUDIES (1980 & 1981)
347
IMPORTANT EVENT DATES USED IN RO'S STUDIES (1980 & 1981)
Event
1. ARS 190 proposal (August 21, 1975):The SEC proposed amendments to Regulations S-X requiring the following replacement cost (RC) disclosures in 10-K reports: (a) the current RCs of inventories and productive capacity; (b) cost of sales; (c) depreciation, depletion, or amortization expense; and (d) the methods used in determining the above replacement cost data. The proposal includes general guidelines for measuring the effects of inflation on a firm (especially on current business operations rather than the value of business assets), and proposes a definition of RC, inventory assets, and productive capacity. The proposals also indicates that only those firms which meet a size standard will evevtually be subject to the proposed rule.
2a. ARS 190 (March 23, 1976):The above proposal was formally adopted in ASR 190. A $100- million materiality standard for RC disclosure was suggested
2b. SAB No. 7 (March 23, 1976):This is the first SAB published to implement ASR 190. SABs are neither rules nor official views of the SEC; they areinterpretations. SAB No. 7 suggest a definition for RC, productive capacity and inventories. The bulletin also provides guidelines for estimating RC data for inventories (allowing the use of LIFO and FIFO methods under certain conditions), productive capacity, depreciation (requiring the use of straight-line method and the average current RC), and cost of sales. The bulletin also briefly explains how to disclose the RC information in a footnote to the 10-K report.
3. SAB No. 9 (June 17, 1976):SAB No. 9 clarifies the scope of productive capacity andinventories beyond that discussed in SAB No.7. Guidelines are also suggested for the size test. Land, but not non-capitalised financing leases is included in the test.
4. SAB No. 10 (July 27, 1976):SAB No. 10 presents a change in the definition of productivecapacity. Several specific guidelines for developing RC data for inventories, productive capacity, and the cost of sales, including the use of indices in estimating RC are suggested. The bulletin also recommends the following to be excluded from the materiality
348
test: (a) inventories and productive capacity of unconsolidatedsubsidiaries and companies accounted for under the equity method, and (b) land held for investment. An example of a schedule of items to be included in and excluded from the RC disclosure is presented.
5. SAB No. 11 (September 3, 1976):The bulletin interprets operating leases as part of the lessor's productive capacity, and fully depreciated assets as part of productive capacity if they are still in use and material. The bulletin also suggests four general RC measurement techniques: indexing, direct pricing, unit pricing, and functional pricing.
6. SAB No. 12 (November 10, 1976):SAB No. 12 suggests that the use of the indexing method alone is not acceptable under certain conditions in estimating the RCs of productive assets. It also provides further guidelines for estimating the RC data for "limited-use" assets, productive capacity, and depreciation. Four complete examples of RC disclosures in footnote to the 10-K report are also presented.
7. ASR 203: Safe Harbor Rule (December 9, 1976):On March 23, 197 6, the SEC had proposed a safe harbor rule toprotect persons involved in developing the RC data from potential legal liabilities under certain conditions. The SEC adopted the rule because of the imprecise nature of RC data and its desire to encourage the development and disclosure of such data.
8. SAB No. 13 (January 4, 1977):The bulletin suggests that the FASB Statement No. 13 definition of capital lease may be used for financing leases under certain conditions in determining productive capacity. It also recommendscertain repair parts, materials, and supplies to be included ininventories for the RC disclosure. Two examples of the RC disclosures in the annual report to stockholders are presented. The bulletin also suggests that RC disclosures for the parent company financial statements are not required if RC data are provided for the consolidated financial statements.
9. 10-K Disclosure Week:The week in which the 10-K reports containing footnote disclosure on RC accounting data are released.
NOTE
In Ro's 1980 study the critical event weeks are 1 to 8 above.
In Ro's 1981 study the critical event weeks are 1 to 9 above
349
APPENDIX 7.A
DATA EXTRACTED FROM DATASTREAM TO DERIVE THE INDEPENDENT VARIABLES
350
DATA EXTRACTED FROM DATASTREAM TO DERIVE THE INDEPENDENT VARIABLES
CAPE INDUSTRIES KALON GROUP RMC GROUP STEETLEY BPB INDUSTRIES HENDERSON GROUP REDLAND GALLIFORD LOVELL, Y. J.BICCHAWKER SIDDELEY LEC REFRIGRATION CHLORIDE GROUP M. K. ELECTRICAL BOWTHROPE HOLDINGS DIPLOMAELECTROCOMPONENTS FARNELL ELTN. FERRANTI PLESSEYRACAL ELECTRONICUNITECHBRIDONCENTRAL Sc SHERWOOD FOLKES GROUP HALL, MATTHEW LAIRD MOLINSPORTALS HOLDINGS RANSOMES, SIMS SIMON ENGINEERING TI GROUP VICKERS APV BAKER BSS GROUP BULLOUGHDAVY CORPORATION DELTA GROUP DOBSON GROUP DOWTYELLIOTT, B FENNER, J. H. HOPKINSONS HOLDINGS
353
RHP GROUPSMITH INDUSTRIESUTD. SCIENTIFICWELLMANWESTLANDGLYNWEDJOHNSON, MATTHEYMcKECHNIETRIPLEX LLOYDBARR & WALLACE ARNOLDB.B.A. GROUPB.S.G. INTERNATIONALE.R.F. HOLDINGSGKNLEX SERVICEWEST MOTOR HOLDINGCAFFYNSHARTWELLLUCAS INDUSTRIES COOKSON GROUP TURNER & NEWALL ENG. CHINA CLAYS NORCOS SCAPA GROUP WHITECROFT ALLIED-LYONS BASSBULMER, H.P.GRAND METROPOLETAN GREENALL WHITLEY GUINNESSMARSTON, THOMPSON SCOTTISH & NEWCASTLE VAUX GROUP WHITBREAD WOLVTON & DUDLEY BOOKER Me CONNELL CLIFFORDS DAIRIES FEEDEX AGRICULTURAL MATTHEWS BERNARD UNILEVER BARR, A.G.BASSETT FOODS CARR'S MILLING DALEGTY RANKS, HOVIS ROWNTREE TATE & LYLE DEE CORPORATION KWIK SAVE GROUP LOW, WILLIAM SAINSBURY, J
354
TESCOFISONSRECKITT & COLMAN GLAXO HOLDINGS LADBROKETRUSTHOUSE FORTEBLADGEN INDUSTRIESASSOCIATED PAPER INDUSTRIESFERGUSON INDUSTRIALREDFEARNWADDINGTON, JDE LA RUEEMAPREED INTERNATIONALTRINITY INDUSTRIAL HOLDINGSHARRIS QUEENSWAYGREAT UNIVERSAL STORESWARD WHITE GROUPBOOTSEMPIRE STORES GOLDBERG, A MENZIES, JOHN REED AUSTIN SMITH, W. H.COURTAULDSREADICUT INTERNATIONALTOOTAL GROUPGEER GROSSSAATCHI Sc SAATCHIBRENT CHEMICALSBRITISH VITACRODA INTERNATIONALIMPERIAL CHEMICAL INDUSTRIESRENTOKILSEQUABOC GROUPEVODE GROUPHOLT LLOYD INTERNATIONAL BIBBY, JGRAMPIAN HOLDINGS PEARSON HANSON TRUST POWELL DUFFRYN BRITISH PETROLEUM BURMAH OIL CENTURY OILSLONDON SCOTTISH MARINE OILRTZ CORPORATIONCOSALT
355
A.A.H.GESTETNERKALAMAZOOROTHMANS INTERNATIONALSKETCHLEYYALE & VALOR
356
RELUCTANT GROUP
BLUE CIRCLE INDUSTRIES ERITHEXPAMET INTERNATIONAL HEPWORTH CERAMIC JOHNSTON GROUP MANDERS HOLDINGS PHEONIX TIMBER RUBEROID RUGBY GROUP TARMACTRAVIS & ARNOLD MAGNETMARSHALLS (HALIFAX)WOLSELEYABERDEEN CONSTRUCTION BARRATT DEVELOPMENT CONDER GROUP COSTAIN GROUP HIGGS & HILL LAING, JOHN MOWLEM, JOHN TAYLOR WOODROW TILBURYTURRIFF CORPORATION WILSON CONNOLLY WIMPEY GEORGE BRYANT HOLDINGS BURNETT & HALLAMS DOUGLAS, ROBERT M GLEESON, M. J.LILLEY, F.J.C.NORTHERN ENGINEERING INDUSTRIESVOLEX GROUPSTCBRAMMERBRITISH AEROSPACEDYSON J & JEIS GROUPHUNTING ASSOCIATEDNEILL, JAMES HOLDINGSRICHARDSONS WSTGTHSENIOR ENGINEERINGSPIRAX-SARCOWEIR GROUPBIRMID QUALCASTGEI INTERNATIONALHOWDEN GROUPMS INTERNATIONAL
357
PRIEST, BENJAMINRENOLDSIEBEWAGON INDUSTRIAL HOLDINGSWHESSOECOHEN, AIMILEE, ARTHUR APPLEYARD GROUP GATES, FRANK ALEXANDERS HOLDINGS COWIE, T BOOT, HENRY BTRCAPARO INDUSTRIES MORGAN CRUCIBLE BROWN & TAWSE STAVELEY CLARK, MATTHEW MANSFIELD BREWERIES CADBURY SCHWEPPS UNITED BISCUITS FITCH LOVELL UNIGATE BATLEYS GLASS GLOVER NURDIN & PEACOCK ASDA-MFI GROUP MORRISON, WM NORMANS GROUP SMITH & NEPHEW BEECHAM GROUPLONDON INTERNATIONAL GROUP ANGLIA TV ELECTRONIC RENTAL H.T.V. GROUP SCOTTISH T. V.THORN EMIBUNZLDRGMETAL CLOSURE ROCKWARE GROUP METAL BOXBEMROSE CORPORATION COLLINS, WM.UNITED NEWSPAPERSCHURCH Sc COPENTOSBENTALLSBURTON GROUPCOURTS (FURN.)FINE ART DEVELOPMENTS
358
SEARS WIGFALLS BAIRD WILLIAM CORAHLISTER & COVIVAT HOLDINGSCELESTION INDUSTRIESDAWSON INTERNATIONALELLIS & GOLDSTEINHOLLAS GROUPILWORTH. MORRISPARKLAND TEXTREXMOREAGB RESEARCHBRUNNING GROUPDAVIS, GODFREYCOATES BROTHERSFOSECOLAPORTEALLIED COLLOIDS COALITE GROUP DAVIES & NEWMAN OCEAN TRANSPORT RUNCIMAN, W BETHUNTING PETROLEUMULTRAMARBOUSTEADHARRISONS & CROS. WILLS GROUP PATERSON ZOCH.BAT INDUSTRIES BROWN & JACKSON JOHNSON CLEANERS TELEVISION RENTALS BLACK, PETER CHAMBERLIN. PHIPPS COWAN, DE GROOT SECURICOR
359
APPENDIX 7.C
QUESTIONNAIRE AND LETTERS USED TO DETERMINE COMPANIES' POLICY ON
THE DISCLOSURE OF INFLATION ACCOUNTING DATA PRIOR TO THE
MANDATORY PERIOD
360
Date as per postmark
Dear Financial Controller,I am a lecturer at Dublin City University and I am at present gathering information to complete a thesis for a Ph.D. degree.My research is concerned with examining the "explanatory power" of inflation adjusted information in relation to the share prices of the top 550 U.K. listed companies.An essential part of this research is to establish which of these companies disclosed inflation adjusted information prior to SSAP 16 becoming mandatory. In view of this I would greatly appreciate it if you could complete the attached questionnaire and return it to me as soon as possible as I urgently require the information. I assure you that your reply will be treated in the strictest confidence.I thank you in anticipation of your co-operation.Yours sincerely,
Marann Byrne Lecturer
Enc.
361
Q U E S T I O N N A I R E
Accounting Years Ended
Inflation adjusted information was disclosed in the published accounts of your company (please indicate with an X if Yes).
The information was prepared in accordance with the requirements of:Exposure Draft 18Hyde GuidelinesSandiland's Report SSAP 16Please indicate by means of an X which guidelines were followed for each of the years.
If none of the above guidelines were followed, briefly describe the method used to account for the effects of inflation.
Marann Byrne December 1986
362
I recently wrote to you (copy of letter attached) regarding a research study I was undertaking and asked for your co-operation in completing a short questionnaire.As I have not received your completed questionnaire, I now enclose a further copy of the questionnaire and would appreciate it if you would complete it and return it to me as soon as possible. If you are not in a position to complete it, perhaps you could forward me copies of the annual accounts in respect of your company for the accounting periods ending 1979 and 1980. I repeat the assurance in my previous letter that your replies will be treated in strict confidence.Thank you for your co-operation.Yours sincerely,
Dear Financial Controller,
Marann Byrne Lecturer
Encs.
363
APPENDIX 7.D
COMPANIES CLASSIFIED BY INDUSTRY
364
COMPANIES CLASSIFIED BY INDUSTRY
INDUSTRY SUPPORTIVE COS. RELUCTANT COS.
Building 7 14Contracting and Construction 2 17Electricals 5 2Electronics 8 1Mechanical Engineering 26 19Metals and Metal Forming 4 3Motors 10 4Other industrial Materials 6 6Brewers and Distillers 11 2Food Manufacturing 12 4Food Retailing 5 6Health and Household 3 3Leisure 2 5Packaging and Paper 5 5Publishing and Printing 4 3Stores 9 8Textiles 3 11Agencies 2 3Chemicals 9 5Conglomerates 4 1Shipping and Transport 1 3Oil and Gas 4 2Overseas Trade 4Mining 1Miscellaneous 7 8
(Xt CC - Xt h c ) - (Xt _ 1 CC - Xt _ 1 h c ) CCADJEt - CCADJEt _ 1
P t - 1 CVt - l= x 4
T a b l e 8 . L . 5 p r e s e n t s d e t a i l s o f t h e r e s u l t s o f e s t i m a t i n g e q u a t i o n
( 6 ) f o r t h e S u p p o r t i v e a n d R e l u c t a n t C o m p a n i e s u s i n g HC a n d CC
d a t a .
445
Table 8.L.5
RETURN MODEL
y = a + b ^ j ^ + t>2 ^ 2 + £>3 * 3 + b 4 x 4 ( 6 )
HC DATA
S u p p o r t i v e C o m p a n i e s R e l u c t a n t C o m p a n i e sV a r i a b l e
X 1
C o e f f i c i e n t. 2 7
F v a l u e 1 0 . 8 5
C o e f f i c i e n t. 2 6
F v a l u e 2 . 4 9
x 2. 0 9 . 3 9 . 0 2 . 0 1
x 3 - . 1 7 . 3 6 - . 0 3 . 0 2
x 4 . 1 1 . 5 1 . 1 9 1 . 7 1
c o n s t a n t . 30 6 4 . 6 8 . 3 1 6 2 . 2 9
R2 = . 4 6 7 2 1 R2 = . 0 7 5 7 4
CC DATA
S u p p o r t i v e C o m p a n i e s R e l u c t a n t C o m p a n i e sV a r i a b l e* 1
C o e f f i c i e n t. 2 7
F v a l u e 1 0 . 8 5
C o e f f i c i e n t. 2 6
F v a l u e 2 . 4 9
x 2. 0 9 . 3 9 . 0 2 . 0 1
x 3 - . 4 4 2 . 0 2 - . 2 9 1 . 1 1
x 4 . 0 2 . 0 1 . 1 7 . 6 2
c o n s t a n t . 30 6 4 . 6 8 . 3 1 6 2 . 2 9
R2 = . 4 6 7 2 1 R2 = . 0 7 5 7 4
To t e s t i f t h e i n f l a t i o n v a r i a b l e s ( x x 4 ) p o s s e s s e d I E P , e q u a t i o n
( 6 ) w a s d e r i v e d e x c l u d i n g t h e s e v a r i a b l e s . An F t e s t w a s p e r f o r m e d
446
2d i f f e r e n t f r o m t h e R ' s a s s o c i a t e d w i t h t h e f u l l m o d e l s ( e q u a t i o n
( 6 ) ) . D e t a i l s o f t h e F t e s t a r e p r e s e n t e d i n T a b l e 8 . L . 6 .
2to determine if the R 's of the reduced models were significantly
T a b l e 8 . L . 6
COMPARISION OF THE R2 OF THE FULL MODEL AND THE REDUCED MODEL
HC DATA
C o s F u l l M o d e l R e d u c e d M o d e l C h a n g e i n C h a n g e i n S i g n , o f
R2 R2 R2 F F C h a n g e
S u p p o r t i v e . 4 6 7 . 4 6 4 . 0 0 3 . 3 5 2 . 7 0 3 7
R e l u c t a n t . 0 7 6 . 0 6 0 . 0 1 6 1 . 1 1 3 . 3 3 1 6
CC DATA
C o s F u l l M o d e l R e d u c e d M o d e l C h a n g e i n C h a n g e i n S i g n , o f
R2 R2 R2 F F C h a n g e
S u p p o r t i v e . 4 6 7 . 4 4 5 . 0 2 2 3 . 0 3 7 . 0 5 1 0
R e l u c t a n t . 0 7 6 . 0 6 8 . 0 0 8 . 5 7 9 . 5 6 1 6
T h e r e s u l t s i n T a b l e s 8 . L . 5 & 8 . L . 6 r e v e a l t h a t n e i t h e r
i n d i v i d u a l l y n o r j o i n t l y d o t h e i n f l a t i o n a c c o u n t i n g v a r i a b l e s
p o s s e s s I E P . T h i s f i n d i n g i s c o n s i s t e n t a c r o s s b o t h m o d e l s .
H o w e v e r , i n t h e c a s e o f t h e CC m o d e l f o r t h e S u p p o r t i v e C o m p a n i e s
w h e n t e s t i n g t h e j o i n t e x p l a n a t o r y p o w e r o f t h e i n f l a t i o n
a c c o u n t i n g v a r i a b l e s t h e F t e s t i s o n l y m a r g i n a l l y i n s i g n i f i c a n t .
447
B IB L O G R A P H Y
A b d e l - K h a l i k , A . R. & A j i n k y a , B. ( 1 9 8 2 ) . " R e t u r n s t oi n f o r m a t i o n a l a d v a n t a g e s : t h e c a s e o f a n a l y s t s ' f o r e c a s tr e v i s i o n s " . T h e A c c o u n t i n g R e v i e w , O c t o b e r , p p . 6 6 1 - 6 8 0 .
A b d e l - K h a l i k , A . R. & McKeown, J . C. ( 1 9 7 8 ) . " D i s c l o s u r e o fe s t i m a t e s o f h o l d i n g g a i n s a n d t h e a s s e s s m e n t o f s y s t e m a t i c R i s k " , i n S t u d i e s i n A c c o u n t i n g f o r C h a n g e s i n G e n e r a l a n d S p e c i f i c P r i c e s : E m p i r i c a l a n d P u b l i c P o l i c y I s s u e s , s u p p l e m e n t t o J o u r n a l o f A c c o u n t i n g R e s e a r c h , V o l . 1 6 , p p . 4 6 - 7 7 .
A c c o u n t i n g S t a n d a r d s B o a r d ( 1 9 9 1 ) . ED - S t a t e m e n t o f P r i n c i p l e s : T h e O b j e c t i v e o f F i n a n c i a l S t a t e m e n t s a n d t h e Q u a l i t a t i v eC h a r a c t e r i s t i c s o f F i n a n c i a l I n f o r m a t i o n , L o n d o n : ASB
A c c o u n t i n g S t a n d a r d s S t e e r i n g C o m m i t t e e ( 1 9 7 3 ) . ED 8 : A c c o u n t i n gf o r C h a n g e s i n t h e P u r c h a s i n g P o w e r o f M o n e y , L o n d o n : ASSC.
A c c o u n t i n g S t a n d a r d s S t e e r i n g C o m m i t t e e ( 1 9 7 4 ) . P S S A P 7: A c c o u n t i n g f o r C h a n g e s i n t h e P u r c h a s i n g P o w e r o f M o n e y , L o n d o n : ASSC.
A c c o u n t i n g S t a n d a r d s S t e e r i n g C o m m i t t e e ( 1 9 7 5 ) . T h e C o r p o r a t e R e p o r t , L o n d o n : ASSC.
A c c o u n t i n g S t a n d a r d s C o m m i t t e e ( 1 9 7 6 ) . ED 1 8 : C u r r e n t C o s tA c c o u n t i n g , L o n d o n : A S C .
A c c o u n t i n g S t a n d a r d s C o m m i t t e e ( 1 9 7 7 ) . I n f l a t i o n A c c o u n t i n g - An I n t e r i m r e c o m m e n d a t i o n , ( r e f e r r e d t o a s T h e Hy d e G u i d e l i n e s ) , L o n d o n : ASC.
A c c o u n t i n g S t a n d a r d s C o m m i t t e e ( 1 9 7 9 ) . ED 2 4 : C u r r e n t C o s t A c c o u n t i n g , L o n d o n : ASC.
A c c o u n t i n g S t a n d a r d s C o m m i t t e e ( 1 9 8 0 ) . S S A P 1 6 : C u r r e n t C o s tA c c o u n t i n g , L o n d o n : ASC.
A c c o u n t i n g S t a n d a r d s C o m m i t t e e ( 1 9 8 6 ) . A c c o u n t i n g f o r t h e E f f e c t s o f C h a n g i n g P r i c e s : A H a n d b o o k , L o n d o n : ASC.
A h a r o n y , J . & I t z h a k , S . ( 1 9 8 0 ) . " Q u a r t e r l y d i v i d e n d s a n d e a r n i n g s a n n o u n c e m e n t s a n d s t o c k h o l d e r s ' r e t u r n s : an e m p i r i c a la n a l y s i s " , J o u r n a l o f F i n a n c e , M a r c h , p p . 1 - 1 2 .
448
A h a r o n y , J . , J o n e s , C. P . & S w a r y , I . ( 1 9 8 0 ) . "An a n a l y s i s o f r i s k a n d r e t u r n c h a r a c t e r i s t i c s o f c o r p o r a t e b a n k r u p t c y u s i n g c a p i t a l m a r k e t d a t a " , J o u r n a l o f F i n a n c e , V o l . 3 5 , S e p t e m b e r , p p . 1 0 0 1 - 1 0 1 6 .
A h l e r s , D. M. ( 1 9 6 6 ) . "SEM: A S e c u r i t y E v a l u a t i o n M o d e l " , i n K.J . C o h e n & F . X. Hammer ( e d s . ) , A n a l y t i c a l M e t h o d s i n B a n k i n g , Hom ew ood , 1 1 1 : I r w i n .
A l e x a n d e r , S . S . ( 1 9 6 2 ) . " I n c o m e m e a s u r e m e n t i n a d y n a m i c e c o n o m y " . i n W. T. B a x t e r & S . D a v i d s o n ( e d s . ) , S t u d i e s i n A c c o u n t i n g T h e o r y , p p . 1 7 4 - 1 8 8 , Ho m ew oo d , 1 1 1 : I r w i n .
A l t m a n , E . I . ( 1 9 6 8 ) . " F i n a n c i a l r a t i o s , d i s c r i m i n a n t a n a l y s i s , a n d t h e p r e d i c t i o n o f c o r p o r a t e b a n k r u p t c y " , J o u r n a l o f F i n a n c e , V o l . 2 3 , S e p t e m b e r , p p . 5 8 9 - 6 0 9 .
A l t m a n , E . I . ( 1 9 8 1 ) . " S t a t i s t i c a l c l a s s i f i c a t i o n m o d e l s a p p l i e d t o common s t o c k a n a l y s i s " , J o u r n a l o f A c c o u n t i n g R e s e a r c h , V o l . 9 , p p . 1 2 3 - 1 4 9 .
A m e r i c a n A c c o u n t i n g A s s o c i a t i o n ( 1 9 6 6 ) . A S t a t e m e n t o f B a s i cA c c o u n t i n g T h e o r y , E v a n s t o n , IL : AAA.
A m e r i c a n A c c o u n t i n g A s s o c i a t i o n C o m m i t t e e ( 1 9 6 5 ) . "The r e a l i z a t i o n c o n c e p t " , A c c o u n t i n g R e v i e w , A p r i l , p p . 3 1 2 - 3 2 2 .
A m e r i c a n I n s t i t u t e o f C e r t i f i e d P u b l i c A c c o u n t a n t s ( 1 9 7 3 ) . O b j e c t i v e s o f F i n a n c i a l S t a t e m e n t s , ( r e f e r r e d t o a s t h e T r u e b l o o d R e p o r t ) , New Y o r k : AICPA.
A n d e r s o n , R. ( 1 9 8 1 ) . "The u s e f u l n e s s o f a c c o u n t i n g a n d o t h e r i n f o r m a t i o n d i s c l o s e d i n c o r p o r a t e a n n u a l r e p o r t s t o i n s t i t u t i o n a l i n v e s t o r s i n A u s t r a l i a " , A c c o u n t i n g a n d B u s i n e s s R e s e a r c h , A u t u m n , p p . 2 5 9 - 2 6 5 .
A p p l e y a r d , A. R. & S t r o n g , N. C. ( 1 9 8 4 ) . "The i m p a c t o f SSAP 16 c u r r e n t c o s t a c c o u n t i n g d i s c l o s u r e s o n s e c u r i t y p r i c e s " . I n B . V. C a r s b e r g & M. P a g e ( e d s . ) , C u r r e n t C o s t A c c o u n t i n g : T h e B e n e f i t s a n d t h e C o s t s , V o l . 3 , p p . 2 3 5 - 2 4 4 , L o n d o n : P r e n t i c e - H a l l & ICAE&W.
A r b e l , A. & J a g g i , B . ( 1 9 7 8 ) . " I m p a c t o f r e p l a c e m e n t c o s td i s c l o s u r e s o n i n v e s t o r s ' d e c i s i o n s i n t h e U n i t e d S t a t e s " , I n t e r n a t i o n a l J o u r n a l o f A c c o u n t i n g E d u c a t i o n a n d R e s e a r c h , V o l . 1 4 , A u t u m n , p p . 7 1 - 8 2 .
449
A r c h e r , G. S . H. & S t e e l e , A . ( 1 9 8 4 ) . "The i m p l e m e n t a t i o n o f SSAP 1 6 , c u r r e n t c o s t a c c o u n t i n g , bu UK l i s t e d c o m p a n i e s " . I n B. V. C a r s b e r g & M. P a g e ( e d s . ) , C u r r e n t C o s t A c c o u n t i n g : T h e B e n e f i t s a n d t h e C o s t s , V o l . 4 , p p . 3 4 9 - 4 8 4 , L o n d o n : P r e n t i c e - H a l l & ICAE&W.
A r c h i b a l d , T . ( 1 9 7 2 ) . " S t o c k m a r k e t r e a c t i o n t o t h e d e p r e c i a t i o n s w i t c h - b a c k " , A c c o u n t i n g R e v i e w , J a n u a r y , p p . 2 2 - 3 0 .
A r n o l d , J . ( 1 9 8 4 ) . "The i n f o r m a t i o n r e q u i r e m e n t s o f s h a r e h o l d e r s " , i n B. C a r s b e r g & A. H o p e ( e d s . ) , C u r r e n t I s s u e s i n A c c o u n t i n g , p p . 1 0 0 - 1 1 7 . 2 n d e d n . , O x f o r d : P h i l i p A l l a n .
A r n o l d , J . , B o y l e , P . , C a r e y , A . , C o p p e r , M. & W i l d , K. ( 1 9 9 1 ) . T h e F u t u r e S h a p e o f F i n a n c i a l R e p o r t s , L o n d o n : ICAE&W, & ICA S.
A r n o l d , J . & M o i z e r , P . ( 1 9 8 4 ) . "A s u r v e y o f t h e m e t h o d s u s e d b y UK i n v e s t m e n t a n a l y s t s t o a p p r a i s e i n v e s t m e n t s i n o r d i n a r y s h a r e s " , A c c o u n t i n g a n d B u s i n e s s R e s e a r c h , S p r i n g , p p . 1 9 5 - 2 0 7 .
A s q u i t h P . & M u l l i n s , D. N. ( 1 9 8 3 ) . "The i m p a c t o f i n i t i a t i n g d i v i d e n d p a y m e n t s o n s h a r e h o l d e r s ' w e a l t h " , T h e J o u r n a l o f B u s i n e s s , J a n u a r y , p p . 7 7 - 9 6 .
A t i a s e , R. K. ( 1 9 8 5 ) . " P r e d i s c l o s u r e i n f o r m a t i o n , f i r m c a p i t a l i z a t i o n a n d s e c u r i t y p r i c e b e h a v i o r a r o u n d e a r n i n g s a n n o u n c e m e n t s " , J o u r n a l o f A c c o u n t i n g R e s e a r c h , S p r i n g , p p . 2 1 - 3 5 .
A t i a s e , R. K. & T s e , S . ( 1 9 8 6 ) . " S t o c k v a l u a t i o n m o d e l s a n d a c c o u n t i n g i n f o r m a t i o n : a r e v i e w a n d s y n t h e s i s " , J o u r n a l o fA c c o u n t i n g L i t e r a t u r e , V o l . 5 , p p . 1 - 3 3 .
B a i l l i e , J . ( 1 9 8 7 ) . S y s t e m s o f P r o f i t M e a s u r e m e n t , B e r k s h i r e , E n g l a n d : G e e & Co.
B a l l , R. ( 1 9 7 2 ) . " C h a n g e s i n a c c o u n t i n g t e c h n i q u e s a n d s t o c k p r i c e s " , E m p i r i c a l R e s e a r c h i n A c c o u n t i n g : S e l e c t e d S t u d i e s 1 9 7 2 , s u p p l e m e n t t o J o u r n a l o f A c c o u n t i n g R e s e a r c h , p p . 1 - 4 4 .
B a l l , R. ( 1 9 7 8 ) . " A n o m a l i e s i n r e l a t i o n s h i p s b e t w e e n s e c u r i t i e s y i e l d s a n d y i e l d s u r r o g a t e s " , J o u r n a l o f F i n a n c i a l E c o n o m i c s , J u n e / S e p t e m b e r , p p . 1 0 3 - 1 2 6 .
B a l l , R. ( 1 9 9 0 ) . "What d o we kno w a b o u t m a r k e t e f f i c i e n c y ? " , w o r k i n g p a p e r , U n i v e r s i t y o f R o c h e s t e r .
450
B a l l , R. & B r o w n , P . ( 1 9 6 8 ) . "An e m p i r i c a l e v a l u a t i o n o fa c c o u n t i n g i n c o m e n u m b e r s " , J o u r n a l o f A c c o u n t i n g R e s e a r c h ,A u t u m n , p p . 1 5 9 - 1 7 8 .
B a l l , R. & B r o w n , P . ( 1 9 6 9 ) . " P o r t f o l i o t h e o r y a n d a c c o u n t i n g " , J o u r n a l o f A c c o u n t i n g R e s e a r c h , V o l . 7 , A u t u m n , p p . 3 0 0 - 3 2 3 .
B a n z , R. ( 1 9 8 1 ) . "The r e l a t i o n s h i p b e t w e e n r e t u r n a n d m a r k e t v a l u e o f common s t o c k s " , J o u r n a l o f F i n a n c i a l E c o n o m i c s , M a r c h , p p .3 - 1 8 .
B a r a n , A . , L a k o n i s h o k , J . & O f e r , A. R. ( 1 9 8 0 ) . "The i n f o r m a t i o n c o n t e n t o f g e n e r a l p r i c e l e v e l a d j u s t e d e a r n i n g s : s o m e e m p i r i c a le v i d e n c e " , A c c o u n t i n g R e v i e w , V o l . LV, N o . 1 , J a n u a r y , p p . 2 2 - 3 5 .
B a r t h , M. E . , B e a v e r , W. H. & S t i n s o n , C. H. ( 1 9 9 1 ) . " S u p p l e m e n t a l d a t a a n d s t r u c t u r e o f t h r i f t s h a r e p r i c e s " , A c c o u n t i n g R e v i e w , V o l . 6 6 , J a n u a r y , p p . 6 7 - 7 9 .
B a r t l e y , J . W. & B o a r d m a n , C. M. ( 1 9 9 0 ) . "The r e l e v a n c e o f i n f l a t i o n a d j u s t e d a c c o u n t i n g d a t a t o t h e p r e d i c t i o n o f c o r p o r a t e t a k e o v e r s " , J o u r n a l o f B u s i n e s s F i n a n c e a n d A c c o u n t i n g , V o l . 1 7 , S p r i n g , p p . 5 3 - 7 2 .
B a r t o n , A . D. ( 1 9 7 4 ) . " E x p e c t a t i o n s a n d a c h i e v e m e n t s i n i n c o m e t h e o r y " , A c c o u n t i n g R e v i e w , V o l . 4 9 , O c t o b e r , p p . 6 6 4 - 6 8 1 .
B a r t o n , A . D. ( 1 9 8 0 ) . "CCA p r o f i t s a n d t h e s h a r e m a r k e t " A u s t r a l i a n A c c o u n t a n t , N o v e m b e r , p p . 6 8 0 - 6 8 4 .
B a s u , S . ( 1 9 8 1 ) . " M a r k e t r e a c t i o n s t o a c c o u n t i n g p o l i c y d e l i b e r a t i o n s : t h e i n f l a t i o n a c c o u n t i n g c a s e r e v i s i t e d " ,A c c o u n t i n g R e v i e w , V o l . L V I , N o . 4 , O c t o b e r , p p . 9 4 2 - 9 5 4 .
B a s u , S . ( 1 9 8 3 ) . "The r e l a t i o n s h i p b e t w e e n e a r n i n g ' s y i e l d , m a r k e t v a l u e a n d r e t u r n s f o r NYSE common s t o c k s : f u r t h e r e v i d e n c e " ,J o u r n a l o f F i n a n c i a l E c o n o m i c s , J u n e , p p . 1 2 9 - 1 5 6 .
B a x t e r , W. T . ( 1 9 6 7 ) . " A c c o u n t i n g v a l u e s : s a l e p r i c e v e r s u sr e p l a c e m e n t c o s t " , J o u r n a l o f A c c o u n t i n g R e s e a r c h , A u t u m n , p p . 2 0 8 - 2 1 4 .
B a x t e r , W. T . ( 1 9 7 5 ) . A c c o u n t i n g V a l u e s a n d I n f l a t i o n , New Y o r k : M c G r a w - H i l l .
451
Baxter, W. T. (1984). I n f l a t i o n A c c o u n t i n g , Oxford: Philip Allan.
B a x t e r , W. T . ( 1 9 8 6 ) . "The f u t u r e o f c o m p a n y f i n a n c i a l r e p o r t i n g " , i n T . A. L e e ( e d . ) , D e v e l o p m e n t s i n F i n a n c i a l R e p o r t i n g , p p . 2 7 0 - 2 9 2 , O x f o r d : P h i l i p A l l a n .
B a y l i s s , M. ( 1 9 8 4 ) . "The u s e o f c u r r e n t c o s t i n f o r m a t i o n i n t h e P r e s s a n d s t o c k b r o k e r s ' r e p o r t s " . I n B . V . C a r s b e r g & M. P a g e ( e d s . ) / C u r r e n t C o s t A c c o u n t i n g : T h e B e n e f i t s a n d t h e C o s t s , V o l .2 , p p . 8 7 - 1 0 0 , L o n d o n : P r e n t i c e - H a l l & ICAESW.
B e a v e r , W.H, ( 1 9 6 6 ) . " F i n a n c i a l r a t i o s a s p r e d i c t o r s o f f a i l u r e , " E m p i r i c a l R e s e a r c h i n A c c o u n t i n g : S e l e c t e d S t u d i e s 1 9 6 6 ,s u p p l e m e n t t o J o u r n a l o f A c c o u n t i n g R e s e a r c h , p p . 7 1 - 1 1 1 .
B e a v e r , W. H. ( 1 9 6 8 a ) . "The I n f o r m a t i o n c o n t e n t o f a n n u a l e a r n i n g s a n n o u n c e m e n t s " , E m p i r i c a l R e s e a r c h i n A c c o u n t i n g : S e l e c t e d S t u d i e s 1 9 6 8 , s u p p l e m e n t t o J o u r n a l o f A c c o u n t i n g R e s e a r c h , p p . 6 7 - 9 2 .
B e a v e r , W. H. ( 1 9 6 8 b ) . " M a r k e t p r i c e s , f i n a n c i a l r a t i o s a n d t h e p r e d i c t i o n o f f a i l u r e " , J o u r n a l o f A c c o u n t i n g R e s e a r c h , V o l . 6 , A u t u m n , p p . 1 7 9 - 1 9 2 .
B e a v e r , W. H. ( 1 9 7 2 ) . "The b e h a v i o u r o f s e c u r i t y p r i c e s a n d i t s i m p l i c a t i o n s f o r a c c o u n t i n g r e s e a r c h ( m e t h o d s ) " , i n R. R. S t e r l i n g ( e d . ) , R e s e a r c h M e t h o d o l o g y i n A c c o u n t i n g , p p . 9 - 3 7 , p a p e r s a n d r e s p o n s e s f r o m A c c o u n t i n g C o l l o q u i u m 1 9 7 1 , K a n s a s : S c h o l a r s B o o k C o .
B e a v e r , W. H. ( 1 9 7 4 ) . " I m p l i c a t i o n s o f s e c u r i t y p r i c e r e s e a r c h f o r a c c o u n t i n g : a r e p l y t o B i e r m a n " , A c c o u n t i n g R e v i e w , V o l . 4 9 , J u l y , p p . 5 6 3 - 5 7 1 .
B e a v e r , W. H. ( 1 9 8 7 ) . "The p r o p e r t i e s o f s e q u e n t i a l r e g r e s s i o n s w i t h m u l t i p l e e x p l a n a t o r y v a r i a b l e s " , A c c o u n t i n g R e v i e w , V o l . L X I I I , J a n u a r y , p p . 1 3 7 - 1 4 4 .
B e a v e r , W. H. ( 1 9 8 9 ) . F i n a n c i a l R e p o r t i n g A n A c c o u n t i n g R e v o l u t i o n , E n g l e w o o d C l i f f s , N . J . : P r e n t i c e - H a l l .
B e a v e r , W. H . , C h r i s t i e , A. H. & G r i f f i n , P . A. ( 1 9 8 0 ) . "The i n f o r m a t i o n c o n t e n t o f SEC a c c o u n t i n g s e r i e s r e l e a s e N o . 1 9 0 " , J o u r n a l o f A c c o u n t i n g a n d E c o n o m i c s , N o . 2 , A u g u s t , p p . 1 2 7 - 1 5 7 .
452
B e a v e r , W. H . , C l a r k e , R. & W r i g h t , W. ( 1 9 7 9 ) . "The a s s o c i a t i o n b e t w e e n u n s y s t e m a t i c s e c u r i t y r e t u r n s a n d t h e m a g n i t u d e o f e a r n i n g s f o r e c a s t e r r o r s " , J o u r n a l o f A c c o u n t i n g R e s e a r c h , A u t u m n , p p .3 1 6 - 3 4 0 .
B e a v e r , W. H. & D u k e s , R. E . ( 1 9 7 2 ) . " I n t e r p e r i o d t a x a l l o c a t i o n , e a r n i n g s e x p e c t a t i o n s , a n d t h e b e h a v i o r o f s e c u r i t y p r i c e s " , A c c o u n t i n g R e v i e w , A p r i l , p p . 3 2 0 - 3 3 2 .
B e a v e r , W. H. & D u k e s , R. E . ( 1 9 7 3 ) . " D e l t a - d e p r e c i a t i o n m e t h o d s : s o m e e m p i r i c a l r e s u l t s " , A c c o u n t i n g R e v i e w , J u l y , p p . 5 4 9 - 5 5 9 .
B e a v e r , W. H . , G r i f f i n , P . A. & L a n d s m a n , W. R. ( 1 9 8 2 ) . "The i n c r e m e n t a l i n f o r m a t i o n c o n t e n t o f r e p l a c e m e n t c o s t e a r n i n g s " , J o u r n a l o f A c c o u n t i n g a n d E c o n o m i c s , N o . 4 , p p . 1 5 - 3 9 .
B e a v e r , W. H . , K e n n e l l y , J . W. & V o s s , W. M. ( 1 9 6 8 ) . " P r e d i c t i v e a b i l i t y a s a c r i t e r i o n f o r t h e e v a l u a t i o n o f a c c o u n t i n g d a t a " ,A c c o u n t i n g R e v i e w , O c t o b e r , p p . 6 7 5 - 6 8 3 .
B e a v e r , W. H . , K e t t l e r , P . & S c h o l e s , M. ( 1 9 7 0 ) . "Thea s s o c i a t i o n b e t w e e n m a r k e t d e t e r m i n e d a n d a c c o u n t i n g d e t e r m i n e d r i s k m e a s u r e s " , A c c o u n t i n g R e v i e w , O c t o b e r , p p . 6 5 4 - 6 8 2 .
B e a v e r , W. H . , L a m b e r t , R. & M o r s e , D. ( 1 9 8 0 ) . "The i n f o r m a t i o nc o n t e n t o f s e c u r i t y p r i c e s " , J o u r n a l o f A c c o u n t i n g a n d E c o n o m i c s ,M a r c h , p p . 3 - 2 8 .
B e a v e r , W. H . , R. L a m b e r t & R y a n , S . ( 1 9 8 7 ) . "The i n f o r m a t i o nc o n t e n t o f s e c u r i t y p r i c e s : a s e c o n d l o o k " , J o u r n a l o f A c c o u n t i n ga n d E c o n o m i c s , J u l y , p p . 1 3 9 - 1 5 7 .
B e a v e r , W. H. & L a n d s m a n , W. R. ( 1 9 8 1 ) . " N o t e o n t h e b e h a v i o ro f r e s i d u a l s e c u r i t y r e t u r n s f o r w i n n e r a n d l o s e r p o r t f o l i o s " , J o u r n a l o f A c c o u n t i n g a n d E c o n o m i c s , D e c e m b e r , p p . 2 3 3 - 2 4 2 .
B e a v e r , W. H. & L a n d s m a n , W. R. ( 1 9 8 3 ) . I n c r e m e n t a l I n f o r m a t i o nC o n t e n t o f S t a t e m e n t 3 3 D i s c l o s u r e s , S t a m f o r d , CT: FASB.
B e a v e r , W. H. & M a n e g o l d , J . ( 1 9 7 5 ) . "The a s s o c i a t i o n b e t w e e n m a r k e t - d e t e r m i n e d a n d a c c o u n t i n g - d e t e r m i n e d m e a s u r e s o f s y s t e m a t i c r i s k " , J o u r n a l o f F i n a n c i a l a n d Q u a n t i t a t i v e A n a l y s i s , V o l . X, J u n e , p p . 2 3 1 - 2 8 4 .
453
B e a v e r , W. H. & M o r s e , D. ( 1 9 7 8 ) . "What d e t e r m i n e s p r i c e - e a r n i n g s r a t i o s ? " , F i n a n c i a l A n a l y s t s J o u r n a l , J u l y / A u g u s t , p p . 6 5 - 7 6 .
B e l l , A . L . ( 1 9 5 3 ) . " F i x e d a s s e t s a n d c u r r e n t c o s t s " , A c c o u n t i n g R e v i e w , V o l . 2 8 , J a n u a r y , p p . 4 4 - 5 3 .
B e n i s h a y , H. ( 1 9 6 1 ) . " V a r i a b i l i t y i n e a r n i n g s - p r i c e r a t i o s o fc o r p o r a t e e q u i t i e s " , T h e A m e r i c a n E c o n o m i c R e v i e w , V o l . 5 1 ,M a r c h , p p . 8 1 - 9 4 .
B e n s t o n , G. J . ( 1 9 6 7 ) . " P u b l i s h e d c o r p o r a t e a c c o u n t i n g d a t a a n d s t o c k p r i c e s " , E m p i r i c a l R e s e a r c h i n A c c o u n t i n g : S e l e c t e d S t u d i e s , 1 9 6 7 , s u p p l e m e n t t o J o u r n a l o f A c c o u n t i n g R e s e a r c h , V o l . 5 , p p . 1 - 1 4 , a n d 2 2 - 5 4 .
B e n s t o n , G. J . & K r a s n e y , ( 1 9 7 8 ) . "DAAM: t h e d em and f o ra l t e r n a t i v e a c c o u n t i n g m e a s u r e m e n t s " , s u p p l e m e n t t o J o u r n a l o f A c c o u n t i n g R e s e a r c h , V o l . 1 6 , p p . 1 - 3 0 .
B e r n a r d , V. L . ( 1 9 8 7 ) . " C r o s s - s e c t i o n a l d e p e n d e n c e a n d p r o b l e m s i n i n f e r e n c e i n m a r k e t - b a s e d a c c o u n t i n g r e s e a r c h " , J o u r n a l o f A c c o u n t i n g R e s e a r c h , V o l . 2 5 , S p r i n g , p p . 1 - 4 8 .
B e r n a r d , V. L . & R u l a n d , R. G. ( 1 9 8 7 ) . "The i n c r e m e n t a l i n f o r m a t i o n c o n t e n t o f h i s t o r i c a l c o s t a n d c u r r e n t c o s t i n c o m e n u m b e r s : t i m e - s e r i e s a n a l y s e s f o r 1 9 6 2 - 1 9 8 0 " , A c c o u n t i n g R e v i e w ,V o l . L X I I , O c t o b e r , p p . 7 0 7 - 7 2 2 .
B e r n a r d , V. L . & R u l a n d , R. G. ( 1 9 9 1 ) . "The i n c r e m e n t a l i n f o r m a t i o n c o n t e n t o f h i s t o r i c a l - c o s t a n d c u r r e n t - c o s t i n c o m e : c r o s s - s e c t i o n a l a n a l y s i s f o r 1 9 6 1 - 1 9 8 0 " , A d v a n c e s i n Q u a n t i t a t i v e A n a l y s i s o f F i n a n c e a n d A c c o u n t i n g , V o l . 1 , P a r t B , p p . 5 5 - 6 5 .
B e r n a r d , V . L . & S t o b e r , T . L . ( 1 9 8 9 ) . "The n a t u r e a n d a m o u n t o f i n f o r m a t i o n i n c a s h f l o w s a n d a c c r u a l s " , A c c o u n t i n g R e v i e w , V o l . 6 4 , O c t o b e r , p p . 6 2 4 - 6 5 2 .
B e r n a r d , V . & T h o m a s , J . ( 1 9 8 9 ) . " P o s t - e a r n i n g s - a n n o u n c e m e n t d r i f t : d e l a y e d p r i c e r e s p o n s e o r r i s k p r e m i u m " , s u p p l e m e n t t o J o u r n a l o f A c c o u n t i n g R e s e a r c h , p p . 1 - 3 6 .
B e r n a r d , V. & T h o m a s , J . ( 1 9 9 0 ) . " E v i d e n c e t h a t s t o c k p r i c e s d o n o t f u l l y r e f l e c t t h e i m p l i c a t i o n s o f c u r r e n t e a r n i n g s f o r f u t u r e e a r n i n g s " , J o u r n a l o f A c c o u n t i n g a n d E c o n o m i c s , N o . 1 3 , p p . 3 0 5 - 3 4 0 .
454
B e r n o u l l i , D. ( 1 9 5 4 ) . " E x p o s i t i o n o f a new t h e o r y o n t h e m e a s u r e m e n t o f r i s k " , t r a n s l a t e d b y L . Somm er , E c o n o m e t r i c a , V o l . 2 2 , J a n u a r y , p p . 2 3 - 3 6 .
B i d d l e , G. C. & L i n d a h l , F . W. ( 1 9 8 2 ) . " S t o c k p r i c e r e a c t i o n s t o LIFO a d o p t i o n s : t h e a s s o c i a t i o n b e t w e e n e x c e s s r e t u r n s a n d LIFOt a x s a v i n g s " , J o u r n a l o f A c c o u n t i n g R e s e a r c h , A u t u m n , p p . 5 5 1 - 5 8 8 .
B i l d e r s e e , J . ( 1 9 7 5 ) . " M a r k e t d e t e r m i n e d a n d a l t e r n a t i v e m e a s u r e s o f r i s k : , A c c o u n t i n g R e v i e w , J a n u a r y , p p . 8 1 - 8 8 .
B l a i n , E . ( 1 9 7 0 ) . " D i s c l o s u r e o f a c c o u n t i n g c h a n g e s " , T h e C a n a d i a n C h a r t e r e d A c c o u n t a n t , S e p t e m b e r , p p . 1 9 8 - 2 0 2 .
B l u m e , M. ( 1 9 7 1 ) . "On t h e a s s e s s m e n t o f r i s k " , J o u r n a l o f F i n a n c e , M a r c h , p p . 1 - 1 0 .
B o a r d , J . G. & M. W a l k e r , ( 1 9 8 4 ) . "The i n f o r m a t i o n c o n t e n t o f SSAP 1 6 e a r n i n g s c h a n g e s " . I n B . V. C a r s b e r g & M. P a g e ( e d s . ) , C u r r e n t C o s t A c c o u n t i n g : T h e B e n e f i t s a n d t h e C o s t s , V o l . 3 , p p . 2 4 5 - 2 5 1 , L o n d o n : ICAE&W.
B o a r d , J . G. & M. W a l k e r , ( 1 9 9 0 ) . " I n t e r t e m p o r a l a n dc r o s s - s e c t i o n a l v a r i a t i o n i n t h e a s s o c i a t i o n b e t w e e n u n e x p e c t e d a c c o u n t i n g r a t e s o f r e t u r n a n d a b n o r m a l r e t u r n s " , J o u r n a l o f A c c o u n t i n g R e s e a r c h , S p r i n g , p p . 1 8 2 - 1 9 2 .
B o n b r i g h t , J . C. ( 1 9 3 7 ) . V a l u a t i o n o f P r o p e r t y , New Y o r k : M c G r a w - H i l l .
B o w e r s , R. ( 1 9 5 0 ) . " O b j e c t i o n t o i n d e x n u m b e r a c c o u n t i n g , " A c c o u n t i n g R e v i e w , V o l . 2 5 , A p r i l p p . 1 4 9 - 1 5 5 .
B o y s , P . G. & R u t h e r f o r d , B . A. ( 1 9 8 4 ) . "The u s e o f a c c o u n t i n g i n f o r m a t i o n b y i n s t i t u t i o n a l i n v e s t o r s " . I n B . V. C a r s b e r g & M. P a g e ( e d s . ) , C u r r e n t C o s t A c c o u n t i n g : T h e B e n e f i t s a n d t h e C o s t s , V o l . 2 , p p . 1 0 3 - 1 2 7 , L o n d o n : P r e n t i c e - H a l l & ICAE&W.
B r a y s h a w , R . E . & M i r o , A. R. ( 1 9 8 5 ) . "The i n f o r m a t i o n c o n t e n t o f i n f l a t i o n - a d j u s t e d f i n a n c i a l s t a t e m e n t s " , J o u r n a l o f B u s i n e s s a n d A c c o u n t i n g , V o l . 1 2 , Summer , p p . 2 4 9 - 2 6 1 .
455
B r e a l e y , R. A . ( 1 9 8 6 ) . "The d i s t r i b u t i o n a n d i n d e p e n d e n c e o f s u c c e s s i v e r a t e s o f r e t u r n f r o m t h e B r i t i s h e q u i t y m a r k e t " . I n S . I v i s o n , C. M o s s , C. & M. S i m p s o n ( e d s . ) , B r i t i s h R e a d i n g s i n F i n a n c i a l M a n a g e m e n t , p p . 3 1 2 - 3 2 9 , L o n d o n : H a r p e r a n d Row.
B r e n n a n , M. ( 1 9 9 1 ) . "A p e r s p e c t i v e o n a c c o u n t i n g a n d s t o c kp r i c e s " , A c c o u n t i n g R e v i e w , J a n u a r y , p p . 6 7 - 7 9 .
B r e n n a n , M. & S c h w a r t z , E. S . ( 1 9 8 2 a ) . " C o n s i s t e n t r e g u l a t o r y p o l i c y u n d e r u n c e r t a i n t y " , T h e B e l l J o u r n a l o f E c o n o m i c s , V o l . 1 3 , A u t u m n , p p . 5 0 6 - 5 2 1 .
B r e n n a n , M. & S c h w a r t z , E . S . ( 1 9 8 2 b ) . " R e g u l a t i o n a n d c o r p o r a t ei n v e s t m e n t p o l i c y " , J o u r n a l o f F i n a n c e , V o l . 3 7 , May , p p . 2 8 9 - 3 0 0 .
B r i c k l e y , J . A . ( 1 9 8 3 ) . " S h a r e h o l d e r w e a l t h , i n f o r m a t i o ns i g n a l l i n g a n d t h e s p e c i a l l y d e s i g n a t e d d i v i d e n d " , J o u r n a l o fF i n a n c i a l E c o n o m i c s , A u g u s t , p p . 1 8 7 - 2 0 9 .
B r o m w i c h , M. ( 1 9 9 2 ) . F i n a n c i a l R e p o r t i n g , I n f o r m a t i o n a n d C a p i t a l M a r k e t s , L o n d o n : P i t m a n .
B r o w n , P . ( 1 9 7 0 ) . "T he i m p a c t o f t h e a n n u a l n e t p r o f i t r e p o r t o n t h e s t o c k m a r k e t " , T h e A u s t r a l i a n A c c o u n t a n t , J u l y , p p . 2 7 7 - 2 8 3 .
B r o w n , P . & K e n n e l l y , J . ( 1 9 7 2 ) . "The i n f o r m a t i o n a l c o n t e n t o f q u a r t e r l y e a r n i g s : an e x t e n s i o n a n d s o m e f u r t h e r e v i d e n c e " ,J o u r n a l o f B u s i n e s s , J u l y , p p . 3 0 4 - 4 1 5 .
B r o w n S . ( 1 9 7 8 ) . " E a r n i n g s c h a n g e s , s t o c k p r i c e s a n d m a r k e te f f i c i e n c y " , J o u r n a l o f F i n a n c e , M a r c h , p p . 1 7 - 2 8 .
B r o w n , S . J . & W a r n e r , J . B . ( 1 9 8 0 ) . " M e a s u r i n g s e c u r i t y p r i c e p e r f o r m a n c e " , J o u r n a l o f F i n a n c i a l E c o n o m i c s , S e p t e m b e r , p p . 2 0 5 - 2 5 8 .
B u b l i t z , B . , F r e c k a , T . J . & McKeown, J . C. ( 1 9 8 5 ) . " M a r k e t a s s o c i a t i o n t e s t s a n d FASB S t a t e m e n t N o . 33 d i s c l o s u r e s : ar e e x a m i n a t i o n " , s u p p l e m e n t t o J o u r n a l o f A c c o u n t i n g R e s e a r c h , V o l . 2 3 , p p . 1 - 2 5 .
C a n n i n g , J . ( 1 9 2 9 ) . T h e E c o n o m i c s o f A c c o u n t a n c y , New Y o r k : R o n a l d P r e s s , r e p r i n t e d b y A r n o P r e s s , New Y o r k , 1 9 7 8 .
456
C a p s t a f f , J . ( 1 9 9 1 ) . " A c c o u n t i n g i n f o r m a t i o n a n d i n v e s t m e n t r i s k p e r c e p t i o n i n t h e UK", J o u r n a l o f I n t e r n a t i o n a l F i n a n c i a l M a n a g e m e n t a n d A c c o u n t i n g , V o l . 1 3 , N o . 2 , p p . 1 8 9 - 2 0 0 .
C a r s b e r g , B. V. ( 1 9 8 4 ) . " T h e u s e f u l n e s s o f c u r r e n t c o s ta c c o u n t i n g : a r e p o r t o n a r e s e a r c h p r o g r a m m e " . I n B. V . C a r s b e r g & M. P a g e ( e d s . ) , C u r r e n t C o s t A c c o u n t i n g : T h e B e n e f i t s a n d t h e C o s t s , V o l . 1 , p p . 1 - 7 0 , L o n d o n : P r e n t i c e - H a l l & ICAE&W.
C a r s b e r g , B. V . ( 1 9 8 4 ) . "The r e l i a b i l i t y o f s p e c i a l c u r r e n t c o s t m e a s u r e m e n t s " . I n B. V. C a r s b e r g & M. P a g e ( e d s . ) , C u r r e n t C o s t A c c o u n t i n g : T h e B e n e f i t s a n d t h e C o s t s , V o l . 2 , p p . 1 2 9 - 1 4 7 ,L o n d o n : P r e n t i c e - H a l l & ICAE&W.
C a r s b e r g , B . V . & D a y , J . ( 1 9 8 4 ) . "The u s e o f c u r r e n t c o s t a c c o u n t i n g i n f o r m a t i o n b y s t o c k b r o k e r s " . I n B . V . C a r s b e r g & M. P a g e ( e d s . ) , C u r r e n t C o s t A c c o u n t i n g : T h e B e n e f i t s a n d t h e C o s t s , V o l . 2 , p p . 1 4 9 - 1 7 1 , L o n d o n : P r e n t i c e - H a l l & ICAE&W.
C a r s b e r g , R . , H o p e , A. & S c a p e n s , R. W. ( 1 9 7 8 ) . "The o b j e c t i v e s o f p u b l i s h e d a c c o u n t i n g r e p o r t s " , i n R. H. P a r k e r ( e d . ) , R e a d i n g s i n A c c o u n t i n g a n d B u s i n e s s R e s e a r c h 1 9 7 0 - 1 9 7 7 , p p . 5 - 1 8 , L o n d o n : P r e n t i c e - H a l l & ICAE&W.
C a s s i d y , D. B . ( 1 9 7 6 ) . " I n v e s t o r e v a l u a t i o n o f a c c o u n t i n gi n f o r m a t i o n : so m e a d d i t i o n a l e m p i r i c a l e v i d e n c e " , J o u r n a l o fA c c o u n t i n g R e s e a r c h , V o l . 1 4 , A u t u m n , p p . 2 1 2 - 2 2 9 .
C h a m b e r s , R. J . ( 1 9 6 5 ) . " E d w a r d s and B e l l o n b u s i n e s s i n c o m e ' A c c o u n t i n g R e v i e w , O c t o b e r , p p . 7 3 1 - 7 4 1 .
C h a m b e r s , R. J . ( 1 9 6 6 ) . A c c o u n t i n g , E v a l u a t i o n a n d E c o n o m i c B e h a v i o r , E n g l e w o o d C l i f f s , N J : P r e n t i c e - H a l l .
C h a m b e r s , R . J . ( 1 9 7 1 ) . " V a l u e t o t h e o w n e r " , A b a c u s , J u n e , p p . 6 2 - 7 2 .
C h a m b e r s , R. J . ( 1 9 7 4 ) . " S t o c k m a r k e t p r i c e s a n d a c c o u n t i n gr e s e a r c h " , ABACUS, J u n e , p p . 3 9 - 5 4 .
C h a n g , L . S . , M o s t , K. S . & B r a i n , C. W. ( 1 9 8 3 ) . "T he u t i l i t y o f a n n u a l r e p o r t s : a n i n t e r n a t i o n a l s t u d y " , J o u r n a l o f I n t e r n a t i o a l B u s i n e s s S t u d i e s , S p r i n g / S u m m e r , p p . 6 3 - 8 3 .
457
C h r i s t i e , A. A . ( 1 9 8 7 ) . "On c r o s s - s e c t i o n a l a n a l y s i s i na c c o u n t i n g " , J o u r n a l o f A c c o u n t i n g a n d E c o n o m i c s , S e p t e m b e r , p p . 2 3 1 - 2 5 8 .
C h r i s t i e , A. A . , K e n n e l l e y , M. D . , K i n g , J . W. & S c h a e f e r , T. F . ( 1 9 8 4 ) . " T e s t i n g f o r i n c r e m e n t a l i n f o r m a t i o n c o n t e n t i n t h e p r e s e n c e o f c o l l i n e a r i t y ", J o u r n a l o f A c c o u n t i n g a n d E c o n o m i c s , N o . 6 , p p . 2 0 5 - 2 1 7 .
C o l l i n s , D. W. & K o t h a r i , S . P . ( 1 9 8 9 ) . "An a n a l y s i s o f i n t e r t e m p o r a l a n d c r o s s - s e c t i o n a l d e t e r m i n a n t s o f e a r n i n g s r e s p o n s e c o e f f i c i e n t s " , J o u r n a l o f A c c o u n t i n g a n d E c o n o m i c s , J u l y , p p . 1 4 3 - 1 8 2 .
C o o p e r , T . ( 1 9 8 0 ) . " R e p l a c e m e n t c o s t a n d b e t a : a f i n a n c i a l m o d e l " , J o u r n a l o f A c c o u n t i n g , A u d i t i n g a n d F i n a n c e , V o l . 3 , N o . 2 , p p . 1 3 8 - 1 4 6 .
C r e a d y , W. M. & M y n a t t , P . G. ( 1 9 9 1 ) . "The i n f o r m a t i o n c o n t e n t o f a n n u a l r e p o r t s : a p r i c e a n d t r a d i n g r e s p o n s e a n a l y s i s " , A c c o u n t i n g R e v i e w , V o l . 6 6 , N o . 2 , A p r i l , p p . 2 9 1 - 3 1 2 .
C r o s s , S . M. ( 1 9 8 2 ) . E c o n o m i c D e c i s i o n s u n d e r I n f l a t i o n : T h e I m p a c t o f A c c o u n t i n g M e a s u r e m e n t E r r o r s , G r e e n w i c h , CT: J A I P r e s s .
C u n n i n g h a m S . W. ( 1 9 7 3 ) . "The p r e d i c t a b i l i t y o f B r i t i s h s t o c k m a r k e t p r i c e s " , A p p l i e d S t a t i s t i c s , V o l . 2 2 , p p . 3 1 5 - 3 3 1 .
D a r n e l l , A, C. & S k e r r a t t , L . C. L . ( 1 9 8 9 ) . "T he v a l u a t i o n a p p r o a c h t o s t o c k m a r k e t i m p a c t : so m e t e s t s w i t h ( c u r r e n t c o s ta c c o u n t i n g ) d i s c l o s u r e s " , A c c o u n t i n g a n d B u s i n e s s R e s e a r c h , V o l . 1 9 , N o . 7 4 , p p . 1 2 5 - 1 3 4 .
D a v i d s o n , H. J . ( 1 9 6 8 ) . " D i s c u s s i o n o f t h e i n f o r m a t i o n c o n t e n t o f a n n u a l e a r n i n g s a n n o u n c e m e n t s " , E m p i r i c a l R e s e a r c h i n A c c o u n t i n g : S e l e c t e d S t u d i e s 1 9 6 8 , s u p p l e m e n t t o J o u r n a l o f A c c o u n t i n g R e s e a r c h , p p . 9 3 - 9 5 .
D a v i s , D. ( 1 9 8 6 ) . " V a l u a t i o n o f S h a r e s " , i n M. F i r t h & S . M. K e a n e ( e d s . ) , I s s u e s i n F i n a n c e , p p . 1 9 3 - 2 0 6 , O x f o r d : P h i l i p A l l a n .
D a y , J . F . S . ( 1 9 8 6 ) . "The u s e o f a n n u a l r e p o r t s b y UK i n v e s t m e n t a n a l y s t s " , A c c o u n t i n g a n d B u s i n e s s R e s e a r c h , A u t u m n , p p . 2 9 5 - 3 0 7 .
458
D e a r i n g , R. ( 1 9 8 8 ) . T h e M a k i n g o f A c c o u n t i n g S t a n d a r d s : R e p o r t o f t h e R e v i e w C o m m i t t e e , L o n d o n : ICAE&W.
D e B o n d t , W. F . M. & T h a l e r , R. H. ( 1 9 8 5 ) . " D o e s t h e s t o c k m a r k e t o v e r r e a c t ? " , J o u r n a l o f F i n a n c e , p p . 7 9 3 - 8 0 5 .
D e B o n d t , W. F . M. & T h a l e r , R. H. ( 1 9 8 7 ) . " F u r t h e r e v i d e n c e o ni n v e s t o r o v e r r e a c t i o n a n d s t o c k m a r k e t s e a s o n a l i t y " , J o u r n a l o fF i n a n c e , p p . 5 5 7 - 5 8 0 .
D e m s k i , J . S . ( 1 9 7 3 ) . "The g e n e r a l i m p o s s i b i l i t y o f n o r m a t i v e a c c o u n t i n g s t a n d a r d s " , A c c o u n t i n g R e v i e w , V o l . X L V I I I , O c t o b e r , p p . 7 1 8 - 7 2 3 .
D i c k i n s o n , J . ( 1 9 8 6 ) . " P o r t f o l i o T h e o r y " , i n M. F i r t h & S . M. K e a n e ( e d s . ) , I s s u e s i n F i n a n c e , p p . 1 6 - 2 7 , O x f o r d : P h i l i p A l l a n .
D i e l m a n , T . E . & O p p e n h e i m e r , H. R. ( 1 9 8 4 ) . "An e x a m i n a t i o n o f i n v e s t o r b e h a v i o u r d u r i n g p e r i o d s o f l a r g e d i v i d e n d c h a n g e s " , J o u r n a l o f F i n a n c i a l a n d Q u a n t i t a t i v e A n a l y s i s , J u n e , p p .1 9 7 - 2 1 6 .
D o p u c h , N. ( 1 9 7 1 ) . " D i s c u s s i o n o f an e m p i r i c a l t e s t o f t h e r e l e v a n c e o f a c c o u n t i n g i n f o r m a t i o n f o r i n v e s t m e n t d e c i s i o n s " , E m p i r i c a l R e s e a r c h i n A c c o u n t i n g : S e l e c t e d S t u d i e s 1 9 7 1 ,s u p p l e m e n t t o J o u r n a l o f A c c o u n t i n g R e s e a r c h , p p . 3 2 - 4 0 .
D o u g l a s , G. W. ( 1 9 6 9 ) . " R i s k i n t h e e q u i t y m a r k e t s : an e m p i r i c a l a p p r a i s a l o f m a r k e t e f f i c i e n c y " , Y a l e E c o n o m i c E s s a y s , N o . 9 , S p r i n g , p p . 3 - 4 5 .
D r a k e , D . F . & D o p u c h , N. ( 1 9 6 5 ) . "On t h e c a s e f o r d i c h o t o m i z i n g i n c o m e " , J o u r n a l o f A c c o u n t i n g R e s e a r c h , A u t u m n , p p . 1 9 2 - 2 0 5 .
D r a p e r , N. R. & S m i t h , H. ( 1 9 8 1 ) . A p p l i e d R e g r e s s i o n A n a l y s i s , New Y o r k : J o h n W i l e y & S o n s .
D r y d e n , M. M. ( 1 9 7 0 ) . " F i l t e r t e s t s o f UK s h a r e p r i c e s " , A p p l i e d E c o n o m i c s , V o l . 1 , J a n u a r y , p p . 2 6 6 - 2 7 5 .
D u n c a n , K. & M o o r e s , K . , ( 1 9 8 8 ) . " U s e f u l n e s s o f CCA i n f o r m a t i o n f o r i n v e s t o r d e c i s i o n m a k i n g : a l a b o r a t o r y e x p e r m i n e n t " , A c c o u n t i n g a n d B u s i n e s s R e s e a r c h , V o l . 1 8 , N o . 1 7 , p p . 1 2 1 - 1 3 2 .
459
D y c k m e n , T . R . , D o w n e s , & M a g e e , R . R. ( 1 9 7 5 ) . E f f i c i e n t C a p i t a l M a r k e t s a n d A c c o u n t i n g : A C r i t i c a l A n a l y s i s , E n g l e w o o d C l i f f s , NJs P r e n t i c e - H a l l .
D y c k m a n , T . R. & M o r s e , D. ( 1 9 8 6 ) . E f f i c i e n t C a p i t a l M a r k e t s a n d A c c o u n t i n g : A C r i t i c a l A n a l y s i s , 2 n d e d n , E n g l e w o o d C l i f f s , NJ:P r e n t i c e - H a l l .
E a s m a n , W . , F a l k e n s t e i n , A. & W e i l , R. ( 1 9 7 9 ) . "The c o r r e l a t i o n b e t w e e n s u s t a i n a b l e i n c o m e a n d s t o c k r e t u r n s " , F i n a n c i a l A n a l y s t s J o u r n a l , S e p t e m b e r - O c t o b e r , p p . 4 4 - 4 8 .
E a s t o n , P . D. ( 1 9 8 5 ) . " A c c o u n t i n g e a r n i n g s a n d s e c u r i t y v a l u a t i o n : e m p i r i c a l e v i d e n c e o f t h e f u n d a m e n t a l v a l u a t i o n l i n k s " , s u p p l e m e n t t o J o u r n a l o f A c c o u n t i n g R e s e a r c h , p p . 5 4 - 7 7 .
E a s t o n , P . D. & H a r r i s , T . S . ( 1 9 9 1 ) . " E a r n i n g s a s a n e x p l a n a t o r y v a r i a b l e f o r r e t u r n s " , J o u r n a l o f A c c o u n t i n g R e s e a r c h , V o l . 2 9 , S p r i n g , p p . 1 9 - 3 6 .
E a s t o n , P . D. & Z m i j e w s k i , M. E . ( 1 9 8 9 ) . " C r o s s - s e c t i o n a l v a r i a t i o n i n t h e s t o c k m a r k e t r e s p o n s e t o a c c o u n t i n g e a r n i n g s a n n o u n c e m e n t s " , J o u r n a l o f A c c o u n t i n g a n d E c o n o m i c s , J u l y , p p . 1 1 7 - 1 4 2 .
E d w a r d s , E . O. & B e l l , P . W. ( 1 9 6 1 ) . T h e T h e o r y a n d M e a s u r e m e n t o f B u s i n e s s I n c o m e , B e r k e l e y , CA: U n i v e r s i t y o f C a l i f o r n i a P r e s s .
E d w a r d s , J . S . S . , K a y , J . A . & M a y e r , C. P . ( 1 9 8 7 ) . T h e E c o n o m i c A n a l y s i s o f A c c o u n t i n g P r o f i t a b i l i t y , O x f o r d : C l a r e n d o n P r e s s .
E i s e n b e i s , R . A. ( 1 9 7 7 ) . " P i t f a l l s i n t h e a p p l i c a t i o n o f d i s c r i m i n a n t a n a l y s i s i n b u s i n e s s f i n a n c e a n d e c o n o m i c s " , J o u r n a l o f F i n a n c e , J u n e , p p . 8 7 5 - 9 0 0 .
E l g e r s , P . T . ( 1 9 8 0 ) . " A c c o u n t i n g - b a s e d r i s k p r e d i c t i o n s : ar e - e x a m i n a t i o n " , A c c o u n t i n g R e v i e w , J u l y , p p . 3 8 9 - 4 0 8 .
E s k e w , R . K . ( 1 9 7 9 ) . "The f o r e c a s t i n g a b i l i t y o f a c c o u n t i n g r i s k m e a s u r e s : s o m e a d d i t i o n a l e v i d e n c e " , A c c o u n t i n g R e v i e w , J a n u a r y ,p p . 1 0 7 - 1 1 8 .
E z z a m e l , M . , M a r - M o l i n e r o , C. & B e e c h e r , A. ( 1 9 8 7 ) . "On t h e d i s t r i b u t i o n a l p r o p e r t i e s o f f i n a n c i a l r a t i o s " , J o u r n a l o f B u s i n e s s F i n a n c e a n d A c c o u n t i n g , V o l . 1 4 , W i n t e r , p p . 4 6 3 - 4 8 1 .
460
Fama, E . F . ( 1 9 7 0 ) . " E f f i c i e n t c a p i t a l m a r k e t s : a r e v i e w o ft h e o r y a n d e m p i r i c a l w o r k " , J o u r n a l o f F i n a n c e , V o l . XXV, May, p p . 3 8 3 - 4 1 7 .
Fama, E . & M a c B e t h , J . ( 1 9 7 3 ) . " R i s k , r e t u r n , a n d e q u i l i b r i u m : e m p i r i c a l t e s t s " , J o u r n a l o f P o l i t i c a l E c o n o m i c s , M a y - J u n e , p p . 6 0 7 - 6 3 6 .
F i n a n c i a l A c c o u n t i n g S t a n d a r d s B o a r d ( 1 9 7 4 a ) . D i s c u s s i o n M e m o r a n d u m : C o n c e p t u a l F r a m e w o r k f o r A c c o u n t i n g a n d R e p o r t i n g :C o n s i d e r a t i o n s o f t h e r e p o r t o f t h e S t u d y G r o u p o n t h e O b j e c t i v e s o f F i n a n c i a l S t a t e m e n t s , S t a m f o r d , CT: FASB.
F i n a n c i a l A c c o u n t i n g S t a n d a r d s B o a r d ( 1 9 7 4 b ) . ED: F i n a n c i a lR e p o r t i n g i n U n i t s o f G e n e r a l P u r c h a s i n g P o w e r " , S t a m f o r d , CT: FASB.
F i n a n c i a l A c c o u n t i n g S t a n d a r d s B o a r d ( 1 9 7 8 a ) . SFAC 1 : O b j e c t i v e so f F i n a n c i a l R e p o r t i n g b y B u s i n e s s E n t e r p r i s e s , S t a m f o r d , CT: FASB.
F i n a n c i a l A c c o u n t i n g S t a n d a r d s B o a r d ( 1 9 7 8 b ) . ED: F i n a n c i a lR e p o r t i n g a n d C h a n g i n g P r i c e s , S t a m f o r d , CT: FASB
F i n a n c i a l A c c o u n t i n g S t a n d a r d s B o a r d ( 1 9 7 9 ) . S F A S 3 3 : F i n a n c i a lR e p o r t i n g a n d C h a n g i n g P r i c e s , S t a m f o r d , CT: FASB.
F i n a n c i a l A c c o u n t i n g S t a n d a r d s B o a r d ( 1 9 8 0 ) . S F A C 2 : Q u a l i t a t i v e C h a r a c t e r i s t i c s o f A c c o u n t i n g I n f o r m a t i o n , S t a m f o r d , CT: FASB.
F i n a n c i a l A c c o u n t i n g S t a n d a r d s B o a r d ( 1 9 8 1 ) . H i g h l i g h t s o f F i n a n c i a l R e p o r t i n g I s s u e , S t a m f o r d , CT: FASB.
F i n a n c i a l A c c o u n t i n g S t a n d a r d s B o a r d ( 1 9 8 4 ) . S F A S 8 2 : F i n a n c i a lR e p o r t i n g a n d C h a n g i n g P r i c e s : E l i m i n a t i o n o f C e r t a i n D i s c l o s u r e s ,S t a m f o r d , CT: FASB.
F i n a n c i a l A c c o u n t i n g S t a n d a r d s B o a r d ( 1 9 8 6 ) . S F A S 8 9 : F i n a n c i a lR e p o r t i n g a n d C h a n g i n g P r i c e s , S t a m f o r d , CT: FASB.
F i n a n c i a l R e p o r t i n g C o m m i s s i o n ( 1 9 9 2 ) . R e p o r t o f t h e C o m m i s i o n o f I n q u i r y i n t o t h e E x p e c t a t i o n s o f U s e r s o f P u b l i s h e d F i n a n c i a l S t a t e m e n t s , D u b l i n : I C A I .
461
F i r t h , M. A. ( 1 9 7 6 ) . "The i m p a c t o f e a r n i n g s a n n o u n c e m e n t s o n s h a r e p r i c e b e h a v i o u r o f s i m i l a r f i r m s " , E c o n o m i c J o u r n a l , V o l . 8 6 , J u n e , p p . 2 9 6 - 3 0 6 .
F i r t h , M. ( 1 9 7 7 ) . T h e V a l u a t i o n o f S h a r e s a n d t h e E f f i c i e n t M a r k e t T h e o r y , L o n d o n : M a c m i l l a n .
F i r t h , M. ( 1 9 8 1 ) . "The r e l a t i v e i n f o r m a t i o n c o n t e n t o f t h e r e l e a s e o f f i n a n c i a l r e s u l t s d a t a b y f i r m s " , J o u r n a l o f A c c o u n t i n g R e s e a r c h , A u t u m n , p p . 5 2 1 - 5 2 9 .
F i r t h , M. ( 1 9 8 6 ) . "The e f f i c i e n c y m a r k e t t h e o r y " , i n M. F i r t h Si S . M. K e a n e ( e d s . ) , I s s u e s i n F i n a n c e , p p . 1 - 1 5 , O x f o r d : P h i l i p A l l a n .
F i s h e r , I . ( 1 9 0 6 ) . T h e N a t u r e o f C a p i t a l a n d I n c o m e , New Y o r k : M c a m i l l i a n , r e p r i n t e d b y P o r c u p i n e P r e s s , P h i l a d e l p h i a , 1 9 7 7 .
F o s t e r , G. ( 1 9 7 3 ) . " S t o c k m a r k e t r e a c t i o n t o e s t i m a t e s o f e a r n i n g s p e r s h a r e b y c o m p a n y o f f i c i a l s , " J o u r n a l o f A c c o u n t i n g R e s e a r c h S p r i n g , p p . 2 5 - 3 7 .
F o s t e r , G. ( 1 9 7 7 ) . " Q u a r t e r l y a c c o u n t i n g d a t a : t i m e s e r i e sp r o p e r t i e s a n d p r e d i c t i v e a b i l i t y r e s u l t s " , T h e A c c o u n t i n g R e v i e w , J a n u a r y , p p . 1 - 2 1 .
F o s t e r , G. ( 1 9 7 8 ) . " A s s e t p r i c i n g m o d e l s : f u r t h e r t e s t s " , J o u r n a l o f F i n a n c i a l a n d Q u a n t i t a t i v e A n a l y s i s , M a r c h , p p . 3 9 - 5 3 .
F o s t e r , G. ( 1 9 8 0 ) . " A c c o u n t i n g p o l i c y d e c i s i o n s a n d c a p i t a l m a r k e t r e s e a r c h " , J o u r n a l o f A c c o u n t i n g a n d E c o n o m i c s , N o . 2 , p p . 2 9 - 6 2 .
F o s t e r , G. ( 1 9 8 1 ) . " I n t r a - i n d u s t r y i n f o r m a t i o n t r a n s f e r sa s s o c i a t e d w i t h e a r n i n g s r e l e a s e s " , J o u r n a l o f A c c o u n t i n g a n d E c o n o m i c s , V o l . 8 6 , D e c e m b e r , p p . 2 0 1 - 2 3 2 .
F o s t e r , G. ( 1 9 8 6 ) . F i n a n c i a l S t a t e m e n t A n a l y s i s , E n g l e w o o d C l i f f s , N. J . : P r e n t i c e - H a l l .
F o s t e r , W. T . , J e n k i n s , D. R. & V i c k r e y , D. W. ( 1 9 8 6 ) . "The i n c r e m e n t a l i n f o r m a t i o n c o n t e n t o f t h e a n n u a l r e p o r t " , A c c o u n t i n g a n d B u s i n e s s R e s e a r c h , S p r i n g , V o l . 1 6 , p p . 9 1 - 9 8 .
462
F o s t e r , G . , O l s e n , C. & S h e v l i n , T . ( 1 9 8 4 ) . " E a r n i n g s r e l e a s e s , a n o m a l i e s a n d t h e b e h a v i o u r o f s e c u r i t y r e t u r n s " , A c c o u n t i n g R e v i e w , O c t o b e r , p p . 5 7 4 - 6 0 3 .
F r e e m a n , R. N. ( 1^981) . "The d i s c l o s u r e o f r e p l a c e m e n t c o s t a c c o u n t i n g d a t a a n d i t s e f f e c t o n t r a n s a c t i o n v o l u m e s : a c o m m e n t " , A c c o u n t i n g R e v i e w , V o l . L V I , J a n u a r y , p p . 1 7 7 - 1 8 0 .
F r e e m a n , R. N. ( 1 9 8 7 ) . "The a s s o c i a t i o n b e t w e e n e a r n i n g s a n d s e c u r i t y r e t u r n s f o r l a r g e a n d s m a l l f i r m s " , J o u r n a l o f A c c o u n t i n g a n d E c o n o m i c s , J u l y , p p . 1 9 5 - 2 2 8 .
F r e e m a n , R. N . , O h l s o n , J . A. & P e n m a n , S . H. ( 1 9 8 2 ) . " B oo k r a t e s o f r e t u r n a n d p r e d i c t i o n o f e a r n i n g s c h a n g e s : an e m p i r i c a li n v e s t i g a t i o n " , J o u r n a l o f A c c o u n t i n g R e s e a r c h , V o l . 2 0 , p p . 8 5 - 1 0 7 .
F r e e m a n , R. & T s e , S . ( 1 9 8 9 ) . "T he m u l t i - p e r i o d i n f o r m a t i o n c o n t e n t o f e a r n i n g s a n n o u n c e m e n t s : r a t i o n a l d e l a y e d r e a c t i o n s t o e a r n i n g s n e w s " , s u p p l e m e n t t o J o u r n a l o f A c c o u n t i n g R e s e a r c h , p p . 4 9 - 7 9 .
F r i e d m a n , L . A . , B u c h m a n , T . A. & M e l i c h e r , R. W. ( 1 9 8 0 ) . "The i n f o r m a t i o n c o n t e n t o f r e p l a c e m e n t c o s t v a l u a t i o n d a t a " , R e v i e w o f B u s i n e s s a n d E c o n o m i c R e s e a r c h , V o l . XV, p p . 2 7 - 3 7 .
F r i e n d , I . , W e s t e r f i e l d , R. & G r a n t i o , M. ( 1 9 7 8 ) . "New e v i d e n c e o n t h e c a p i t a l a s s e t p r i c i n g m o d e l " , J o u r n a l o f F i n a n c e , J u n e , p p . 9 0 3 - 9 1 7 .
G h e y a r a , K. & B o a t s m a n , J . ( 1 9 8 0 ) . " M a r k e t r e a c t i o n t o 1 9 7 6 r e p l a c e m e n t c o s t d i s c l o s u r e s " , J o u r n a l o f A c c o u n t i n g a n d E c o n o m i c s , Summer , p p . 1 0 7 - 1 2 7 .
G i b s o n , J . N . ( 1 9 7 2 ) . " I n t e r e s t r a t e s a n d i n f l a t i o n a r y e x p e c t a t i o n s : n e w e v i d e n c e " , A m e r i c i a n E c o n o m i c R e v i e w , D e c e m b e r ,p p . 8 5 4 - 8 6 5 .
G l e j s e r , H. ( 1 9 6 9 ) . "A new t e s t f o r h e t e r o s c e d a s t i c i t y " , J o u r n a l o f t h e A m e r i c a n S t a t i s t i c a l A s s o c i a t i o n , p p . 3 1 6 - 3 2 3 .
G o n e d e s , N . J . ( 1 9 7 3 ) . " E v i d e n c e o n t h e i n f o r m a t i o n c o n t e n t o f a c c o u n t i n g n u m b e r s : a c c o u n t i n g b a s e d a n d m a r k e t b a s e d e s t i m a t e s o fs y s t e m a t i c r i s k " , J o u r n a l o f F i n a n c i a l a n d Q u a n t i t a t i v e A n a l y s i s , J u n e , p p . 4 0 7 - 4 4 4 .
463
G o n e d e s , N . J . ( 1 9 7 4 ) . " C a p i t a l m a r k e t e q u i l i b i r u m a n d a n n u a l a c c o u n t i n g n u m b e r s : e m p i r i c a l e v i d e n c e " , J o u r n a l o f A c c o u n t i n gR e s e a r c h , S p r i n g , p p . 2 6 - 6 2 .
G o n e d e s , N. J . & D o p u c h , D. ( 1 9 7 4 ) . " C a p i t a l m a r k e t e q u i l i b r i u m , i n f o r m a t i o n p r o d u c t i o n a n d s e l e c t i n g a c c o u n t i n g t e c h n i q u e s : t h e o r e t i c a l f r a m e w o r k a n d r e v i e w o f e m p i r i c a l w o r k " , i n S t u d i e s o n F i n a n c i a l A c c o u n t i n g O b j e c t i v e s , s u p p l e m e n t t o J o u r n a l o f A c c o u n t i n g R e s e a r c h , V o l . 1 2 , p p . 4 8 - 1 6 9 .
G o o d , W. R. & M e y e r , J . R. ( 1 9 7 3 ) . " A d j u s t i n g t h e p r i c e e a r n i n g s r a t i o g a p " , F i n a n c i a l A n a l y s t J o u r n a l , N o v e m b e r - D e c e m b e r , p p . 4 2 - 4 9 , & 8 1 - 8 4 .
G r a n t , E . ( 1 9 8 0 ) . " M a r k e t i m p l i c a t i o n s o f d i f f e r e n t i a l a m o u n t s o f i n t e r i m i n f o r m a t i o n " , J o u r n a l o f A c c o u n t i n g R e s e a r c h , S p r i n g , p p . 2 2 5 - 2 6 8 .
G r a y , S . J . & W e l l s , M. C. ( 1 9 7 3 ) . " A s s e t v a l u e s a n d e x p o s t i n c o m e " , A c c o u n t i n g a n d B u s i n e s s R e s e a r c h , Summer , p p . 1 6 3 - 1 6 7 .
G r e e n , P . E . ( 1 9 7 8 ) . A n a l y s i n g M u l t i v a r i a t e D a t a , H i n s d a l e , 1 1 1 : T h e D r y d e n P r e s s .
G r e e n b a l l , M. N. ( 1 9 6 8 ) . " E v a l u a t i o n o f t h e u s e f u l n e s s t o i n v e s t o r s o f d i f f e r e n t a c c o u n t i n g e s t i m a t e s o f e a r n i n g s : as i m u l a t i o n a p p r o a c h " , E m p i r i c a l R e s e a r c h i n A c c o u n t i n g : S e l e c t e dS t u d i e s , 1 9 6 8 , s u p p l e m e n t t o J o u r n a l o f A c c o u n t i n g R e s e a r c h , V o l 6 , p p . 2 7 - 4 8 .
G r i f f i t h , D . K. ( 1 9 3 7 ) . " W e a k n e s s o f i n d e x - n u m b e r a c c o u n t i n g " , A c c o u n t i n g R e v i e w , V o l . 1 2 , J u n e , p p . 1 2 3 - 1 3 2 .
G r i m e s , D. H. & B e n j a m i n , A. E . ( 1 9 8 6 ) . "Random w a l k h y p o t h e s i s f o r 5 4 3 s t o c k s a n d s h a r e s r e g i s t e r e d o n t h e L o n d o n s t o c k e x c h a n g e " . i n S . I v i s o n , C. M o s s , & M. S i m p s o n ( e d s . ) , B r i t i s h R e a d i n g s i n F i n a n c i a l M a n a g e m e n t , p p . 3 0 2 - 3 1 1 , L o n d o n : H a r p e r a n d Row.
G r o s s m a n , S . D . , K r a t c h m a n , S . H. & R. B . W e l k e r , ( 1 9 8 0 ) . "Comment: t h e e f f e c t o f r e p l a c e m e n t c o s t d i s c l o s u r e s o n s e c u r i t y p r i c e s " , J o u r n a l o f A c c o u n t i n g a n d F i n a n c e , V o l . 1 4 , W i n t e r , p p . 1 3 6 - 1 4 3 .
G y n t h e r , R. S . ( 1 9 7 4 ) . "Why u s e g e n e r a l p u r c h a s i n g p o w e r a c c o u n t i n g " , A c c o u n t i n g a n d B u s i n e s s R e s e a r c h , S p r i n g , p p . 1 4 1 - 1 5 7 .
464
H a g e r m a n , R. L . ( 1 9 7 3 ) . "The e f f i c i e n c y o f t h e m a r k e t f o r b a n k s t o c k s : an e m p i r i c a l t e s t " , J o u r n a l o f M o n e y , C r e d i t a n d B a n k i n g ,A u g u s t , p p . 8 4 6 - 8 5 5 .
H a k a n s s o n , N. H . , K u n k e l , J . G. & o h l s o n , J . A . ( 1 9 8 4 ) . "A c o m m en t on V e r r e c c h i a ' s n o t r a d i n g t h e o r e m " , J o u r n a l o f A c c o u n t i n g R e s e a r c h , N o . 2 2 , A u t u m n , p p . 7 6 5 - 7 6 7 .
Ham ada , R. S . ( 1 9 6 9 ) . " P o r t f o l i o a n a l y s i s , m a r k e t e q u i l i b r i u m a n d c o r p o r a t e f i n a n c e " , J o u r n a l o f F i n a n c e , V o l . XXIV, M a r c h , p p . 1 3 - 2 2 .
Ham ada , R. S . ( 1 9 7 2 ) . "The e f f e c t o f t h e f i r m s c a p i t a l s t r u c t u r e o n t h e s y s t e m a t i c r i s k s o f common s t o c k s " , J o u r n a l o f F i n a n c e , VoL. X X V I I , May, p p . 4 3 5 - 4 5 2 .
H a n d , J . R. ( 1 9 9 0 ) . "A t e s t o f t h e e x t e n d e d f u n c t i o n a l f i x a t i o n h y p o t h e s i s " , A c c o u n t i n g R e v i e w , p p . 7 3 9 - 7 6 3 .
H a r r i s , T . S & O h l s o n , J . A. ( 1 9 8 7 ) . " A c c o u n t i n g d i s c l o s u r e s a n d t h e m a r k e t ' s v a l u a t i o n o f o i l an d g a s p r o p e r t i e s " , A c c o u n t i n g R e v i e w , V o l . 6 2 , p p . 6 5 1 - 6 7 0 .
H a r r i s , T . S . & O h l s o n , J . A. ( 1 9 9 0 ) . " A c c o u n t i n g d i s c l o s u r e s an d t h e m a r k e t ' s v a l u a t i o n o f o i l a n d g a s p r o p e r t i e s : e v a l u a t i o n o f m a r k e t e f f i c i e n c y a n d f u n c t i o n a l f i x a t i o n " , A c c o u n t i n g R e v i e w , p p . 7 6 4 - 7 8 0 .
H a r r i s , R. S . , S t e w a r t , J . F . , G u i l k e y , D. K. & C a r l e t o n , W. T. ( 1 9 8 2 ) . " C h a r a c t e r i s t i c s o f a c q u i r e d f i r m s : f i x e d a n d r a n d o mc o e f f i c i e n t s p r o b i t a n a l y s e s " , S o u t h e r n E c o n o m i c J o u r n a l , J u l y , p p . 1 6 4 - 1 8 4 .
H a r v e y , M. & K e e r , F . ( 1 9 8 3 ) . F i n a n c i a l A c c o u n t i n g T h e o r y a n d S t a n d a r d s , 2 n d e d n . , L o n d o n : P r e n t i c e - H a l l .
Haw, I . & L u s t g a r t e n , S . ( 1 9 8 8 ) . " E v i d e n c e o n i n c o m e m e a s u r e m e n t p r o p e r t i e s o f ASR 1 9 0 a n d SFAS N o . 33 d a t a " , J o u r n a l o f A c c o u n t i n g R e s e a r c h , V o l . 2 6 , A u t u m n , p p . 3 3 1 - 3 5 2 .
H e n d r i k s e n , E. S . ( 1 9 8 2 ) . A c c o u n t i n g T h e o r y , Homew oo d, 1 1 1 : I r w i n .
465
H e n f r e y , A . W. , A l b r e c h t , B . & R i c h a r d s , P . ( 1 9 8 6 ) . "The U .K . s t o c k m a r k e t a n d t h e e f f i c i e n t m a r k e t m o d e l s : a r e v i e w " , i n S .I v i s o n , C. M o s s , & M. S i m p s o n ( e d s . ) , B r i t i s h R e a d i n g s i nF i n a n c i a l M a n a g e m e n t , L o n d o n : H a r p e r & Row.
H i c k s , J . ( 1 9 4 6 ) . V a l u e a n d C a p i t a l , O x f o r d : C l a r e n d o n P r e s s .
H i l l , N. C. & S t o n e , B . R. ( 1 9 8 0 ) . " A c c o u n t i n g b e t a s , s y s t e m a t i co p e r a t i n g r i s k a n d f i n a n c i a l l e v e r a g e : a r i s k - c o m p o s i t i o n a p p r o a c ht o t h e d e t e r m i n a n t s o f s y s t e m a t i c r i s k " , J o u r n a l o f F i n a n c i a l a n d Q u a n t i t a t i v e A n a l y s i s , S e p t e m b e r , p p . 5 9 5 - 6 3 7 .
H i n e s , R. D. ( 1 9 8 2 ) . "The u s e f u l n e s s o f a n n u a l r e p o r t s : t h ea n o m a l y b e t w e e n t h e e f f i c i e n t m a r k e t s h y p o t h e s i s a n d s h a r e h o l d e r s u r v e y s " , A c c o u n t i n g a n d B u s i n e s s R e s e a r c h , A u t u m n , p p . 2 9 6 - 3 0 9 .
H i n e s R. D. ( 1 9 8 4 ) . "The i m p l i c a t i o n s o f s t o c k m a r k e t r e a c t i o n( n o n - r e a c t i o n ) f o r f i n a n c i a l a c c o u n t i n g s t a n d a r d s e t t i n g " ,
A c c o u n t i n g a n d B u s i n e s s R e s e a r c h , W i n t e r , p p . 3 - 1 4 .
H o p w o o d , W. & S c h a e f e r , T . ( 1 9 8 9 ) . " F i r m - s p e c i f i c r e s p o n s i v e n e s st o i n p u t p r i c e c h a n g e s a n d t h e i n c r e m e n t a l i n f o r m a t i o n i n c u r r e n t c o s t i n c o m e " , A c c o u n t i n g R e v i e w , V o l . LXIV, A p r i l , p p . 3 1 3 - 3 2 8 .
H o r g r e n , C. T . ( 1 9 6 5 ) . "how s h o u l d we i n t e r p r e t t h e r e a l i z a t i o n c o n c e p t " , A c c o u n t i n g R e v i e w , A p r i l , p p . 3 2 3 - 3 3 3 .
H o r g r e n , C. T . ( 1 9 7 8 ) . T h e I m p l i c a t i o n s f o r A c c o u n t a n t s o f t h e U s e s o f F i n a n c i a l S t a t e m e n t s b y S e c u r i t y A n a l y s t s , PhD d i s s e r t a t i o n , U n i v e r s i t y o f C h i c a g o , New Y o r k : A r n o P r e s s .
I n s t i t u t e o f C h a r t e r e d A c c o u n t a n t s i n S c o t l a n d ( 1 9 8 8 ) . M a k i n g C o r p o r a t e R e p o r t s V a l u a b l e , P Me M o n n i e s ( e d . ) . , S c o t l a n d : ICAS.
I n t e r n a t i o n a l A c c o u n t i n g S t a n d a r d s C o m m i t t e e ( 1 9 8 9 ) . F r a m e w o r k f o r t h e P r e p a r a t i o n a n d P r e s e n t a t i o n o f F i n a n c i a l S t a t e m e n t s , L o n d o n : IA SC .
I j i r i , Y. & J a e d i c k e , R. J . ( 1 9 6 6 ) . " R e l i a b i l i t y a n d o b j e c t i v i t y o f a c c o u n t i n g m e a s u r e m e n t s " , A c c o u n t i n g R e v i e w , J u l y , p p . 4 7 4 - 4 8 3 .
J a c o b , N. ( 1 9 7 3 ) . "The m e a s u r e m e n t o f s y s t e m a t i c r i s k f o r s e c u r i t i e s a n d p o r t f o l i o s : so m e e m p i r i c a l r e s u l t s " , J o u r n a l o fF i n a n c i a l a n d Q u a n t i t a t i v e A n a l y s i s , V o l . 8 , J u n e , p p . 4 0 7 - 4 4 4 .
466
J a f f e , J . , K e i m , D. B. & W e s t e r f i e l d , R. ( 1 9 8 9 ) . " E a r n i n g s y i e l d s , m a r k e t v a l u e s a n d s t o c k r e t u r n s " , J o u r n a l o f F i n a n c e , M a r c h , p p . 1 3 5 - 1 4 8 .
J e n s e n , M. ( 1 9 7 8 ) . "Some a n o m a l o u s e v i d e n c e r e g a r d i n g m a r k e t e f f i c i e n c y " , J o u r n a l o f F i n a n c i a l E c o n o m i c s , 6 , J u n e - S e p t e m b e r , p p .9 5 - 1 0 2 .
J e n s e n , M. & B e n n i n g t o n , G. ( 1 9 7 0 ) . "Random w a l k s a n d t e c h n i c a l t h e o r i e s ; s o m e a d d i t i o n a l e v i d e n c e " , J o u r n a l o f F i n a n c e , May, p p . 4 6 9 - 4 8 2 .
J e n n i n g s , R. & S t a r k s , L . ( 1 9 8 5 ) . " I n f o r m a t i o n c o n t e n t a n d t h es p e e d o f s t o c k p r i c e a d j u s t m e n t " , J o u r n a l o f A c c o u n t i n g R e s e a r c h , V o l . 2 3 , N o . 1 , S p r i n g , p p . 3 3 6 - 3 5 0 .
J e n s e n , R. E . ( 1 9 6 6 ) . "An E x p e r i m e n t a l d e s i g n f o r s t u d y o f e f f e c t s o f a c c o u n t i n g v a r i a t i o n s i n d e c i s i o n m a k i n g " , J o u r n a l o f A c c o u n t i n g R e s e a r c h , V o l . 4 , A u t u m n , p p . 2 2 4 - 2 3 8 .
J o h n s t o n , J . ( 1 9 8 4 ) . E c o n o m e t r i c M e t h o d s , 3 r d e d n . , New Y o r k :M c G r a w - H i l l .
J o n e s , C. & L i t z e n b e r g e r , R. ( 1 9 7 0 ) . " Q u a r t e r l y e a r n i n g s r e p o r t s a n d i n t e r m e d i a t e s t o c k p r i c e t r e n d s " , J o u r n a l o f F i n a n c e , M a r c h , p p . 1 4 3 - 1 4 8 .
J o y , O . , L i t z e n b e r g e r , R. & M c E n a l l y , R . ( 1 9 7 7 ) . "The a d j u s t m e n t o f s t o c k p r i c e s t o a n n o u n c e m e n t s o f u n a n t i c i p a t e d c h a n g e s i n q u a r t e r l y e a r n i n g s " , J o u r n a l o f A c c o u n t i n g R e s e a r c h , O c t o b e r , p p . 2 0 7 - 2 2 5 .
Kam, V. ( 1 9 9 0 ) . A c c o u n t i n g T h e o r y , New Y o r k : J o h n W i l e y & S o n s .
K a n t o r , B. ( 1 9 7 9 ) . " R a t i o n a l e x p e c t a t i o n s a n d e c o n o m i c t h o u g h t " , J o u r n a l o f E c o n o m i c L i t e r a t u r e , V o l . X V I I , D e c e m b e r , p p . 1 4 2 2 - 1 4 4 1 .
K e a n e , S . M. ( 1 9 8 3 ) . S t o c k M a r k e t E f f i c i e n c y : T h e o r y , E v i d e n c e a n d I m p l i c a t i o n s , O x f o r d : P h i l i p A l l a n .
K e a n e , S . M. ( 1 9 8 7 ) . E f f i c i e n t M a r k e t s a n d F i n a n c i a l R e p o r t i n g , E d i n b u r g h : ICAS.
467
K e a s e y , K. & W a t s o n , R. ( 1 9 8 6 ) . " C u r r e n t c o s t a c c o u n t i n g a n d t h e p r e d i c t i o n o f s m a l l c o m p a n y p e r f o r m a n c e " , J o u r n a l o f B u s i n e s s F i n a n c e a n d A c c o u n t i n g V o l . 1 3 , S p r i n g , p p . 5 1 - 7 0 .
K e e n a n , M. ( 1 9 7 0 ) . " M o d e l s o f e q u i t y v a l u a t i o n : t h e g r e a t SERMb u b b l e " , J o u r n a l o f F i n a n c e , May, p p . 2 4 3 - 2 7 3 .
K e m p . , A . G. & R e i d , G. C. ( 1 9 7 1 ) . "The r a n d o m w a l k h y p o t h e s i s a n d t h e r e c e n t b e h a v i o u r o f e q u i t y p r i c e s i n B r i t a i n " , E c o n o m i c a , V o l . 3 8 , p p . 2 8 - 5 1 .
K e n n e d y , C. ( 1 9 7 8 ) . " I n f l a t i o n a c c o u n t i n g : r e t r o s p e c t a n d p r o s p e c t " C a m b r i d g e E c o n o m i c P o l i c y R e v i e w , p p . 5 8 - 6 4 .
K e o w n , A . & P i n k e r t o n , J . ( 1 9 8 1 ) . " M e r g e r a n n o u n c e m e t s a n d i n s i d e r t r a d i n g a c t i v i t y : a n e m p i r i c a l i n v e s t i g a t i o n " , J o u r n a l o fF i n a n c e , S e p t e m b e r , p p . 8 5 5 - 8 7 0 .
K e t z , J . E . ( 1 9 7 8 ) . "The e f f e c t o f g e n e r a l p r i c e - l e v e l a d j u s t m e n t s o n t h e p r e d i c t i v e a b i l i t y o f f i n a n c i a l r a t i o s " , s u p p l e m e n t t o J o u r n a l o f A c c o u n t i n g R e s e a r c h , p p . 2 7 3 - 2 8 4 .
K i n g , B. F . ( 1 9 6 6 ) . " M a r k e t a n d i n d u s t r y f a c t o r s i n s t o c k p r i c e b e h a v i o u r " , J o u r n a l o f B u s i n e s s , V o l . 3 9 , J a n u a r y , p p . 1 3 9 - 1 9 0 .
K l e i n , L . ( 1 9 6 2 ) . An I n t r o d u c t i o n t o E c o n o m e t r i c s , E n g l e w o o d C l i f f s , NJ: P r e n t i c e - H a l l .
K o u t s o y i a n n i s , A. ( 1 9 7 1 ) . T h e T h e o r y o f E c o n o m e t r i c s , L o n d o n : M a c m i l l a n .
K r a u s , A . & L i t z e n b e r g e r , R. H. ( 1 9 7 6 ) . " S k e w n e s s p r e f e r e n c e a n d t h e v a l u a t i o n o f r i s k a s s e t s " , J o u r n a l o f F i n a n c e , V o l . 3 1 , S e p t e m b e r , p p . 1 0 8 5 - 1 1 0 0 .
Ku h, E . & M e y e r , J . R. ( 1 9 5 5 ) . " C o r r e l a t i o n a n d r e g r e s s i o n e s t i m a t e s w h e n t h e d a t a a r e r a t i o s " , E c o n o m e t r i c a , V o l . 2 3 ,O c t o b e r , p p . 4 0 0 - 4 1 6 .
L a r g a y , J . & L i v i n g s t o n , J . ( 1 9 7 6 ) . A c c o u n t i n g f o r C h a n g i n g P r i c e s , New Y o r k : J o h n W i l e y & S o n s .
L a t a n e , H. & J o n e s , C. ( 1 9 7 9 ) . " S t a n d a r d i s e d u n e x p e c t e d e a r n i n g s : 1 9 7 1 - 1 9 7 7 " , J o u r n a l o f F i n a n c e , J u n e , p p . 7 1 7 - 7 2 4 .
468
L e e , T . A . ( 1 9 8 5 ) . I n c o m e a n d V a l u e M e a s u r e m e n t , 3 r d e d n , W o k i n g h a m , B e r k s h i r e : Van N o s t r a n d R e i n h o l d .
L e e , T. A. & T w e e d i e , D. P . ( 1 9 8 1 ) . T h e I n s t i t u t i o n a l I n v e s t o r a n d F i n a n c i a l I n f o r m a t i o n , L o n d o n : ICAEW.
L e v , B. ( 1 9 7 4 ) . "On t h e a s s o c i a t i o n b e t w e e n o p e r a t i n g l e v e r a g e a n d r i s k " , J o u r n a l o f F i n a n c i a l a n d Q u a n t i t a t i v e A n a l y s i s , V o l . I X , J u n e , p p . 6 2 7 - 6 4 1 .
L e v , B . ( 1 9 8 9 ) . "On t h e u s e f u l n e s s o f e a r n i n g s a n d e a r n i n g s r e s e a r c h : l e s s o n s a n d d i r e c t i o n s f r o m t w o d e c a d e s o f e m p i r i c a lr e s e a r c h " , s u p p l e m e n t t o J o u r n a l o f A c c o u n t i n g R e s e a r c h , V o l . 2 7 , p p . 1 5 3 - 1 9 2 .
L e v . , B . & O h l s o n , J . A . ( 1 9 8 2 ) . " M a r k e t - b a s e d e m p i r i c a l r e s e a r c h i n a c c o u n t i n g : a r e v i e w , i n t e r p r e t a t i o n a n d e x t e n s i o n " , S t u d i e so n C u r r e n t R e s e a r c h M e t h o d o l o g i e s i n A c c o u n t i n g : A C r i t i c a lE v a l u a t i o n , s u p p l e m e n t t o J o u r n a l o f A c c o u n t i n g R e s e a r c h , p p . 2 4 9 - 3 2 2 .
L e v y , H. ( 1 9 7 8 ) . " E q u i l i b r i u m i n an i m p e r f e c t m a r k e t : a c o n s t r a i n t o n t h e n u m b e r o f s e c u r i t i e s i n t h e p o r t f o l i o " , A m e r i c a n E c o n o m i c R e v i e w , S e p t e m b e r , p p . 6 4 3 - 6 5 8 .
L i n t n e r , J . ( 1 9 6 5 ) . "The v a l u a t i o n o f r i s k a s s e t s a n d t h e s e l e c t i o n o f r i s k y i n v e s t m e n t s i n s t o c k p o r t f o l i o s a n d c a p i t a l b u d g e t s " , R e v i e w o f E c o n o m i c a n d S t a t i s t i c s , V o l . X L V I I , F e b r u a r y , p p . 1 3 - 3 7 .
L o b o , G. J . & S o n g , I . ( 1 9 8 9 ) . "The i n c r e m e n t a l i n f o r m a t i o n i n SFAS N o . 3 3 i n c o m e d i s c l o s u r e s o v e r h i s t o r i c a l c o s t i n c o m e a n d i t s c a s h a n d a c c r u a l c o m p o n e n t s " , A c c o u n t i n g R e v i e w , V o l . LXIV, A p r i l , p p . 3 2 9 - 3 4 3 .
L u s t g a r t e n , S . ( 1 9 8 2 ) . "T he i m p a c t o f r e p l a c e m e n t c o s t d i s c l o s u r e s o n s e c u r i t y p r i c e s " , J o u r n a l o f A c c o u n t i n g a n d E c o n o m i c s , N o . 4 , p p . 1 2 1 - 1 4 1 .
Ma, R . ( 1 9 7 6 ) . " V a l u e t o t h e o w n e r r e v i s i t e d " , A b a c u s , D e c e m b e r , p p . 1 5 9 - 1 6 5 .
M a c N e a l , R. ( 1 9 2 9 ) . T r u t h i n A c c o u n t i n g , P h i l a d e l p h i a , PA: U n i v e r s i t y o f P e n n s y l v a n i a P r e s s , r e p r i n t e d b y S c h o l a r s B o o k C o . , H o u s t o n , 1 9 7 0 .
469
M a d d a l a , G. S . ( 1 9 7 7 ) . E c o n o m e t r i c s , New Y o r k : M c G r a w - H i l l .
M a i n g o t , M. ( 1 9 8 4 ) . "The i n f o r m a t i o n c o n t e n t o f U . K . a n n u a l e a r n i n g s a n n o u n c e m e n t s : a n o t e " , A c c o u n t i n g a n d F i n a n c e , May, p p .3 1 - 5 8 .
M a l k i e l , B . G. & C r a g g , J . C. ( 1 9 7 0 ) . " E x p e c t a t i o n s a n d t h e s t r u c t u r e o f s h a r e p r i c e s " , T h e A m e r i c a n E c o n o m i c R e v i e w ,S e p t e m b e r , p p . 6 0 1 - 6 1 7 .
M a r k o w i t z , H. ( 1 9 5 2 ) . " P o r t f o l i o s e l e c t i o n " , J o u r n a l o f F i n a n c e , V o l . 7 , M a r c h , p p . 7 7 - 9 1 .
M a r k o w i t z , H. ( 1 9 5 9 ) . P o r t f o l i o S e l e c t i o n : E f f i c i e n tD i v e r s i f i c a t i o n o f I n v e s t m e n t s , C o w l e s F o u n d a t i o n M o n o g r a p h 1 6 , New Y o r k : J o h n W i l e y & S o n s .
M a r t i n , A . ( 1 9 7 1 ) . "An e m p i r i c a l t e s t o f t h e r e l e v a n c e o fa c c o u n t i n g i n f o r m a t i o n f o r i n v e s t m e n t d e c i s i o n s " , E m p i r i c a lR e s e a r c h i n A c c o u n t i n g : S e l e c t e d S t u d i e s 1 9 7 1 , s u p p l e m e n t t oJ o u r n a l o f A c c o u n t i n g R e s e a r c h , p p . 1 - 2 5 .
M a t o l c s y , Z. P . ( 1 9 8 4 ) . " E v i d e n c e o n t h e j o i n t a n d m a r g i n a l i n f o r m a t i o n c o n t e n t o f i n f l a t i o n - a d j u s t e d a c c o u n t i n g i n c o m e n u m b e r s " , J o u r n a l o f A c c o u n t i n g R e s e a r c h , V o l . 2 2 , A u t u m n , p p . 5 5 5 - 5 6 9 .
May , R . ( 1 9 7 1 ) . "The i n f l u e n c e o f q u a r t e r l y e a r n i n g s a n n o u n c e m e n t s o n i n v e s t o r d e c i s i o n o f r e f l e c t e d i n common s t o c k p r i c e c h a n g e s " , s u p p l e m e n t t o J o u r n a l o f A c c o u n t i n g R e s e a r c h , p p . 1 1 9 - 1 6 3 .
Ma y, R. G. & S u n d e m , G. L . ( 1 9 7 6 ) . " R e s e a r c h f o r a c c o u n t i n g p o l i c y : a n o v e r v i e w " , A c c o u n t i n g R e v i e w , V o l . L I , O c t o b e r , p p .7 4 7 - 7 6 3 .
M c C a s l i n , T . E . & S t a n g a , K. G. ( 1 9 8 3 ) . " R e l a t e d q u a l i t i e s o f u s e f u l a c c o u n t i n g i n f o r m a t i o n " , A c c o u n t i n g a n d B u s i n e s s R e s e a r c h , W i n t e r , p p . 3 5 - 4 1 .
M c N i c h o l s , M. & M a n e g o l d , J . G. ( 1 9 8 3 ) . "The e f f e c t o f t h e i n f o r m a t i o n e n v i r o n m e n t o n t h e r e l a t i o n s h i p b e t w e e n f i n a n c i a l d i s c l o s u r e a n d s e c u r i t y p r i c e v a r i a b i l i t y " , J o u r n a l o f A c c o u n t i n g a n d E c o n o m i c s , A p r i l , p p . 4 9 - 7 4 .
470
M e a d e r , J . W. ( 1 9 3 5 ) . "A f o r m u l a f o r d e t e r m i n i n g b a s i c v a l u e s u n d e r l y i n g common s t o c k p r i c e " , T h e A n a l y s t , V o l . 2 9 , N o v e m b e r ,p p . 7 4 3 - 7 5 2 .
M e a d e r , J . W. ( 1 9 4 0 ) . " S t o c k p r i c e e s t i m a t i n g f o r m u l a s , 1 9 3 0 - 1 9 4 0 " , T h e A n a l y s t , V o l . 2 7 , J u n e , p p . 8 8 4 - 8 9 7 .
M e n s a h Y. M. ( 1 9 8 3 ) . "The d i f f e r e n t i a l b a n k r u p t c y p r e d i c t i v ea b i l i t y o f s p e c i f i c p r i c e l e v e l a d j u s t m e n t s : so m e e m p i r i c a le v i d e n c e " , A c c o u n t i n g R e v i e w , A p r i l , p p . 2 2 8 - 2 4 5 .
M i l l e r , M. H. & M o d i g l i a n i , F . ( 1 9 5 1 ) . " D i v i d e n d p o l i c y , g r o w t h a n d t h e v a l u a t i o n o f s h a r e s " , J o u r n a l o f B u s i n e s s , V o l . 3 4 , O c t o b e r , p p . 4 1 1 - 4 3 3 .
M i l l e r , M. H. & M o d i g l i a n i , F . ( 1 9 6 6 ) . "Some e s t i m a t e s o f t h ec o s t o f c a p i t a l t o t h e e l e c t r i c u t i l i t y i n d u s t r y " , A m e r i c a n E c o n o m i c R e v i e w , J u n e , p p . 3 3 4 - 3 9 1 .
M o d i g l i a n i , F . & M i l l e r , M. H. ( 1 9 5 8 ) . "The c o s t o f c a p i t a l ,c o r p o r a t i o n f i n a n c e , an d t h e t h e o r y o f i n v e s t m e n t s " , A m e r i c a nE c o n o m i c R e v i e w , V o l . X L V I I I , M a r c h , p p . 2 6 1 - 2 9 7 .
M o o n i t z , M. ( 1 9 6 1 ) . A R S 1 : T h e B a s i c P o s t u l a t e s o f A c c o u n t i n g , New Y o r k : AICPA.
M o r s e , D. ( 1 9 8 0 ) . "A s y m m e t r i c a l i n f o r m a t i o n i n s e c u r i t i e sm a r k e t s a n d t r a d i n g v o l u m e " , J o u r n a l o f F i n a n c i a l a n d Q u a n t i t a t i v e A n a l y s i s , D e c e m b e r , p p . 1 1 2 9 - 1 1 4 8 .
M o r s e , D. ( 1 9 8 1 ) . " P r i c e a n d t r a d i n g v o l u m e r e a c t i o n s u r r o u n d i n g e a r n i n g s a n n o u n c e m e n t s : a c l o s e r e x a m i n a t i o n " , J o u r n a l o fA c c o u n t i n g R e s e a r c h , A u t u m n , p p . 3 7 4 - 3 8 3 .
M o s s i n , J . ( 1 9 6 6 ) . " E q u i l i b r i u m i n a c a p i a l a s s e t m a r k e t " E c o n o m e t r i c a l , V o l . XXXIV, O c t o b e r , 1 9 6 6 , p p . 7 6 8 - 8 7 3 .
M u r d o c h , B. ( 1 9 8 6 ) . "The i n f o r m a t i o n c o n t e n t o f FAS 3 3 r e t u r n s o n e q u i t y " , A c c o u n t i n g R e v i e w , V o l . L X I , A p r i l , p p . 2 7 3 - 2 8 7 .
M y d d l e t o n , D. R. ( 1 9 8 4 ) . On a C l o t h U n t r u e , C a m b r i d g e : W o o g h e a d - F a u l k n e r .
471
M y e r s , J . ( 1 9 5 9 ) . "The c r i t i c a l e v e n t r e c o g n i t i o n o f n e t p r o f i t " , i n S . A . Z e f f & T. K e l l e r ( e d s . ) , F i n a n c i a l A c c o u n t i n g T h e o r y 1 , p p . 1 5 8 - 1 6 3 , New Y o r k : M c G r a w - H i l l .
M y n a t t , P . G. ( 1 9 8 8 ) . T h e I n f o r m a t i o n C o n t e n t o f F i n a n c i a l S t a t e m e n t s R e l e a s e s , u n p u b l i s h e d P h . D d i s s e r t a t i o n , C h a p e l H i l l : U n i v e r s i t y o f N o r t h C a r o l i n a .
N e t e r , J . , W a s s e r m a n , M. & K u t n e r H. ( 1 9 8 5 ) . A p p l i e d S t a t i s t i c a l M e t h o d s , 2 n d e d n . , Hom ew ood , 1 1 1 : I r w i n .
N o r e e n , E . & S e p e , J . ( 1 9 8 1 ) . " M a r k e t r e a c t i o n s t o a c c o u n t i n g p o l i c y d e l i b e r a t i o n s : t h e i n f l a t i o n a c c o u n t i n g c a s e " , A c c o u n t i n gR e v i e w , V o l . L V I , A p r i l , p p . 2 5 3 - 2 6 9 .
N o r t o n , C. L . & S m i t h , R. E . ( 1 9 7 9 ) . "A c o m p a r i s o n o f g e n e r a l p r i c e l e v e l an d h i s t o r i c a l c o s t f i n a n c i a l s t a t e m e n t s i n t h e p r e d i c t i o n o f b a n k r u p t c y " , A c c o u n t i n g R e v i e w , J a n u a r y , p p . 7 2 - 8 7 .
N o r u s i s , M. J . ( 1 9 8 3 ) . S p s s x I n t r o d u c t o r y S t a t i s t i c s G u i d e , New Y o r k : M c G r a w - H i l l .
N u n t h i r a p a k o r n , T . & M i l l a r , J . A . ( 1 9 8 7 ) . " C h a n g i n g p r i c e s , a c c o u n t i n g e a r n i n g s a n d s y s t e m a t i c r i s k " , J o u r n a l o f B u s i n e s s F i n a n c e a n d A c c o u n t i n g , V o l . 1 4 , S p r i n g , p p . 1 - 2 5 .
O ' B r i e n , F . J . ( 1 9 7 9 ) . "The a s s o c i a t i o n b e t w e e n m a r k e t d e t e r m i n e d a n d a c c o u n t i n g d e t e r m i n e d r i s k m e a s u r e s i n t h e I r i s h e c o n o m y , 1 9 6 6 - 1 9 7 6 " , u n p u b l i s h e d P h . D d i s s e r t a t i o n , U n i v e r s i t y o f P i t t s b u r g h , P i t t s b u r g h .
O ' C o n n o r , M. D. ( 1 9 7 3 ) . " U s e f u l n e s s o f f i n a n c i a l r a t i o s t o i n v e s t o r s " , A c c o u n t i n g R e v i e w , A p r i l , p p . 3 3 9 - 3 5 2 .
O ' D o n n e l l , J . ( 1 9 6 5 ) . " R e l a t i o n a h i p s b e t w e e n r e p o r t e d e a r n i n g s a n d s t o c k p r i c e s i n t h e e l e c t r i c u t i l i t y i n d u s t r y " , A c c o u n t i n g R e v i e w , J a n u a r y , p p . 1 3 5 - 1 4 3 .
O h l s o n , J . A. ( 1 9 8 9 ) . " A c c o u n t i n g e a r n i n g s , b o o k v a l u e , a n d d i v i d e n d s : t h e t h e o r y o f t h e c l e a n s u r p l u s e q u a t i o n ( p a r t 1 ) " , u n p u b l i s h e d w o r k i n g p a p e r , New Y o r k : C o l u m b i a U n i v e r s i t y .
472
Ou, J . A. & P e n m a n , S . H. ( 1 9 8 9 ) . " A c c o u n t i n g m e a s u r e m e n t , p r i c e - e a r n i n g s r a t i o s , a n d t h e i n f o r m a t i o n c o n t e n t o f s e c u r i t y p r i c e s " , J o u r n a l o f A c c o u n t i n g R e s e a r c h , V o l . 2 7 , S p r i n g , p p . 1 1 1 - 1 4 4 .
Ou, J . A. & P e n m a n , S . H. ( 1 9 8 9 ) . " F i n a n c i a l s t a t e m e n t a n a l y s i s and t h e p r e d i c t i o n o f s t o c k r e t u r n s " , J o u r n a l o f A c c o u n t i n g a n d E c o n o m i c s , p p . 2 9 5 - 3 2 9 .
P a g e , M. ( 1 9 8 4 a ) . " E x p l a n a t o r y p o w e r o f c u r r e n t c o s t a c c o u n t i n g " . I n B . V . C a r s b e r g & M. P a g e ( e d s . ) , C u r r e n t C o s t A c c o u n t i n g : T h e B e n e f i t s a n d t h e C o s t s , V o l . 3 , p p . 2 7 3 - 2 8 7 , L o n d o n : P r e n t i c e - H a l l & ICAE&W.
P a g e , M. ( 1 9 8 4 b ) . "The a v a i l a b i l i t y o f d a t a f o r c u r r e n t c o s t a c c o u n t i n g " . I n B. V. C a r s b e r g s & M. P a g e ( e d s . ) , C u r r e n t C o s t A c c o u n t i n g : T h e B e n e f i t s a n d C o s t s , V o l . 2 , p p . 1 9 5 - 2 1 6 , L o n d o n : P r e n t i c e - H a l l & ICAE&W.
P a l e p u , K. G. " P r e d i c t i n g T a k e o v e r T a r g e t s : a m e t h o d o l o g i c a l and e m p i r i c a l a n a l y s i s " , J o u r n a l o f A c c o u n t i n g a n d E c o n o m i c s , M a r c h , p p . 3 - 3 5 .
P a t e l l , J . M. ( 1 9 7 6 ) . " C o r p o r a t e f o r e c a s t s o f e a r n i n g s p e r s h a r e a n d s t o c k p r i c e b e h a v i o u r " , J o u r n a l o f A c c o u n t i n g R e s e a r c h , A u t u m n , p p . 2 4 6 - 2 7 6 .
P a t e l l , J . & W o l f s o n , M. ( 1 9 7 9 ) . " A n t i c i p a t e d i n f o r m a t i o n r e l e a s e s r e f l e c t e d i n c a l l o p t i o n p r i c e s " , J o u r n a l o f A c c o u n t i n g a n d E c o n o m i c s , A u g u s t , p p . 1 1 7 - 1 4 0 .
P a t e l l , J . & W o l f s o n , M. ( 1 9 8 1 ) . "The e x a n t e a n d e x p o s t p r i c e e f f e c t s o f q u a r t e r l y e a r n i n g s a n n o u n c e m e n t s r e f l e c t e d i n o p t i o n and s t o c k p r i c e s " , J o u r n a l o f A c c o u n t i n g R e s e a r c h , A u t u m n , p p . 4 3 4 - 4 5 8 .
P a t o n , W. A. ( 1 9 1 8 ) . "The s i g n i f i c a n c e a n d t r e a t m e n t o f a p p r e c i a t i o n i n a c c o u n t s " , i n S . A. Z e f f ( e d . ) , A s s e t A p p r e c i a t i o n , B u s i n e s s I n c o m e a n d P r i c e - L e v e l A c c o u n t i n g ,1 9 1 8 - 1 9 3 5 , p p . 3 5 - 4 9 , New Y o r k : Ann A r b o r .
P a t o n W. A. ( 1 9 2 0 ) . " D e p r e c i a t i o n , a p p r e c i a t i o n a n d p r o d u c t i v e c a p a c i t y " , i n G. W. D e a n & M. C. W e l l s ( e d s . ) , C u r r e n t C o s t A c c o u n t i n g I d e n t i f y i n g t h e I s s u e s : A B o o k o f R e a d i n g s , 2 n d e d n . ,p p . 3 0 - 3 5 , L a n c a s t e r : I n t e r n a t i o n a l C e n t r e f o r R e s e a r c h i nA c c o u n t i n g .
473
P e a s n e l l , K. V . , S k e r r a t t , L . C. L . & Ward, W. R. ( 1 9 8 7 ) . "The s h a r e p r i c e i m p a c t o f UK CCA d i s c l o s u r e s " , A c c o u n t i n g a n d B u s i n e s s R e s e a r c h , V o l . 1 8 , N o . 6 9 , p p . 3 - 5 7 .
P i n d y c k , R. S . & R u b i n f e l d , D. L . ( 1 9 8 1 ) . E c o n o m e t r i c M o d e l s a n d E c o n o m i c F o r e c a s t s , 2 n d e d n . , New Y o r k : M c G r a w - H i l l .
P r a k a s h , P . & S u n d e r , S . ( 1 9 7 9 ) . "The c a s e a g a i n s t s e p a r a t i o n o f c u r r e n t o p e r a t i n g p r o f i t a n d h o l d i n g g a i n " , A c c o u n t i n g R e v i e w , V o l . 5 4 , J a n u a r y , p p . 1 - 2 2 .
R e e d P a r k e r , C. ( 1 9 6 7 ) . " D i s c u s s i o n o f p u b l i s h e d a c c o u n t i n g d a t a a n d s t o c k p r i c e s " , E m p i r i c a l R e s e a r c h i n A c c o u n t i n g : S e l e c t e dS t u d i e s 1 9 6 7 , s u p p l e m e n t t o J o u r n a l o f A c c o u n t i n g R e s e a r c h , p p . 1 5 - 1 8 .
R e e s , W. ( 1 9 9 0 ) . F i n a n c i a l A n a l y s i s , L o n d o n : P r e n t i c e - H a l l .
R e n d l e m a n , R . , J o n e s , C. & L a t a n e , H. ( 1 9 8 2 ) . " E m p i r i c a l a n o m a l i e s b a s e d o n u n e x p e c t e d e a r n i n g s a n d t h e i m p o r t a n c e o f r i s k a d j u s t m e n t s " , J o u r n a l o f F i n a n c i a l E c o n o m i c s , N o v e m b e r , p p . 2 6 9 - 2 8 7 .
R e v s i n e , L . ( 1 9 7 3 ) . R e p l a c e m e n t C o s t A c c o u n t i n g , E n g l e w o o d C l i f f s , NJ : P r e n t i c e - H a l l .
R e v s i n e , L . & W e y g a n d t , J . J . ( 1 9 7 4 ) . " A c c o u n t i n g f o r i n f l a t i o nt h e c o n t r o v e r s y " , J o u r n a l o f A c c o u n t a n c y , O c t o b e r , p p . 7 2 - 7 8 .
R i c k s , W. ( 1 9 8 2 ) . "The m a r k e t ' s r e s p o n s e t o t h e 1 9 7 4 LIFOa d o p t i o n s " , J o u r n a l o f A c c o u n t i n g R e s e a r c h , A u t u m n , p p . 3 6 7 - 3 8 7 .
R o , B . T . ( 1 9 8 0 ) . "The a d j u s t m e n t o f s e c u r i t y r e t u r n s t o t h ed i s c l o s u r e o f r e p l a c e m e n t c o s t a c c o u n t i n g i n f o r m a t i o n " , J o u r n a l O f A c c o u n t i n g a n d E c o n o m i c s , N o . 2 , p p . 1 5 9 - 1 8 9 .
R o , B . T . ( 1 9 8 1 ) . "T he d i s c l o s u r e o f r e p l a c e m e n t c o s t a c c o u n t i n g d a t a a n d i t s e f f e c t o n t r a n s a c t i o n v o l u m e s " , A c c o u n t i n g R e v i e w , V o l . L V I , J a n u a r y , p p . 7 0 - 8 4 .
R o , B . T . ( 1 9 8 8 ) . " F i r m s i z e a n d t h e i n f o r m a t i o n c o n t e n t o f a n n u a l e a r n i n g s a n n o u n c e m e n t s " , C o n t e m p o r a r y A c c o u n t i n g R e s e a r c h , S p r i n g , p p . 4 3 8 - 4 4 9 .
474
R o l l , R. ( 1 9 8 8 ) . "R2 ", J o u r n a l o f F i n a n c e , V o l . L X I I I , J u l y , p p .5 4 1 - 5 6 6 .
R o s e n b e r g , B . & G u y , J . ( 1 9 7 6 a ) . " P r e d i c t i o n o f b e t a f r o m i n v e s t m e n t s f u n d a m e n t a l s " , F i n a n c i a l A n a l y s t s J o u r n a l , ( M a y / J u n e , p p . 1 - 1 5 .
R o s e n b e r g , B . & G u y , J . ( 1 9 7 6 b ) . " P r e d i c t i o n o f b e t a f r o m i n v e s t m e n t s f u n d a m e n t a l s " , F i n a n c i a l A n a l y s t s J o u r n a l ,J u l y / A u g u s t , p p . 1 - 1 1 .
R o s e n b e r g , B . & Me K i b b e n , W. ( 1 9 7 3 ) . "The p r e d i c t i o n o f s y s t e m a t i c a n d s p e c i f i c r i s k i n common s t o c k s , " J o u r n a l o f F i n a n c i a l a n d Q u a n t i t a t i v e A n a l y s i s , V o l . V I I I , M a r c h , p p .3 1 7 - 3 3 3 .
R o s e n b e r g , B . & R u d d , A. ( 1 9 8 2 ) . " F a c t o r r e l a t e d a n d s p e c i f i c r e t u r n s o f common s t o c k s : s e r i a l c o r r e l a t i o n a n d m a r k e te f f i c i e n c y " , J o u r n a l o f F i n a n c e , May, p p . 5 4 3 - 5 5 4 .
R o z e f f , M. & K i n n e y , W. ( 1 9 7 6 ) , " C a p i t a l m a r k e t s e a s o n a l i t y : t h e c a s e o f s t o c k r e t u r n s " , J o u r n a l o f F i n a n c i a l E c o n o m i c s , O c t o b e r , p p . 3 7 9 - 4 0 2 .
R u t t e r f o r d , J . ( 1 9 8 3 ) . I n t r o d u c t i o n t o t h e S t o c k E x c h a n g e I n v e s t m e n t , L o n d o n : M a c m i l l a n .
S a m i , H. & T r a p n e l l , J . E . ( 1 9 8 7 ) . " I n f l a t i o n - a d j u s t e d d a t a an d s e c u r i t y p r i c e s : s o m e e m p i r i c a l e v i d e n c e " , A d v a n c e s i n A c c o u n t i n g , V o i 5 , p p . 3 9 - 5 7 .
S a n d i l a n d s , F . E . P . ( 1 9 7 5 ) . I n f l a t i o n A c c o u n t i n g : R e p o r t o fI n f l a t i o n A c c o u n t i n g C o m m i t t e e , L o n d o n : HMSO.
S c a p e n s , R. W. ( 1 9 8 1 ) . A c c o u n t i n g i n a n I n f l a t i o n a r y E n v i r o n m e n t , L o n d o n : M a c m i l l a n .
S c h a e f e r , T . F . ( 1 9 8 4 ) . "The i n f o r m a t i o n c o n t e n t o f c u r r e n t c o s t i n c o m e r e l a t i v e t o d i v i d e n d s a n d h i s t o r i c a l c o s t i n c o m e " , J o u r n a l o f A c c o u n t i n g R e s e a r c h , V o l . 2 2 , A u t u m n , p p . 6 4 7 - 6 5 6 .
S c h w a r t z , R. & W h i t c o m b , D. ( 1 9 7 7 a ) . "The t i m e - v a r i a n c e r e l a t i o n s h i p e v i d e n c e o n a u t o c o r r e l a t i o n i n common s t o c k r e t u r n s " , J o u r n a l o f F i n a n c e , M a r c h , p p . 4 1 - 5 6 .
475
S c h w a r t z , R . & W h i t c o m b , D. ( 1 9 7 7 b ) . " E v i d e n c e o n t h e p r e s e n c e a n d c a u s e s o f s e r i a l c o r r e l a t i o n i n m a r k e t m o d e l r e s i d u a l s " , J o u r n a l o f F i n a n c i a l a n d Q u a n t i t a t i v e A n a l y s i s , J u n e , p p . 2 9 1 - 3 1 4 .
S e c u r i t i e s a n d E x c h a n g e C o m m i s s i o n ( 1 9 7 6 ) . A S R 1 9 0 : A m e n d m e n t s t o R e g u l a t i o n S - X R e q u i r i n g D i s c l o s u r e o f R e p l a c e m e n t C o s t D a t a , W a s h i n g t o n , D . C . : SEC.
S h a r p e , W. ( 1 9 6 3 ) . "A s i m p l i f i e d m o d e l o f p o r t f o l i o a n a l y s i s " , M a n a g e m e n t S c i e n c e , J a n u a r y , p p . 2 7 7 - 2 9 3 .
S h a r p e , W. ( 1 9 6 4 ) . " C a p i t a l a s s e t p r i c e s : a t h e o r y o f m a r k e te q u i l i b r i u m u n d e r c o n d i t i o n s o f r i s k " , J o u r n a l o f F i n a n c e , S e p t e m b e r , p p . 4 2 5 - 4 4 2 .
S h a r p e , W. F . & C o o p e r , G. M. ( 1 9 7 2 ) . " R i s k r e t u r n c l a s s e s o f New Y o r k s t o c k e x c h a n g e common s t o c k s , 1 9 3 1 - 1 9 6 7 " , F i n a n c i a l A n a l y s t s J o u r n a l , M a r c h - A p r i l , p p . 4 6 - 5 4 .
S h o r t , D. ( 1 9 7 8 ) . "The i m p a c t o f p r i c e - l e v e l a d j u s t m e n t i n t h e c o n t e x t o f r i s k a s s e s s m e n t " , s u p p l e m e n t t o J o u r n a l o f A c c o u n t i n g R e s e a r c h , V o l . 1 6 , p p . 2 5 9 - 2 7 2 .
S h r i v e r , K. A . ( 1 9 8 7 ) . "An e m p i r i c a l e x a m i n a t i o n o f p o t e n t i a l m e a s u r e m e n t e r r o r i n c u r r e n t c o s t d a t a " , A c c o u n t i n g R e v i e w , V o l . L X I I , J a n u a r y , p p . 7 9 - 9 6 .
S h w a y d e r , K. ( 1 9 6 7 ) . "A c r i t i q u e o f e c o n o m i c i n c o m e a s a n a c c o u n t i n g c o n c e p t " , A b a c u s , J a n u a r y , p p . 3 2 3 - 3 4 5 .
S i e g e l , S . ( 1 9 5 6 ) . N o n - P a r a m e t r i c S t a t i s t i c s , New Y o r k : M c G r a w - H i l l .
S i m k o w i t z , M. & M o n r o e , R. ( 1 9 7 1 ) . "A d i s c r i m i n a n t a n a l y s i s f u n c t i o n f o r c o n g l o m e r a t e t a r g e t s " , T h e S o u t h e r n J o u r n a l o f B u s i n e s s , N o v e m b e r , p p . 1 - 1 6 .
S k e r r a t t , L . C. L . & T h o m p s o n , A. P . ( 1 9 8 4 ) . " M a r k e t r e a c t i o n t o SSAP 16 c u r r e n t c o s t a c c o u n t i n g d i s c l o s u r e s " . Irt B . V . C a r s b e r g & M. P a g e ( e d s . ) , C u r r e n t C o s t A c c o u n t i n g : T h e B e n e f i t s a n d t h eC o s t s , V o l . 3 , p p . 2 8 9 - 3 1 9 .
S k o g s v i k , K. ( 1 9 9 0 ) . " C u r r e n t c o s t a c c o u n t i n g r a t i o s a s t h ep r e d i c t o r s o f b u s i n e s s f a i l u r e : t h e S w e d i s h c a s e " , J o u r n a l o f B u s i n e s s F i n a n c e a n d A c c o u n t i n g , V o l . 1 7 , S p r i n g , p p . 1 3 7 - 1 6 0 .
476
S o l n i c k , B. ( 1 9 7 3 ) . " N o t e o n t h e v a l i d i t y o f r a n d o m w a l k f o rE u r o p e a n s t o c k p r i c e s " , J o u r n a l o f F i n a n c e , p p . 1 1 5 1 - 1 1 5 9 .
S o l o m o n s , D. ( 1 9 6 6 a ) . " R e v i e w o f C h a m b e r s " , A b a c u s , D e c e m b e r , p p . 6 0 4 - 6 0 5 .
S o l o m o n s , D. ( 1 9 6 6 b ) . " E c o n o m i c a n d a c c o u n t i n g c o n c e p t s o f c o s t a n d v a l u e " , i n M. B a c k e r ( e d . ) , M o d e r n A c c o u n t i n g T h e o r y , c h . 6 , E n g l e w o o d C l i f f s , N. J . : P r e n t i c e - H a l l .
S o l o m o n s , D. ( 1 9 8 9 ) . G u i d e l i n e s f o r F i n a n c i a l R e p o r t i n g S t a n d a r d s , L o n d o n : ICAE&W.
S o o r o s h J o o , J . ( 1 9 8 2 ) . A n E m p i r i c a l E v a l u a t i o n o f FAS B 3 3 F i n a n c i a l R e p o r t i n g a n d C h a n g i n g P r i c e s , Ann A r b o r , M i c h i g a n : UMIR e s e a r c h P r e s s .
S o u g i a n n a i s , T . ( 1 9 9 0 ) . "The e f f e c t o f a c c o u n t i n g r u l e s o n t h e v a l u a t i o n o f a c c o u n t i n g n u m b e r s : t h e c a s e o f R&D c o s t s " ,u n p u b l i s h e d p a p e r p r e s e n t e d a t an a c c o u n t i n g s e m i n a r i n F e b r u a r y , a t t h e U n i v e r s i t y o f C a l i f o r n i a , B e r k e l e y .
S p r o u s e , R. ( 1 9 7 3 ) . "The b a l a n c e s h e e t - e m b o d i m e n t o f t h e m o s t f u n d a m e n t a l e l e m e n t s o f a c c o u n t i n g t h e o r y " , i n S . Z e f f & T. K e l l e r ( e d s . ) , F i n a n c i a l A c c o u n t i n g T h e o r y 1 , p p . 1 6 6 - 1 7 4 , New Y o r k : M c G r a w - H i l l .
S p r o u s e , R. T . & M o o n i t z , M. ( 1 9 6 2 ) . A R S 3 : A T e n t a t i v e S e t o f B r o a d A c c o u n t i n g P r i n c i p l e s f o r B u s i n e s s E n t e r p r i s e s , New Y o r k : AICPA.
S P S S x ( 1 9 8 8 ) . S P S S - x U s e r ' s G u i d e , 3 r d e d n . , C h i c a g o , 1 1 1 : S P S S .
S t a m p , E . ( 1 9 7 1 ) . " I n c o m e a n d v a l u e d e t e r m i n a t i o n a n d c h a n g i n g p r i c e - l e v e l s : a n e s s a y t o w a r d s a t h e o r y " , T h e A c c o u n t a n t sM a g a z i n e , J u n e , p p . 2 7 7 - 2 9 2 .
S t a n g a , K. G. ( 1 9 8 0 ) . "The r e l a t i o n s h i p b e t w e e n r e l e v a n c e and r e l i a b i l i t y : s o m e e m p i r i c a l r e s u l t s " , A c c o u n t i n g a n d B u s i n e s sR e s e a r c h , W i n t e r , p p . 2 9 - 3 9 .
S t e r l i n g , R. R. ( 1 9 7 0 ) . "On t h e o r y c o n s t r u c t i o n a n d v e r i f i c a t i o n " , A c c o u n t i n g R e v i e w , J u l y , p p . 4 4 4 - 4 5 7 .
477
S t e r l i n g , R. R. ( 1 9 7 9 ) . T h e o r y o f t h e M e a s u r e m e n t o f E n t e r p r i s e I n c o m e , H o u s t o n : S c h o l a r s BooK Co.
S t e r l i n g , R . ( 1 9 8 0 ) . " C o m p a n i e s a r e r e p o r t i n g u s e l e s s n u m b e r s " , F o r t u n e , J a n u a r y , p p . 1 0 5 - 1 0 7 .
S t e w a r t , J . ( 1 9 8 4 ) . U n d e r s t a n d i n g E c o n o m e t r i c s , 2 n d e d n . ,L o n d o n : H u t c h i n s o n .
S t r o n g , N. C. & W a l k e r , M. ( 1 9 9 2 ) , "The e x p l a n a t o r y p o w e r o f e a r n i n g s f o r s t o c k r e t u r n s " , p a p e r p r e s e n t e d a t r e s e a r c h w o r k s h o p a t U n i v e r s i t y C o l l e g e C o r k .
S t u d e n m u n d , A . H. & C a s s i d y , H. J . ( 1 9 8 7 ) . U s i n g E c o n o m e t r i c s , B o s t o n : L i t t l e , Br ow n & Co.
S u n d e r , S . ( 1 9 7 3 ) . " R e l a t i o n s h i p b e t w e e n a c c o u n t i n g c h a n g e s a n d s t o c k p r i c e s : p r o b l e m s o f m e a s u r e m e n t a n d so m e e m p i r i c a le v i d e n c e " , E m p i r i c a l R e s e a r c h i n A c c o u n t i n g : S e l e c t e d S t u d i e s1 9 7 3 , s u p p l e m e n t t o J o u r n a l o f A c c o u n t i n g R e s e a r c h , p p . 1 - 4 5 .
S u n d e r , S . ( 1 9 7 5 ) . " S t o c k p r i c e a n d r i s k r e l a t e d t o a c c o u n t i n g c h a n g e s i n i n v e n t o r y v a l u a t i o n " , A c c o u n t i n g R e v i e w , A p r i l , p p . 3 0 5 - 3 1 5 .
S w a n s o n , E . P . & S h r i v e r , K. A . ( 1 9 8 7 ) . "The a c c o u n t i n g - f o r - c h a n g i n g - p r i c e s e x p e r m i n e n t : a v a l i d t e s t o fu s e f u l n e s s ? " , A c c o u n t i n g H o r i z o n s , S e p t e m b e r , p p . 6 9 - 7 7 .
S w e e n e y , H. W. ( 1 9 3 6 ) . S t a b i l i z e d A c c o u n t i n g , New Y o r k : H a r p e rB r o t h e r s , r e p r i n t e d e d . , 1 9 7 8 , New Y o r k : A r n o P r e s s .
T a f f l e r , R. J . ( 1 9 7 6 ) . " F i n d i n g t h o s e f i r m s i n d a n g e r , " A c c o u n t a n c y A g e , 1 6 , J u l y .
T a f f l e r , R. J . ( 1 9 8 3 a ) . "The z - s c o r e a p p r o a c h t o m e a s u r i n g c o m p a n y s o l v e n c y " , T h e A c c o u n t a n t s M a g a z i n e , V o l . 8 7 , N o . 9 2 1 , M a r c h , p p . 9 1 - 9 6 .
T a f f l e r , R. J . ( 1 9 8 3 b ) . "The a s s e s s m e n t o f c o m p a n y s o l v e n c y a n d p e r f o r m a n c e u s i n g a s t a t i s t i c a l m o d e l : a c o m p a r a t i v e U K - b a s e ds t u d y , ” A c c o u n t i n g a n d B u s i n e s s R e s e a r c h , V o l . 1 5 , N o . 5 2 , A u t u m n , p p . 2 9 5 - 3 0 8 .
478
T a f f l e r , R. J . ( 1 9 8 4 ) . " E m p i r i c a l m o d e l s f o r t h e m o n i t o r i n g o f UK c o r p o r a t i o n s " , J o u r n a l o f B a n k i n g a n d F i n a n c e , A u g u s t , p p . 1 9 9 - 2 2 7 .
T h o m a s , A . L . ( 1 9 6 9 ) . A R S 9 : T h e A l l o c a t i o n P r o b l e m i n F i n a n c i a l A c c o u n t i n g , E v a n s t o n , I I I . : AAA.
T h o m a s , A. L . ( 1 9 7 4 ) . ARS 9 : T h e A l l o c a t i o n P r o b l e m : P a r t T w o ,S a r a s o t a , F l a . : AAA.
T h o m p s o n , D . J . ( 1 9 7 6 ) . " S o u r c e s o f s y s t e m a t i c r i s k i n common s t o c k s " , J o u r n a l o f B u s i n e s s , A p r i l , p p . 1 7 3 - 1 8 8 .
T i n i c , S . M. ( 1 9 9 0 ) . "A p e r s p e c t i v e o n t h e s t o c k m a r k e t ' s f i x a t i o n o n a c c o u n t i n g n u m b e r s " , A c c o u n t i n g R e v i e w , p p . 7 8 1 - 8 9 6 .
T i s s h a w , H . J . ( 1 9 8 2 ) . "A s t u d y i n t o t h e r e l a t i o n s h i p b e t w e e na c c o u n t i n g i n f o r m a t i o n a n d s h a r e p r i c e s " , u n p u b l i s h e d P h . D . d i s s e r t a t i o n , C i t y U n i v e r s i t y L o n d o n .
T o b i n , J . ( 1 9 5 8 ) . " L i q u i d i t y p r e f e r e n c e a s b e h a v i o u r t o w a r d sr i s k " , R e v i e w o f E c o n o m i c S t u d i e s , V o l . XXV, F e b r u a r y , p p . 6 5 - 8 5 .
T w e e d i e , D. & W h i t t i n g t o n , G. ( 1 9 8 4 ) . T h e D e b a t e o n I n f l a t i o n A c c o u n t i n g , C a m b r i d g e : C a m b r i d g e U n i v e r s i t y P r e s s .
T w e e d i e , D. & W h i t t i n g t o n , G. ( 1 9 8 5 ) . C a p i t a l M a i n t e n a n c eC o n c e p t s , L o n d o n : ASC
V e r r e c c h i a , R. E . ( 1 9 8 1 ) . "On t h e r e l a t i o n s h i p b e t w e e n v o l u m e an d c o n s e n s u s o f i n v e s t o r s : i m p l i c a t i o n s f o r i n t e r p r e t i n g t e s t s o fi n f o r m a t i o n c o n t e n t " , J o u r n a l o f A c c o u n t i n g R e s e a r c h , N o . 1 9 , S p r i n g , p p . 2 7 1 - 2 8 3 .
Von N e u m a n n , J . & M o r g e n s t e r n , 0 . ( 1 9 4 4 ) . T h e o r y o f G a m e s a n dE c o n o m i c B e h a v i o r , 3 r d e d n . , P r i n c e t o n , N . J . : P r i n c e t o nU n i v e r s i t y P r e s s .
W a l k e r , M. ( 1 9 9 2 ) . " M a r k e t b a s e d a c c o u n t i n g r e s e a r c h : i s s u e s ,a c h i e v e m e n t s , a n d f u t u r e d e v e l o p m e n t s " , p a p e r p r e s e n t e d a t r e s e a r c h w o r k s h o p a t U n i v e r s i t y C o l l e g e C o r k .
W a l t e r , J . E . ( 1 9 5 9 ) . " D i v i d e n d p o l i c i e s a n d common s t o c k p r i c e s " , J o u r n a l o f F i n a n c e , V o l . I I , N o . 1 , M a r c h , p p . 2 9 - 4 1 .
479
W a n l e s s , R. T . ( 1 9 7 4 ) . " R e f l e c t i o n s o n a s s e t v a l u a t i o n s a n d v a l u e t o t h e f i r m " , A b a c u s , p p . 1 6 0 - 1 6 4 .
W a n s l e y , J . , R o e n f e l d t , R. Si C o o l e y , P . ( 1 9 8 3 ) . " A b n o r m a l r e t u r n s f r o m m e r g e r p r o f i l e s " , J o u r n a l o f F i n a n c i a l a n d Q u a n t i t a t i v e A n a l y s i s , J u n e , p p . 1 4 9 - 1 6 2 .
W a r n e r , G. H. ( 1 9 5 4 ) . " D e p r e c i a t i o n o n a c u r r e n t b a s i s " , A c c o u n t i n g R e v i e w , V o l . 2 9 , O c t o b e r , p p . 6 2 8 - 6 3 3 .
W a t t s , R. ( 1 9 7 8 ) . " S y s t e m a t i c a b n o r m a l r e t u r n s a f t e r q u a r t e r l y e a r n i n g s a n n o u n c e m e n t s " , J o u r n a l o f F i n a n c i a l E c o n o m i c s , V o l . 6 , J u n e - S e p t e m b e r , p p . 1 2 7 - 1 5 0 .
W a t t s , R. Si Z immerman, J . L . ( 1 9 8 0 ) . "On t h e i r r e l e v a n c e o f r e p l a c e m e n t c o s t d i s c l o s u r e s f o r s e c u r i t y p r i c e s " , J o u r n a l o f A c c o u n t i n g a n d E c o n o m i c s , F e b r u a r y , p p . 9 5 - 1 0 5 .
W a t t s , R . L . Si Z i mmerman, J . L . ( 1 9 8 6 ) . P o s i t i v e A c c o u n t i n gT h e o r y , E n g l e w o o d C l i f f s , N J : P r e n t i c e - H a l l .
W a y m i r e , G. ( 1 9 8 4 ) . " A d d i t i o n a l e v i d e n c e o n t h e i n f o r m a t i o nc o n t e n t o f m a n a g e m e n t e a r n i n g s f o r e c a s t s " , J o u r n a l o f A c c o u n t i n g R e s e a r c h , A u t u m n , p p . 7 0 3 - 7 1 8 .
W e a v e r , D . Si H a l l , W. G. ( 1 9 6 7 ) . "The e v a l u a t i o n o f o r d i n a r ys h a r e s u s i n g a c o m p u t e r " , J o u r n a l o f t h e I n s t i t u t e o f A c t u a r i e s , S e p t e m b e r , p p . 1 - 2 5 .
W h i t b e c k , V . S . Si K i s o r , M. ( 1 9 6 3 ) . "A n ew t o o l i n i n v e s t m e n td e c i s i o n - m a k i n g " , F i n a n c i a l A n a l y s t s J o u r n a l , M a y / J u n e , p p . 5 5 - 6 2 .
W h i t e , H. ( 1 9 8 0 ) . "A h e t e r o s k e d a s t i c i t y - c o n s i s t e n t c o v a r i a n c em a t r i x e s t i m a t o r a n d a d i r e c t t e s t f o r h e t e r o s k e d a s t i c i t y " , E c o n o m e t r i c a , p p . 8 1 7 - 8 3 8 .
W h i t t i n g t o n , G. ( 1 9 7 4 ) . " A s s e t v a l u a t i o n , i n c o m e m e a s u r e m e n t a n d a c c o u n t i n g i n c o m e " , A c c o u n t i n g a n d B u s i n e s s R e s e a r c h , S p r i n g , p p .9 6 - 1 0 1 .
W h i t t i n g t o n , G. ( 1 9 8 3 ) . I n f l a t i o n A c c o u n t i n g : An I n t r o d u c t i o n t o t h e D e b a t e , C a m b r i d g e : C a m b r i d g e U n i v e r s i t y P r e s s .
480
W r i g h t , F . K. < 1 9 6 4 ) . " T o w a r d s a g e n e r a l t h e o r y o f d e p r e c i a t i o n " , J o u r n a l o f A c c o u n t i n g R e s e a r c h , S p r i n g , p p , 8 0 - 9 0 .
Y o h e , W. & K a r n o s k y , D. ( 1 9 6 9 ) . " I n t e r e s t r a t e s a n d p r i c e l e v e l c h a n g e s , 1 9 5 2 - 1 9 6 9 " , F e d e r a l R e s e r v e B a n k o f S t . L o u i s R e v i e w ,D e c e m b e r , p p . 1 8 - 3 8 .