International Journal of Applied Engineering Research ISSN 0973-4562 Volume 14, Number 21 (2019) pp. 4030-4041
© Research India Publications. http://www.ripublication.com
4030
Utilization of Line Surge Arrestors to Improve Overhead EHV DC Line
Performance under Lightning Conditions
Eddie Singh 1, Innocent E. Davidson 2
1 Eskom Distribution, Newcastle, KZN 2940, South Africa.
2 Department of Electrical Power Engineering, Durban University of Technology, South Africa.
Abstract
In high lightning areas, lightning strokes play an important
role in the performance of overhead HV DC lines. A single
stroke can lead to back flashovers and the resultant surge on
the conductor usually results in the protective devices
operating to extinguish that power surge. This operation of the
protective devices leads to consumer interruptions and loss of
industrial production, which negatively affects the economy.
Devices such as Line Surge Arrestors that can drain that
power surge to ground are available. This paper examines the
relationship between the magnitude of the lightning stroke, the
tower top voltage and hence the back flashover voltage that
would appear on the line, which would lead to power
interruptions. The network and surge arrestor installations
were modelled using MATLAB software. The required
number of surge arrestors per phase is thus determined that is
required to drain the surge current down to earth, thus
preventing power interruptions; and the results obtained from
tests and simulation are presented and discussed.
Keywords: Surge Impedance, Electrodes, Lightning strokes,
Line surge arrestors, Over voltages.
I. INTRODUCTION
Lightning strokes tend to terminate on the tower or earth wire
of Extra High Voltage (EHV) DC overhead lines. Depending
on factors such as the conductor type, tower, soil impedance
and magnitude of the strike, it will result in flashover across
the insulator. The resultant fault surge will propagate along
the line until it is extinguished or until the breaker operates.
This movement of the surge tends to ‘damage’ and reduce the
life span of associated equipment such as breakers,
transformers, and impacts network performance adversely.
Should the breaker operate, the resultant short duration outage
or dips, would negatively affect customers. Customers with
sensitive equipment such as motors would halt and production
would stop – negatively affecting production.
For DC systems, under phase to earth fault conditions, the
current flow to earth produces potential gradients within and
around the grounding system. Arising from these situations,
dangerous voltages may develop between ground structures or
electrical equipment frames. To prevent this situation a safe
grounding design must consider the following:
a) The resistance of the ground of the system to remote
earth.
b) The magnitude and position of the maximum step
voltage that may result at the earth’s surface
c) The surface voltage where individuals are standing
whilst their hands are in contact with some structure
In any transmission system, the current practice is to have
tower footing resistance below a certain value. This would
allow the lightning surges to be dissipated through the
earthling systems. The introduction of Visalia-GAI Fault
Analysis and the Lightning Location System (“FALLS”)
Version 3.2.4, enable us to determine the magnitude and
position of the lightning stroke more accurately [1].
Preliminary analysis indicates that only a portion of the
strokes can be withstood by the current line design.
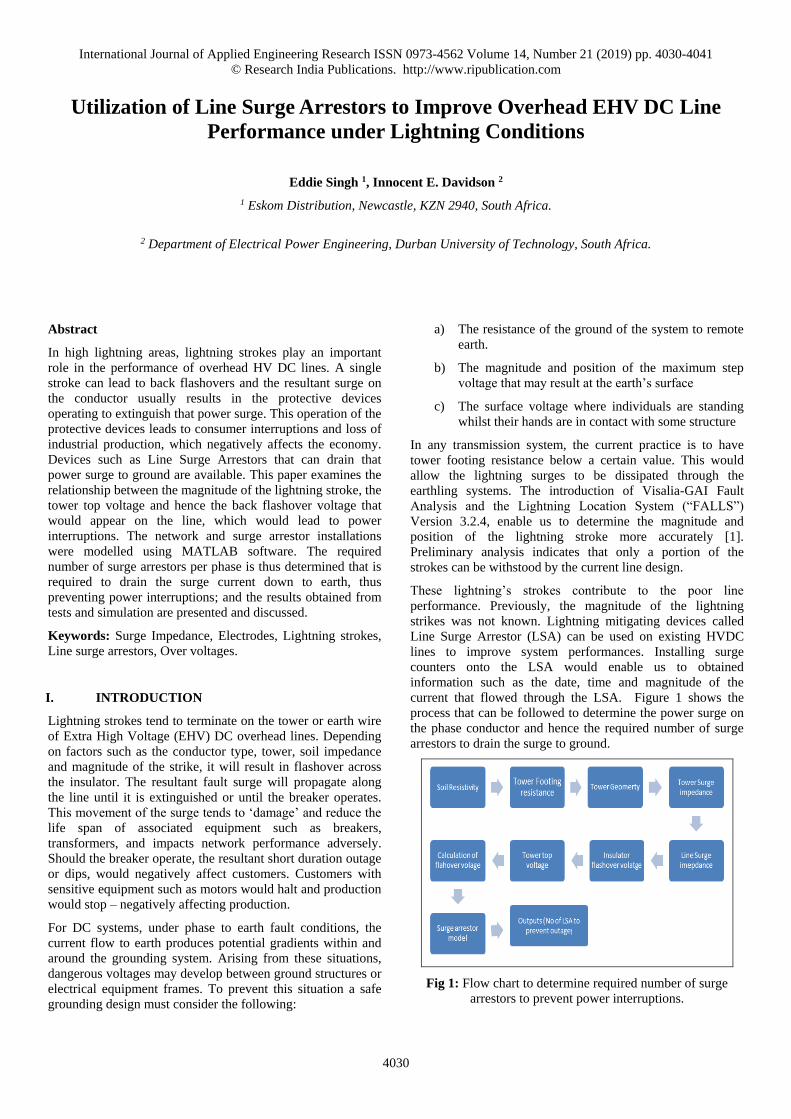
These lightning’s strokes contribute to the poor line
performance. Previously, the magnitude of the lightning
strikes was not known. Lightning mitigating devices called
Line Surge Arrestor (LSA) can be used on existing HVDC
lines to improve system performances. Installing surge
counters onto the LSA would enable us to obtained
information such as the date, time and magnitude of the
current that flowed through the LSA. Figure 1 shows the
process that can be followed to determine the power surge on
the phase conductor and hence the required number of surge
arrestors to drain the surge to ground.
Fig 1: Flow chart to determine required number of surge
arrestors to prevent power interruptions.
International Journal of Applied Engineering Research ISSN 0973-4562 Volume 14, Number 21 (2019) pp. 4030-4041
© Research India Publications. http://www.ripublication.com
4031
1. Earthling Electrode
There are many possible configurations for designing an earth
electrode. These include:
a) Vertical electrode (Driven rod)
b) Shallow horizontal electrode
c) Deep well electrode
d) Ring electrode
Genetic models were developed in MATLAB to calculate the
tower footing resistance bases on the following formulae. This
was developed based on the following formula [2], [3]
The Driven Rod:
(1)
For horizontal Electrode (crow’s foot):
(2)
For Radial Conductors:
(3)
where,
r = number of rods
R = Tower Footing Resistance in ohms
ρ = Soil Resistivity in ohm-meter
L = Length of conductor in meters
r = Radius of conductor meters
D = distance between rods in meters
L = Buried length of the electrode in meters
d = Diameter of the electrode in meters
h = Buried depth of the electrode in meter
n = Number of radials (number).
2. Ground Rod
The ground rod is one of the more popular grounding systems
used. It is installed by the driven and the buried rod method.
The rod is driven into the soil with its upper end at the soil
level. The buried rod results in the upper level been below the
soil level. Research has shown that the ground resistance,
earth’s surface voltage and step voltage of the driven ground
electrode exceed that of the buried rod. Hence, the buried rod
is used to ground the system. A ground rod of radius r (m),
length L (m) can dissipate a current I (A) in a soil with an
apparent resistivity of ρ (Ω-m) and a depth of T (m) as
illustrated in figure 2.
Fig 2: Buried ground rod with insulated lead
It is assumed that the linear leakage current over the surface of
the ground rod is uniform, the end effect of the ground rod is
negligible and the voltage on the ground rod is kept constant.
The method of average potential was used to determine the
value of the voltage on the surface of the ground rod. The
ground resistance of the ground rod can be obtained by the
equation:
(4)
Where
+
ln
+
–
+
–
The earth surface voltage Vz can at any point be written as:
ln (5)
The step voltage, which can be defined as the difference
between the surface voltages, that a human would experience
International Journal of Applied Engineering Research ISSN 0973-4562 Volume 14, Number 21 (2019) pp. 4030-4041
© Research India Publications. http://www.ripublication.com
4032
that, bridges a distance of 1 meter with the feet without
contacting any other grounded object.
= (6)
The maximum permissible step voltage is 8.5 volts. This is
based on a body current of 6mA and a 70 ohm-m uniform soil
resistivity.
(7)
= Permissible voltage
= Body current
= soil resistivity
Hence, the design of the earth electrode must satisfy both the
step voltage and the ground resistance conditions. The ground
resistance is the resistance offered by the metal parts of the
tower combined with the ground resistance to the dissipation
of current. The significance of a low value of ground
resistance results in less voltage stresses across the line
insulation. A lightning strike to the tower results in high
currents flowing into the ground through the tower footing.
This gives rise to soil ionization and thermal effects. Hence,
the ground resistance of the tower base decreases by an
amount depending on the soil resistivity, the current
magnitude and tower footing construction [2], [3], [4], [5].
To maintain the ground potential rise within safety tolerance,
the ground resistance value needs to be as low as possible.
This would also assist in preventing line back flashover The
lower the tower footing resistance, the more negative
reflections are produced from the tower base towards the
tower top. This assists in lowering the peak voltage at the
tower top.
II. ELECTRODE DESIGN
Five key factors that affect the design of an electrode [5],
namely:
a) Safety.
b) Physical design criteria and constraints.
c) Potential environmental impact.
d) Potential influence of electrode operation on other
facilities.
e) Practicality of building an electrode at the site.
In this paper, the following two factors are of importance and
discussed.
1. Safety
The design of the electrode should not result in animals or
humans been harmed by the operations of the electrode. The
operational conditions man falls into two main areas. These
are:
a) Continuous conditions that persist for 10 seconds
or longer
b) Transient conditions which would persist for less
than 10 seconds
In the case of the DC transient line fault, the transient
overcurrent should persist for only about 50 ms, until the
current line protection and current controller will reduce the
fault current to zero. The criteria for these two timeframes are
different since the tolerance of the human body to current is
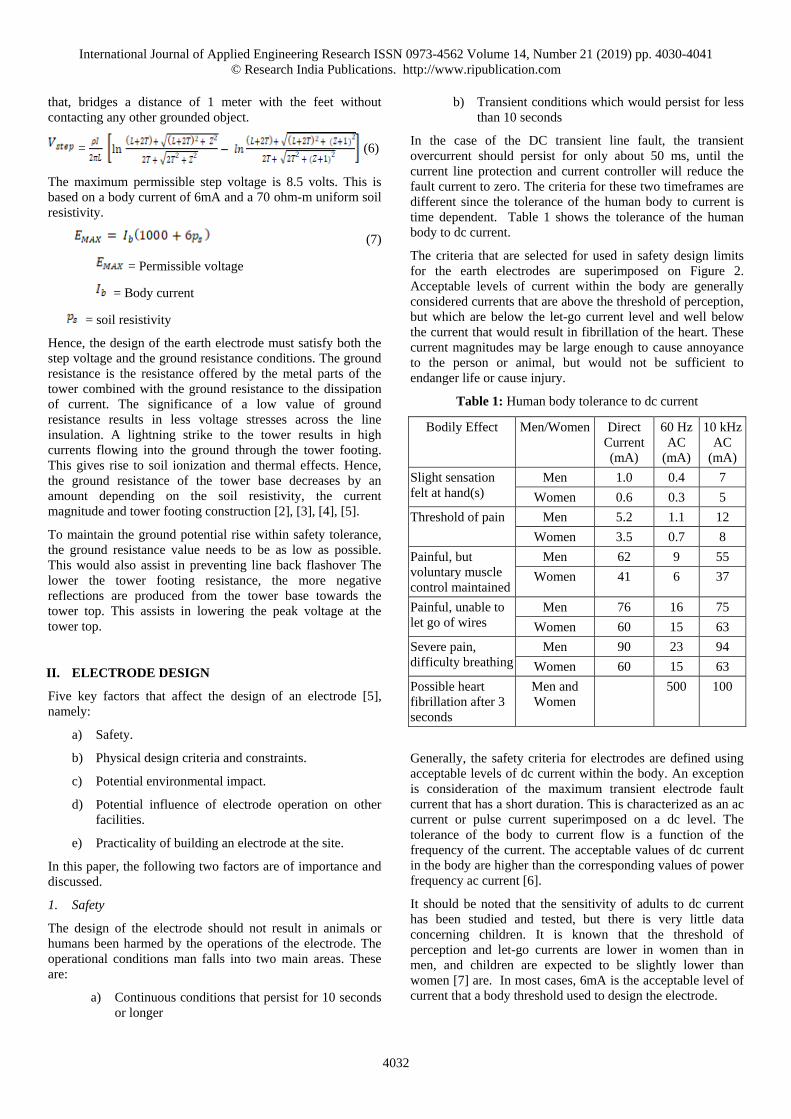
time dependent. Table 1 shows the tolerance of the human
body to dc current.
The criteria that are selected for used in safety design limits
for the earth electrodes are superimposed on Figure 2.
Acceptable levels of current within the body are generally
considered currents that are above the threshold of perception,
but which are below the let-go current level and well below
the current that would result in fibrillation of the heart. These
current magnitudes may be large enough to cause annoyance
to the person or animal, but would not be sufficient to
endanger life or cause injury.
Table 1: Human body tolerance to dc current
Bodily Effect Men/Women Direct
Current
(mA)
60 Hz
AC
(mA)
10 kHz
AC
(mA)
Slight sensation
felt at hand(s)
Men 1.0 0.4 7
Women 0.6 0.3 5
Threshold of pain Men 5.2 1.1 12
Women 3.5 0.7 8
Painful, but
voluntary muscle
control maintained
Men 62 9 55
Women 41 6 37
Painful, unable to
let go of wires
Men 76 16 75
Women 60 15 63
Severe pain,
difficulty breathing
Men 90 23 94
Women 60 15 63
Possible heart
fibrillation after 3
seconds
Men and
Women
500 100
Generally, the safety criteria for electrodes are defined using
acceptable levels of dc current within the body. An exception
is consideration of the maximum transient electrode fault
current that has a short duration. This is characterized as an ac
current or pulse current superimposed on a dc level. The
tolerance of the body to current flow is a function of the
frequency of the current. The acceptable values of dc current
in the body are higher than the corresponding values of power
frequency ac current [6].
It should be noted that the sensitivity of adults to dc current
has been studied and tested, but there is very little data
concerning children. It is known that the threshold of
perception and let-go currents are lower in women than in
men, and children are expected to be slightly lower than
women [7] are. In most cases, 6mA is the acceptable level of
current that a body threshold used to design the electrode.
International Journal of Applied Engineering Research ISSN 0973-4562 Volume 14, Number 21 (2019) pp. 4030-4041
© Research India Publications. http://www.ripublication.com
4033
2. Safety Metrics and Criteria
Safety of humans and animals at an electrode site is of
concern primarily within the area where the surface potential
rise and the associated surface potential gradients resulting
from electrode operation are high. This is applicable to areas
where there are bodies of water and the currents that can enter
the human and animals that enter or are present in the water.
Safety can be defined in terms of the following quantities
(using the definitions from IEEE Std. 80, modifying them to
reflect the special character, and operating characteristics of
HVDC ground electrodes)
a) Step Voltage
b) Touch Voltage
c) Metal-to-Metal Touch Voltage
d) Transferred Voltage or Transferred Potential
e) Potential gradient in water
These need to be evaluated when considering the safety of the
earth electrode installation. Note: The acceptable values are
not based on voltage but rather on acceptable levels of
currents within the human and animal bodies as discussed in
(a).
However, for convenience in electrode design, it is usually
desirable to be able to work with voltage limits or limits on
potential gradients, which can be more easily calculated and
verified by measurements. Safe or acceptable values of
voltages and potential gradients are determined by working
backwards from the acceptable levels of current in the body
using assumed conservative values of contact resistance and
body resistance.
The two criteria, which may extend for significant distances
into publicly accessible areas, are:
Transferred potential,
Voltage gradient in water
Step voltages approaching the limits would normally be
confined to within the areas of the earth electrode sites. It is
advising that these areas be located behind locked fences, as
the public cannot be protected from the effects. An earth
electrode is a metal plate, pipe or conductor electrically
connected to earth. They can be made up of either copper,
aluminum, mild steel or galvanized steel. Some of the factors
that influence the earthling are [6], [7]:
a) Resistance of the electrode or group of electrodes.
b) Composition of the soil in the immediate
neighborhood.
c) Temperature of the soil.
d) Moisture content of the soil.
e) Depth of the electrode.
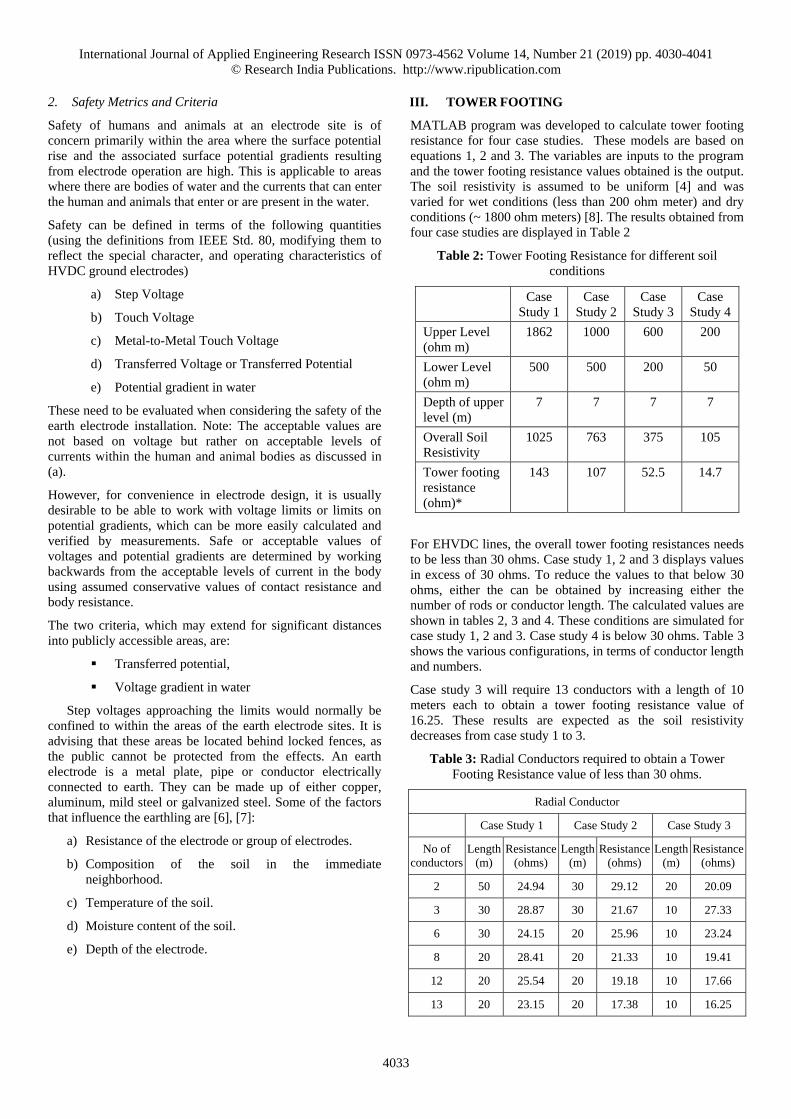
III. TOWER FOOTING
MATLAB program was developed to calculate tower footing
resistance for four case studies. These models are based on
equations 1, 2 and 3. The variables are inputs to the program
and the tower footing resistance values obtained is the output.
The soil resistivity is assumed to be uniform [4] and was
varied for wet conditions (less than 200 ohm meter) and dry
conditions (~ 1800 ohm meters) [8]. The results obtained from
four case studies are displayed in Table 2
Table 2: Tower Footing Resistance for different soil
conditions
Case
Study 1
Case
Study 2
Case
Study 3
Case
Study 4
Upper Level
(ohm m)
1862 1000 600 200
Lower Level
(ohm m)
500 500 200 50
Depth of upper
level (m)
7 7 7 7
Overall Soil
Resistivity
1025 763 375 105
Tower footing
resistance
(ohm)*
143 107 52.5 14.7
For EHVDC lines, the overall tower footing resistances needs
to be less than 30 ohms. Case study 1, 2 and 3 displays values
in excess of 30 ohms. To reduce the values to that below 30
ohms, either the can be obtained by increasing either the
number of rods or conductor length. The calculated values are
shown in tables 2, 3 and 4. These conditions are simulated for
case study 1, 2 and 3. Case study 4 is below 30 ohms. Table 3
shows the various configurations, in terms of conductor length
and numbers.
Case study 3 will require 13 conductors with a length of 10
meters each to obtain a tower footing resistance value of
16.25. These results are expected as the soil resistivity
decreases from case study 1 to 3.
Table 3: Radial Conductors required to obtain a Tower
Footing Resistance value of less than 30 ohms.
Radial Conductor
Case Study 1 Case Study 2 Case Study 3
No of
conductors
Length
(m)
Resistance
(ohms)
Length
(m)
Resistance
(ohms)
Length
(m)
Resistance
(ohms)
2 50 24.94 30 29.12 20 20.09
3 30 28.87 30 21.67 10 27.33
6 30 24.15 20 25.96 10 23.24
8 20 28.41 20 21.33 10 19.41
12 20 25.54 20 19.18 10 17.66
13 20 23.15 20 17.38 10 16.25
International Journal of Applied Engineering Research ISSN 0973-4562 Volume 14, Number 21 (2019) pp. 4030-4041
© Research India Publications. http://www.ripublication.com
4034
From case study 3, to obtaining a tower footing resistance of
23.2, it would require 6 conductors of 10 meters each. This
material length is 60 meters is much less than that of case
study 1. This can be attributed to the better soil conditions. It
must be note that any of these combinations would suffice to
give a tower footing resistances less than 30 ohms.
Arising from case study 1, the best combination is 13
conductors with a length of 20 meters each will provide a TFR
of 23.2 ohms. The total conductor length would be 260
meters. For case study 2, the same combination will result in
the lowest tower footing resistance, which is 25% less than the
value obtained in case study 1.
Table 4. Explores the Driven Rod option. The model varies
the number of rods and hence the length of the conductor
required in obtaining a TFR value of less than 30 ohms for
each case study. The number of rods is user specified.
Driven Rod
Case Study 1 Case Study 2 Case Study 3
No of Rods 1 2 3 4 1 2 3 4 1 2 3 4
Length (m) 22 17 16 15 17 13 12 11 8 7 6 6
Resistance 30 30 28 29 29 29 28 29 30 26 28 26
The length of the rods required to reduce the tower footing
resistance to less than 30 ohms decreases as the soil resistivity
values decreases. Table 5 illustrates the length of conductor
needed to reduce the tower footing resistance to a value less
than 30ohms
Table 5: Crows Foot
Crows Foot
Rg (Ohms) Length (m)
Case 1 27.3 90
Case 2 29.1 60
Case 3 25.6 30
The sub routine created in MATLAB would then compare
the results from all three methods and would display the
technical solution that would provide the lowest tower footing
resistance as shown in table 6.
Table 6: Method with lowest tower resistance values
Method Tower footing
resistance value
Case 1 Radial 23.4
Case 2 Radial 17.3
Case 3 Radial 16.25
Case 4 All values less
than 30 ohms
IV. SURGE IMPEDANCE OF THE LINE AND TOWER
MODEL
[9] give the surge impedance of the line:
(8)
where h is the ground-wire height,
= radius of conductor
By ignoring the tower resistance and permitting low precision,
the tower can be equivalent to one inductance called lumped
inductance model [9]. The formula of lumped inductance
model is:
= 60 (9)
Where
= (10)
= average tower surge impedance
= tower top radius
= tower mid-section radius
= tower base radius
= height from base of tower to mid-span
= height of mid span to top
The surge impedance model can be considered as a transient
wave process across the tower. In the surge impedance
models, the tower over voltage is the results of superposition
of the lightning over voltages and the reflected voltage wave
from the tower bottom. The calculation principle of the
single-surge impedance of tower is most regarded the tower as
cone. [9].
1. Peak Lighting Current
At the strike point on an overhead line earth wire, the injected
current is divided equally between the earth wire ends
connected to the towers. Therefore the impedance Z. as seen
from the lightning strike is a parallel circuit of earth wires Zew
and tower impedances Ze.
Fig 3: Three-way current split based on impedance
International Journal of Applied Engineering Research ISSN 0973-4562 Volume 14, Number 21 (2019) pp. 4030-4041
© Research India Publications. http://www.ripublication.com
4035
Assuming that the lightning channel impedance is 3000Ω, the
earth wire impedance 500Ω, tower impedances 200Ω and
ground impedance 50Ω, the equivalent impedance seen by the
lightning strike calculates to 334Ω resulting in the injection of
approximately 90% of the strike current at the strike point
In round terms, therefore, a 30 kA strike to the earth wire will
result in a 14 kA surge going in each direction towards the
towers. The surge will travel to a point of impedance change
(the pole top) at which there will be a reflected and
transmitted component. The pole top junction has several
routes available for the current and voltage waves and the
surge current will split according to the inverse ratio of the
surge impedances of the routes available – say ~200Ω down
the tower route and ~500Ω for the continuing earth wire. The
14 kA surge will therefore split approximately 5/7 down the
tower i.e. 10 kA
2. Back Flashover
Lightning strokes are of very high potential with the capacity
to discharge hundreds of Kilo-Ampere with low-rise time.
Back flash over will occur, should the difference between the
tower top voltage and phase voltage exceeds that of the break
down voltage of the phase insulator.
Since most of the tower stroke current flows into the ground
during a lightning incident, the tower footing resistance has a
major impact on the over voltages generated. The back
flashover will cause a line to ground fault that should be
cleared by a circuit breaker within a few milliseconds. This
may result in a line outage or dips, until the circuit breaker is
reclosed. The back-flashover generated surge has a very sharp
wave front as the arc causes the phase wire to jump in less
than 1µs from an induced voltage level (from the surge along
the earth wire) to virtually the full lightning surge voltage as
present on the tower cross-arm (the arc itself will drop a few
hundred volts only).
3. Insulator Flashover Voltage
Normally the insulator withstand voltage is prescribed as part
of the specifications. However, the voltage time
characteristics as been proposed by CIGRE [10].
(11)
where
= 400L, and = 710L
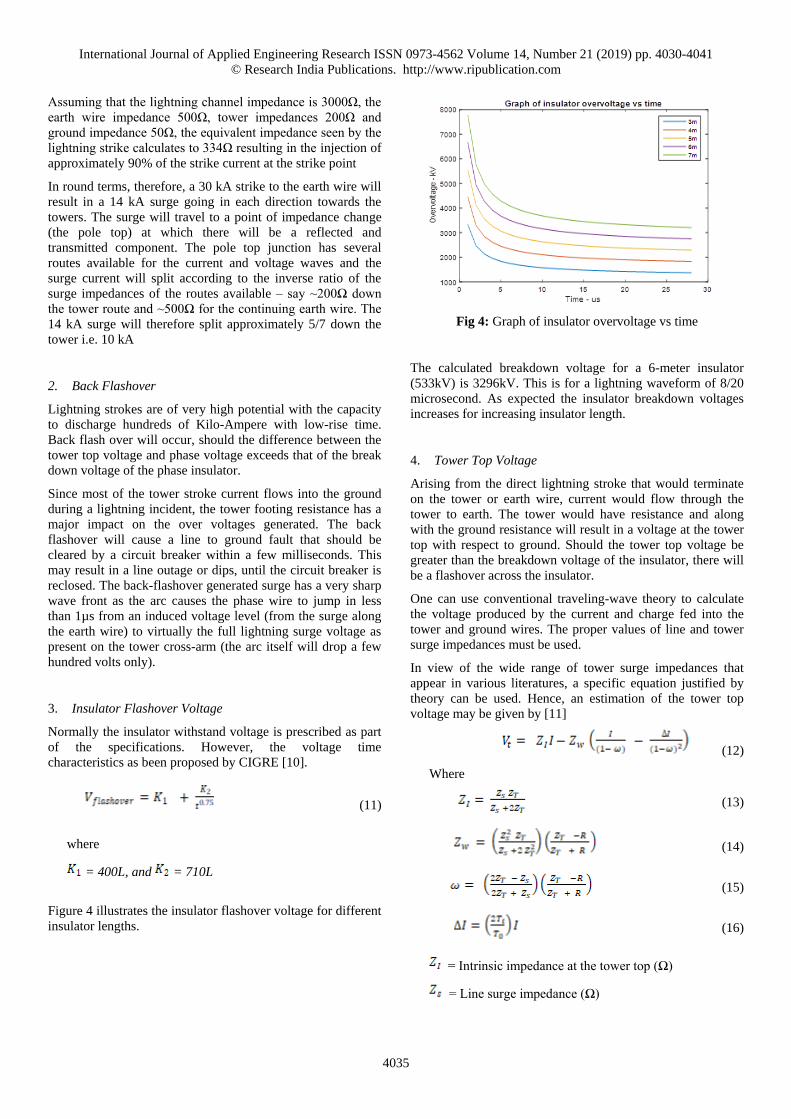
Figure 4 illustrates the insulator flashover voltage for different
insulator lengths.
Fig 4: Graph of insulator overvoltage vs time
The calculated breakdown voltage for a 6-meter insulator
(533kV) is 3296kV. This is for a lightning waveform of 8/20
microsecond. As expected the insulator breakdown voltages
increases for increasing insulator length.
4. Tower Top Voltage
Arising from the direct lightning stroke that would terminate
on the tower or earth wire, current would flow through the
tower to earth. The tower would have resistance and along
with the ground resistance will result in a voltage at the tower
top with respect to ground. Should the tower top voltage be
greater than the breakdown voltage of the insulator, there will
be a flashover across the insulator.
One can use conventional traveling-wave theory to calculate
the voltage produced by the current and charge fed into the
tower and ground wires. The proper values of line and tower
surge impedances must be used.
In view of the wide range of tower surge impedances that
appear in various literatures, a specific equation justified by
theory can be used. Hence, an estimation of the tower top
voltage may be given by [11]
(12)
Where
(13)
(14)
(15)
(16)
= Intrinsic impedance at the tower top (Ω)
= Line surge impedance (Ω)
International Journal of Applied Engineering Research ISSN 0973-4562 Volume 14, Number 21 (2019) pp. 4030-4041
© Research India Publications. http://www.ripublication.com
4036
= Tower surge impedance (Ω)
= Wave impedance of the tower (Ω)
R = Tower footing resistance (Ω)
= Damping constant for all the travelling
Waves
= Wave travel time on the tower (ms)
Figure 5 shows the Tower Top voltage vs lightning stroke.
This is for a 100kA stroke on the tower and a tower footing
resistance of 17.33ohms.
Fig 5: Tower Top voltage vs lightning stroke
Figure 6 was generated using various lightning stroke
magnitudes
Fig 6: Tower top voltage vs lightning current through the
tower
With the stroke current been the only variable, a ‘linear’
relationship with the tower top voltage is obtained. It must be
noted that this over voltage is generated using the current
flowing through the tower. This is due to the current splitting
effect. From the above figure, a lightning stroke of 50kA
would give rise to a short duration over-voltage of 4475kV.
Figure 7 shows the over voltage curves for different tower
footing resistance. This is for different lightning strokes
Fig 7: Tower Top Voltage vs Tower Footing Resistance
With a constant lightning stroke magnitude, the tower voltage
top would increase with an increasing tower footing
resistance. No earthling enhancement is considered for the
earthling values used in figure 7. Utilizing earthling
enhancement techniques, such as increased conductor lengths,
the tower footing resistance is reduced to a value less than
30ohms as shown in figure 8.
Fig 8: Tower Top Voltage Vs Modified Tower Footing
Resistance
From figures 7 and 8, there is a substantial reduction in the
tower top voltage, almost halved. This highlights the need to
have acceptable tower footing resistance. It may be costly to
reduce the footing resistance to single digit figures.
V. SURGE ARRESTOR MODELS
Metal-oxide surge arresters have dynamic characteristics that
are significant for overvoltage coordination studies involving
fast front surges. Several models with acceptable accuracy
have been proposed to simulate this frequency-dependent
behaviour. Difficulties arise in the calculation and adjustment
of the model parameters: in some cases, iterative procedures
International Journal of Applied Engineering Research ISSN 0973-4562 Volume 14, Number 21 (2019) pp. 4030-4041
© Research India Publications. http://www.ripublication.com
4037
are required, in others the necessary data are not reported on
manufacturers’ datasheets.
A simplified model for zinc oxide surge arresters has already
been developed, based on the frequency dependent model
recommended by the IEEE WG.3.4.11. The non-linear
characteristic of the line arrester is modelled as recommended
by the IEEE W.G 3.4.11, which is metal oxide surge arrester
[13]. IEEE line arrester model has been chosen because the
Toshiba surge arrester uses nonlinear resistor metal oxide
elements as the main component.
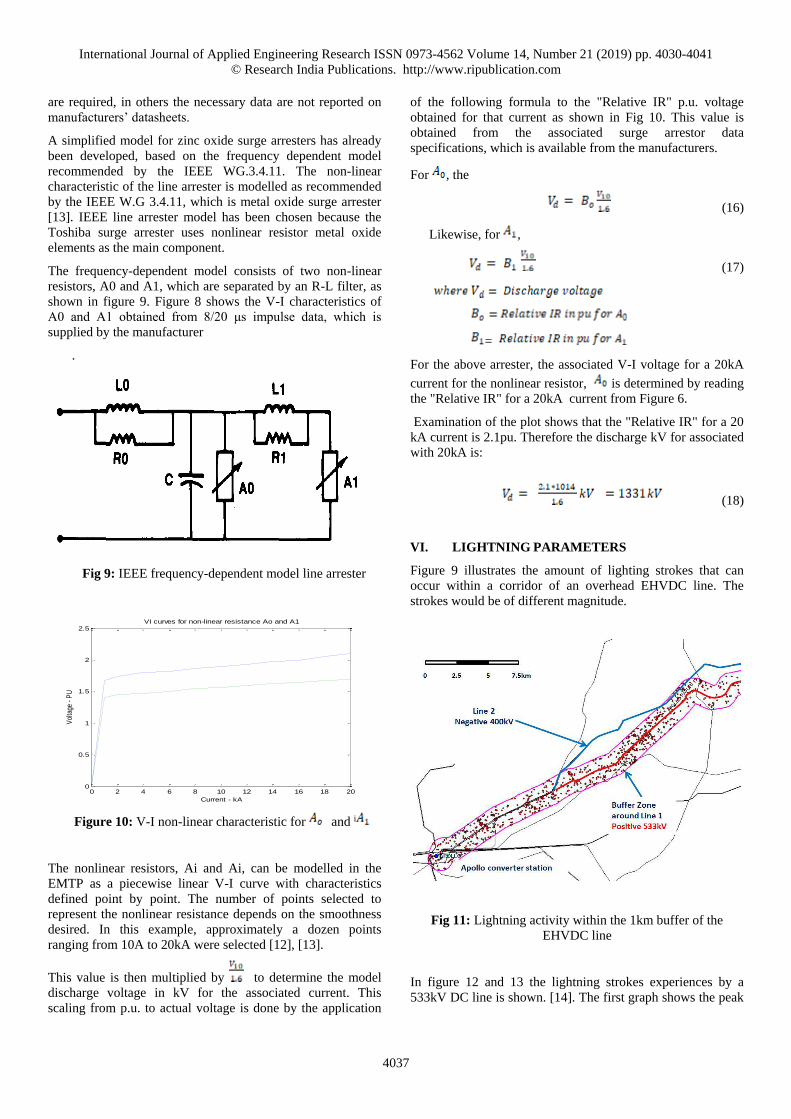
The frequency-dependent model consists of two non-linear
resistors, A0 and A1, which are separated by an R-L filter, as
shown in figure 9. Figure 8 shows the V-I characteristics of
A0 and A1 obtained from 8/20 μs impulse data, which is
supplied by the manufacturer
.
Fig 9: IEEE frequency-dependent model line arrester
0 2 4 6 8 10 12 14 16 18 200
0.5
1
1.5
2
2.5
Current - kA
Vol
tage
- P
U
VI curves for non-linear resistance Ao and A1
Figure 10: V-I non-linear characteristic for and i
The nonlinear resistors, Ai and Ai, can be modelled in the
EMTP as a piecewise linear V-I curve with characteristics
defined point by point. The number of points selected to
represent the nonlinear resistance depends on the smoothness
desired. In this example, approximately a dozen points
ranging from 10A to 20kA were selected [12], [13].
This value is then multiplied by to determine the model
discharge voltage in kV for the associated current. This
scaling from p.u. to actual voltage is done by the application
of the following formula to the "Relative IR" p.u. voltage
obtained for that current as shown in Fig 10. This value is
obtained from the associated surge arrestor data
specifications, which is available from the manufacturers.
For , the
(16)
Likewise, for ,
(17)
=
For the above arrester, the associated V-I voltage for a 20kA
current for the nonlinear resistor, is determined by reading
the "Relative IR" for a 20kA current from Figure 6.
Examination of the plot shows that the "Relative IR" for a 20
kA current is 2.1pu. Therefore the discharge kV for associated
with 20kA is:
(18)
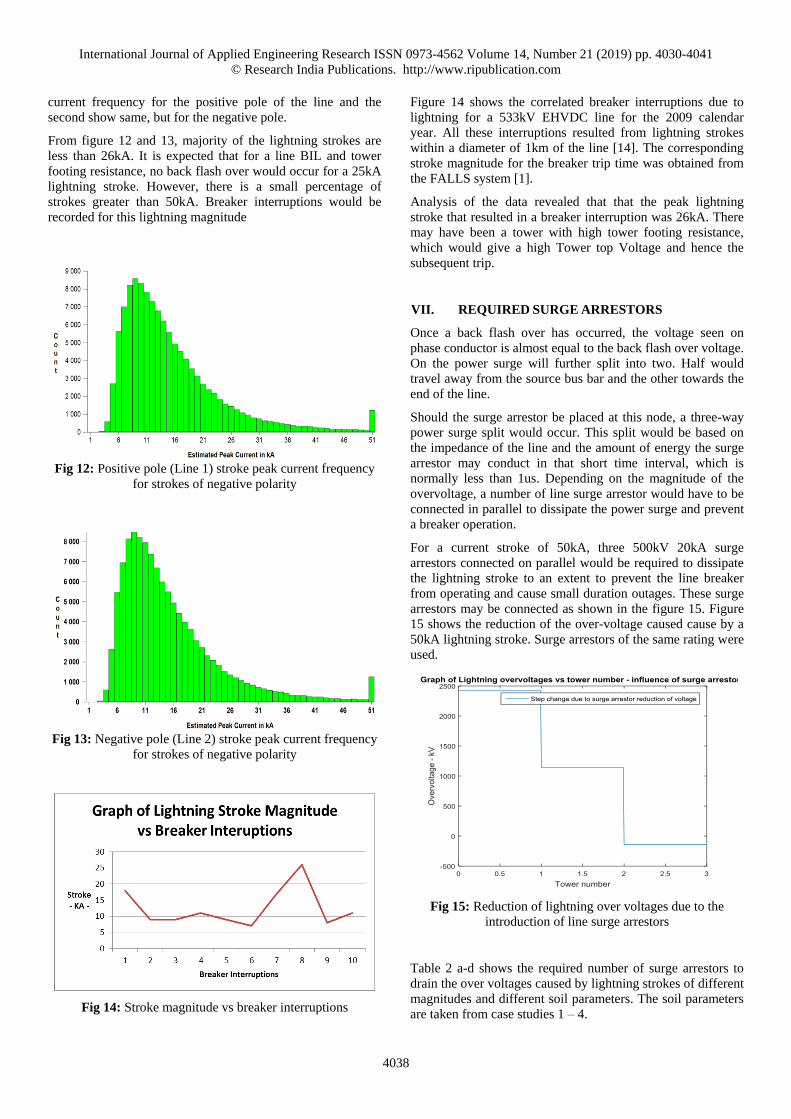
VI. LIGHTNING PARAMETERS
Figure 9 illustrates the amount of lighting strokes that can
occur within a corridor of an overhead EHVDC line. The
strokes would be of different magnitude.
Fig 11: Lightning activity within the 1km buffer of the
EHVDC line
In figure 12 and 13 the lightning strokes experiences by a
533kV DC line is shown. [14]. The first graph shows the peak
International Journal of Applied Engineering Research ISSN 0973-4562 Volume 14, Number 21 (2019) pp. 4030-4041
© Research India Publications. http://www.ripublication.com
4038
current frequency for the positive pole of the line and the
second show same, but for the negative pole.
From figure 12 and 13, majority of the lightning strokes are
less than 26kA. It is expected that for a line BIL and tower
footing resistance, no back flash over would occur for a 25kA
lightning stroke. However, there is a small percentage of
strokes greater than 50kA. Breaker interruptions would be
recorded for this lightning magnitude
Fig 12: Positive pole (Line 1) stroke peak current frequency
for strokes of negative polarity
Fig 13: Negative pole (Line 2) stroke peak current frequency
for strokes of negative polarity
Fig 14: Stroke magnitude vs breaker interruptions
Figure 14 shows the correlated breaker interruptions due to
lightning for a 533kV EHVDC line for the 2009 calendar
year. All these interruptions resulted from lightning strokes
within a diameter of 1km of the line [14]. The corresponding
stroke magnitude for the breaker trip time was obtained from
the FALLS system [1].
Analysis of the data revealed that that the peak lightning
stroke that resulted in a breaker interruption was 26kA. There
may have been a tower with high tower footing resistance,
which would give a high Tower top Voltage and hence the
subsequent trip.
VII. REQUIRED SURGE ARRESTORS
Once a back flash over has occurred, the voltage seen on
phase conductor is almost equal to the back flash over voltage.
On the power surge will further split into two. Half would
travel away from the source bus bar and the other towards the
end of the line.
Should the surge arrestor be placed at this node, a three-way
power surge split would occur. This split would be based on
the impedance of the line and the amount of energy the surge
arrestor may conduct in that short time interval, which is
normally less than 1us. Depending on the magnitude of the
overvoltage, a number of line surge arrestor would have to be
connected in parallel to dissipate the power surge and prevent
a breaker operation.
For a current stroke of 50kA, three 500kV 20kA surge
arrestors connected on parallel would be required to dissipate
the lightning stroke to an extent to prevent the line breaker
from operating and cause small duration outages. These surge
arrestors may be connected as shown in the figure 15. Figure
15 shows the reduction of the over-voltage caused cause by a
50kA lightning stroke. Surge arrestors of the same rating were
used.
Fig 15: Reduction of lightning over voltages due to the
introduction of line surge arrestors
Table 2 a-d shows the required number of surge arrestors to
drain the over voltages caused by lightning strokes of different
magnitudes and different soil parameters. The soil parameters
are taken from case studies 1 – 4.
International Journal of Applied Engineering Research ISSN 0973-4562 Volume 14, Number 21 (2019) pp. 4030-4041
© Research India Publications. http://www.ripublication.com
4039
Table 2a: Tower Footing resistance of 23.1 and different
lightning strokes (Case Studies 1)
Lig
htn
ing
curr
ent
– k
A
Insu
lato
r
Vo
ltag
e k
V
Tow
er F
oo
tin
g
Res
ista
nce
Tow
er t
op
Vo
ltag
e k
V
Bac
k F
lash
ov
er
Ph
ase
Vo
ltag
e
Req
uir
ed S
A
12 3296 4.56 804 No 402 0
25 3296 4.56 1609 No 805 0
37.5 3296 4.56 1415 No 1107 0
50 3296 4.56 3119 No 1609 0
98 3296 4.56 6194 Yes 3147 3
Table 2b: Tower Footing resistance of 16.25 and different
lightning strokes
Lig
htn
ing
curr
ent
– k
A
Insu
lato
r
Vo
ltag
e k
V
Tow
er F
oo
tin
g
Res
ista
nce
Tow
er t
op
Vo
ltag
e k
V
Bac
k F
lash
ov
er
Ph
ase
Vo
ltag
e
Req
uir
ed S
A -
Pre
ven
t o
uta
ge
12 3296 16.25 1118 No 559 0
25 3296 16.25 1134 No 1119 0
37.5 3296 16.25 3356 Yes 1678 2
50 3296 16.25 4475 Yes 1137 2
98 3296 16.25 8950 Yes 4475 4
Table 2c: Tower Footing resistance of 17.3 and different
lightning strokes
Lig
htn
ing
curr
ent
- kA
Insu
lato
r
Vo
ltag
e kV
Tow
er F
ooti
ng
Res
ista
nce
Tow
er t
op
Vo
ltag
e kV
Bac
k F
lash
ov
er
Ph
ase
Volt
age
Req
uir
ed S
A -
Pre
ven
t outa
ge
12 3296 17.33 1143 No 573 0
25 3296 17.33 2349 No 1174 0
37.5 3296 17.33 3440 Yes 1720 2
50 3296 17.33 4588 Yes 2294 2
98 3296 17.33 9175 Yes 4587 4
Table 2d: Tower Footing resistance of 23.15 and different
lightning strokes.
Lig
htn
ing
curr
ent
– k
A
Insu
lato
r
Vo
ltag
e kV
Tow
er F
oo
tin
g
Res
ista
nce
Tow
er t
op
Vo
ltag
e k
V
Bac
k F
lash
ov
er
Ph
ase
Vo
ltag
e
Req
uir
ed S
A -
Pre
ven
t o
uta
ge
12 3296 23.15 1186 No 643 0
25 3296 23.15 2573 No 1286 0
37.5 3296 23.15 3859 Yes 1929 2
50 3296 23.15 5145 Yes 2573 2
98 3296 23.15 10290 Yes 5145 4
VIII. FINANCIAL EVALUATION
a) Annual expected number of voltage dips and momentary
outages due to lightning. Performance monitoring of a
533kV overhead line revealed that in the year 2009 there
was 124 momentary trips. Of these 10 was due to
lightning. [14]
b) Estimate the cost associated with voltage dips and
momentary outages. A study undertaken by Nzimande
[15] revealed that lightning (storm) related dips lead to
losses of between US$5357 and US$35714 per annum for
10 storm related dips, an average of between US$357 and
US$3571 per dip.
The following table illustrates the high level costing required
to install 4x550kV surge arrestors, i.e. 2 surge arrestor per
phase.
Table 3 Illustrates the Cost Required to Mitigate
against a 50ka Lightning Stroke
Item Year 2019
Cost of a surge arrestor and counter USD 38 835
Cost of 4 surge arrestor and counters USD 158 700
Labour and transport USD 4 601
Total USD 163 302
The following figure 13 shows that it would take 14 years to
recover the capital invested in the surge arrestors to mitigate
against dips, providing the inflation is 5%. Should the
inflation be 10%, the capital will be recovered after 23 years.
International Journal of Applied Engineering Research ISSN 0973-4562 Volume 14, Number 21 (2019) pp. 4030-4041
© Research India Publications. http://www.ripublication.com
4040
Fig 14: Break-even point occurs in year 14 (5% inflation rate)
IX. CONCLUSION
Using earthling enhancement techniques such as additional
conductors, not only reduces the tower footing resistance, but
also reduces the tower top voltage by almost 50%. Hence, it is
important to have the tower footing resistance below 30 ohms.
The tower top voltage is a function of the lighting stroke, line
and tower surge impedance and earthling resistance. Should
the insulator breakdown voltage be exceeded, this will give
rise to a flashover. The same tower top voltage level will be
present on the live side of the surge arrestor. Lightning surges
travel at the speed of light. This waveform does not stay at
the node of the surge arrestor for duration long enough for the
surge arrestor to dissipate the voltage to ground. Hence,
additional surges arrestors are required. The placement of the
surge arrestor should be in parallel to each other and placed
after the operating device, which would be used to clear the
fault. This should prevent the device from operating and any
short during outages. Mitigation against a lightning stoke of
50kA will require two surge arrestors per phase. For this
amount of surge arrestors, the break-even point will be 14
years.
REFERENCES
[1]. Global Atmospherics Inc., "Vaisala-GAI fault
Analysis and Lightning Location Systems (FALLS)
Version 3.2.4," Tucson, Arizona, USA, 2002.
[2]. T. Hayashi, Y. Mizuno and K. Naito, "Study on
Transmission – Line Arresters for Tower with High
Footing Resistance," IEEE Transaction on Power
Delivery, vol. 23, no. 4, pp. 2456-2460, October
2008.
[3]. C. Li-Hsiung, C. Jiann-Fuh, L.Tsorng-Juu and W.
Wen-I, "Calculation of ground resistance and step
voltage for buried ground rod with insulation lead,"
Electric Power Systems Research. Vol. 78, p. 995–
1007, 2008.
[4]. "High Voltage Surge Arrestors," www.abb.com.
[5]. E. Singh, I.E. Davidson and G.K. Venayagamoorthy,
“Methodology for Measuring and Enhancing Tower
Footing Resistance for Lightning Protection in an
88KV Line”. In Proceedings of the 25th South
African Universities Power Engineering Conference,
30 Jan – 1st Feb 2017, Stellenbosch, South Africa,
pp. 655-659.
[6]. O.E. Gouda, G.M.Amer and T.M El-Saied, "Factors
Affecting the Apparent Soil Resistivity of Multi-
Layer Soil." In Proceedings of the XIVth
International Symposium on High Voltage
Engineering, Tsinghua University, Beijing, China,
Aug, 2005, pp. 25-29.
[7]. I E Davidson. “A Mathematical Algorithm for
Investigating Soil Resistivity”. Proceedings of the 6th
Southern African Universities Power Engineering
Conference (SAUPEC), University of the
Witwatersrand, South Africa, January 1996, Vol. 6,
pp. 279-282, 1996.
[8]. G.A, Adegboyega and K.O. Odeyemi, "Assessment
of Soil Resistivity on Grounding of Electrical
Systems: A case study of North-East Zone, Nigeria,"
Journal of Academic and Applied Studies, vol. 1(3),
pp. 28-38, September 2011.
[9]. S Malanda, I E Davidson, E Buraimoh and E Singh,
“Analysis of Soil Resistivity and its Impact on
Grounding Systems Design”. Proceedings of the
IEEE Power Africa Conference, 26 – 29 June, 2018,
Cape Town, South Africa, pp. 522-527
[10]. M Z.A A Kadir, Z M Nawi and J Sardi, "Numerical
Modeling and Simulation in Electro Magnetic
Transient Program for Estimating Line Back
Flashover Performance," November 2010. ."
Engineering Letters, vol.18, no. 4, p351, 2010.
[11]. C.F. Wagner and H.R. Hileman, "Lightning
Performance of Transmission lines 3," AIEE Power
Apparatus and Systems, p. 903, November 1960.
[12]. G. Radhika, M. Suryakalavathi and G. Soujanya,
"Effective Placement of Surge Arrestor during
Lightning," International Journal of Computer
Communication and Information System, vol. 2, no.
1, pp. 167-172, 2010.
[13]. M. Dekker, "Lightning Surge Analysis
http://197.14.51.10:81/pmb/
informatique/computer%20aid%20analys/082470699
4/PDFs/DK1913_CH13.pdf.," 2012. [Online].
[14]. N.H.N. Hassan, A.H.A. Bakar, H. Mokhlis and H. A.
Illis, "Analysis of Arrestor Energy for 132kV
Overhead Transmission Line due to Back Flashover
and Shielding failure”. In Proceedings of the 16th
IEEE International Conference on Power and
Energy, (PECon), pp. 683-688, December 2012.
[15]. E. Singh, "Fault Mitigation and Performance
Improvement of an 88kV line using Line Surge
Arrestors and Counters," Poster, University of
KwaZulu-Natal, Durban, 2016.
International Journal of Applied Engineering Research ISSN 0973-4562 Volume 14, Number 21 (2019) pp. 4030-4041
© Research India Publications. http://www.ripublication.com
4041
[16]. Nzimande, T.M., "Voltage Dip Performance
Analysis," Master of Science Thesis, University of
KwaZulu-Natal, pp. 90-96, 2009.
[17]. Johnson and Arnold Ivan., "Methods of measuring
soil moisture in the field," US Government Printing
Office, 1962.
[18]. Black C.A., "Methods of Soil Analysis: Part I
Physical and mineralogical," American Society of
Agronomy, Madison, Wisconsin, USA, 1965.
[19]. IEEE Working group 3.4.11, "Modeling of metal
oxide surge arrestors," IEEE transaction on Power
Delivery, vol. 7, no. 1, pp. 302-309, January 1999.
[20]. “Earthing Fundamentals” Lightning and Surge
Technologies:, "www.lightningman.com.au,"
[Online].
Mail your Manuscript to [email protected]
i


![Investigation of Thermal, Mechanical, Morphological and ...ripublication.com/ijaer19/ijaerv14n1_25.pdfpolymer as the matrix is presently the focal point [2]. Natural fiber polymer](https://static.documents.pub/doc/80x56/6136402b0ad5d2067647e6b3/investigation-of-thermal-mechanical-morphological-and-polymer-as-the-matrix.jpg)


![Research Article External Thermal Insulation Composite ...downloads.hindawi.com/journals/amse/2014/650752.pdfinsulation [ ]. xed onto the wall, and reinforced rendering, consisting](https://static.documents.pub/doc/80x56/5f81a1a4499de83deb77bdbb/research-article-external-thermal-insulation-composite-insulation-xed-onto.jpg)

