ARL-TR-8883 ● JAN 2020 Utilization of Three-Point Bending for Numerical Prediction of Structural Response in Additively Manufactured Parts by FR Phillips, TC Henry, J Hrynuk, RA Haynes, E Bain, and J Westrich Approved for public release; distribution is unlimited.
Transcript
ARL-TR-8883 ● JAN 2020
Utilization of Three-Point Bending for Numerical Prediction of Structural Response in Additively Manufactured Parts by FR Phillips, TC Henry, J Hrynuk, RA Haynes, E Bain, and J Westrich
Approved for public release; distribution is unlimited.
NOTICES
Disclaimers
The findings in this report are not to be construed as an official Department of the Army position unless so designated by other authorized documents.
Citation of manufacturer’s or trade names does not constitute an official endorsement or approval of the use thereof.
Destroy this report when it is no longer needed. Do not return it to the originator.
ARL-TR-8883 ● JAN 2020
Utilization of Three-Point Bending for Numerical Prediction of Structural Response in Additively Manufactured Parts FR Phillips, TC Henry, J Hrynuk, RA Haynes, and J Westrich Vehicle Technology Directorate, CCDC Army Research Laboratory E Bain Weapons and Materials Research Directorate, CCDC Army Research Laboratory Approved for public release; distribution is unlimited.
ii
REPORT DOCUMENTATION PAGE Form Approved OMB No. 0704-0188
Public reporting burden for this collection of information is estimated to average 1 hour per response, including the time for reviewing instructions, searching existing data sources, gathering and maintaining the data needed, and completing and reviewing the collection information. Send comments regarding this burden estimate or any other aspect of this collection of information, including suggestions for reducing the burden, to Department of Defense, Washington Headquarters Services, Directorate for Information Operations and Reports (0704-0188), 1215 Jefferson Davis Highway, Suite 1204, Arlington, VA 22202-4302. Respondents should be aware that notwithstanding any other provision of law, no person shall be subject to any penalty for failing to comply with a collection of information if it does not display a currently valid OMB control number. PLEASE DO NOT RETURN YOUR FORM TO THE ABOVE ADDRESS.
1. REPORT DATE (DD-MM-YYYY)
January 2020 2. REPORT TYPE
Technical Report 3. DATES COVERED (From - To)
21 September 2018–1 May 2019 4. TITLE AND SUBTITLE
Utilization of Three-Point Bending for Numerical Prediction of Structural Response in Additively Manufactured Parts
5a. CONTRACT NUMBER
5b. GRANT NUMBER
5c. PROGRAM ELEMENT NUMBER
6. AUTHOR(S)
FR Phillips, TC Henry, J Hrynuk, RA Haynes, E Bain, and J Westrich 5d. PROJECT NUMBER
5e. TASK NUMBER
5f. WORK UNIT NUMBER
7. PERFORMING ORGANIZATION NAME(S) AND ADDRESS(ES)
CCDC Army Research Laboratory ATTN: FCDD-RLV-M Austin, TX 78758
8. PERFORMING ORGANIZATION REPORT NUMBER
ARL-TR-8883
9. SPONSORING/MONITORING AGENCY NAME(S) AND ADDRESS(ES)
10. SPONSOR/MONITOR'S ACRONYM(S)
11. SPONSOR/MONITOR'S REPORT NUMBER(S)
12. DISTRIBUTION/AVAILABILITY STATEMENT
Approved for public release; distribution is unlimited.
13. SUPPLEMENTARY NOTES ORCID ID(s): Francis R Phillips, 0000-0003-4631-2416
14. ABSTRACT
The use of additive manufacturing is permeating multiple industries, and as such, it is necessary to develop rapid experimental and numerical techniques capable of accurately predicting the structural response of additively manufactured components. In this report, beams made using three different additive manufacturing techniques—namely, fused deposition modeling, selective laser sintering, and Polyjet—are subjected to three-point bend experiments. The results of these three-point bend experiments indicate that each additive manufacturing technique produces a beam with distinct tension‒compression asymmetry in both the elastic and plastic regimes. The resulting stress‒strain information is used to calibrate a material model unique to each additive manufacturing technique. Using the calibrated material model, we are able to show that numerical simulations can predict the peak axial force required to extend a complex aerostructure within less than 1% error.
16. SECURITY CLASSIFICATION OF: 17. LIMITATION OF ABSTRACT
UU
18. NUMBER OF PAGES
28
19a. NAME OF RESPONSIBLE PERSON
FR Phillips a. REPORT
Unclassified b. ABSTRACT
Unclassified
c. THIS PAGE
Unclassified
19b. TELEPHONE NUMBER (Include area code)
(979) 862-3359 Standard Form 298 (Rev. 8/98)
Prescribed by ANSI Std. Z39.18
iii
Contents
List of Figures iv
List of Tables iv
Acknowledgments v
1. Introduction 1
2. Methods and Procedure 2
2.1 Specimen Fabrication and Testing 2
2.2 Numerical Analysis 4
3. Results 5
3.1 Three-Point Bending Test Results 5
3.2 Numerical Modeling 8
3.3 Application to Complex Geometries 10
4. Conclusion 14
5. References 16
List of Symbols, Abbreviations, and Acronyms 20
Distribution List 21
iv
List of Figures
Fig. 1 Schematic of a) beam print direction; b) three-point bend test orientation 1; and c) three-point bend test orientation 2 ...................... 4
Fig. 2 Force‒displacement test information for xz loading as points and xy loading as lines ...................................................................................... 6
Fig. 3 Three-point bend results derived from DIC: a) SLS-5 strain results for vertical line below center roller; b) stress‒strain response for points on outer fiber of beam along vertical line below center roller. DIC stress‒strain measurements showing anisotropic behavior in tension and compression. ......................................................................................... 7
Fig. 4 Force vs. displacement for three-point bending test of a) SLS and b) FDM ...................................................................................................... 9
Fig. 5 a) Experimental and b) numerical results for SLS-5 beam under three-point bending at 3.33-mm displacement ............................................. 10
Fig. 6 Spanwise extending prototype a) as designed and b) stress at 100% spanwise extension .............................................................................. 11
Fig. 7 Prototype SLS spanwise expanding wing section loaded in Instron screw-driven test frame at 0-mm displacement .................................. 12
Fig. 8 Comparison of a) experimental and b) numerical strain in the spanwise direction at 50-mm displacement for an SLS prototype spanwise extending wing section ....................................................................... 13
Fig. 9 Strain along the axial direction, ϵyy, for the point along the leading spar identified in Fig. 8a for a UV-printed spanwise extending wing ........ 13
Fig. 10 Force‒displacement graph for prototype spanwise extending wing section made using FDM comparing a) experimental results and numerical prediction; b) numerical predictions using developed numerical model to an elastic model using solely the compressive or tensile modulus ................................................................................... 14
The authors would like to acknowledge the 3D printing expertise of Mr Howard Carpenter.
Research was sponsored by the CCDC Army Research Laboratory and was accomplished under Cooperative Agreement Number W911NF-18-2-0233. The views and conclusions contained in this document are those of the authors and should not be interpreted as representing the official policies, either expressed or implied, of the Army Research Laboratory or the US Government. The US Government is authorized to reproduce and distribute reprints for Government purposes notwithstanding any copyright notation herein.
1
1. Introduction
The use of additive manufacturing (AM) to enable the rapid prototyping of products containing new concepts has shown promise in a number of industries. For instance, additively manufactured prototypes have been used by automotive manufacturers due in part to the ability to get to market faster; within the aerospace industry due to the ability to generate highly complex and high-performance parts; and within the medical industry because it enables the generation of solid objects based on 3D imaging data.1,2 AM has been used extensively within the aerospace industry’s research community with both civilian and military applications in mind. Specifically, in 1998, Michelson and Reece used Fused Deposition Modeling (FDM) to produce a wing rib structure for their micro air vehicle.3 Since then, AM has been used to manufacture anything from individual parts in an unmanned aerial system (UAS), such as a quadcopter support frame4,5 and individual engine parts,6 to a full aircraft.7,8 Some military applications have even considered using AM to manufacture unmanned aerial vehicles (UAVs), as was demonstrated with the RQ-16 T-Hawk UAV.9 Furthermore, AM has also been used to enable the fabrication of morphing wings, some of which are designed to undergo a 100% spanwise extension,10 while others may be focused on airfoil or twist morphing.11–14
While additively manufactured components are becoming increasingly common, the mechanical properties of a material being used in AM are generally different between the various AM techniques as well as from cast counterparts.15–18 Furthermore, both the type of AM process (and specific parameters within the given process) and the print orientation often yield additional variation in the resulting mechanical properties.19–21 This was highlighted well in the review article by Lewandowski and Seifi in which they show that for Ti-6Al-4V the yield strength can vary from as low as 735 MPa up to 1150 MPa, and the elongation at failure can vary from 2.3% to over 20%.15 Furthermore, looking specifically at the AM of polymeric components, mechanical properties have been shown to differ based on the different printing methods available, including stereolithography,22,23 FDM,24,25 selective laser sintering (SLS),26,27 and Polyjet.28,29 Additionally, within a given printing method, parameters such as the raster width and angle, infill pattern and density, build orientation, layer thickness, air gap, and feed rate can have a significant impact on the material properties of the resulting component.20,30–32
As a result of the potential for variation in mechanical properties, it is not surprising that one of the major hurdles to the widespread use of additively manufactured parts is a better understanding of how the same final product compares when produced by different methods. It is therefore the purpose of this study to use the mechanical response of a beam subjected to three-point bending to develop a numerical method
2
capable of predicting the mechanical response of a complex additively manufactured component. We first discuss the manufacturing methods used (FDM, SLS, and Polyjet) and then the experimental procedure. We then present the mechanical response from the three-point bending experiments, followed by an analysis of the results. Finally, these results are used to develop a numerical model that is used to predict the response of a complex additively manufactured structure.
2. Methods and Procedure
2.1 Specimen Fabrication and Testing
In order to compare a final net product, this study fabricated and analyzed beams that were additively manufactured using three printing methods. Specifically, beams were manufactured using the FDM, SLS, and Polyjet AM methods, and the materials used were Onyx, Duraform ProX, and RGD 875, respectively. For specimen naming simplicity, Polyjet samples are identified as UV due to the use of ultraviolet light (UV light) to cure the photopolymer during deposition. At least four specimens of each type and orientation were manufactured of nominal size of 80 × 10 × 10 mm in terms of length (l), width (w), and thickness (t), respectively; the exact measurements, as well as the mass (m), are shown in Table 1. Specimens were named by manufacturing method and number (e.g., SLS-1).
Table 1 Three-point bending specimen dimensions
Test orientation 1 Test orientation 2 No. l, mm w, mm t, mm m, g No. l, mm w, mm t, mm m, g
FDM specimens were printed with a Markforged 3D printer. Onyx thermoplastic filament was used, which consists of Nylon 6 infused with crushed carbon fiber. Each part was printed with a target 100% fill with a layer height of 0.1 mm. The print environment was standard atmosphere at room temperature.
SLS specimens were produced in a ProX 500 SLS machine from 3D Systems. Virgin Duraform ProX PA12 powder was blended with recycled powder in a ratio of 85/15 (m/m) in a Material Quality Control (MQC) system. This powder blend was then fed pneumatically from the MQC to the SLS machine. The process chamber environment was held below 5% O2 via continuous nitrogen gas purge. Default processing conditions for the material were used, including a 13-mm-thick base layer, bed temperature of 169 °C during build phase, layer thickness of 0.1 mm, laser speed of 12 m/s, laser scan spacing of 0.2 mm, fill laser power of 62 W, and outline laser power of 20 W. Raster direction was alternated layer by layer between X and Y directions (“Sinterscan” option). During the cooling phase an additional 2.6 mm of powder was added on top of the completed build, followed by an uncontrolled cooldown during which the bed surface temperature dropped at approximately 0.9 °C/min. The powder cake was left in the machine for at least 14 h before removing and breaking out parts. Parts were finished by blasting with superfine alumina to remove loose powder.
The Polyjet specimens were additively manufactured with an Objet Eden 260VS 3D printer using the Stratasys Polyjet printing technique.33 In this technique, the printer deposits liquid photopolymer onto a build tray, which is cured nearly instantly using UV light. This printer is capable of a resolution of 600 dpi in the printing plane and 1600 dpi in the out of plane.
The three-point bend testing was conducted on an MTS hydraulic test machine in accordance with ASTM D726434 (Fig. 1b for specimens identified as test orientation 1 in Table 1 and Fig. 1c for specimens identified as test orientation 2 in Table 1). Specimens had an unsupported length of 60 mm and were loaded at a rate of 1 mm/min to a maximum displacement of 8 mm while time, force, and displacement information were recorded at a rate of 1 Hz. The specimens were coated with a flat white spray paint upon which a black speckle pattern was added to enable 3D digital image correlation (DIC) analysis of the deformation during the three-point bend testing. Images for DIC analysis were collected using a pair of five megapixel Point Grey Research digital cameras at a rate of 1 Hz in stereo vision and processed using Vic-3D from Correlated Solutions, using a subset, step, and filter size of 35, 2, and 20, respectively.
4
Fig. 1 Schematic of a) beam print direction; b) three-point bend test orientation 1; and c) three-point bend test orientation 2
2.2 Numerical Analysis
To enable future use of the results obtained from the experimental study, we transferred the experimental results into a numerical framework. We chose the Abaqus finite element software to generate an appropriate material model because of the flexibility it allows in making material models. As shown in Section 3, the three-point bend tests indicate that the beams printed all exhibit some level of tension‒compression asymmetry in both the elastic and plastic regimes. While some built-in material models are capable of handling tension‒compression asymmetry in the elastic regime and other built-in material models can handle elastic/plastic properties, no built-in material model in Abaqus was found capable of handling tension‒compression asymmetry in both the elastic and plastic regimes. As such, a custom user-material subroutine (UMAT) was generated, which was capable of handling tension‒compression asymmetry in both the elastic and plastic regimes and could be calibrated based on the experimental three-point bending results.
For validation of the generated UMAT and extracted material parameters, the three-point bend tests were repeated numerically using the same beam geometry and
(a)
(b)
(c)
5
experimental conditions described in Section 2.1. The mesh used C3D8 elements and had a mesh size of 2 mm in the x- and y-directions based on Fig. 1b. In the z-direction (based on Fig. 1b), the mesh size was 0.5 mm because it was expected that the largest stress‒strain variation in any given cross section should be in this direction. Furthermore, a large stress‒strain gradient was also expected in the x-direction near the rollers, and as such, the mesh near the rollers was also refined to a mesh size of 0.5 mm in the region close to the rollers.
3. Results
3.1 Three-Point Bending Test Results
Through analysis of the three-point test results, it can be shown that all three processes, in both orientations, generally behave in a similar manner through the elastic regime based on the 0- to 2-mm displacement shown in Fig. 2 for a typical specimen from all three printing techniques in both orientations. Based on Fig. 2, the variation in force displacement between printing techniques and print orientation begins after leaving this elastic regime. The data show that while the UV specimens experience plastic softening (both orientations are very similar, only varying slightly in maximum force), specimens manufactured using the FDM and SLS processes experience plastic hardening. Furthermore, from a print orientation perspective, it can be seen from Fig. 2 that the SLS specimens printed in orientation 1 had less plastic hardening and experienced failure at lower displacements than their orientation 2 counterparts. The SLS specimens were the only specimens to fail by brittle fracture prior to 8-mm displacement as indicated by the X in Fig. 2 for the SLS-1 and SLS-5 curves. Also, the FDM-1 specimen exhibited some damage as indicated by the force drop at approximately 6.2- and 7-mm displacement; however, it did not experience failure. All other printing techniques and orientations were able to achieve the full 8-mm displacement. Given that the overall force‒displacement response is similar regardless of print orientation for a specific print orientation, further analysis on the stress‒strain behavior and modeling of the structural response was conducted specifically for specimens with print orientation 2.
6
Fig. 2 Force‒displacement test information for xz loading as points and xy loading as lines
Digging deeper into the structural response of the specimens with print orientation 2, it is necessary to understand the stress‒strain relationship for each of the printing methods in order to enable modeling of the three-point bend experiments. Generally, the neutral axis for specimens of any printing method was near the centerline of the specimen (at thickness location t = 0 mm) during the elastic portion of the material response. However, upon reaching plastic response, the centerline tended to move up the specimen (closer to the center roller as shown in Fig. 1). To account for this changing centerline position, stress calculations were adjusted to take into account the fact that the material volume experiencing tension and compression was unequal. Derivations of the equations are straightforward, especially when the strain response is linear, to get to Eqs. 1 and 2:
𝜎𝜎𝑡𝑡 = 3𝐹𝐹𝐹𝐹𝑠𝑠4𝑤𝑤𝑤𝑤𝑡𝑡
(1)
𝜎𝜎𝑐𝑐 = 𝑤𝑤𝑡𝑡 − 𝑤𝑤
𝜎𝜎𝑡𝑡, (2)
where σt is the tensile stress, σc is the compressive stress, F is the force applied, Ls is the supported length, and n is the location of the centerline (w and t are the width and thickness of the specimen as defined in Table 1). Using Eqs. 1 and 2 to get the stress response for each printing method (as well as the strain obtained through DIC at the top and bottom of the beams), the stress‒strain response for each specimen is plotted in Fig. 3b, in which it can be seen that the initial elastic region (≈ 0%−2% strain) for each AM technique is similar. However, the stress‒strain results in Fig. 3b indicate a different modulus in tension than in compression for each AM technique. Furthermore, the plastic response is different for each AM technique
7
under both tension and compression. For completeness, the results enable a calculation of the compression and tension modulus within the 0–3000 µє range (the elastic regime) for the FDM, SLS, and UV manufacturing methods of 3.28 GPa (Cv = 13.6%) and 2.13 GPa (Cv = 7.4%), 2.68 GPa (Cv = 7.5%) and 2.06 GPa (Cv = 6.9%), and 3.80 GPa (Cv = 8.5%) and 1.83 GPa (Cv = 8.8%), respectively.
Fig. 3 Three-point bend results derived from DIC: a) SLS-5 strain results for vertical line below center roller; b) stress‒strain response for points on outer fiber of beam along vertical line below center roller. DIC stress‒strain measurements showing anisotropic behavior in tension and compression.
(a)
(b)
8
3.2 Numerical Modeling
The experimental results for three-point bending presented in Section 3.1 clearly indicate that these materials show a nonlinear and asymmetric material response. Therefore, to properly predict the behavior of such materials for use in complex structures that may experience both tension and compression in elastic and plastic regimes, it is necessary to use a numerical model capable of such tension‒compression asymmetry in the elastic and plastic regimes. Numerous models already exist that are capable of handling an asymmetric tension‒compression yield surface, primarily for metallic materials.35–37 Furthermore, other models are capable of handling asymmetric tension‒compression behavior in the elastic regime. However, to the authors’ knowledge, a constitutive model capable of capturing tension‒compression asymmetry in both the elastic and plastic regime is not yet available.
To properly capture the tension‒compression asymmetry in both the elastic and plastic regimes, a custom UMAT was developed that is capable of determining whether a material point was experiencing tension or compression and applying the appropriate material response to the material point. The UMAT enables the user to input a different elastic modulus for tension and compression, and then separates isotropic hardening within the plastic regime between compressive and tensile loading. To calibrate the UMAT for any general material, the user provides the elastic tensile and compressive Young’s moduli (in this case from the 0–3000 µє range as discussed previously) as well as the Poisson’s ratio. The user can then input as many (or as few) plastic isotropic hardening data points for tension as needed to accurately capture the plastic hardening curve. Similarly, the user subsequently inputs plastic isotropic hardening points for compression. In this manner, while the UMAT does assume isotropic response, it does allow for tension‒compression asymmetry in both the elastic and plastic regimes. Furthermore, since the calibration parameters are input to the UMAT, the UMAT is therefore capable of being used to simulate any material that may exhibit tension‒compression asymmetry in both the elastic and plastic regimes.
Through calibration of the UMAT material parameters as described previously and based on the results of Fig. 3, it was thereby possible to reproduce the stress‒strain response, and therefore the force‒displacement response of the three-point bend tests as shown in Fig. 4. Based on these results, the symmetric mean absolute percentage error (SMAPE) in all cases is well below 10% for the entire 0- to 8-mm displacement range (FDM 3.8%, SLS 1.6%, UV 3.4%). Furthermore, the data show that within the 0- to 4-mm displacement range, when the bulk of the material is in the elastic regime and/or initial plastic regime, the SMAPE (FDM 3.8%, SLS 0.8%,
9
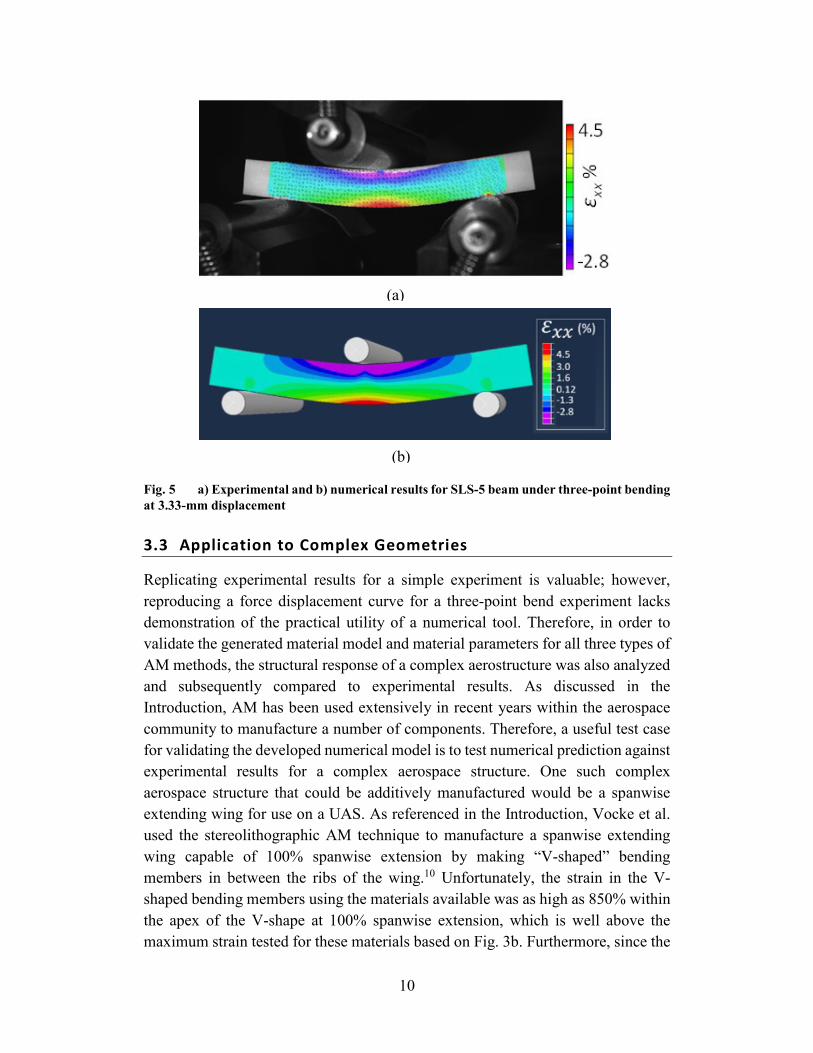
UV 2.4%) indicates a strong match between the experimental and numerical data. Given that most applications will tend to use material within the elastic regime or allow for some plastic hardening, additional material parameter optimization for the highly plastic regime was not performed. Additional confirmation of the validity of the developed UMAT and calibrated material parameters can be found by comparing the numerical strain results to the experimental strain results as captured by DIC. Such a comparison is shown in Fig. 5, also indicating a good match between the experimental and numerical results for three-point bend testing.
Fig. 4 Force vs. displacement for three-point bending test of a) SLS and b) FDM
(a)
(b)
10
Fig. 5 a) Experimental and b) numerical results for SLS-5 beam under three-point bending at 3.33-mm displacement
3.3 Application to Complex Geometries
Replicating experimental results for a simple experiment is valuable; however, reproducing a force displacement curve for a three-point bend experiment lacks demonstration of the practical utility of a numerical tool. Therefore, in order to validate the generated material model and material parameters for all three types of AM methods, the structural response of a complex aerostructure was also analyzed and subsequently compared to experimental results. As discussed in the Introduction, AM has been used extensively in recent years within the aerospace community to manufacture a number of components. Therefore, a useful test case for validating the developed numerical model is to test numerical prediction against experimental results for a complex aerospace structure. One such complex aerospace structure that could be additively manufactured would be a spanwise extending wing for use on a UAS. As referenced in the Introduction, Vocke et al. used the stereolithographic AM technique to manufacture a spanwise extending wing capable of 100% spanwise extension by making “V-shaped” bending members in between the ribs of the wing.10 Unfortunately, the strain in the V-shaped bending members using the materials available was as high as 850% within the apex of the V-shape at 100% spanwise extension, which is well above the maximum strain tested for these materials based on Fig. 3b. Furthermore, since the
(a)
(b)
11
SLS specimens experienced failure when tensile strains exceeded 13%–18% (for specimens SLS-1 and SLS-5, respectively), these numerical results indicate that the V-shape members would break before reaching 100% spanwise extension of the structure. Therefore, an alternate geometry using smooth splines is considered in this study with the design goal of reaching 100% spanwise extension while minimizing any plastic strain generation. One such geometry capable of satisfying these design goals is shown in Fig. 6a, which has 54-mm inter-rib spacing, 1.3-mm-thick splines connecting the ribs, and a 9-mm radius of curvature. Using this modified geometry, the maximum strain of 4.2% at 100% spanwise extension is well within the range of strains that could be achieved based on Fig. 3b. The resulting von Mises stress at 100% spanwise extension for this design using the UV material properties is shown in Fig. 6b. These results indicate that while some minor plastic strain is expected, the overall design should be able to undergo repeated 100% spanwise extension without failure.
Fig. 6 Spanwise extending prototype a) as designed and b) stress at 100% spanwise extension
(a)
(b)
12
In order to validate the numerical predictions, prototypes of the spanwise extending wing section were additively manufactured using the three AM techniques studied. Using the tabs on the outside of the ribs as shown in Fig. 6a, the resulting prototypes were subjected to spanwise extension testing using an Instron screw-driven test frame. A quasi-static displacement control test was run on each prototype at 10 mm/min to –15 mm, 30 mm, –15 mm, 50 mm, –15 mm, and finally to 0 mm while recording time, force, and displacement. Similar to the three-point bend test, DIC was also used to capture the strain on the front spline. An image of the SLS prototype loaded in the test frame at 0-mm displacement is shown in Fig. 7.
Fig. 7 Prototype SLS spanwise expanding wing section loaded in Instron screw-driven test frame at 0-mm displacement
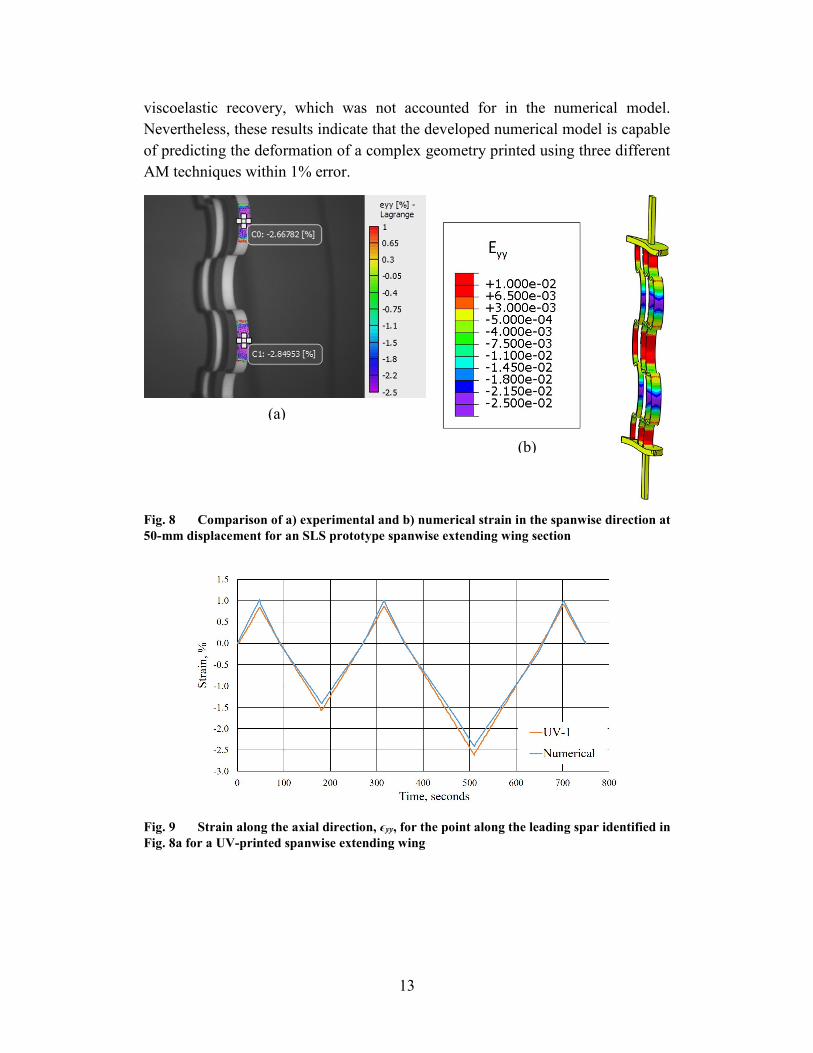
To validate the predictive ability of the developed numerical model, it is now possible to compare the numerically predicted strain to the experimentally obtained strain given the experimental DIC results. Such a comparison is provided in Fig. 8, in which both the numerical and experimental strain along the axial direction, ϵyy, in the outer portions of the front spline for a prototype made using the SLS AM technique are shown to be nearly equivalent. In addition, to show that the match is good across the various AM techniques, Fig. 9 shows that the strain in the axial direction, ϵyy, tracks well throughout the entire experimental procedure at the points highlighted on Fig. 8a for a UV printed part. Furthermore, comparison of the force required to displace the wing section also indicates a good match between the numerical and experimental results for an FDM printed part as shown in Fig. 10a. Of particular interest in Fig. 10a is that both the experimental and numerical show a nonlinear force‒displacement relationship during extension beyond 15 mm, which can be attributed to the onset of plastic deformation according to the numerical results. Such nonlinearity would not have been captured without the use of a material model capable of capturing tension‒compression asymmetry in both the elastic and plastic regimes, as evidenced in Fig. 10b. The variation between the experimental results and numerical predictions in Fig. 10a can be attributed to
13
viscoelastic recovery, which was not accounted for in the numerical model. Nevertheless, these results indicate that the developed numerical model is capable of predicting the deformation of a complex geometry printed using three different AM techniques within 1% error.
Fig. 8 Comparison of a) experimental and b) numerical strain in the spanwise direction at 50-mm displacement for an SLS prototype spanwise extending wing section
Fig. 9 Strain along the axial direction, ϵyy, for the point along the leading spar identified in Fig. 8a for a UV-printed spanwise extending wing
(a)
(b)
14
Fig. 10 Force‒displacement graph for prototype spanwise extending wing section made using FDM comparing a) experimental results and numerical prediction; b) numerical predictions using developed numerical model to an elastic model using solely the compressive or tensile modulus
4. Conclusion
As the use of additively manufactured components increases, it is necessary to be able to understand and predict how an additively manufactured component will behave. Furthermore, given the proliferation of possible AM techniques, it is necessary for a designer to understand how the final product will behave given the technique used. This study has shown the following:
(a)
(b)
15
• Beams subjected to three-point bend testing from three different AM techniques (FDM, SLS, and UV) will behave differently. The print orientations tested did not significantly alter the elastic or plastic response; however, the print orientation did impact the failure of the beams.
• The additively manufactured beams all exhibit some level of tension‒compression asymmetry within both the elastic and plastic regimes.
• A custom user-material subroutine developed in Abaqus was able to appropriately capture the tension‒compression asymmetry and reproduce the experimental strains and the force‒displacement behavior.
• Use of the developed user-material subroutine and the material parameters based on the three-point bending tests allowed us to accurately predict the response of a part with complex geometry that was manufactured using these three different AM techniques.
Therefore, through the careful analysis of a three-point bend test, it is possible to predict how a complex part that is additively manufactured will respond to structural loading.
16
5. References
1. Campbell I, Bourell D, Gibson I. Additive manufacturing: rapid prototyping comes of age. Rapid Prototyping Journal. 2012;18(4):255–258.
2. Guo N, Leu MC. Additive manufacturing: technology, applications and research needs. Frontiers of Mechanical Engineering. 2013;8(3):215–243.
3. Michelson RC, Reece S. (1998) Update on flapping wing micro air vehicle research-ongoing work to develop a flapping wing, crawling entomopter. In: 13th Bristol International RPV/UAV Systems Conference Proceedings; 1998; Bristol, England. Vol 30, pp 30–1.
4. Neather A. MK XIII micro quad. London (UK): MyMiniFactory; 2017 [accessed 2019 Dec 9]. https://www.myminifactory.com/object/mk-xii-micro-quad-28907.
5. Zhang T, Zhou C, Su S. Design and development of bio-inspired flapping wing aerial vehicles. In: 2015 International Conference on Advanced Robotics and Intelligent Systems (ARIS); IEEE; 2015; pp 1–6.
6. Kellner T. Fit to print: new plant will assemble world’s first passenger jet engine with 3D printed fuel nozzles, next-gen materials. Boston (MA): General Electric (GE); 2014 [accessed 2019 Dec 12]. https://www.ge.com/reports/post/80701924024/fit-to-print/.
7. Ahmed NA, Page J. Manufacture of an unmanned aerial vehicle (UAV) for advanced project design using 3D printing technology. Applied Mechanics and Materials, Trans Tech Publ. 2013;397:970–980.
8. Richter C, Lipson H. Untethered hovering flapping flight of a 3D-printed mechanical insect. Artificial Life. 2011;17(2):73–86.
9. SLS 3D printing delivers the lighter, better UAV with 3D systems on demand manufacturing. Rock Hill (SC): 3D Systems; 2017 [accessed 2019 Dec 9]. https://www.3dsystems.com/learning-center/case-studies/lighter-better-uav.
10. Vocke III RD, Kothera CS, Woods BK, Wereley NM. Development and testing of a span-extending morphing wing. Journal of Intelligent Material Systems and Structures. 2011;22(9):879–890.
11. Pankonien AM, Durscher R, Bhagat ND, Reich G. Multi-material printed trailing edge control surface for an aeroservoelastic wind tunnel model. In: 2018 Multidisciplinary Analysis and Optimization Conference; 2018; p 2930.
12. Rodrigue H, Cho S, Han MW, Bhandari B, Shim JE, Ahn SH. Effect of twist morphing wing segment on aerodynamic performance of UAV. Journal of Mechanical Science and Technology. 2016;30(1):229–236.
13. Strelec JK, Lagoudas DC. Fabrication and testing of a shape memory alloy actuated reconfigurable wing. In: Smart Structures and Materials 2002: Smart Structures and Integrated Systems, International Society for Optics and Photonics. 2002;4701:267–280.
14. Woods BK, Parsons L, Coles AB, Fincham JH, Friswell MI. Morphing elastically lofted transition for active camber control surfaces. Aerospace Science and Technology. 2016;55:439–448.
15. Lewandowski JJ, Seifi M. Metal additive manufacturing: a review of mechanical properties. Annual Review of Materials Research. 2016;46:151–186.
16. Shamsaei N, Yadollahi A, Bian L, Thompson SM. An overview of direct laser deposition for additive manufacturing; part II: mechanical behavior, process parameter optimization and control. Additive Manufacturing. 2015;8:12–35.
17. Tolosa I, Garciandía F, Zubiri F, Zapirain F, Esnaola A. Study of mechanical properties of AISI 316 stainless steel processed by “selective laser melting”, following different manufacturing strategies. The International Journal of Advanced Manufacturing Technology. 2010;51(5–8):639–647.
18. Wong KV, Hernandez A. A review of additive manufacturing. International Scholarly Research Notices Mechanical Engineering. 2012. doi: http://dx.doi.org/10.5402/2012/208760.
19. Chacón J, Caminero MA, García-Plaza E, Núnez PJ. Additive manufacturing of PLA structures using fused deposition modelling: effect of process parameters on mechanical properties and their optimal selection. Materials & Design. 2017;124:143–157.
21. Wang Z, Palmer TA, Beese AM. Effect of processing parameters on microstructure and tensile properties of austenitic stainless steel 3041 made by directed energy deposition additive manufacturing. Acta Materialia. 2016;110:226–235.
18
22. Jacobs PF. Rapid prototyping & manufacturing: fundamentals of stereolithography. Dearborn (MI): Society of Manufacturing Engineers; 1992.
23. Melchels FP, Feijen J, Grijpma DW. A review on stereolithography and its applications in biomedical engineering. Biomaterials. 2010;31(24):6121–6130.
24. Domingo-Espin M, Puigoriol-Forcada JM, Garcia-Granada AA, Llumà J, Borros S, Reyes G. Mechanical property characterization and simulation of fused deposition modeling polycarbonate parts. Materials & Design. 2015;83:670–677.
25. Singh R, Garg HK. Fused deposition modeling – a state of art review and future applications. Materials Science and Materials Engineering. 2016.
26. Bai J, Zhang B, Song J, Bi G, Wang P, Wei J. The effect of processing conditions on the mechanical properties of polyethylene produced by selective laser sintering. Polymer Testing. 2016;52:89–93.
27. Gibson I, Shi D. Material properties and fabrication parameters in selective laser sintering process. Rapid Prototyping Journal. 1997;3(4):129–136.
28. Caz´on A, Morer P, Matey L. Polyjet technology for product prototyping: tensile strength and surface roughness properties. Proceedings of the Institution of Mechanical Engineers, Part B: Journal of Engineering Manufacture. 2014;228(12):1664–1675.
29. Gay P, Blanco D, Pelayo F, Noriega A, Fernández P. Analysis of factors influencing the mechanical properties of flat Polyjet manufactured parts. Procedia Engineering. 2015;132:70–77.
30. Dana HR, Barbe F, Delbreilh L, Azzouna MB, Guillet A, Breteau T. Polymer additive manufacturing of abs structure: influence of printing direction on mechanical properties. Journal of Manufacturing Processes. 2019;44:288–298.
31. Farzadi A, Solati-Hashjin M, Asadi-Eydivand M, Osman NAA. Effect of layer thickness and printing orientation on mechanical properties and dimensional accuracy of 3D printed porous samples for bone tissue engineering. PLoS ONE. 2014;9(9):e108252.
32. Tymrak B, Kreiger M, Pearce JM. Mechanical properties of components fabricated with open-source 3-D printers under realistic environmental conditions. Materials & Design. 2014;58:242–246.
34. ASTM D7264 / D7264M - 15. Standard test method for flexural properties of polymer matrix composite materials. West Conshohocken (PA): ASTM International; 2015.
35. Cazacu O, Barlat F. A criterion for description of anisotropy and yield differential effects in pressure-insensitive metals. International Journal of Plasticity. 2004;20(11):2027–2045.
36. Kim J, Ryou H, Kim D, Kim D, Lee W, Hong SH, Chung K. Constitutive law for az31b mg alloy sheets and finite element simulation for three-point bending. International Journal of Mechanical Sciences. 2008;50(10–11):1510–1518.
37. Lee MG, Wagoner R, Lee J, Chung K, Kim H. Constitutive modeling for anisotropic/asymmetric hardening behavior of magnesium alloy sheets. International Journal of Plasticity. 2008;24(4):545–582.
20
List of Symbols, Abbreviations, and Acronyms
3D three-dimensional
AM additive manufacturing
FDM fused deposition modeling
DIC digital image correlation
MQC material quality control
SLS selective laser sintering
SMAPE symmetric mean absolute percentage error
UAS unmanned aerial system
UAV unmanned aerial vehicle
UL ultraviolet light
UMAT user-material subroutine
UV ultraviolet
21
1 DEFENSE TECHNICAL (PDF) INFORMATION CTR DTIC OCA 1 CCDC ARL (PDF) FCDD RLD CL TECH LIB 6 CCDC ARL (PDF) FCDD RLV A J HRYNUK J WESTRICH FCDD RLV M FR PHILLIPS TC HENRY RA HAYNES FCDD RLW MG E BAIN