34
1 Utilizing Benchmarking to Utilizing Benchmarking to Manage Health Center Operations Manage Health Center Operations Curt Degenfelder Managing Director [email protected]
| Date post: | 07-Apr-2018 |
| Category: |
Documents |
| Upload: | hoangthuan |
| View: | 223 times |
| Download: | 3 times |
1
Utilizing Benchmarking to Manage Health Center Operations
Utilizing Benchmarking to Utilizing Benchmarking to Manage Health Center OperationsManage Health Center Operations
Curt DegenfelderManaging [email protected]

2
Provider! Physician Productivity! Physician Salary & Fringe! Midlevel Productivity! Midlevel Salary & Fringe! Midlevel/Physician Mix
Direct Provider Support! Staffing Ratios! Direct Provider Support Mix! Direct Provider Support Salaries & Fringe
Enabling! Staffing Ratios! Other Staff who Engage in Enabling
Services
KEY COMPONENTS OF COST PER VISIT
Overhead! Staffing ratios! Overhead % of Total Cost! Facility Overhead! Administrative Overhead
Ancillary & Other! Dental! Pharmacy! Radiology! Lab! WIC! Other Programs
3
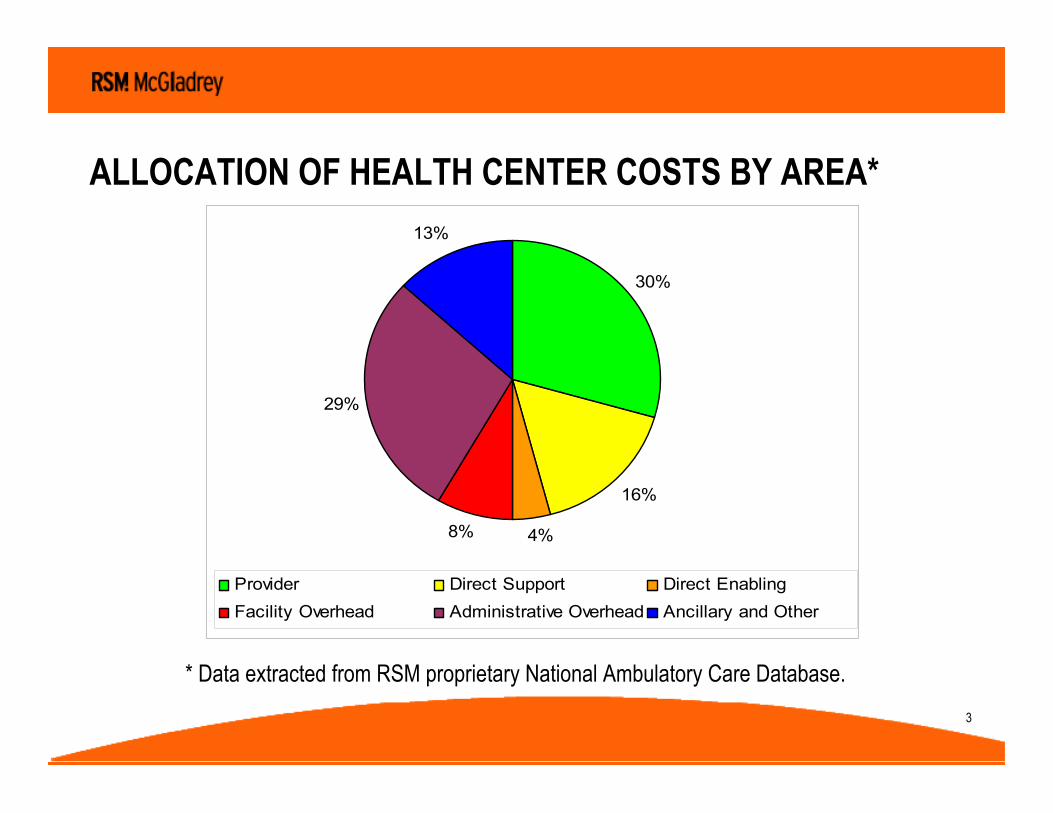
30%
16%
4%8%
29%
13%
Provider Direct Support Direct EnablingFacility Overhead Administrative Overhead Ancillary and Other
ALLOCATION OF HEALTH CENTER COSTS BY AREA*
* Data extracted from RSM proprietary National Ambulatory Care Database.

4
PHYSICIAN PRODUCTIVITY - VISITS
Data Source: Internal Reports, Worksheet B of the Medicare Cost Report
Cost Component Calculation ComparisonPhysician Productivity Total Physician Visits Productivity(by provider type) Physician FTEs Standards
COMPARATIVE DATA BY SPECIALTY: Health Center (1) MGMA (2)
General and Internal Medicine 3,566 3,651Family Practice 3,858 4,367Pediatrics 3,623 4,771Obstetrics & Gynecology 3,679 2,962Median of all Physicians 3,682 4,009
(1) Data is from proprietary Health Center Database maintained by RSM McGladrey Inc.(2) Data is from Physician Compensation and Production Survey: 2004 Report Based on 2003 Data (MGMA 2004) Represents
Ambulatory Encounters only.

5
PROVIDER PRODUCTIVITY
DRIVERS OF PROVIDER PRODUCTIVITY:
• Provider Mix (Number of Physicians, Nurse Practitioners, etc.)
• Percent of Time spent in Patient Care
• Adequate Infrastructure to Support Providers
• Number of Scheduled Patients plus Walk-Ins
6
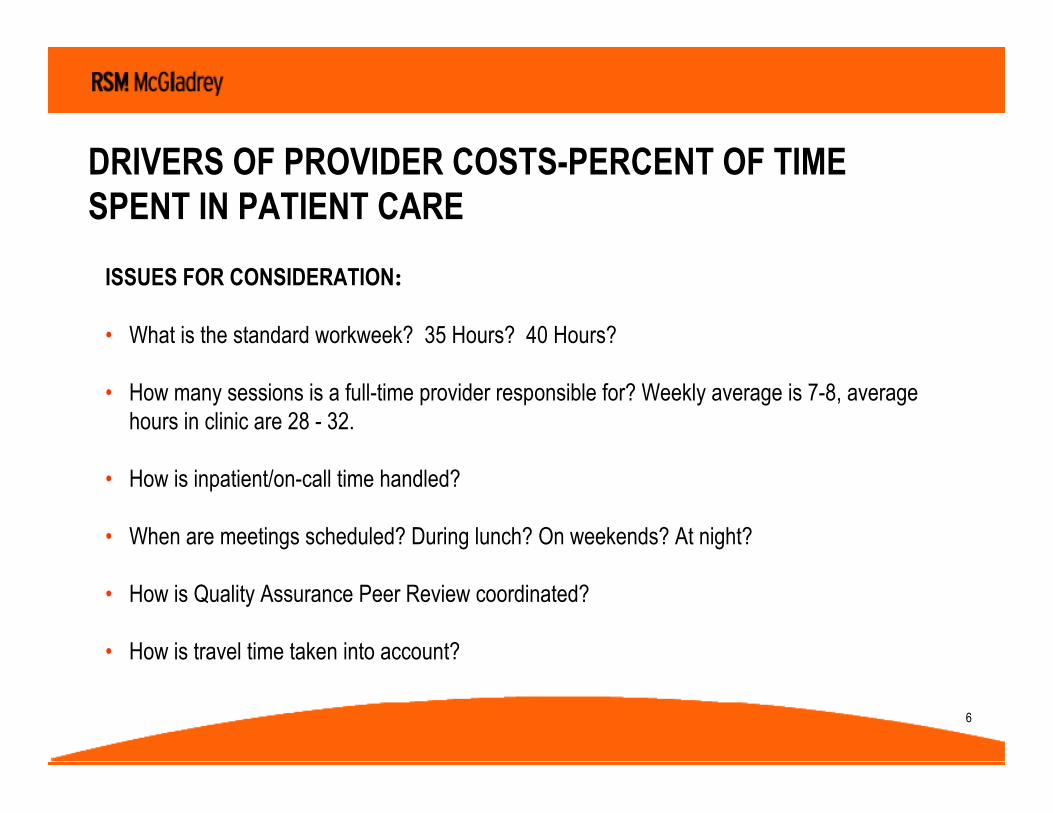
DRIVERS OF PROVIDER COSTS-PERCENT OF TIME SPENT IN PATIENT CARE
ISSUES FOR CONSIDERATION:
• What is the standard workweek? 35 Hours? 40 Hours?
• How many sessions is a full-time provider responsible for? Weekly average is 7-8, average hours in clinic are 28 - 32.
• How is inpatient/on-call time handled?
• When are meetings scheduled? During lunch? On weekends? At night?
• How is Quality Assurance Peer Review coordinated?
• How is travel time taken into account?
7
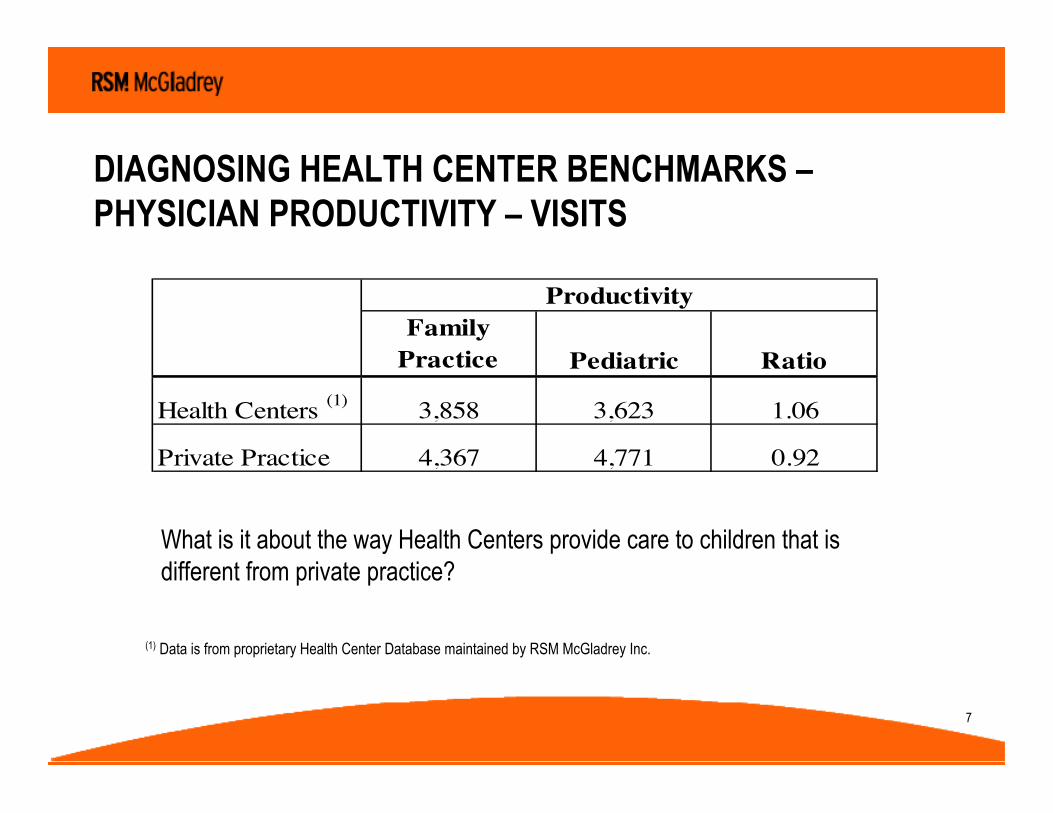
DIAGNOSING HEALTH CENTER BENCHMARKS –PHYSICIAN PRODUCTIVITY – VISITS
What is it about the way Health Centers provide care to children that is different from private practice?
(1) Data is from proprietary Health Center Database maintained by RSM McGladrey Inc.
Family Practice Pediatric Ratio
Health Centers (1) 3,858 3,623 1.06
Private Practice 4,367 4,771 0.92
Productivity

8
Cost Component Example Comparison
Physician Salary Total Physician Salaries/ Regional SalariesTotal Physician FTEs
COMPARATIVE DATA BY SPECIALTY: Health Center (1) MGMA
General and Internal Medicine $ 131,455 $ 159,252Family Practice $ 135,148 $ 157,481Pediatrics $ 129,779 $ 158,867Obstetrics & Gynecology $ 201,068 $ 237,191Median of all Physicians $ 136,136 $159,252
(1) Data extracted from RSM proprietary National Ambulatory Care Database.
DRIVERS OF PROVIDER COSTS -SALARY - PHYSICIAN

9
PHYSICIAN COST PER VISIT
Data Source: Medicare Cost Report, Worksheet A, Line 1, Column 5 Divided by Worksheet B, Line 1, Column 2
Cost Component Calculation Comparison
Physician Cost per Medical Visit Total Physician Cost / Evaluate Against Total Medical Visits Cost per Visit Standards
Example: $585,862 Salary & Fringe Cost/11,546 visits = $50.74/visit
National Median for Health Centers - $44.00 (1)
(1) Data is from proprietary Health Center Database maintained by RSM McGladrey Inc.

10
PHYSICIAN COST PER VISIT BY PHYSICIAN TYPE*
General & Internal
MedicineFamily
Practice PediatricsMD Cost per
Visit
Health Center A 43.12$ 38.21$ 43.01$ 63.21$
Health Center B 32.88$ 31.33$ 33.38$ 32.74$
Health Center C 41.06$ 40.08$ 38.15$ 58.05$
National Median 42.09$ 39.79$ 39.82$ 44.00$
* Includes fringe benefits

11
PHYSICIAN COST PER VISIT
While Health Center A has higher Physician Salary Costs, thus higher absolute costs than the national average, it also has higher productivity. This ultimately leads to a lower cost per visit.
Productivity is the #1 Driver of Cost
Physician Salary
Physician Productivity
Physician Salary per
Visit
Facility Overhead Cost per Physician
Facility Overhead per Visit
Facility and Physician
Salary Cost per Visit
Health Center A 128,359$ 4,700 27.31$ 32,000 6.81$ 34.12$
National Median 125,534$ 3,694 33.98$ 32,000 8.72$ 42.70$
12
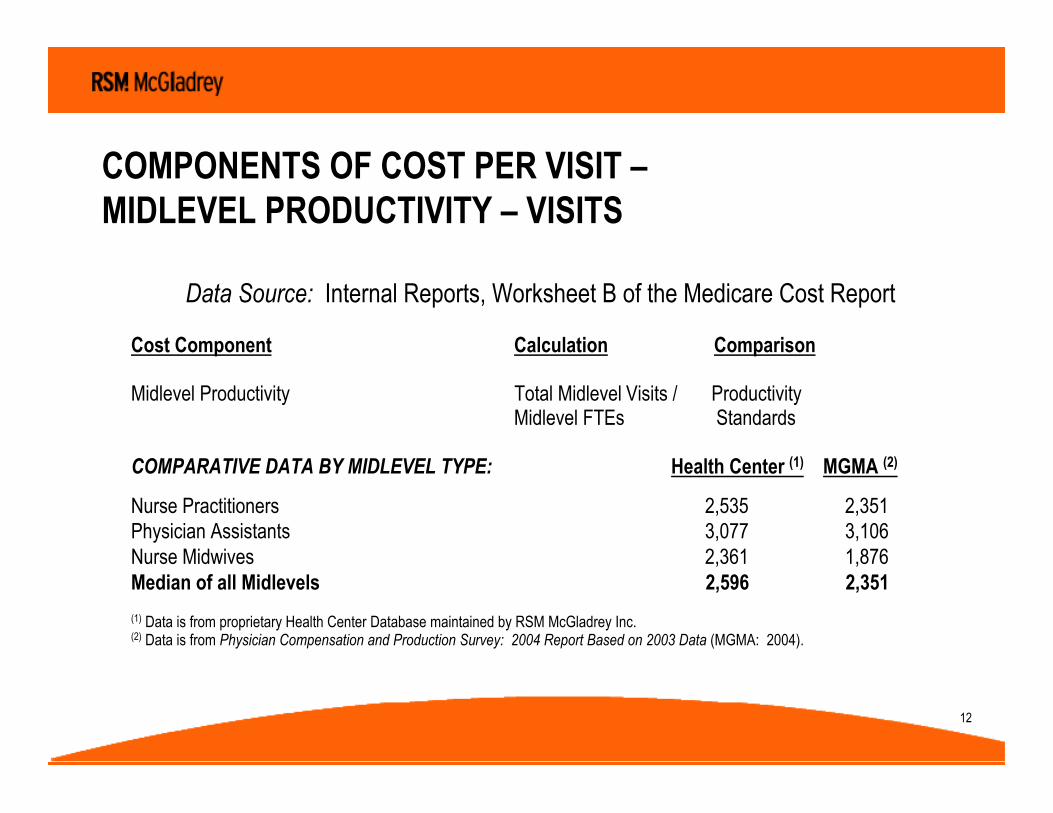
COMPONENTS OF COST PER VISIT –MIDLEVEL PRODUCTIVITY – VISITS
Data Source: Internal Reports, Worksheet B of the Medicare Cost Report
Cost Component Calculation Comparison
Midlevel Productivity Total Midlevel Visits / ProductivityMidlevel FTEs Standards
COMPARATIVE DATA BY MIDLEVEL TYPE: Health Center (1) MGMA (2)
Nurse Practitioners 2,535 2,351Physician Assistants 3,077 3,106Nurse Midwives 2,361 1,876Median of all Midlevels 2,596 2,351
(1) Data is from proprietary Health Center Database maintained by RSM McGladrey Inc.(2) Data is from Physician Compensation and Production Survey: 2004 Report Based on 2003 Data (MGMA: 2004).

13
DRIVERS OF PROVIDER COSTS -SALARY - MIDLEVEL PROVIDERS
Component Example Comparison
Midlevel Salary Total Midlevel Salaries/ Regional SalariesTotal Midlevel FTEs
COMPARATIVE DATA BY MIDLEVEL TYPE: Health Center(1) MGMA
Nurse Practitioners $69,692 $67,835Physician Assistants $70,706 $70,262Nurse Midwives $86,224 $71,748Median of all Midlevels $71,842 $70,262
(1) Data extracted from RSM proprietary National Ambulatory Care Database.
14
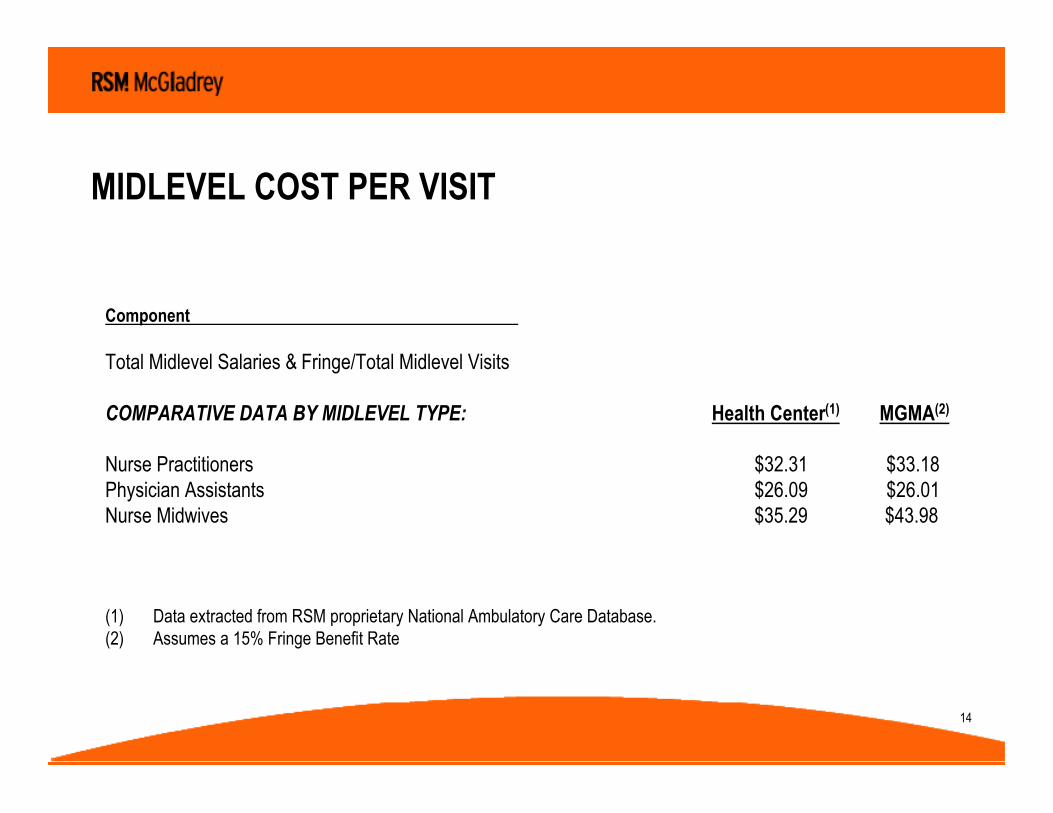
MIDLEVEL COST PER VISIT
Component
Total Midlevel Salaries & Fringe/Total Midlevel Visits
COMPARATIVE DATA BY MIDLEVEL TYPE: Health Center(1) MGMA(2)
Nurse Practitioners $32.31 $33.18Physician Assistants $26.09 $26.01Nurse Midwives $35.29 $43.98
(1) Data extracted from RSM proprietary National Ambulatory Care Database.(2) Assumes a 15% Fringe Benefit Rate
15
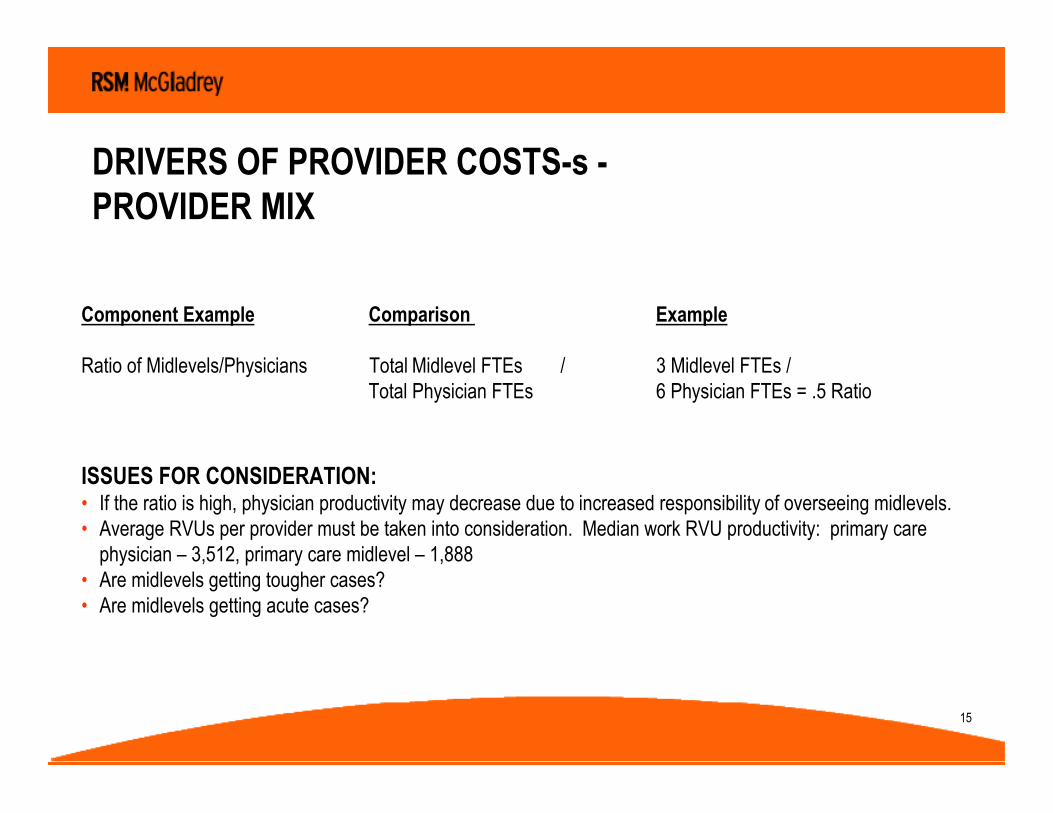
DRIVERS OF PROVIDER COSTS-s -PROVIDER MIX
Component Example Comparison Example
Ratio of Midlevels/Physicians Total Midlevel FTEs / 3 Midlevel FTEs / Total Physician FTEs 6 Physician FTEs = .5 Ratio
ISSUES FOR CONSIDERATION:• If the ratio is high, physician productivity may decrease due to increased responsibility of overseeing midlevels.• Average RVUs per provider must be taken into consideration. Median work RVU productivity: primary care
physician – 3,512, primary care midlevel – 1,888• Are midlevels getting tougher cases?• Are midlevels getting acute cases?

16
PROVIDER MIX
! The national health center median of midlevels to physicians is .55.
! Midlevel productivity generally exceeds minimum utilization threshold standards of 2,100 visits, whereas physician productivity generally falls short of 4,200 visits.
! Midlevel cost per visit is lower than physician cost per visit.
! This does not necessarily mean that health centers should strive to be above the national median. Service intensity and patient need should be considered, as well as overhead coverage considerations.

17
COMPONENTS OF COST PER VISIT –DIRECT MEDICAL SUPPORT COSTS
Drivers of Direct Medical Support Staff (DMS) Costs
! Productivity
! Ratio of Direct Medical Support Staff to Providers
! DMS Compensation
18
COMPONENTS OF COST PER VISIT -DIRECT MEDICAL SUPPORT COSTS
! Direct Medical Support Staff includes Medical Support Supervisors, Nurses, Medical Attendants, Phlebotomists, Medical Receptionists, Nurses Aides, and QA Coordinators/Medical Transcribers.
! Direct Medical Support Staff should be evaluated based on salary including fringe benefits and in relation to the number of physicians and midlevel providers.
! Health centers can develop a model of delivery where Direct Medical Support Staff can increase provider productivity and cost effectiveness (e.g., staff can perform basic tasks, such as checking weight and blood pressure, leaving physicians more time for complicated patient care).
19
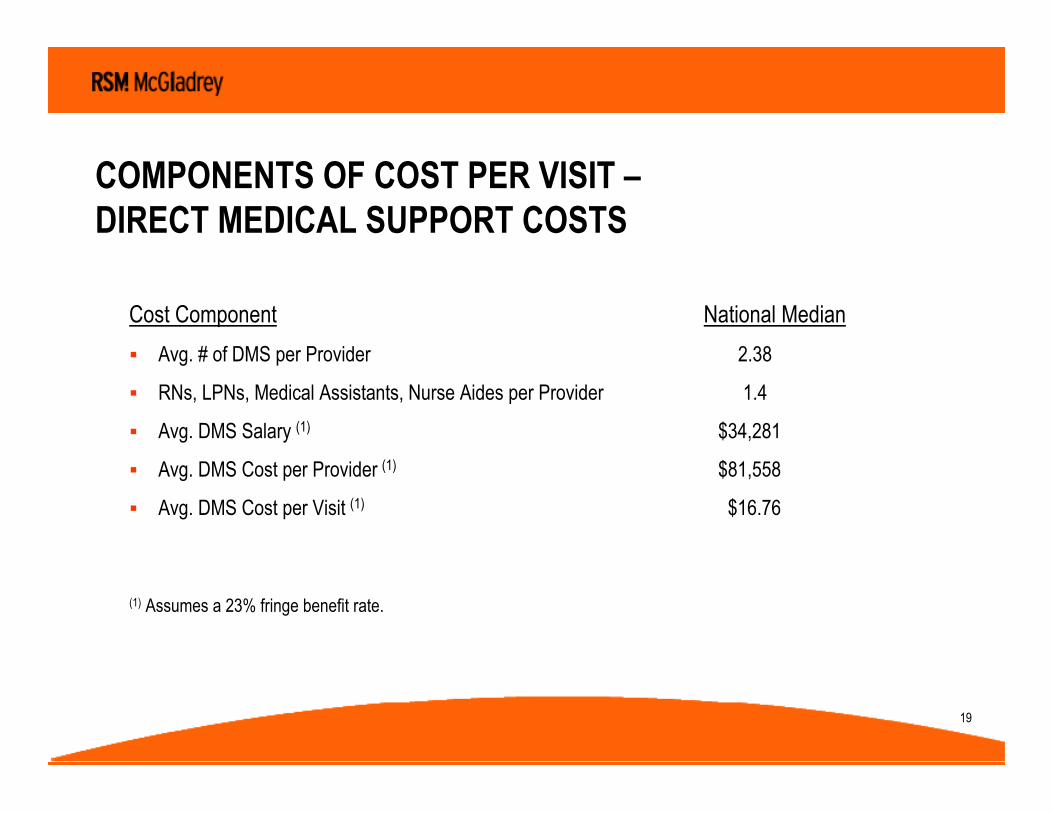
COMPONENTS OF COST PER VISIT –DIRECT MEDICAL SUPPORT COSTS
Cost Component National Median
! Avg. # of DMS per Provider 2.38
! RNs, LPNs, Medical Assistants, Nurse Aides per Provider 1.4
! Avg. DMS Salary (1) $34,281
! Avg. DMS Cost per Provider (1) $81,558
! Avg. DMS Cost per Visit (1) $16.76
(1) Assumes a 23% fringe benefit rate.

COMPONENTS OF COST PER VISIT –DIRECT MEDICAL SUPPORT COSTS
Service Category
National CHC Ratio to Medical
Providers
National CHC Cost per Medical
Visit
National CHC Average Salary
Per FTE Medical Support Supervisors 0.14 1.96$ 40,882$ Nurses - RN 0.48 6.33$ 38,247$ Nurses - LPN 0.53 4.04$ 25,783$ Medical Attendants 0.66 5.55$ 23,509$ Phlebotomists 0.14 1.46$ 24,640$ Managed Care Support (Clinical) 0.06 0.58$ 38,678$ Referral Coordinators 0.12 1.40$ 23,383$ Patient Triage Support 0.11 1.28$ 27,277$ Medical Receptionists 0.63 3.65$ 21,289$ Nurse Aide 0.31 2.54$ 19,030$ QA Coordinator / Medical Transcriber 0.09 0.90$ 27,884$ Direct Medical Support Overall 2.38 16.76$ 27,871$

21
DIRECT MEDICAL SUPPORT STAFF ANALYSIS
Ratio of DMS to Medical Providers
DMS Cost per Medical Visit
MD Cost per Visit
Health Center A 2.80 14.97$ 50.39$
Health Center B 2.45 23.45$ 39.87$
Health Center C 1.90 15.22$ 41.78$
Health Center D 2.43 7.99$ 45.94$
National Median 2.38 16.76$ 37.56$
Median of Total Direct Provider Support to All Providers – 1.84
22
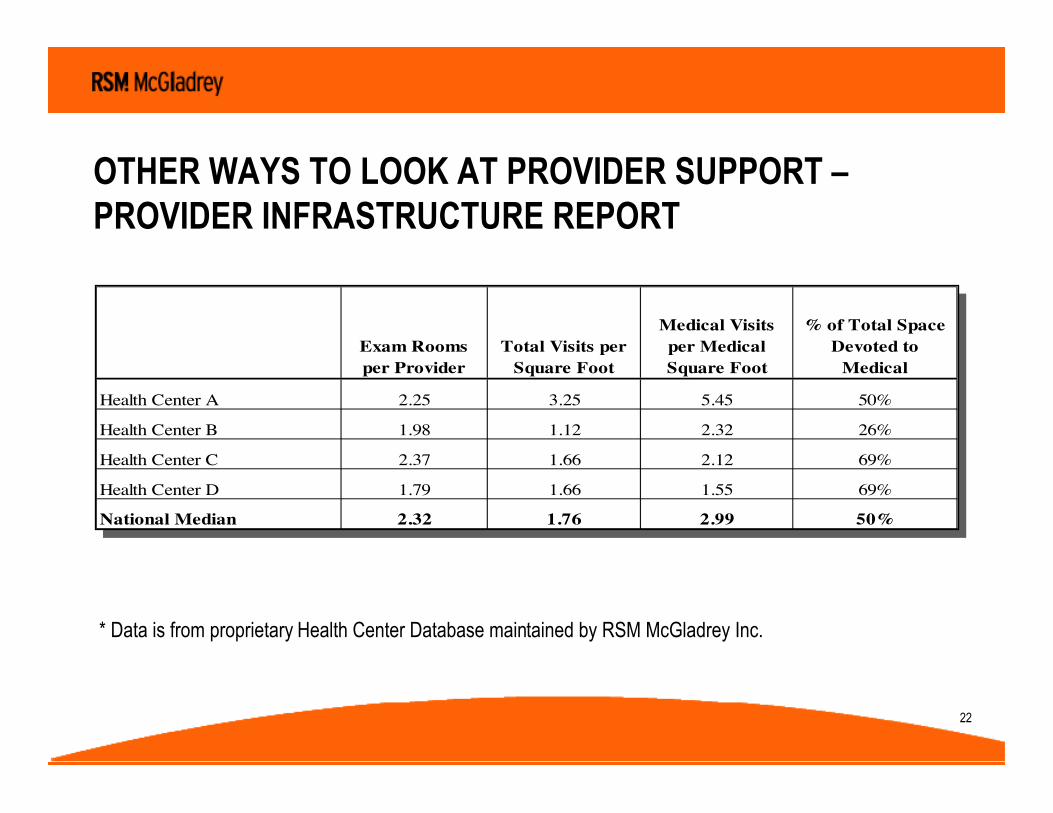
Exam Rooms per Provider
Total Visits per Square Foot
Medical Visits per Medical Square Foot
% of Total Space Devoted to
Medical
Health Center A 2.25 3.25 5.45 50%
Health Center B 1.98 1.12 2.32 26%
Health Center C 2.37 1.66 2.12 69%
Health Center D 1.79 1.66 1.55 69%
National Median 2.32 1.76 2.99 50%
OTHER WAYS TO LOOK AT PROVIDER SUPPORT –PROVIDER INFRASTRUCTURE REPORT
* Data is from proprietary Health Center Database maintained by RSM McGladrey Inc.
23
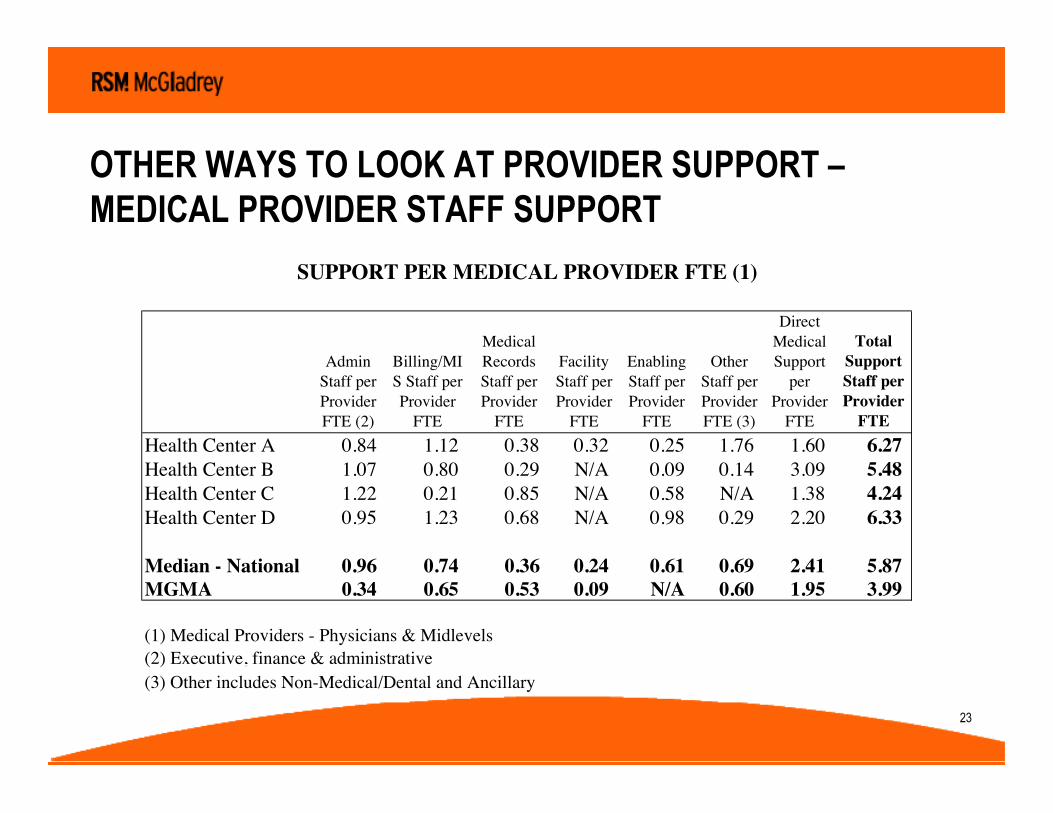
OTHER WAYS TO LOOK AT PROVIDER SUPPORT –MEDICAL PROVIDER STAFF SUPPORT
SUPPORT PER MEDICAL PROVIDER FTE (1)
Admin Staff per Provider FTE (2)
Billing/MIS Staff per Provider
FTE
Medical Records Staff per Provider
FTE
Facility Staff per Provider
FTE
Enabling Staff per Provider
FTE
Other Staff per Provider FTE (3)
Direct Medical Support
per Provider
FTE
Total Support Staff per Provider
FTEHealth Center A 0.84 1.12 0.38 0.32 0.25 1.76 1.60 6.27 Health Center B 1.07 0.80 0.29 N/A 0.09 0.14 3.09 5.48 Health Center C 1.22 0.21 0.85 N/A 0.58 N/A 1.38 4.24 Health Center D 0.95 1.23 0.68 N/A 0.98 0.29 2.20 6.33
Median - National 0.96 0.74 0.36 0.24 0.61 0.69 2.41 5.87 MGMA 0.34 0.65 0.53 0.09 N/A 0.60 1.95 3.99
(1) Medical Providers - Physicians & Midlevels(2) Executive, finance & administrative(3) Other includes Non-Medical/Dental and Ancillary

24
SUPPORT PER TOTAL PROVIDER FTE (1)
Admin Staff per Provider FTE (2)
Billing/MIS Staff per Provider
FTE
Medical Records Staff per Provider
FTE
Facility Staff per Provider
FTE
Enabling Staff per Provider
FTE
Other Staff per Provider FTE (3)
Direct Support
per Provider
FTE
Total Support Staff per Provider
FTEHealth Center A 0.84 1.12 0.38 0.32 0.25 1.76 1.60 6.27 Health Center B 0.81 0.60 0.80 N/A 0.07 0.11 2.34 4.15 Health Center C 0.87 0.15 0.21 N/A 0.42 N/A 1.08 3.13 Health Center D 0.64 0.83 1.23 N/A 0.66 0.19 2.10 4.87
Median - National 0.79 0.53 0.39 0.24 0.57 0.43 2.02 5.01
(1) Includes all providers(2) Executive, finance & administrative(3) Other includes Non-Medical/Dental and Ancillary
OTHER WAYS TO LOOK AT PROVIDER SUPPORT –TOTAL PROVIDER STAFF SUPPORT
25
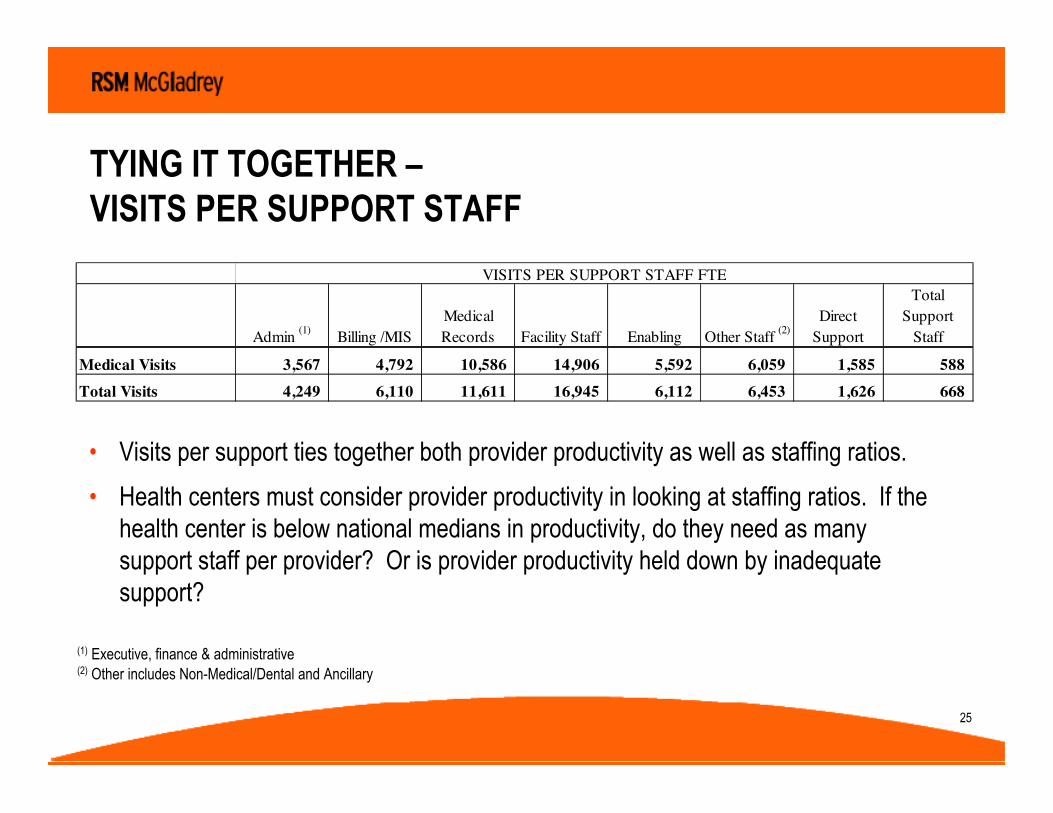
TYING IT TOGETHER –VISITS PER SUPPORT STAFF
(1) Executive, finance & administrative(2) Other includes Non-Medical/Dental and Ancillary
Admin (1) Billing /MISMedical Records Facility Staff Enabling Other Staff (2)
Direct Support
Total Support
Staff
Medical Visits 3,567 4,792 10,586 14,906 5,592 6,059 1,585 588 Total Visits 4,249 6,110 11,611 16,945 6,112 6,453 1,626 668
VISITS PER SUPPORT STAFF FTE
• Visits per support ties together both provider productivity as well as staffing ratios.
• Health centers must consider provider productivity in looking at staffing ratios. If the health center is below national medians in productivity, do they need as many support staff per provider? Or is provider productivity held down by inadequate support?

26
INTERNAL BENCHMARKING
Visits
Non- Provider Staff
Provider Staff
Visits per Non- Provider Staff
Provider Support
Support per Provider
Provider Productivity
Site A 11,000 18.0 2.5 611 5.0 2.0 4,400 Site B 12,000 15.0 4.2 800 7.0 1.7 2,857 Site C 15,000 19.0 5.0 789 11.0 2.2 3,000 Site D 18,000 25.0 4.8 720 11.0 2.3 3,750 Site E 9,000 14.0 2.0 643 6.0 3.0 4,500 Average 65,000 91.0 18.5 714 40.0 2.2 3,514

27
COMPONENTS OF COST PER VISIT –ENABLING SERVICES COSTS
Enabling Services are the supplementary services that enable theprovision of direct medical / clinical services, including transportation, interpretation, outreach, translation, case management, and health education.
Drivers of Enabling Services Costs:! Range of Services Provided! Intensity of Services Provided! Compensation of Staff Providing Enabling Services! Level of Reimbursement for Enabling Services
28
COMPONENTS OF COST PER VISIT –ENABLING SERVICES COSTS
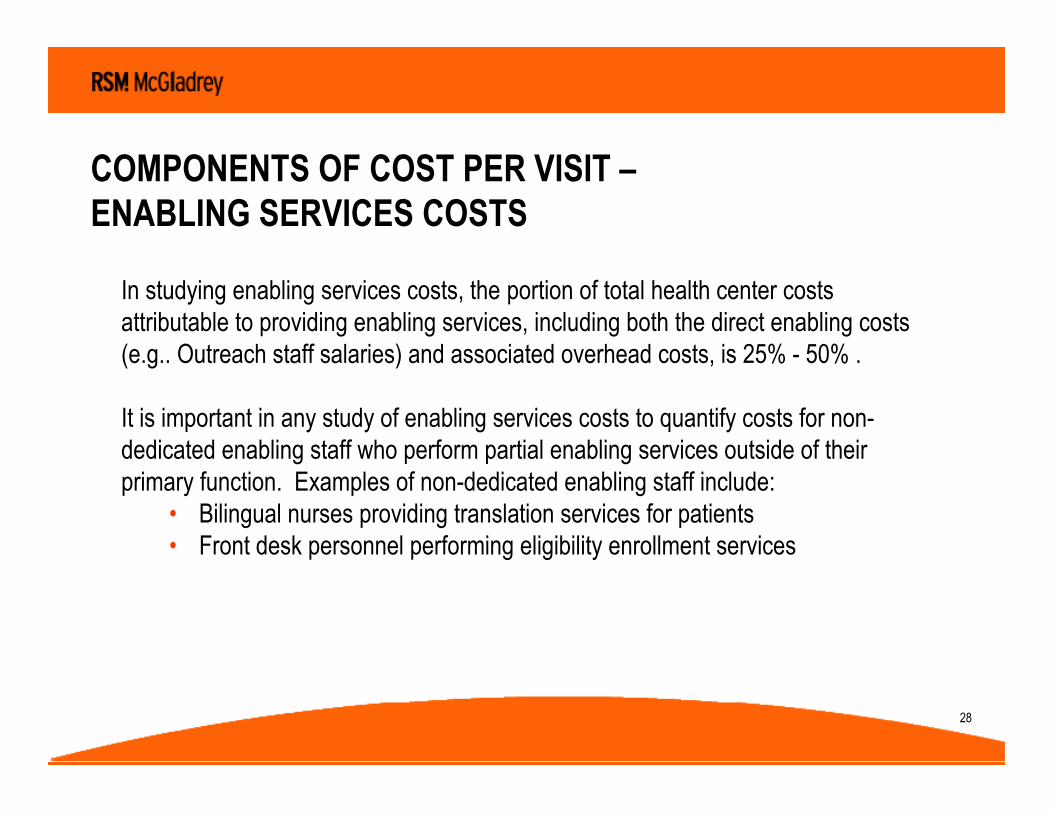
In studying enabling services costs, the portion of total health center costs attributable to providing enabling services, including both the direct enabling costs (e.g.. Outreach staff salaries) and associated overhead costs, is 25% - 50% .
It is important in any study of enabling services costs to quantify costs for non-dedicated enabling staff who perform partial enabling services outside of their primary function. Examples of non-dedicated enabling staff include:
• Bilingual nurses providing translation services for patients• Front desk personnel performing eligibility enrollment services
29
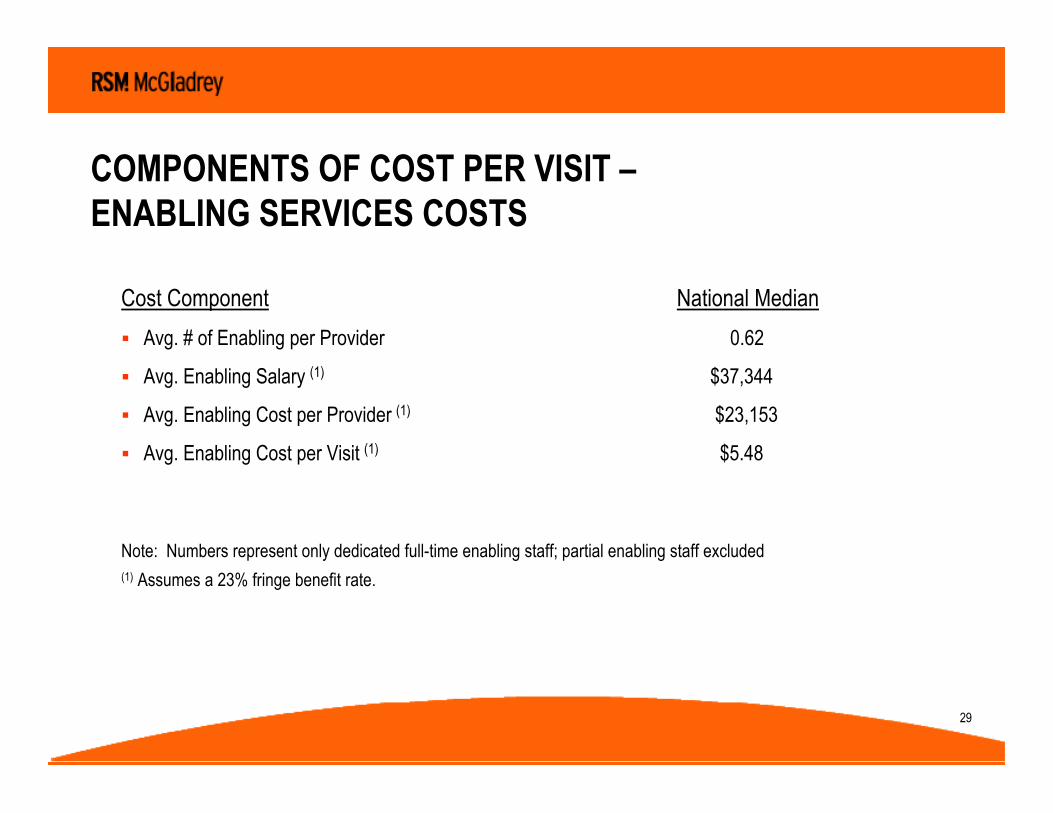
Cost Component National Median
! Avg. # of Enabling per Provider 0.62
! Avg. Enabling Salary (1) $37,344
! Avg. Enabling Cost per Provider (1) $23,153
! Avg. Enabling Cost per Visit (1) $5.48
Note: Numbers represent only dedicated full-time enabling staff; partial enabling staff excluded(1) Assumes a 23% fringe benefit rate.
COMPONENTS OF COST PER VISIT –ENABLING SERVICES COSTS
30
COMPONENTS OF COST PER VISIT – OVERHEAD COSTS
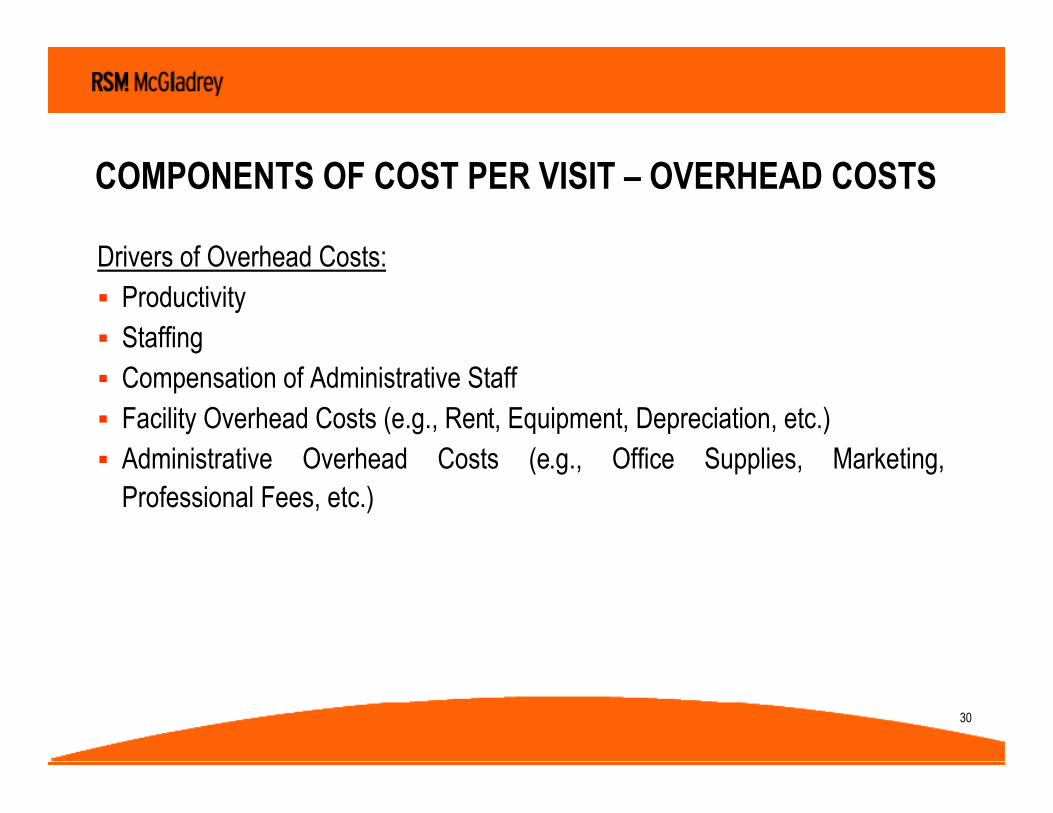
Drivers of Overhead Costs:! Productivity! Staffing! Compensation of Administrative Staff! Facility Overhead Costs (e.g., Rent, Equipment, Depreciation, etc.) ! Administrative Overhead Costs (e.g., Office Supplies, Marketing,
Professional Fees, etc.)
31
ANALYSIS OF SIGNIFICANT COST COMPONENTS –TOTAL OVERHEAD
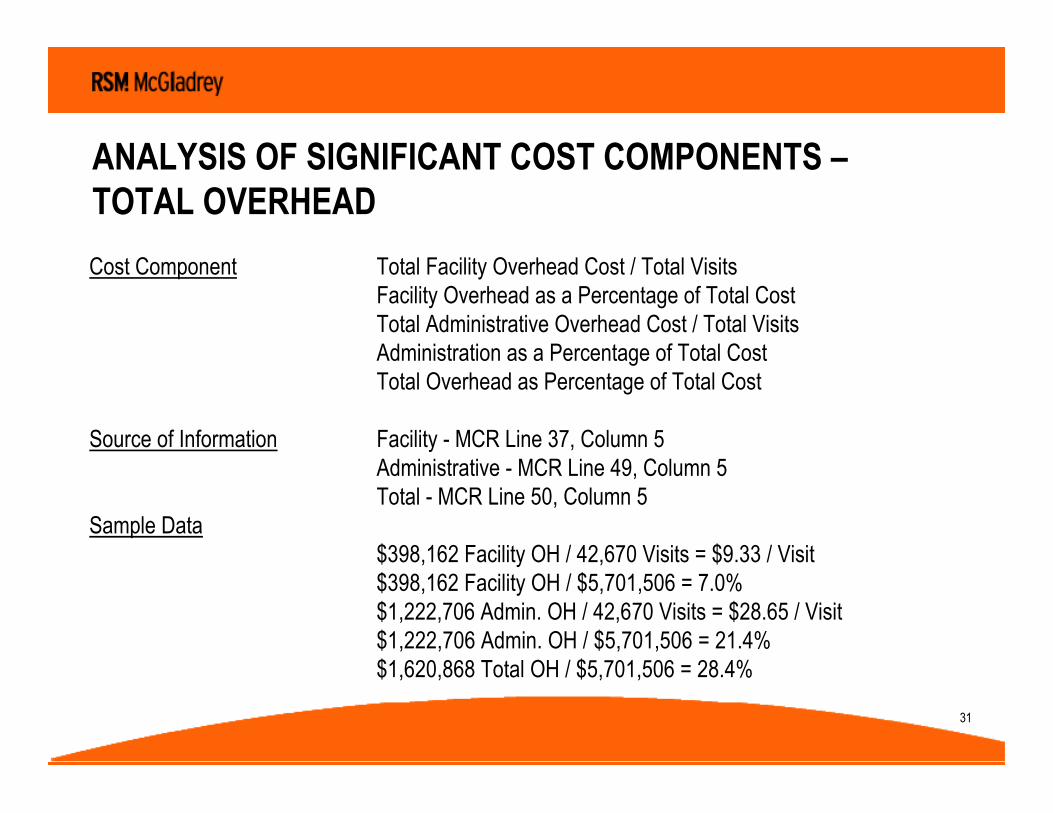
Cost Component Total Facility Overhead Cost / Total VisitsFacility Overhead as a Percentage of Total CostTotal Administrative Overhead Cost / Total VisitsAdministration as a Percentage of Total CostTotal Overhead as Percentage of Total Cost
Source of Information Facility - MCR Line 37, Column 5Administrative - MCR Line 49, Column 5Total - MCR Line 50, Column 5
Sample Data$398,162 Facility OH / 42,670 Visits = $9.33 / Visit$398,162 Facility OH / $5,701,506 = 7.0%$1,222,706 Admin. OH / 42,670 Visits = $28.65 / Visit$1,222,706 Admin. OH / $5,701,506 = 21.4%$1,620,868 Total OH / $5,701,506 = 28.4%

32
Overhead can be calculated using line 50, column 5 of the Medicare Cost Report.
Costs Small Health Center Medium Health Center Large Health Center National
Facility Overhead $ 259,993 $1,147,915 $1,563,565Admin. Overhead $1,018,078 $1,985,969 $2,501,555Total Overhead $1,278,071 $3,133,884 $4,065,120Total Cost $2,736,769 $7,482,627 $12,568,145
Facility OH % 9.5% 15.3% 12.4% $ 8.72 Admin. OH % 37.2% 26.5% 19.9% $30.21 Total OH % 46.7% 41.8% 32.3% $38.77
Visits 21,483 60,637 110,643
Total OH Cost / Visit $59.49 $51.68 $36.74
COMPONENTS OF COST PER VISIT -OVERHEAD COSTS
33
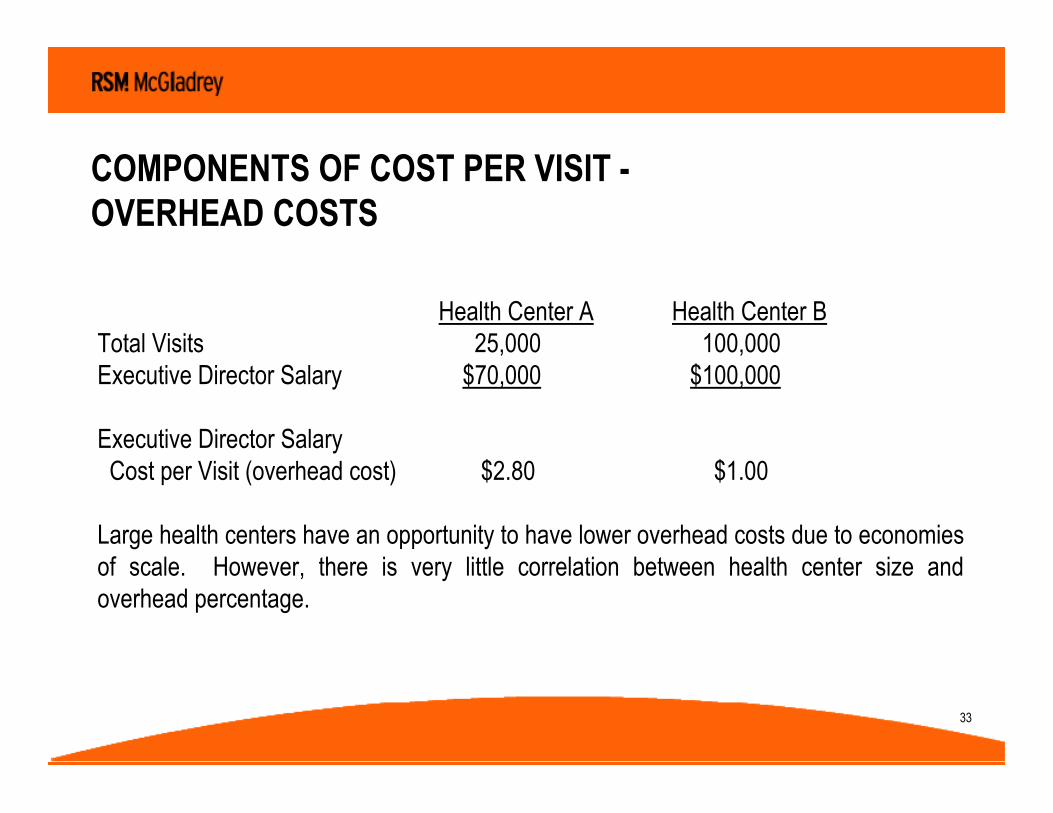
Health Center A Health Center BTotal Visits 25,000 100,000 Executive Director Salary $70,000 $100,000
Executive Director Salary Cost per Visit (overhead cost) $2.80 $1.00
Large health centers have an opportunity to have lower overhead costs due to economies of scale. However, there is very little correlation between health center size and overhead percentage.
COMPONENTS OF COST PER VISIT -OVERHEAD COSTS
34
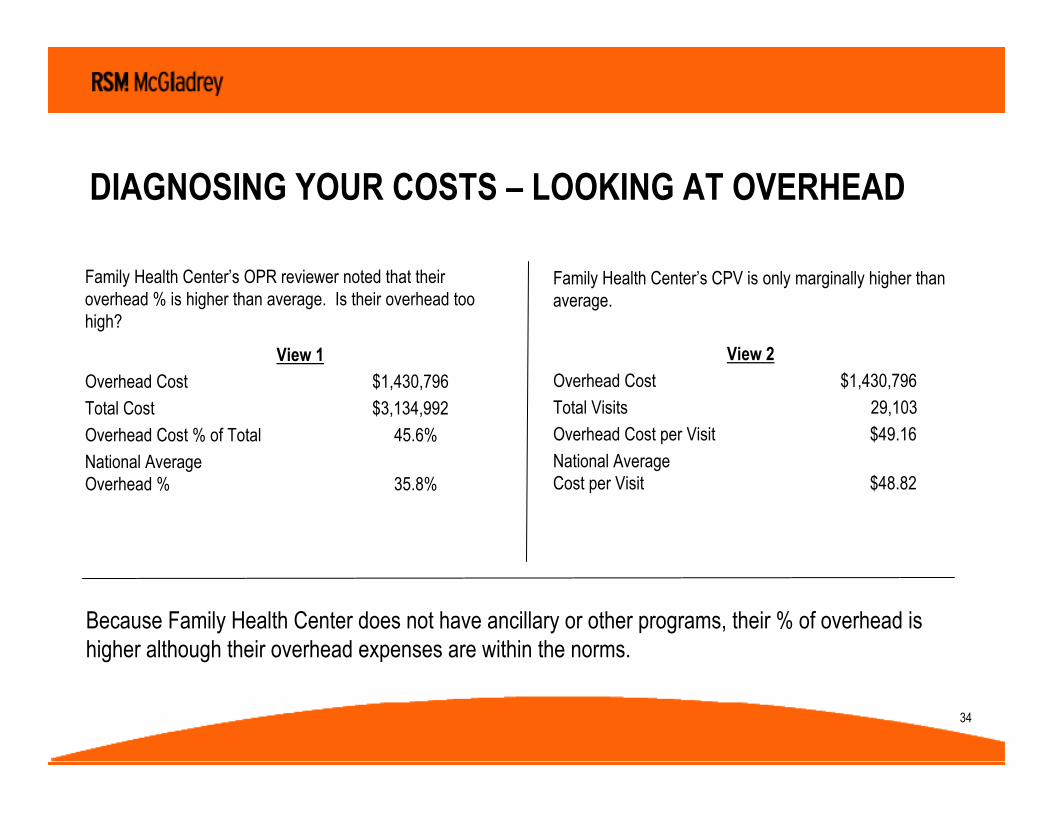
DIAGNOSING YOUR COSTS – LOOKING AT OVERHEAD
Family Health Center’s CPV is only marginally higher than average.
View 2
Overhead Cost $1,430,796
Total Visits 29,103
Overhead Cost per Visit $49.16
National Average Cost per Visit $48.82
Because Family Health Center does not have ancillary or other programs, their % of overhead is higher although their overhead expenses are within the norms.
Family Health Center’s OPR reviewer noted that their overhead % is higher than average. Is their overhead too high?
View 1
Overhead Cost $1,430,796
Total Cost $3,134,992
Overhead Cost % of Total 45.6%
National AverageOverhead % 35.8%


