Page 1
8/7/2019 Utilizing GIS data systems
http://slidepdf.com/reader/full/utilizing-gis-data-systems 1/22
GITA’S GIS CONFERENCE FOR OIL AND GAS
CALGARY
NOVEMBER 6‐7, 2008
Utilizing GIS data systems to enhance risk‐based integrity
management for upstream oil‐and‐gas pipeline systems
David Richardson, P.Eng.
QM4 Engineering Ltd.
Page 2
8/7/2019 Utilizing GIS data systems
http://slidepdf.com/reader/full/utilizing-gis-data-systems 2/22
GITA’s GIS for Oil and
Gas Conference CalgaryNovember 6-7, 2008
F O
C US ON US I NG D A T A T O
A F F E C T P E R F OR MA NC E
“Integrity Management”
Pipeline operators need create
integrity management plans that
minimize the overall costs of pipeline
operation and that address the
consequences
associated
with
a
leak:
• loss of life and property,
environmental damage,
business losses, reputation
“Integrity Management”
Pipeline operators need create
integrity management plans that
minimize the overall costs of pipeline
operation and that address the
consequences associated with a leak:
• loss of life and property,
environmental damage,
business losses, reputation
Learning Objectives:
∙ Get an introduction to what an Integrity Management plan
encompasses
∙ Understand the challenges associated with implementing an Integrity Management plan
∙ Learn techniques for integrating commercial software and
custom applications for developing a successful Integrity
Management plan
Learning Objectives:
∙ Get an introduction to what an Integrity Management plan
encompasses
∙
Understand
the
challenges
associated
with
implementing
an Integrity Management plan
∙ Learn techniques for integrating commercial software and
custom applications for developing a successful Integrity
Management plan
Page 3
8/7/2019 Utilizing GIS data systems
http://slidepdf.com/reader/full/utilizing-gis-data-systems 3/22
GITA’s GIS for Oil and
Gas Conference CalgaryNovember 6-7, 2008
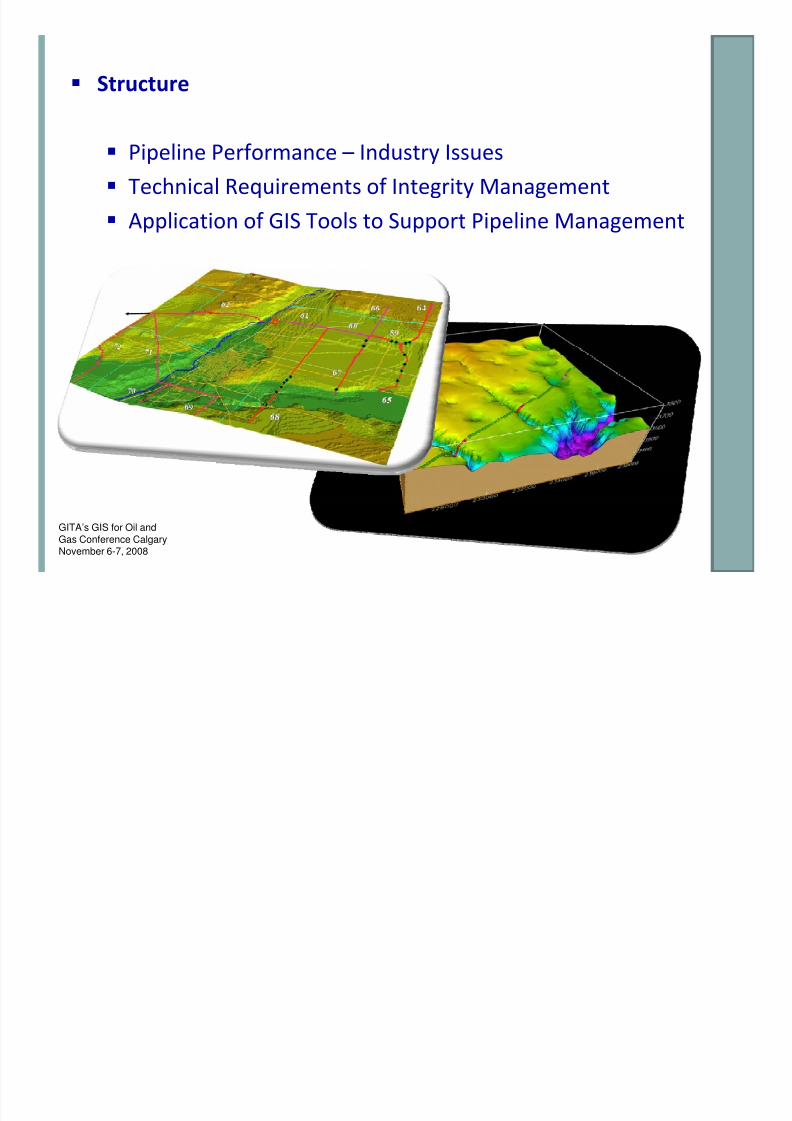
Structure
Pipeline Performance – Industry Issues
Technical Requirements of Integrity Management
Application of GIS Tools to Support Pipeline Management
Page 4
8/7/2019 Utilizing GIS data systems
http://slidepdf.com/reader/full/utilizing-gis-data-systems 4/22
GITA’s GIS for Oil and
Gas Conference CalgaryNovember 6-7, 2008
INDUSTRY-DRIVEN DEVELOPMENTOil and Gas Pipeline Failures by Year --
Typical Industry Sector Performance
External Corros io n
15 %
51%
Internal Corros io n
AEUB, Canada 1998
Third Party Damage
WeldConstruction Damage
Overpressure
PipeJoint
Other
10%
5%
5%3%
3%
3%7%
Upstream Sector
Internal corrosion is most significant failure mode for gathering systems transporting
corrosive fluids & failure frequency is increasing.
Pipeline Performance / Industry Issues
ERCB Data
Page 5
8/7/2019 Utilizing GIS data systems
http://slidepdf.com/reader/full/utilizing-gis-data-systems 5/22
GITA’s GIS for Oil and
Gas Conference CalgaryNovember 6-7, 2008
Oil and Gas Pipeline Failures by Year --Typical Industry Sector Performance
Internal Corrosion Failures
Internal corrosion failure frequencies are increasing in spite of expenditures associated withmitigation, monitoring, & inspection. Root cause is lack of technical alignment of mitigation
and inability of monitoring program to identify changes to the hazard state.
Pipeline Performance / Industry Issues
Page 6
8/7/2019 Utilizing GIS data systems
http://slidepdf.com/reader/full/utilizing-gis-data-systems 6/22
GITA’s GIS for Oil and
Gas Conference CalgaryNovember 6-7, 2008
F O
C US ON P I P E L I NE A S S E T
D A T A
Quality Pipeline Integrity Management Program – “A Process, not an Event” Quality Pipeline Integrity Management
Program
–
“A Process, not an Event”
Industry Standard Practice (reactive)
Looking Ahead with GIS Solution
(predictive)
Develop Processes &Activities in Response toChange
Share Informationwith management
Comprehensive, RigorousGIS-Based Applications
Make Decisionsand Develop Planswith Better QualityInformation
Understand
Risks, On –board TechnicalKnowledge
UtilizeCorporateInformation
Page 7
8/7/2019 Utilizing GIS data systems
http://slidepdf.com/reader/full/utilizing-gis-data-systems 7/22
GITA’s GIS for Oil and
Gas Conference CalgaryNovember 6-7, 2008
D E L I V E R I NG V A
L UE I NT O B US I NE S S MO
D E L WI T H G
I S
D A T A
GIS‐Based INVENTORY DATA – Wells, Pipelines & Pipeline EquipmentGIS‐Based INVENTORY DATA – Wells, Pipelines & Pipeline Equipment
•POMM Manual
•Operations training
•Formal PIM structure
•Monitoring programs
•Probes / coupons
•Chemical programs
•Pigging programs
•Failure analysis
•Suspension programs
•Re‐commissioning
•Integrity testing
•Inspections
•POMM Manual
•Operations training
•Formal PIM structure
•Monitoring programs
•Probes / coupons•Chemical programs
•Pigging programs
•Failure analysis
•Suspension programs
•Re‐commissioning
•Integrity testing
•Inspections
•New pipelines
•A & D activity
•Monthly PVR volumes
•Public data integration
•Flow apportionment
•Risk assessments
•Data quality / validation
•Network connectivity
•Data integration to Map
•Network schematics
•Data loading services
•New pipelines
•A & D activity
•Monthly PVR volumes
•Public data integration
•Flow apportionment•Risk assessments
•Data quality / validation
•Network connectivity
•Data integration to Map
•Network schematics
•Data loading services
•EUB audit prep
•EUB correspondence
•NCR catalogue
•NCR corrective actions
•Support to Self ‐Dec’s
•Management reporting
•EPZ Calculations
•Lease compliance
•D‐13 suspended well
surveillance schedules
•EUB audit prep
•EUB correspondence
•NCR catalogue
•NCR corrective actions
•Support to Self ‐Dec’s•Management reporting
•EPZ Calculations
•Lease compliance
•D‐13 suspended well
surveillance schedules
•Prioritization of projects
•Data validation
•Construct models
•Baseline validation
•Sensitivity studies
•Compression / looping
•Liquid management
•Drilling optimization
•Prioritization of projects
•Data validation
•Construct models
•Baseline validation
•Sensitivity studies•Compression / looping
•Liquid management
•Drilling optimization
Field Validated by Operations TeamsField Validated by Operations Teams
Quality Integrity
Program
Implementation
Pipeline &
Equipment
Inventory Data
Management
Support to
Regulatory Affairs
Advanced
Network
Modelling to
Optimize Delivery
Compliance / Reliability / OPEX
Compliance / Reliability / OPEX Compliance /
OPEXCompliance /
OPEX ComplianceCompliance Production
VolumesProduction
VolumesV
A
L
U
E
Value of GIS Data Systems to Corporate Business Model
Page 8
8/7/2019 Utilizing GIS data systems
http://slidepdf.com/reader/full/utilizing-gis-data-systems 8/22
Page 9
8/7/2019 Utilizing GIS data systems
http://slidepdf.com/reader/full/utilizing-gis-data-systems 9/22
Page 10
8/7/2019 Utilizing GIS data systems
http://slidepdf.com/reader/full/utilizing-gis-data-systems 10/22
GITA’s GIS for Oil and
Gas Conference CalgaryNovember 6-7, 2008
Application of corrosion growth rate models as determination of fluidaggressiveness & remaining life of the pipeline structure
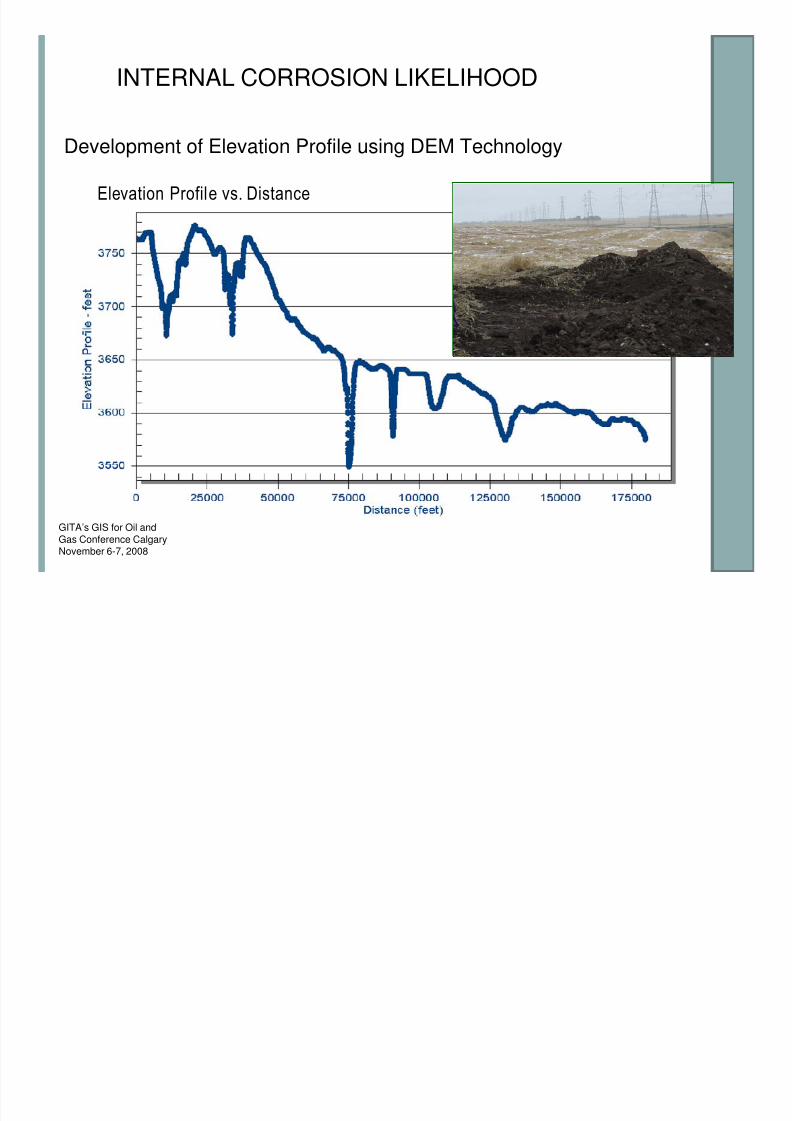
INTERNAL CORROSION LIKELIHOOD
Page 11
8/7/2019 Utilizing GIS data systems
http://slidepdf.com/reader/full/utilizing-gis-data-systems 11/22
GITA’s GIS for Oil and
Gas Conference CalgaryNovember 6-7, 2008
stratified water film
oil
Consideration of Detrimental Flow Conditions
-Critical inclination angle not exceeded-Stratified water film
-Good film movement-Relatively easy to mitigate
INTERNAL CORROSION LIKELIHOOD
Page 12
8/7/2019 Utilizing GIS data systems
http://slidepdf.com/reader/full/utilizing-gis-data-systems 12/22
GITA’s GIS for Oil and
Gas Conference CalgaryNovember 6-7, 2008
Consideration of Detrimental Flow Conditions
-Critical inclination angle exceeded
-Onset of high liquid fraction to 50%-Higher likelihood of reduced localized pH
-Severe stagnant pools allow bacteria / solids to settle
-Potential for onset of steady-state slugging
-increase in water film shear stress
-More difficult to mitigate
-Conditions prevail at locations of pipeline failuresoil
stationary water film
αCritical inclination exceeded
INTERNAL CORROSION LIKELIHOOD
Page 13
8/7/2019 Utilizing GIS data systems
http://slidepdf.com/reader/full/utilizing-gis-data-systems 13/22
GITA’s GIS for Oil and
Gas Conference CalgaryNovember 6-7, 2008
Development of Elevation Profile using DEM Technology
180,039 feet (34.1 miles)
Elevation Profile vs. Distance
INTERNAL CORROSION LIKELIHOOD
Page 14
8/7/2019 Utilizing GIS data systems
http://slidepdf.com/reader/full/utilizing-gis-data-systems 14/22
GITA’s GIS for Oil and
Gas Conference CalgaryNovember 6-7, 2008
QM
4 R I S K C A L C UL A T OR –C ONS E QUE N
C E MOD E L
FAILURE CONSEQUENCE MODEL
Page 15
8/7/2019 Utilizing GIS data systems
http://slidepdf.com/reader/full/utilizing-gis-data-systems 15/22
KEY OBJECTIVE OF GIS DATA SYSTEMS ‐‐
DEPLOYING THE VALUE TO THE DESKTOP OF PIPELINE INTEGRITY MANAGERS
Page 16
8/7/2019 Utilizing GIS data systems
http://slidepdf.com/reader/full/utilizing-gis-data-systems 16/22
GITA’s GIS for Oil and
Gas Conference CalgaryNovember 6-7, 2008
G I S D E P L OY M
E NT & US E R
E X P E R I E NC E
OP T I ONS
File-Based DataMS-Excel Inventory Spreadsheets
Legacy Inventory Databases
Risk Assessment WorksheetsNetwork Connectivity Schematics
Corporate, ARCMap Desktop
ESRI, GIS Specialists
(Power-Users / Data Edit)
Corporate
Web-ODITweb -Server
Corporate Data
-PVR / FieldView- Master Well List
- IHS Well Production Data
GIS Server
Administration
CORPORATE GIS & DATASERVER NETWORK
LANLAN
Corporate – IE Web Browser
Pipeline Specialists
Calgary / Field, OperationsPipeline Management Focus
Corporate – Intranet User
Business & Technical Service Teams
Calgary / Field, OperationsOperations / Regulatory Focus
GIS Data Processing & Services
Data Conditioning & Assessment
Monthly Update ProcessAdhoc on-Demand Data Services
LANLAN
CITRIXCITRIX
Optional
GIS Expert Technical & Business ServicesPipeline & Operations Specialists
Information Link
on Corporate
Intranet
Page
Page 17
8/7/2019 Utilizing GIS data systems
http://slidepdf.com/reader/full/utilizing-gis-data-systems 17/22
GITA’s GIS for Oil and
Gas Conference CalgaryNovember 6-7, 2008
Network Connectivity
Production Volume Apportionment
Network Connection Schematic Generator
• Wells-to-pipes
• Pipes-to-pipes
• Pipes-to-facilities
• Facilities-to-pipes
• Consideration of well, and
pipeline attributes
• Consideration of proximity to
connection targets
• Assignment of connectionconfidence scores
• Presentation as distinct
series of object classes to
support ARCMap
presentation of connectivity in
map layers
• Enables GUI to support
editing of connections based
upon f ield red-lining process
• Oil, gas & water
apportionment throughout
complete network
• Consideration of p ipeline &
facility attributes
(i.e. upstream water
separation, dehydration,
compression, group vs. test,
pipeline loops)
GDM Pipeline Data Source
ARCMap Application & Toolbar ARCMap Application & Toolbar
ARCMap Application & Toolbar
• Creation o f logical network
schematics based upon
network connectivity results
• Auto-creator utility publishes
an atlas of PDF versions of
schematics based upon
extent of network
connectivity
Pipeline Risk Assessment & Mitigation Response
ARCMap Application & Toolbar
• Internal & external corrosion
likelihood
• Environmental & economic
consequence
• Recommendations for risk
mitigation activities
ERCB Pipeline & Well Compliance
ARCMap Application & Toolbar
• D-071 EPZ Buff er
Calculations for sour wells
and pipelines to support
dynamic layer presentation
in ARCMap
• D-066 pipeline non-
compliance events queries• D-013 suspended well
surveillance query
Core Data Work Step 1.
Core Data Work Step 2.
Spatial Attributes (PL-100) Elevation (DEM)
Public Well Production
Data Source
GIS Data Services
ARCGIS-Based Data Conditioning with Customized ARCMap Tools
Page 18
8/7/2019 Utilizing GIS data systems
http://slidepdf.com/reader/full/utilizing-gis-data-systems 18/22
GITA’s GIS for Oil and
Gas Conference CalgaryNovember 6-7, 2008
E N
H A NC E D D A
T A D I S P L A Y
A ND A S S E S S
ME NT
Connect all Matching Pipeline – Ends to Single Pipeline - Start
Facility 10
10
10
8
10
On‐Board Network Connectivity
Algorithm
•Connections use proximity & attribute
data for wells, pipelines & facilities
•Confidence
scores
applied
to
all
connections as measure of quality
•ARCMap application enables editing of
connections based upon field‐proof red‐
lining
Connect all Matching Pipeline – Ends to each Pipeline - Start
Facility
ARCMap Pipeline Network Connectivity & Flow Apportionment Tools
Page 19
8/7/2019 Utilizing GIS data systems
http://slidepdf.com/reader/full/utilizing-gis-data-systems 19/22
GITA’s GIS for Oil and
Gas Conference CalgaryNovember 6-7, 2008
G I S
D A T A A S S E
S S ME NT T OOL –NE T WO
R K
C O
NNE C T I V I T Y
ARCMap Pipeline Network Connectivity & Flow Apportionment Tools
Page 20
8/7/2019 Utilizing GIS data systems
http://slidepdf.com/reader/full/utilizing-gis-data-systems 20/22
GITA’s GIS for Oil and
Gas Conference CalgaryNovember 6-7, 2008
G I S
D A T A D I S P L A Y –NE T W
OR K S C H E M
A T I C T R E E
ARCMap Pipeline Network Smart-Tree Connection Schematic Tool
Page 21
8/7/2019 Utilizing GIS data systems
http://slidepdf.com/reader/full/utilizing-gis-data-systems 21/22
GITA’s GIS for Oil and
Gas Conference CalgaryNovember 6-7, 2008
G I S
D A T A D I S P L A Y ‐‐
MA P
Map Print / Plot / e‐mail Interface
•Custom Map Creation•Custom Layer Control •Automatic Legend Generation•Custom Title Block •Map Annotation Feature•Publication
to
PDF,
with
Layer
Control
ARCMap Pipeline Map Publication Atlas
Pipeline Management Information
Layers
•Risk Assessment Results
•Flow
Apportionment
Results•Pipeline Crossings
•D‐071 EPZ Buffers
•Hydraulic Bottlenecks
•Pipeline Inspection Data
•Pipeline
Failure
Data•Interaction buffers with receptors
Page 22
8/7/2019 Utilizing GIS data systems
http://slidepdf.com/reader/full/utilizing-gis-data-systems 22/22
GITA’s GIS for Oil and
Gas Conference CalgaryNovember 6-7, 2008
G I S
D A T A R E P O
R T S
Pipeline Assessment & Integrity Management Reports