58
UTILIZING OUR STRENGTHS, AIMING AT FURTHER GROWTH Year ended March 31, 2017 ANNUAL REPORT 2017
DA
IDO
STE
EL C
O., LT
D. U
TILIZIN
G O
UR
STR
EN
GTH
S, A
IMIN
G AT FU
RTH
ER
GR
OW
TH A
NN
UA
L R
EP
OR
T 2
017
DA
IDO
STE
EL C
O., LT
D. U
TILIZIN
G O
UR
STR
EN
GTH
S, A
IMIN
G AT FU
RTH
ER
GR
OW
TH A
NN
UA
L R
EP
OR
T 2
017
UTILIZING OUR STRENGTHS, AIMING AT FURTHER GROWTH
Year ended March 31, 2017
ANNUAL REPORT 2017
DAIDO STEEL CO., LTD. ranks among the world’s largest manufacturers of specialty steel. With a history
dating back to 1916, the Company has accumulated extensive skills in combining steel scrap with other
materials to achieve the strength, workability and other characteristics to match exacting requirements.
Along with the manufacture of value-added steel, the Company offers many services that leverage its
technological resources. Most services target high-end market sectors that demand the highest levels of
quality and specialization. Daido Steel is one of the leading players worldwide in the manufacture of critical
steel components where nothing less than absolute reliability is acceptable. These components include
automobile transmissions and engine parts as well as components used in ships, aircraft and electric
generators. Daido Steel shares are traded on the First Section of the Tokyo Stock Exchange under the
securities code 5471.
FORWARD-LOOKING STATEMENTSThis annual report contains forward-looking statements
concerning DAIDO STEEL CO., LTD.’s and its Group
companies’ current plans, projections, strategies and
performance. These forward-looking statements are not
historical facts. Rather, they represent the assumptions
and beliefs of Daido Steel’s management based on infor-
mation currently available.
They should therefore not be relied upon as the sole
basis for evaluating the Company. Daido Steel also
wishes to caution readers that actual results may differ
materially from expectations, and that forward-looking
statements are subject to a number of risks and
uncertainties.
01 FINANCIAL HIGHLIGHTS
02 MESSAGE FROM MANAGEMENT
04 AT A GLANCE
06 REVIEW OF OPERATIONS
10 RESEARCH AND DEVELOPMENT
12 CSR AND THE ENVIRONMENT
13 CORPORATE GOVERNANCE
14 OFFICERS
15 FINANCIAL SECTION
54 DAIDO NETWORK
55 CORPORATE DATA
THE COMPANY
CONTENTS

DAIDO STEEL CO., LTD. AND CONSOLIDATED SUBSIDIARIESYEARS ENDED MARCH 31
201720162015201420130
30,000
20,000
10,000
201720162015201420130
20,000
15,000
10,000
5,000
OPERATING INCOMEYears ended March 31
NET INCOME ATTRIBUTABLE TO OWNERS OF THE PARENTYears ended March 31
Millions of YenThousands of U.S. Dollars
2017 2016 2015 2014 2013 2017
For the Year:
Net Sales 445,123 460,578 483,633 457,731 440,428 3,974,313
Operating Income 25,514 24,432 20,409 18,977 15,426 227,804
Net Income Attributable to Owners of the Parent 16,386 6,746 10,886 12,616 10,983 146,304
R&D Expenses 6,206 5,766 5,301 5,160 4,560 55,411
Capital Expenditures 28,940 23,205 30,296 44,404 25,400 258,393
Depreciation and Amortization 23,276 22,454 22,437 20,052 19,229 207,821
At Year-end:
Total Assets 574,169 535,676 588,590 557,522 511,159 5,126,509
Total Equity 290,501 268,346 292,406 232,152 211,921 2,593,759
Interest-Bearing Debt 142,599 136,114 146,208 143,085 146,999 1,273,205
Number of Employees (Consolidated) 11,498 11,040 10,855 10,709 10,447 –
Number of Consolidated Subsidiaries 34 34 34 33 32 –
Per Share of Common Stock (Yen and U.S. Dollars):
Basic Net Income 38.59 15.62 25.10 29.09 25.32 0.34
Cash Dividends Applicable to the Year 10.0 7.50 6.50 5.00 4.50 0.09
ROA (%) 4.8 4.5 3.8 3.8 3.2 –
ROE (%) 6.7 2.8 4.5 5.7 5.4 –
Note: The translation of Japanese yen amounts into U.S. dollar amounts is included solely for the convenience of readers outside Japan and has been made at the rate of ¥112 to $1, the approximate rate of exchange at March 31, 2017.
500,000
400,000
300,000
200,000
100,000
201720162015201420130
NET SALES Years ended March 31
(millions of yen) (millions of yen) (millions of yen)
01
FIN
AN
CIA
L H
IGH
LIG
HT
S
FINANCIAL HIGHLIGHTS

Overview of Results for Fiscal 2016
In fiscal 2016, the Japanese economy underwent a moder-
ate recovery with signs of a rebound in industrial produc-
tion in the corporate sector and gradual improvement in
consumer spending. In Europe and the U.S., economic
growth remained on a moderate trend with employment
expanding, while major events included the U.K.’s decision
to exit the European Union and the election of President
Trump in the U.S. In China, economic growth was relatively
stable, supported by government measures to stimulate
the economy, which boosted sales of automobiles.
Under these economic circumstances, production
increased in the automobile industry in the second half,
owing to brisk sales in North America and China. Scrap
steel prices were volatile in the spring, influenced by Chi-
nese steel billet prices, achieved some stability, and then
increased from autumn amid a rise in coking coal prices.
As a result, the Daido Steel Group’s net sales
decreased ¥15,454 million year on year to ¥445,123 mil-
lion, owing to a decline in selling prices, which are linked to
raw material prices. Ordinary income increased ¥1,265
million to ¥26,373 million due to higher sales volume. Net
income attributable to owners of the parent grew ¥9,640
million to ¥16,386 million, reflecting the absence of
provisions for environmental remediation and extraordinary
losses for discontinuing software development posted in
the previous fiscal year.
Outlook for Fiscal 2017
The global economy is likely to keep expanding at a mod-
erate pace amid robust employment conditions in
advanced countries. The Chinese economy should see
relatively stable growth thanks to government stimulus
measures, although there are latent risks related to real
estate prices and excessive debt. Based on this outlook,
our core customers in the automobile industry should
remain on solid footing. However, there are uncertainties as
well, including the new administration in the U.S., the issue
of the U.K.’s exit from the European Union, political risk in
Europe and growing geopolitical risk. We will continue to
monitor risks, such as the risk of weaker demand due to
foreign exchange fluctuations and the risk of price fluctua-
tions in raw materials and fuel.
In this business environment, we are constantly moni-
toring market trends and customers, and are prepared to
respond to any changes. The Group will steadily implement
measures for expanding overseas sales, which is a target
of our medium-term business plan. The Group is working
02
MESSAGE FROM MANAGEMENTM
ES
SA
GE
FR
OM
MA
NA
GE
ME
NT

diligently to strengthen quality, cost and delivery (QCD)
competitiveness, while focusing on growth fields and
co-creation with customers.
Given these conditions, our segment forecasts for the
coming fiscal year are as follows.
SPECIALTY STEEL
We expect sales volume of structural steel in 2017 will continue to be
at the same level as in the second half of fiscal 2016, based on the
outlook for brisk global demand from automakers. In tool steel, we
anticipate a gradual recovery in volume after the end to inventory
adjustments. While we expect an increase in volume, we forecast cost
increases in energy due to higher crude oil prices. Under these circum-
stances, we will strive to reduce costs further and focus efforts on
improving the product mix by leveraging the secondary melting facility
newly constructed at the Chita Plant during fiscal 2016.
HIGH PERFORMANCE MATERIALS AND MAGNETIC
MATERIALS
We expect sales volume of stainless steel and high-alloy steel will
continue to be at the same level as the second half of fiscal 2016,
based on the assumption that demand remains strong for the automo-
bile and semiconductor industries. In powder metal products, we are
developing new products for future growth while fulfilling firm automo-
bile-related demand. In magnetic products, we are concentrating on
the increasing use of electronics in automobiles and electrical
applications.
PARTS FOR AUTOMOBILE AND INDUSTRIAL EQUIPMENT
In free forgings, we are keeping up with ongoing brisk demand for civil
aircraft, while waiting for demand recovery in the oil and gas sector. In
die forgings, we will set up Daido Steel (Thailand) Co., Ltd. as a pro-
duction base for the Southeast Asia region. In turbo-related products,
we will respond to increasing production of stainless steel turbine
housing, considering the likelihood of continued growth in demand
from an increasing ratio of gasoline engines with turbos installed. In
engine valves, we are updating our supply structure for North America,
having launched operations at a new plant in Mexico.
ENGINEERING
The Daido Steel Group aims to expand sales of Premium STC® (Short
Time Cycle), which is its mainstay STC® annealing furnace with a new
combustion system installed, as well as increase sales of vacuum
carburizing furnaces to auto parts makers, and of vacuum sintering
furnaces to magnet product makers.
TRADING AND SERVICE
In the trading and service segment, demand should be the same level
as in 2016.
Based on the above, for fiscal 2017, the Daido Steel
Group forecasts consolidated net sales of ¥480.0 billion,
operating income of ¥30.0 billion, ordinary income of ¥31.0
billion, and net income attributable to owners of the parent
of ¥20.0 billion.
Medium- to Long-Term Management Strategy
During the current medium-term business plan that contin-
ues through fiscal 2017, advanced countries have contin-
ued to grow their economies at a moderate pace amid
robust employment conditions. Growth in the Chinese
economy has decelerated more than anticipated, and the
pace of expansion in emerging markets has slowed down
somewhat. The automobile industry continues to grow
strongly. Resource- and energy-related demand should
expand over the long run, but recently it has declined due
to a fall in crude oil prices.
Meanwhile, customers may also demand higher perfor-
mance from specialty steel. For example, customers may
demand unprecedented performance in terms of the heat
resistance and thinness of specialty steel in order to maxi-
mize internal combustion efficiency in internal combustion
engines used in automobiles and the like amid tightening
carbon dioxide regulations to combat global warming. The
Daido Steel Group intends to work more closely with its
customers to solve these challenging issues.
The Daido Steel Group celebrated its 100th anniversary
in August 2016 by declaring a new Group management
philosophy, “pursuing the potential of materials to support
our future.” With the materials and materials-related tech-
nologies of the Daido Steel Group, we will create new value
by bringing out the hidden potential of materials with the
ultimate objective of contributing to the development of
society while discovering the unknown needs of people
and society.
June 2017
Takeshi Ishiguro
President
03
ME
SS
AG
E F
RO
M M
AN
AG
EM
EN
T

0
300,000
200,000
100,000
2016 2017
0
8,000
4,000
2,000
6,000
2016 2017
0
300,000
200,000
100,000
2016 2017
0
20,000
15,000
10,000
5,000
2016 2017
0
150,000
100,000
50,000
2016 2017
–1,000
1,500
1,000
500
–500
0
2016 2017
PARTS FOR AUTOMOBILE AND INDUSTRIAL EQUIPMENT
HIGH PERFORMANCE MATERIALS AND MAGNETIC MATERIALS
SPECIALTY STEEL
AT A GLANCE
NET SALES Years ended March 31(millions of yen)
NET SALES Years ended March 31(millions of yen)
NET SALES Years ended March 31(millions of yen)
SHARE OF NET SALES(%)
SHARE OF NET SALES(%)
SHARE OF NET SALES(%)
OPERATING INCOME Years ended March 31(millions of yen)
OPERATING INCOME Years ended March 31(millions of yen)
OPERATING INCOME Years ended March 31(millions of yen)
21.9%36.6% 33.4%
MAIN PRODUCTSSpecialty steel for automotive parts, indus-trial machinery parts, electrical machinery parts, construction, tool steel, etc.Specialty steel products and materials manufacturing, distribution, raw material sales, transportation and logistics
MAIN PRODUCTSStainless steel, nickel-based alloys, electri-cal and electronic parts, magnetic material products (OA·FA motors, automotive meters, sensors, measuring device components, etc.), alloy powder (magnetic powder for HEV), titanium products (medical titanium alloys, shape-memory alloys), welding wire
MAIN PRODUCTSDie forging, precise hot forging, welded parts (automotive parts and bearing races) / Open die forging (parts for boats and ships, industrial machines, heavy electric machines, steelmaking equipment, chemical equipment, oil drilling rigs, and spacecraft and aircraft) / Casting (manga-nese railway rails, components for automobiles, industrial machines, electric machines and furnaces, advanced cast steel products, etc.) / Precision casting (automotive, industrial machines, electric machines, telecommunications equipment, etc.) / Engine valves, compressors, hydraulic equipment, machine tool parts
04
AT
A G
LA
NC
E

0
30,000
20,000
10,000
2016 2017
0
3,000
1,000
2,000
2016 2017
0
15,000
5,000
10,000
2016 2017
0
2,000
1,500
500
1,000
2016 2017
ENGINEERING TRADING AND SERVICE
NET SALES Years ended March 31(millions of yen)
NET SALES Years ended March 31(millions of yen)
SHARE OF NET SALES(%)
SHARE OF NET SALES(%)
OPERATING INCOME Years ended March 31(millions of yen)
OPERATING INCOME Years ended March 31(millions of yen)
5.4% 2.7%
MAIN PRODUCTSSteelmaking equipment, industrial furnaces and facilities, environmental equipment (for drainage, exhaust, waste disposal and treatment facilities), machine tools, machine maintenance
MAIN PRODUCTSSale of Group company products, welfare services, real estate and insurance busi-ness, golf course management, analysis business, outside software sales business
05
AT
A G
LA
NC
E

Overview of BusinessSpecialty steel, the Company’s core business, generates
approximately 37% of consolidated net sales. Specialty steel is
made by combining steel with alloys to add value in the form of
properties such as resistance to heat, abrasions or rust. Because
a range of special properties can be achieved by varying the
types and amount of alloy, one of the special features of the
business is that products are developed to meet the specific
applications required by users. The automobile and industrial
machinery sectors are the primary users of specialty steel,
accounting for about 80% of sales in this business segment.
Results of OperationsSales volume for structural steel increased year on year, mainly
due to favorable demand from the automotive sector, a major
source of demand for this steel, in North America and China.
Sales volume of tool steel decreased year on year due to the
impact of inventory adjustments. The cost of steel scrap, the
main raw material, had remained relatively stable after rising and
falling sharply in early spring 2016 due to the impact of Chinese
billet prices. However, since early autumn 2016, the cost of
steel scrap has been increasing in response to rising coking
coal prices.
As a result, the specialty steel segment’s net sales in fiscal
2016 decreased 4.4% year on year to ¥163,087 million, due
primarily to a decline in sales prices in line with raw material
price movements. Operating income decreased by ¥1,747
million to ¥5,813 million, reflecting the impact of higher costs in
connection with rising raw material prices since November,
among other factors.
Tool steel from Daido Steel
SPECIALTY STEEL
REVIEW OF OPERATIONS
06
RE
VIE
W O
F O
PE
RA
TIO
NS

Overview of BusinessThis segment, which accounts for roughly 33% of consolidated
net sales, manufactures and sells high performance materials
and magnetic materials used chiefly in automobiles, computers,
mobile phones and consumer electronics.
Key products include stainless steel products, rare earth
magnets, high alloys, titanium products, and high performance
powder metal products.
Results of OperationsSales volume of stainless steel products increased year on year,
driven by strong demand for use in automobiles and semicon-
ductors. However, sales prices of stainless steel products
declined in line with falling nickel prices. Sales volume of high
alloys increased year on year atop higher demand from the
automotive sector. Sales volume of magnetic products rose
year on year primarily for use in electronic power steering sys-
tems. Powder metal products saw increased sales volume due
to robust demand for use in automobile components overseas.
As a result, net sales for the high performance materials and
magnetic materials segment in fiscal 2016 decreased 4.4% year
on year to ¥148,468 million. Operating income rose by ¥5,085
million to ¥17,417 million as higher sales volume contributed
positively to earnings.
NEOQUENCH-DR (Nd-Fe-B ring magnets) for EPS motors
HIGH PERFORMANCE MATERIALS AND MAGNETIC MATERIALS
07
RE
VIE
W O
F O
PE
RA
TIO
NS

Overview of BusinessThis segment contributes around 22% of consolidated net
sales. It manufactures die forged parts such as crankshafts
using specialty steel, precision cast parts for use in turbocharg-
ers, as well as engine valves, jet engine shafts and parts for gas
turbines. Most of the auto parts sold in this segment use mate-
rials that were developed through joint projects with automakers
to meet their exacting requirements. These parts can therefore
lower processing expenses at customers’ factories as well as
contribute to reducing the weight of finished products.
In this segment, Daido Steel has a high market share in
numerous product categories, including aircraft jet engine
shafts, automobile engine valves and turbine wheels. We will
continue to develop and launch new products that differentiate
us from competitors and support our position as a provider of
advanced parts.
In addition to specialty steel supplied by the specialty steel
segment of the Group, some materials used in this segment are
manufactured in-house.
Results of OperationsNet sales of free forged products decreased year on year, due
to a large decline in demand from the oil and gas sector amid
falling crude oil prices. Net sales of die forged products
declined, mainly as a result of decreased sales prices linked to
raw material prices and other factors. On the other hand, net
sales of engine valves increased year on year, as automobile
sales in North America and China remained strong. Net sales of
precision cast products rose, reflecting continuing growth in
turbocharger-related demand.
As a result, net sales in the parts for automobile and indus-
trial equipment segment for fiscal 2016 decreased 2.2% year
on year to ¥97,492 million. In terms of operating profitability, the
segment recorded an operating loss of ¥516 million, a decline
of ¥1,814 million from operating income recorded in the previ-
ous fiscal year. The operating loss was due to the impact of
lower demand for free forged products, among other factors.
Jet Engine Shaft
PARTS FOR AUTOMOBILE AND INDUSTRIAL EQUIPMENT
08
RE
VIE
W O
F O
PE
RA
TIO
NS

Overview of BusinessThis segment generates about 5% of consolidated net sales.
Major activities include the design and manufacture of, and
related after-sales services for, melting and refining equipment
such as arc furnaces and ladle furnaces (LF), heat treatment
furnaces for auto parts such as vacuum carburizing furnaces
and STC® (Short Time Cycle) annealing furnaces, and environ-
mental equipment such as sewage sludge carbonization fur-
naces and automobile tunnel filters, as well as machine tools.
With respect to heat treatment furnaces for auto parts in
particular, the operation and engineering technologies we have
fostered over the years support our cutting-edge engineering
business worldwide, in which we constantly maintain a grasp of
current market needs. The many new types of equipment and
technologies that this segment has created contribute to
improvements in quality for customers and energy reduction in
a wide variety of settings.
Daido Arc Process (DAP)
Results of OperationsIn the engineering segment, despite strong overseas sales of
certain products, the number of revenue-generating projects
decreased as a whole. As a result, engineering segment
sales for fiscal 2016 decreased 8.4% year on year to
¥23,918 million, while operating income decreased by ¥852
million to ¥1,219 million.
Overview of BusinessThe major activities of this segment, which accounts for approx-
imately 3% of consolidated net sales, include the sale of prod-
ucts made by Group companies, employee benefits services,
real estate and insurance services, golf course management,
analytics, and sales of software to external customers.
Results of OperationsNet sales in the trading and service segment for fiscal 2016
rose 34.6% year on year to ¥12,158 million, while operating
income increased by ¥410 million to ¥1,583 million. These
increases partly reflected the conversion of Daido Steel
(Shanghai) Co., Ltd. into a consolidated subsidiary in fiscal
2016.
TRADING AND SERVICE
ENGINEERING
09
RE
VIE
W O
F O
PE
RA
TIO
NS

RESEARCH AND DEVELOPMENT
Leveraging its advanced technology capabilities in specialty steel, the Daido Steel Group conducts a proactive program of research and development (R&D) to expand new products and businesses and strengthen the foundations for existing businesses.
We are pursuing R&D for new products, materials and technologies, primarily through the Daido Corporate Research & Development Center, which houses the Special Steel Research Lab, Electromagnetic Material Research Lab, and Process Technology Research Lab. We employ a total of 281 researchers throughout the Daido Steel Group.
R&D expenses for the Daido Steel Group during the fiscal year under review amounted to ¥6,205 million. An explanation of our R&D efforts by segment, including purpose, major achievements, and expenditures follows.
(1) Specialty SteelIn this segment, R&D includes basic material development, such as automotive structural materials and tool steel, and process innovations ranging from steelmaking, refining and solidification to quality assurance.
R&D costs for the fiscal year under review in this segment totaled ¥1,524 million. The following are major achievements in this area.• High-strength hot forging steel with superior
processing featuresOne challenge faced by automakers when using high-strength materials to reduce the weight of automotive parts is that these materials present problems in terms of processing features, such as machining capabilities.
Compared with conventional untempered steel, steel with superior processing features can be achieved by controlling the low-carbon bainitic structure, and hardness can be dramatically increased by using the age hardening phenomenon. This has enabled Daido Steel to achieve both lower processing costs and high strength.
Going forward, Daido Steel will work to achieve practical application of this technology in order to contribute to the minia-turization and weight reduction of automotive parts that use untempered steel, such as crankshafts, connecting rods, and fuel injection parts.• Phased array ultrasonic testing technologyDaido Steel uses ultrasonic testing to assure the internal quality of specialty steel products. In order to fulfill customer requests for strict quality control, Daido Steel has developed high-precision testing technologies for all steps within the manufac-turing process.
Daido Steel aims to achieve practical application of testing technologies for steel billets and steel bar products. We have already increased our quality assurance capabilities by
introducing high-precision automated testing equipment for titanium bars for medical applications.
(2) High Performance Materials and Magnetic Materials
In this segment the Daido Steel Group conducts R&D focusing on developing materials that resist corrosion and heat, high-grade strip steel, welding materials, magnetic materials and electronic devices.
R&D costs for the fiscal year under review in this segment totaled ¥3,086 million. The following are some of our major achievements in this area.• High-nitrogen stainless steel DSR40NThe element nitrogen can be used effectively to improve both the strength and corrosion resistance of stainless steel.
By maximizing these benefits of nitrogen, Daido Steel has successfully developed stainless steel with a hardness of over 58 HRC and a corrosion resistance equivalent to SUS 630.
This high-nitrogen stainless steel can be used in highly corrosive environments where the use of conventional steel was previously impractical. In fact, this stainless steel is already being used for machine blades and bearings.
Going forward, Daido Steel’s high-nitrogen stainless steel is expected to be used in a wide range of applications, such as automotive parts, for which there is growing demand for highly corrosion-resistant materials.• Heavy rare earth-free magnet for HEVDaido Electronics Co., Ltd., a member of the Daido Steel Group, manufactures ring magnets using its proprietary hot deformation method. Daido Electronics has developed a new plate magnet by applying this technology.
The new plate magnet features high heat resistance made possible by controlling the structural properties of the material. Without adding any heavy rare earth elements, the magnet can
R&D EXPENDITURESYears ended March 31
(millions of yen)
201620152014 20170
8,000
6,000
2,000
4,000
10
RE
SE
AR
CH
AN
D D
EV
EL
OP
ME
NT
be used in the primary motors of hybrid vehicles.Encouraged by the adoption of this new magnet by Japa-
nese automakers, Daido Steel will seek to expand its use going forward.
(3) Parts for Automobile and Industrial EquipmentR&D in this segment concentrates on development of turbo-chargers, engine valves and other automotive parts, as well as parts for various types of industrial machinery.
R&D costs for the fiscal year under review in this segment totaled ¥1,449 million. The following is one of our major achievements in this area.• Welding technology for water-cooled wall panelsIn order to improve the corrosion and wear resistance of water-cooled wall panels applied to the interior walls of furnaces exposed to high temperatures at thermal power plants, waste incinerators and other facilities, Daido Steel has developed a technology for welding high-alloy steel onto the panel surfaces through an on-site installation process.
Daido Steel employs the Plasma Powder Welding (PPW) method, which enables installation with a lower dilution ratio and a thinner layer than the metal inert gas (MIG) method using welding wires. Daido Steel has established a technology for smoothly forming a welding layer on panel surfaces in an upright position by properly controlling the powder supply.
(4) EngineeringEngineering R&D focuses on the development of environmental conservation and recycling equipment and a variety of energy-saving industrial furnaces.
R&D expenditures in this segment during the fiscal year under review amounted to ¥145 million.
11
RE
SE
AR
CH
AN
D D
EV
EL
OP
ME
NT

1,000 tons CO2/year
Kg of CO2/ ton of production
(Forecast)171615141312111009080706050403020100
0
500
1,000
1,500
2,000
0
200
400
600
800
–25.1%
–19.0%–18.1% –25.0%
–22.9% –25.9%–23.6%–27.8%
–23.6%–33.8%
Basic PolicyThe Daido Steel Group considers it extremely important for contemporary corporations to take on a role that extends beyond economic activities and to contribute to the sus-tainable development of society through environmentally conscious activities and involvement in the resolution of social issues.
The Daido Steel Group is playing a part in helping to create a recycling-oriented economy and society through its primary business operations: the manufacture and sale of specialty steel largely created from recycled scrap steel. Daido Steel is also engaged in a broad range of initiatives, including developing a variety of environmental activities, abiding firmly by our corporate ethics, striving for disclosure to increase the transparency of management, and creating a safe and pleasant place for employees to work.
Major InitiativesPreventing Global WarmingThe first commitment period for the Kyoto Protocol ran from 2008 to 2012. In that time frame, Daido Steel aimed to reduce its CO2 emissions volume by 10% compared to the 1990 level in accordance with the guidelines of the Japan Iron and Steel Federation. We worked to achieve this goal by expanding the use of exhaust heat recovery in heating furnaces, shifting our fuel source from heavy oil to natural gas, and improving the yield ratio through an increase in the ratio of production by continuous casters. Due to the effects of cumulative investments of ¥5.0 billion made from 2006 to 2012, operational improvements and changes in production levels, annual CO2 emissions from 2008 to 2012 decreased by 24.7% on average. In addition, in fiscal 2014, a cutting-edge, energy-efficient electric arc furnace was
CO2 EMISSIONS VOLUME
CO2 emissions volume (left scale)CO2 emissions per ton of production (right scale)
CO2 emissions coefficient for electric power: 0.374 kg of CO2 /kWh
installed at the Chita Plant at a cost of ¥19.8 billion with rationalizing effects evident throughout the year, resulting in a 3% improvement in CO2 emissions per ton of production. We continued to introduce the latest energy saving tech-nologies, resulting in further improvements in CO2 emissions in fiscal 2016.
Going forward, in accordance with the objectives of the Commitment to a Low Carbon Society ongoing plan for fiscal 2013 to fiscal 2020 formulated by the Japan Iron and Steel Federation and Japan Business Federation (Keidanren), we will continue implementing further reform measures, such as introduction of energy-saving advanced technolo-gies, reductions in the number of heat exchangers, improve-ments in the yield ratio, and production in optimal areas.
Strengthening the CSR Promotion FrameworkThe Daido Steel Group has responded to the needs of our various stakeholders by establishing the Human Resources Labor Committee and various other committees as parent organizations to support CSR activities, such as the Envi-ronment and Energy Committee. With a view to further strengthening this framework, in fiscal 2007, the CSR Com-mittee was established to supervise general CSR activities. Members of the CSR Committee formulate Group-wide policies and action plans with the aim of unifying and expanding CSR activities across all Group companies and divisions.
Starting January 2013, the Environment and Energy Committee was split into two independent committees (namely, the Environment Committee and the Energy Com-mittee) to promote CSR activities in a more fulfilling way.
For details, please refer to the annually issued CSR Report.URL: http://www.daido.co.jp/csr/data/report.html (Japanese only)
CSR AND THE ENVIRONMENT
12
CS
R
CORPORATE GOVERNANCE
Basic PolicyDaido Steel views corporate governance as one of the key
issues for management in today’s rapidly changing business
environment. We strive to increase management efficiency,
accelerate and improve decision-making, and ensure man-
agement transparency.
In addition, in order to clarify our responsibilities as a com-
pany contributing to society, Daido Steel has established a
Risk Management Committee. The Company has also imple-
mented the Daido Steel Corporate Code of Ethics, and is
working to improve its basic structure as a company open to
society. In order to ensure the reliability of its financial report-
ing, the Company has set up an Internal Control Committee.
Governance SystemDaido Steel uses an Audit & Supervisory Board system. By
using a system that supervises and oversees business execu-
tion through a Board of Directors, including two external
directors, and an Audit & Supervisory Board, including two
external Audit & Supervisory Board members, Daido Steel
enhances its corporate governance, optimizes and acceler-
ates decision-making and secures fair and transparent
management.
At the 91st Shareholders’ Meeting held on June 26, 2015,
the Company also instituted an executive officer system to
clearly distinguish the responsibilities of strategy formulation
and management oversight functions and business
execution.
Internal Control SystemRisk Management Initiatives
Daido Steel emphasizes risk management and legal compli-
ance in its management. To this end, the Company has set
out basic points for risk management in the Risk Manage-
ment Regulations. In addition, the Risk Management Commit-
tee discusses management of projected upcoming and latent
risks within the Group. The Company has appointed a direc-
tor who is responsible for the Company-wide supervision of
risk management and compliance.
In preparation for a major accident or other problem,
relevant information is shared with all concerned people, and
speedy and smooth countermeasures are formulated. The
Company has also formulated regulations for emergency
countermeasures in the event of a major accident, aimed at
minimizing the impact of the accident or other problem on
business activities, and disseminated the regulations to all
employees and Group companies.
Furthermore, in response to any major share-purchase
activity (for example, purchases of the Company’s shares
aimed at increasing the voting rights of a specific sharehold-
ers’ group to over 20%), Daido Steel will implement takeover
defense measures from the perspective of ensuring and
improving corporate value and, by extension, the shared
beneficial interests of all shareholders.
Efforts to Enhance Compliance
Daido Steel has established the Daido Steel Corporate Code
of Ethics and the Daido Steel Code of Conduct, and works to
disseminate them to all employees and Group companies.
The Company also maintains a hotline for consultation and
reporting by employees regarding compliance, as well as
directors in charge, divisions in charge and outside attorneys.
Efforts to Ensure the Reliability of Financial Reporting
In order to ensure the reliability of financial reporting and
enhance the level of response of the Company and Group
companies to J-SOX, the Daido Steel Group prescribes the
basic points for system improvement and operation in the
Internal Control Regulations and has established an Internal
Control Committee.
13
CO
RP
OR
AT
E G
OV
ER
NA
NC
E

EXECUTIVE OFFICERS
Hirotaka Yoshinaga
Tomoki Hanyuda
Kimihiko Seki
Hiroshi Matsui
Kunihito Kawanishi
Takaaki Taketsuru
Tetsuya Shimizu
Kazuhiro Toshimitsu
Tadashi Shimao
CHAIRPERSON OF THE BOARD OF DIRECTORS, REPRESENTATIVE EXECUTIVE DIRECTOR
PRESIDENT & CEO, REPRESENTATIVE EXECUTIVE DIRECTOR
REPRESENTATIVE EXECUTIVE DIRECTORS,EXECUTIVE VICE PRESIDENTS
DIRECTORS, MANAGING EXECUTIVE OFFICERS MANAGING EXECUTIVE OFFICERSDIRECTORS (OUTSIDE DIRECTORS)
STANDING CORPORATE AUDITORS
Toshinori Koike
Shinichi Nishikawa
CORPORATE AUDITOR
Kenji Matsuo
OFFICERS
Satoshi Yoshida Satoshi Tsujimoto
Tsukasa Nishimura Kazuto Tachibana
Susumu Shimura
Takeshi Ishiguro
Takeshi Muto Kazuhiko Hirabayashi Hajime Amano Yoshiaki Mori Tadashi Imai Hitoshi Tanemura
MECHANISM FOR BUSINESS EXECUTION, AUDIT, SUPERVISION AND INTERNAL CONTROL (As of June 28, 2017)
Election and dismissal
Election and dismissal
Election and dismissal
Advises and supports
Election and dismissal
Reports
Reports
Audits
Audits
Audits
Accounting audit
Board of Directors 10 directors including 2 external directors
Management Meeting
Committees• Risk Management
Committee• Internal Control
Committee, etc.Executive Officers
Each business division
Group companies
Corporate Risk Management Department*
(internal audits)
Accounting Auditor(independent auditor)
Audit & Supervisory Board
3 auditors including 2 external auditors
Shareholders’ Meeting
President and Chief Executive Officer
Akihito Kajita
Yuji Noguchi
Toshiaki Yamashita
Executive Vice Presidents
Executive Board
* As of June 28, 2017, Daido has realigned its organization to strengthen the auditing and risk management operations, and changed the Auditing Department to the Corporate Risk Management Department.
14
CO
RP
OR
AT
E G
OV
ER
NA
NC
E
OF
FIC
ER
S
FINANCIAL SECTION
16 MANAGEMENT’S DISCUSSION AND ANALYSIS OF OPERATIONS
20 CONSOLIDATED BALANCE SHEET
22 CONSOLIDATED STATEMENT OF INCOME
23 CONSOLIDATED STATEMENT OF COMPREHENSIVE INCOME
24 CONSOLIDATED STATEMENT OF CHANGES IN EQUITY
26 CONSOLIDATED STATEMENT OF CASH FLOWS
27 NOTES TO CONSOLIDATED FINANCIAL STATEMENTS
53 INDEPENDENT AUDITOR’S REPORT
CONTENTS
15

OVERVIEW OF OPERATING ENVIRONMENT AND PERFORMANCEIn fiscal 2016, ended March 31, 2017, the Japanese economy
tracked a gradual recovery path, underpinned by an upturn in
consumer spending on the back of continued improvement in
employment and income conditions, along with signs of a
rebound in industrial production in the corporate sector. In
Europe and the U.S., there were major developments including
the U.K.’s decision to withdraw from the European Union and
President Trump coming to power in the U.S. Economic expan-
sion continued at a moderate pace, driven by growth in employ-
ment. Supported by government economic stimulus policies,
China posted relatively steady growth, including a significant
increase in automobile sales volume.
Under these economic circumstances, production in the
automobile industry, our key source of demand for specialty
steel, increased in the second half in response to solid sales in
North America and China. The price of steel scrap, a key raw
material, had remained relatively stable after rising and falling
sharply in early spring 2016 due to the impact of Chinese billet
prices. However, since early autumn 2016, the cost of steel
scrap has been increasing in response to rising coking coal
prices.
As a result, the Group’s net sales in fiscal 2016 decreased
¥15,454 million to ¥445,123 million, due primarily to a decline in
sales prices in line with raw material price movements. Ordinary
income rose ¥1,265 million to ¥26,373 million, due to the posi-
tive contribution of higher sales volumes and other factors. Net
income attributable to owners of the parent increased by
¥9,640 million to ¥16,386 million, reflecting the absence of
extraordinary losses for discontinuing software development
and provisions for environmental remediation recorded in the
previous fiscal year.
BUSINESS SEGMENT PERFORMANCESpecialty SteelSales volume for structural steel increased year on year, mainly
due to favorable demand from the automotive sector, a major
source of demand for this steel, in North America and China.
Sales volume of tool steel decreased year on year due to the
impact of inventory adjustments. The cost of steel scrap, the
main raw material, had remained relatively stable after rising and
falling sharply in early spring 2016 due to the impact of Chinese
billet prices. However, since early autumn 2016, the cost of
steel scrap has been increasing in response to rising coking
coal prices.
As a result, the specialty steel segment’s net sales in fiscal
2016 fell 4.4% year on year to ¥163,087 million, due primarily to
a decline in sales prices in line with raw material price move-
ments. Operating income decreased by ¥1,747 million to
¥5,813 million, reflecting the impact of higher costs in connec-
tion with rising raw material prices since November, among
other factors.
NET SALESYears ended March 31
(millions of yen)
OPERATING INCOMEYears ended March 31
(millions of yen)
NET INCOME ATTRIBUTABLE TO OWNERS OF THE PARENTYears ended March 31(millions of yen)
FIN
AN
CIA
L S
EC
TIO
N
16
MANAGEMENT’S DISCUSSION AND ANALYSIS OF OPERATIONS
20162015 20170
150,000
300,000
450,000
600,000
20162015 20170
10,000
20,000
30,000
20162015 20170
5,000
15,000
10,000
20,000

High Performance Materials and Magnetic MaterialsSales volume of stainless steel products increased year on year,
driven by strong demand for use in automobiles and semicon-
ductors. However, sales prices of stainless steel products
declined in line with the falling nickel prices. Sales volume of
high alloys increased year on year atop higher demand from the
automotive sector. Sales volume of magnetic products rose
year on year primarily for use in electronic power steering sys-
tems. Powder metal products saw increased sales volume due
to robust demand for use in automobile components overseas.
As a result, net sales for the high performance materials and
magnetic materials segment in fiscal 2016 decreased 4.4% year
on year to ¥148,468 million. Operating income rose by ¥5,085
million to ¥17,417 million as higher sales volume contributed
positively to earnings.
Parts for Automobile and Industrial EquipmentNet sales of free forged products decreased year on year, due
to a large decline in demand from the oil and gas sector amid
falling crude oil prices. Net sales of die forged products
declined, mainly as a result of decreased sales prices linked to
raw material prices and other factors. On the other hand, net
sales of engine valves increased year on year, as automobile
sales in North America and China remained strong. Net sales of
precision cast products rose, reflecting continuing growth in
turbocharger-related demand.
As a result, net sales in the parts for automobile and indus-
trial equipment segment for fiscal 2016 decreased 2.2% year
on year to ¥97,492 million. In terms of operating profitability, the
segment recorded an operating loss of ¥516 million, a decline
of ¥1,814 million from operating income recorded in the previ-
ous fiscal year. The operating loss was due to the impact of
lower demand for free forged products, among other factors.
FIN
AN
CIA
L S
EC
TIO
N
17
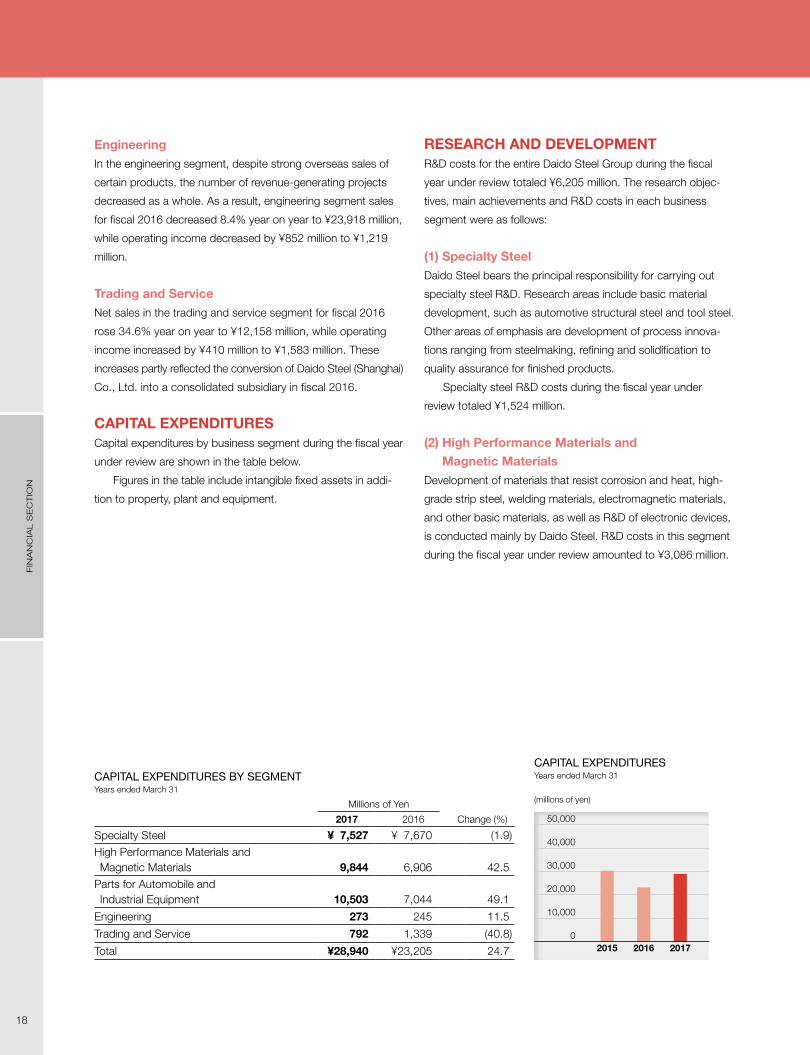
CAPITAL EXPENDITURES BY SEGMENTYears ended March 31
Millions of Yen
2017 2016 Change (%)
Specialty Steel ¥ 7,527 ¥ 7,670 (1.9)
High Performance Materials and Magnetic Materials 9,844 6,906 42.5
Parts for Automobile and Industrial Equipment 10,503 7,044 49.1
Engineering 273 245 11.5
Trading and Service 792 1,339 (40.8)
Total ¥28,940 ¥23,205 24.7
CAPITAL EXPENDITURESYears ended March 31
(millions of yen)
EngineeringIn the engineering segment, despite strong overseas sales of
certain products, the number of revenue-generating projects
decreased as a whole. As a result, engineering segment sales
for fiscal 2016 decreased 8.4% year on year to ¥23,918 million,
while operating income decreased by ¥852 million to ¥1,219
million.
Trading and ServiceNet sales in the trading and service segment for fiscal 2016
rose 34.6% year on year to ¥12,158 million, while operating
income increased by ¥410 million to ¥1,583 million. These
increases partly reflected the conversion of Daido Steel (Shanghai)
Co., Ltd. into a consolidated subsidiary in fiscal 2016.
CAPITAL EXPENDITURESCapital expenditures by business segment during the fiscal year
under review are shown in the table below.
Figures in the table include intangible fixed assets in addi-
tion to property, plant and equipment.
RESEARCH AND DEVELOPMENTR&D costs for the entire Daido Steel Group during the fiscal
year under review totaled ¥6,205 million. The research objec-
tives, main achievements and R&D costs in each business
segment were as follows:
(1) Specialty SteelDaido Steel bears the principal responsibility for carrying out
specialty steel R&D. Research areas include basic material
development, such as automotive structural steel and tool steel.
Other areas of emphasis are development of process innova-
tions ranging from steelmaking, refining and solidification to
quality assurance for finished products.
Specialty steel R&D costs during the fiscal year under
review totaled ¥1,524 million.
(2) High Performance Materials and Magnetic Materials
Development of materials that resist corrosion and heat, high-
grade strip steel, welding materials, electromagnetic materials,
and other basic materials, as well as R&D of electronic devices,
is conducted mainly by Daido Steel. R&D costs in this segment
during the fiscal year under review amounted to ¥3,086 million.
FIN
AN
CIA
L S
EC
TIO
N
18
50,000
40,000
30,000
20,000
10,000
20162015 20170

INTEREST-BEARING DEBTYears ended March 31
(millions of yen)
(3) Parts for Automobile and Industrial EquipmentMainly the responsibility of Daido Steel, R&D in this segment
concentrates on development of turbochargers, engine valves
and other automotive parts, and parts for various types of
industrial machinery. R&D costs for the fiscal year under review
in this segment totaled ¥1,449 million.
(4) EngineeringEngineering R&D is carried out primarily by Daido Steel, focused
on development of environmental conservation and recycling
equipment and a variety of energy-saving industrial furnaces.
Engineering R&D costs during the fiscal year under review were
¥145 million.
(5) Trading and ServiceThere are no R&D activities in this segment.
FINANCIAL POSITIONCash FlowsCash and cash equivalents as of March 31, 2017 (hereafter,
“cash”) amounted to ¥33,686 million, representing a decrease
of ¥88 million year on year.
Cash Flows from Operating Activities
Net cash provided by operating activities amounted to ¥28,391
million, decreasing by ¥17,341 million from the previous fiscal
year. This mainly reflected income before income taxes of
¥27,355 million.
Cash Flows from Investing Activities
Net cash used in investing activities totaled ¥26,449 million,
increasing by ¥3,284 million from the previous fiscal year. The
major cash outflows included ¥27,893 million in purchases of
property, plant, and equipment.
Cash Flows from Financing Activities
Net cash used in financing activities was ¥1,843 million, decreas-
ing by ¥18,321 million from the previous fiscal year. The main use
of cash was ¥4,988 million for the acquisition of treasury stock.
FIN
AN
CIA
L S
EC
TIO
N
19
20162015 20170
50,000
100,000
150,000
200,000

FIN
AN
CIA
L S
EC
TIO
N
20
CONSOLIDATED BALANCE SHEET
DAIDO STEEL CO., LTD. AND CONSOLIDATED SUBSIDIARIESMARCH 31, 2017
Millions of Yen
Thousands of U.S. Dollars
(Note 1)
ASSETS 2017 2016 2017
CURRENT ASSETS:Cash and cash equivalents (Note 17) ¥ 33,686 ¥ 33,774 $ 300,768 Time deposits (Notes 9 and 17) 1,281 1,155 11,437 Receivables:
Trade (Note 17) 113,215 98,800 1,010,848 Other 1,278 1,656 11,411 Total receivables 114,493 100,456 1,022,259
Inventories (Note 5) 98,478 95,131 879,268 Deferred tax assets (Note 13) 4,276 4,277 38,179 Prepaid expenses and other current assets 5,160 3,814 46,071 Allowance for doubtful accounts (165) (139) (1,473)
Total current assets 257,209 238,468 2,296,509
PROPERTY, PLANT, AND EQUIPMENT:Land (Notes 7 and 9) 35,474 35,302 316,732 Buildings and structures (Notes 6, 7 and 9) 173,103 164,903 1,545,563 Machinery and equipment (Notes 6 and 9) 469,941 456,501 4,195,901 Construction in progress 3,306 9,916 29,518
Total 681,824 666,622 6,087,714 Accumulated depreciation (490,909) (477,844) (4,383,116)
Net property, plant, and equipment 190,915 188,778 1,704,598
INVESTMENTS AND OTHER ASSETS:Investment securities (Notes 4, 9 and 17) 76,310 53,433 681,339 Investments in unconsolidated subsidiaries and associated companies (Note 17) 22,617 20,387 201,937
Asset for employees’ retirement benefits (Note 10) 21,091 26,239 188,313 Deferred tax assets (Note 13) 621 1,002 5,545 Other investments and assets (Note 6) 5,406 7,369 48,268
Total investments and other assets 126,045 108,430 1,125,402
TOTAL ¥ 574,169 ¥ 535,676 $ 5,126,509

FIN
AN
CIA
L S
EC
TIO
N
21
Millions of Yen
Thousands of U.S. Dollars
(Note 1)
LIABILITIES AND EQUITY 2017 2016 2017
CURRENT LIABILITIES:Short-term bank loans (Notes 8 and 17) ¥ 31,108 ¥ 18,545 $ 277,750 Current portion of long-term debt (Notes 8 and 17) 16,127 24,648 143,991 Payables:
Trade (Notes 9 and 17) 75,160 68,153 671,071 Acquisitions of property, plant, and equipment 8,895 8,354 79,420 Total payables 84,055 76,507 750,491
Income taxes payable (Note 17) 4,636 2,752 41,393 Accrued expenses 11,429 11,053 102,045 Provision for environmental measures (Note 2 (n)) 402 – 3,589 Other current liabilities (Note 9) 5,034 9,982 44,946
Total current liabilities 152,791 143,487 1,364,205
LONG-TERM LIABILITIES:Long-term debt (Notes 8 and 17) 94,979 92,423 848,027 Liability for employees' retirement benefits (Note 10) 9,220 8,999 82,321 Retirement allowance for directors and Audit & Supervisory Board members 832 910 7,429 Provision for environmental measures (Note 2 (n)) 3,428 5,720 30,607 Asset retirement obligations (Note 11) 428 432 3,822 Deferred tax liabilities (Note 13) 19,517 12,862 174,259 Other long-term liabilities 2,473 2,497 22,080
Total long-term liabilities 130,877 123,843 1,168,545
COMMITMENTS AND CONTINGENT LIABILITIES (Note 19)
EQUITY (Note 12):Common stock:
Authorized: 1,160,000 thousand shares
Issued: 434,488 thousand shares in 2017 and 2016 37,172 37,172 331,893 Capital surplus 29,928 28,722 267,214 Retained earnings 169,497 155,251 1,513,366 Treasury stock, at cost
8,133 thousand shares in 2017 and 7,473 thousand shares in 2016 (3,613) (3,560) (32,259)Accumulated other comprehensive income:
Unrealized gain on available-for-sale securities 21,236 13,826 189,607 Deferred gain on derivatives under hedge accounting 1 0 9 Land revaluation surplus 1,814 1,821 16,197 Foreign currency translation adjustments 1,452 2,044 12,964 Defined retirement benefit plans 2,365 (2,443) 21,116 Total 259,852 232,833 2,320,107
Noncontrolling interests 30,649 35,513 273,652 Total equity 290,501 268,346 2,593,759
TOTAL ¥574,169 ¥535,676 $5,126,509
See notes to consolidated financial statements.

FIN
AN
CIA
L S
EC
TIO
N
22
CONSOLIDATED STATEMENT OF INCOME
DAIDO STEEL CO., LTD. AND CONSOLIDATED SUBSIDIARIESYEAR ENDED MARCH 31, 2017
Millions of Yen
Thousands of U.S. Dollars
(Note 1)
2017 2016 2017
NET SALES ¥445,123 ¥460,578 $3,974,313 COST OF SALES (Note 14) 366,688 386,145 3,274,000
Gross profit 78,435 74,433 700,313
SELLING, GENERAL, AND ADMINISTRATIVE EXPENSES (Notes 14 and 15) 52,921 50,001 472,509
Operating income 25,514 24,432 227,804
OTHER INCOME (EXPENSES):Interest and dividend income 1,870 2,259 16,696 Interest expense (967) (1,309) (8,634)Equity in earnings of associated companies 811 418 7,241 Gain on transfer of assets from employee retirement benefit trust (Note 10) 2,524 – 22,536 Gain on sales of investment securities and investments in unconsolidated subsidiaries and associated companies—net 152 1,595 1,357
Foreign exchange loss (423) (570) (3,777)Provision for environmental measures (Note 2 (n)) (444) (5,736) (3,964)Loss on sales and disposals of property, plant, and equipment—net (111) (884) (991)Investment rents received 547 547 4,884 Write-down of investment securities and investments in associated companies (Note 4) (75) (34) (670)
Loss on discontinued software development (Note 6) – (5,586) –Impairment loss on long-lived assets (Note 6) (1,957) (436) (17,473)Other—net (86) 284 (768)
Other income (expenses)—net 1,841 (9,452) 16,437
INCOME BEFORE INCOME TAXES 27,355 14,980 244,241
INCOME TAXES (Note 13):Current 7,515 6,377 67,098 Deferred 1,576 (500) 14,072
Total income taxes 9,091 5,877 81,170
NET INCOME 18,264 9,103 163,071
NET INCOME ATTRIBUTABLE TO NONCONTROLLING INTERESTS 1,878 2,357 16,767
NET INCOME ATTRIBUTABLE TO OWNERS OF THE PARENT ¥ 16,386 ¥ 6,746 $ 146,304
Yen U.S. Dollars
PER SHARE OF COMMON STOCK (Note 2 (w)):Basic net income ¥ 38.59 ¥ 15.62 $ 0.34 Cash dividends applicable to the year 10.00 7.50 0.09
Thousands
WEIGHTED-AVERAGE NUMBER OF OUTSTANDING SHARES OF COMMON STOCK 424,595 431,829
See notes to consolidated financial statements.

FIN
AN
CIA
L S
EC
TIO
N
23
CONSOLIDATED STATEMENT OF COMPREHENSIVE INCOME
DAIDO STEEL CO., LTD. AND CONSOLIDATED SUBSIDIARIESYEAR ENDED MARCH 31, 2017
Millions of Yen
Thousands of U.S. Dollars
(Note 1)
2017 2016 2017
NET INCOME ¥18,264 ¥ 9,103 $163,071
OTHER COMPREHENSIVE INCOME (LOSS) (Note 20):Unrealized gain (loss) on available-for-sale securities 7,339 (11,482) 65,527 Deferred gain (loss) on derivatives under hedge accounting 1 (2) 9 Land revaluation surplus 0 62 0 Foreign currency translation adjustments (855) (1,699) (7,634)Defined retirement benefit plans 4,866 (11,114) 43,446 Share of other comprehensive income (loss) in associates 41 (81) 366
Total other comprehensive income (loss) 11,392 (24,316) 101,714
COMPREHENSIVE INCOME (LOSS) ¥29,656 ¥(15,213) $264,785
TOTAL COMPREHENSIVE INCOME (LOSS) ATTRIBUTABLE TO:Owners of the parent ¥27,875 ¥(16,707) $248,884 Noncontrolling interests 1,781 1,494 15,901
See notes to consolidated financial statements.

FIN
AN
CIA
L S
EC
TIO
N
24
CONSOLIDATED STATEMENT OF CHANGES IN EQUITY
DAIDO STEEL CO., LTD. AND CONSOLIDATED SUBSIDIARIESYEAR ENDED MARCH 31, 2017
Thousands Millions of Yen
Accumulated Other Comprehensive Income
Outstanding Number of Shares of
Common StockCommon
StockCapital Surplus
Retained Earnings
Treasury Stock
Unrealized Gain on
Available-for-Sale Securities
Deferred Gain on Derivatives under Hedge Accounting
BALANCE, APRIL 1, 2015 433,683 ¥37,172 ¥28,542 ¥152,131 ¥ (382) ¥ 25,129 ¥ 1
Net income attributable to owners of the parent – – – 6,746 – – –
Cash dividends, ¥8.5 per share – – – (3,687) – – –
Purchase of treasury stock (6,671) – – – (3,179) – –
Disposal of treasury stock 2 – (0) – 1 – –
Adjustment of retained earnings for changes in the scope of consolidation – – – 61 0 – –
Change in the parent’s ownership interest due to transactions with noncontolling interests – – 180 – – – –
Net change in the year – – – – – (11,303) (1)
BALANCE, MARCH 31, 2016 427,014 37,172 28,722 155,251 (3,560) 13,826 0
Net income attributable to owners of the parent – – – 16,386 – – –
Cash dividends, ¥6.5 per share – – – (2,736) – – –
Purchase of treasury stock (12,040) – – – (4,988) – –
Disposal of treasury stock 11,380 – (0) – 1 – –
Adjustment of retained earnings for changes in the scope of consolidation – – – 590 – – –
Increase due to stock exchange – – 311 – 4,934 – –Change in the parent’s ownership interest due to transactions with noncontolling interests – – 895 – – – –
Reversal of land revaluation surplus – – – 6 – – –
Net change in the year – – – – – 7,410 1
BALANCE, MARCH 31, 2017 426,354 ¥37,172 ¥29,928 ¥169,497 ¥(3,613) ¥ 21,236 ¥ 1
Millions of Yen
Accumulated Other Comprehensive Income
Land Revaluation
Surplus
Foreign Currency
Translation Adjustments
Defined Retirement
Benefit Plans TotalNoncontrolling
InterestsTotal
Equity
BALANCE, APRIL 1, 2015 ¥1,758 ¥ 3,236 ¥ 8,435 ¥256,022 ¥36,384 ¥292,406
Net income attributable to owners of the parent – – – 6,746 – 6,746
Cash dividends, ¥8.5 per share – – – (3,687) – (3,687)
Purchase of treasury stock – – – (3,179) – (3,179)
Disposal of treasury stock – – – 1 – 1
Adjustment of retained earnings for changes in the scope of consolidation – – – 61 – 61
Change in the parent’s ownership interest due to transactions with noncontolling interests – – – 180 – 180
Net change in the year 63 (1,192) (10,878) (23,311) (871) (24,182)
BALANCE, MARCH 31, 2016 1,821 2,044 (2,443) 232,833 35,513 268,346
Net income attributable to owners of the parent – – – 16,386 – 16,386
Cash dividends, ¥6.5 per share – – – (2,736) – (2,736)
Purchase of treasury stock – – – (4,988) – (4,988)
Disposal of treasury stock – – – 1 – 1
Adjustment of retained earnings for changes in the scope of consolidation – – – 590 – 590
Increase due to stock exchange – – – 5,245 – 5,245
Change in the parent’s ownership interest due to transactions with noncontolling interests – – – 895 – 895
Reversal of land revaluation surplus – – – 6 – 6
Net change in the year (7) (592) 4,808 11,620 (4,864) 6,756
BALANCE, MARCH 31, 2017 ¥1,814 ¥ 1,452 ¥ 2,365 ¥259,852 ¥30,649 ¥290,501

FIN
AN
CIA
L S
EC
TIO
N
25
Thousands of U.S. Dollars (Note 1)
Accumulated Other Comprehensive Income
Common Stock
Capital Surplus
Retained Earnings
Treasury Stock
Unrealized Gain on
Available-for-Sale Securities
Deferred Gain on Derivatives under Hedge Accounting
BALANCE, MARCH 31, 2016 $331,893 $256,446 $1,386,169 $(31,786) $123,446 $0
Net income attributable to owners of the parent – – 146,304 – – –
Cash dividends, $0.06 per share – – (24,429) – – –
Purchase of treasury stock – – – (44,536) – –
Disposal of treasury stock – (0) – 9 – –
Adjustment of retained earnings for changes in the scope of consolidation – – 5,268 – – –
Increase due to stock exchange – 2,777 – 44,054 – –
Change in the parent’s ownership interest due to transactions with noncontolling interests – 7,991 – – – –
Reversal of land revaluation surplus – – 54 – – –
Net change in the year – – – – 66,161 9
BALANCE, MARCH 31, 2017 $331,893 $267,214 $1,513,366 $(32,259) $189,607 $9
Thousands of U.S. Dollars (Note 1)
Accumulated Other Comprehensive Income
Land Revaluation
Surplus
Foreign Currency
Translation Adjustments
Defined Retirement
Benefit Plans TotalNoncontrolling
InterestsTotal
Equity
BALANCE, MARCH 31, 2016 $16,260 $18,250 $(21,813) $2,078,865 $317,081 $2,395,946
Net income attributable to owners of the parent – – – 146,304 – 146,304
Cash dividends, $0.06 per share – – – (24,429) – (24,429)
Purchase of treasury stock – – – (44,536) – (44,536)
Disposal of treasury stock – – – 9 – 9
Adjustment of retained earnings for changes in the scope of consolidation – – – 5,268 – 5,268
Increase due to stock exchange – – – 46,831 – 46,831
Change in the parent’s ownership interest due to transactions with noncontolling interests – – – 7,991 – 7,991
Reversal of land revaluation surplus – – – 54 – 54
Net change in the year (63) (5,286) 42,929 103,750 (43,429) 60,321
BALANCE, MARCH 31, 2017 $16,197 $12,964 $ 21,116 $2,320,107 $273,652 $2,593,759
See notes to consolidated financial statements.

Millions of Yen
Thousands of U.S. Dollars
(Note 1)
2017 2016 2017OPERATING ACTIVITIES:
Income before income taxes ¥ 27,355 ¥ 14,980 $ 244,241Adjustments for:
Income taxes paid (6,185) (7,781) (55,223)Depreciation and amortization 23,276 22,454 207,821Loss on discontinued software development – 5,586 –Impairment loss on long-lived assets 1,957 436 17,473Gain on transfer of assets from employee retirement benefit trust (2,524) – (22,536)Loss on sales and disposals of property, plant, equipment, and other—net 95 842 848Gain on sales of investment securities and investments in unconsolidated subsidiaries and associated companies (152) (1,553) (1,357)
Write-down of investment securities and investments in unconsolidated subsidiaries and associated companies 75 38 670
Equity in earnings of associated companies (811) (418) (7,241)Changes in assets and liabilities:
(Increase) decrease in notes and accounts receivable (14,182) 6,103 (126,625)Increase (decrease) in allowance for doubtful accounts 22 (39) 196(Increase) decrease in inventories (3,479) 12,444 (31,062)Increase (decrease) in notes and accounts payable 6,795 (9,929) 60,670(Decrease) increase in provision for environmental measures (1,891) 4,473 (16,884)Decrease (increase) in asset for retirement benefits 2,310 (2,510) 20,625Decrease in liability for employees' retirement benefits 446 246 3,982
Other—net (4,716) 360 (42,107)Total adjustments 1,036 30,752 9,250Net cash provided by operating activities 28,391 45,732 253,491
INVESTING ACTIVITIES:Payment for time deposits (318) (963) (2,839)Repayment from time deposits 534 592 4,768Purchases of property, plant, and equipment (27,894) (21,057) (249,054)Proceeds from sales of property, plant and equipment 693 204 6,188Purchases of investment securities and investments in unconsolidated subsidiaries and associated companies (1,182) (3,377) (10,554)
Proceeds from sales of investment securities and investments in unconsolidated subsidiaries and associated companies 587 4,175 5,241
Disbursements for originating loans (193) (1,659) (1,723)Proceeds from collection of loans 1,941 212 17,330Other—net (617) (1,292) (5,509)
Net cash used in investing activities (26,449) (23,165) (236,152)
FINANCING ACTIVITIES:Net increase (decrease) in short-term bank loans 12,818 (3,777) 114,446Proceeds from long-term debt 18,578 19,264 165,875Repayments of long-term debt (14,365) (5,496) (128,259)Redemption of long-term debt (10,000) (20,000) (89,286)Acquisition of treasury stock (4,988) (3,179) (44,536)Acquisition of treasury stock by a subsidiary (23) (881) (205)Dividends paid, including payments to noncontrolling shareholders of subsidiaries (3,352) (4,170) (29,928)Liquidating dividends to noncontrolling shareholders of a subsidiary – (1,122) –Payments for transactions with noncontrolling interests (15) (562) (134)Other—net (496) (241) (4,428)
Net cash used in financing activities (1,843) (20,164) (16,455)
FOREIGN CURRENCY TRANSLATION ADJUSTMENTS ON CASH AND CASH EQUIVALENTS (203) (650) (1,813)NET (DECREASE) INCREASE IN CASH AND CASH EQUIVALENTS (104) 1,753 (929)CASH AND CASH EQUIVALENTS OF NEWLY-CONSOLIDATED SUBSIDIARY, BEGINNING OF YEAR 404 790 3,607CASH AND CASH EQUIVALENTS OF DECONSOLIDATED SUBSIDIARY – (545) –DECREASE IN CASH AND CASH EQUIVALENTS DUE TO COMPANY DEVESTITURE (388) – (3,464)CASH AND CASH EQUIVALENTS, BEGINNING OF YEAR 33,774 31,776 301,554CASH AND CASH EQUIVALENTS, END OF YEAR ¥ 33,686 ¥ 33,774 $ 300,768
See notes to consolidated financial statements.
CONSOLIDATED STATEMENT OF CASH FLOWS
DAIDO STEEL CO., LTD. AND CONSOLIDATED SUBSIDIARIESYEAR ENDED MARCH 31, 2017
FIN
AN
CIA
L S
EC
TIO
N
26

NOTES TO CONSOLIDATED FINANCIAL STATEMENTS
DAIDO STEEL CO., LTD. AND CONSOLIDATED SUBSIDIARIESYEAR ENDED MARCH 31, 2017
1. BASIS OF PRESENTATION OF CONSOLIDATED FINANCIAL STATEMENTSThe accompanying consolidated financial statements have been prepared in accordance with the provisions set forth in the Japanese Finan-
cial Instruments and Exchange Act and its related accounting regulations and in accordance with accounting principles generally accepted
in Japan (“Japanese GAAP”), which are different in certain respects as to the application and disclosure requirements of International Finan-
cial Reporting Standards.
In preparing these consolidated financial statements, certain reclassifications and rearrangements have been made to the consolidated
financial statements issued domestically in order to present them in a form which is more familiar to readers outside Japan. In addition,
certain reclassifications have been made in the 2016 consolidated financial statements to conform to the classifications used in 2017.
The consolidated financial statements are stated in Japanese yen, the currency of the country in which DAIDO STEEL CO., LTD. (the
“Company”) is incorporated and operates. The translations of Japanese yen amounts into U.S. dollar amounts are included solely for the
convenience of readers outside Japan and have been made at the rate of ¥112 to $1, the approximate rate of exchange at March 31, 2017.
Such translations should not be construed as representations that the Japanese yen amounts could be converted into U.S. dollars at that or
any other rate.
2. SUMMARY OF SIGNIFICANT ACCOUNTING POLICIES(a) ConsolidationThe Company had 67 (67 in 2016) subsidiaries and 13 (17 in 2016) associated companies at March 31, 2017. The consolidated financial
statements as of March 31, 2017, include the accounts of the Company and 34 (34 in 2016) significant subsidiaries (together, the “Group”).
Under the control and influence concepts, those companies in which the Company, directly or indirectly, is able to exercise control over
operations are fully consolidated and those companies over which the Group has the ability to exercise significant influence are accounted
for by the equity method.
Investments in six associated companies were accounted for by the equity method for the years ended March 31, 2017 and 2016.
Investments in other unconsolidated subsidiaries and associated companies are stated at cost. If the equity method of accounting had been
applied to the investments in these companies, the effect on the accompanying consolidated financial statements would not have been
material.
The fiscal years of the consolidated subsidiaries are not necessarily the same as that of the Company. Accounts of those subsidiaries
which have different fiscal years have been adjusted for significant transactions to properly reflect their financial position at March 31 of each
year and the results of operations for the year then ended.
The difference between the cost of acquisition and the fair value of the net assets of the acquired subsidiary at the date of acquisition is
being amortized on a straight-line basis over five years.
All significant intercompany balances and transactions have been eliminated in consolidation. All material unrealized profit included in
assets resulting from transactions within the Group is also eliminated.
(b) Unification of Accounting Policies Applied to Foreign Subsidiaries for the Consolidated Financial Statements
The Accounting Standards Board of Japan (ASBJ) issued ASBJ Practical Issues Task Force (PITF) No. 18, “Practical Solution on Unification
of Accounting Policies Applied to Foreign Subsidiaries for the Consolidated Financial Statements,” advising that accounting policies and
procedures applied to a parent company and its subsidiaries for similar transactions and events under similar circumstances should in prin-
ciple be unified for the preparation of the consolidated financial statements. However, financial statements prepared by foreign subsidiaries in
accordance with either International Financial Reporting Standards or the accounting principles generally accepted in the United States of
America (Financial Accounting Standards Board Accounting Standards Codification—”FASB ASC”) tentatively may be used for the consoli-
dation process, except for the following items which should be adjusted in the consolidation process so that net income is accounted for in
accordance with Japanese GAAP unless they are not material: a) amortization of goodwill; b) scheduled amortization of actuarial gain or loss
of pensions that has been recorded in equity through other comprehensive income; c) expensing capitalized development costs of research
and development; and d) cancellation of the fair value model accounting for property, plant, and equipment and investment properties and
incorporation of cost model accounting.
FIN
AN
CIA
L S
EC
TIO
N
27
(c) Business CombinationsBusiness combinations are accounted for using the purchase method. Acquisition-related costs, such as advisory fees or professional fees,
are accounted for as expenses in the periods in which the costs are incurred. If the initial accounting for a business combination is incom-
plete by the end of the reporting period in which the business combination occurs, an acquirer shall report in its financial statements provi-
sional amounts for the items for which the accounting is incomplete. During the measurement period, which shall not exceed one year from
the acquisition, the acquirer shall retrospectively adjust the provisional amounts recognized at the acquisition date to reflect new information
obtained about facts and circumstances that existed as of the acquisition date and that would have affected the measurement of the
amounts recognized as of that date. Such adjustments shall be recognized as if the accounting for the business combination had been
completed at the acquisition date. A parent’s ownership interest in a subsidiary might change if the parent purchases or sells ownership
interests in its subsidiary. The carrying amount of noncontrolling interest is adjusted to reflect the change in the parent’s ownership interest in
its subsidiary while the parent retains its controlling interest in its subsidiary. Any difference between the fair value of the consideration
received or paid and the amount by which the noncontrolling interest is adjusted is accounted for as capital surplus as long as the parent
retains control over its subsidiary.
(d) Cash and Cash EquivalentsCash equivalents are short-term investments that are readily convertible into cash and that are exposed to insignificant risk of changes in
value. Cash equivalents include time deposits and short-term investments which mature or become due within three months of the date of
acquisition.
(e) Investment SecuritiesInvestment securities are classified and accounted for, depending on management’s intent, as follows:
Available-for-sale securities are reported at fair value, with unrealized gains and losses, net of applicable taxes, reported as a separate
component of equity.
A limited partnership investment is accounted for by the equity method.
Non-marketable securities are stated at cost, determined by the moving-average method. For other-than-temporary declines in fair
value, investment securities are reduced to net realizable value by a charge to income.
(f) InventoriesInventories are stated at the lower of cost, mainly determined by the weighted-average method or net selling value. A reversal of allowance
for inventory valuation of ¥523 million ($4,670 thousand) for the year ended March 31, 2017 and a write-down of inventory of ¥604 million
for the year ended March 31, 2016 were included in cost of sales.
(g) Allowance for Doubtful AccountsTo provide for the loss from doubtful accounts, an allowance for doubtful accounts is made using the historical rate of actual losses for
normal receivables and the estimated irrecoverable amount for specific doubtful receivables after considering the recoverability of each
account.
(h) Property, Plant, and EquipmentProperty, plant, and equipment are stated at cost, less gains on grant receipts, etc. Under certain conditions, such as government grant
receipts, exchanges of fixed assets of similar kinds, and sales and purchases resulting from expropriation, Japanese tax laws permit compa-
nies to defer the profit arising from such transactions by reducing the cost of the assets acquired or by providing a special reserve in the
equity section. The acquisition costs of property, plant, and equipment were reduced in the amounts of ¥4,585 million ($40,938 thousand)
and ¥4,678 million at March 31, 2017 and 2016, respectively.
Depreciation of certain plants of the Company and certain domestic and foreign subsidiaries is computed by the straight-line method.
Depreciation of other plants of the Company and other subsidiaries is computed by the declining-balance method, while the straight-line
method is applied to buildings acquired on or after April 1, 1998, and building improvements and structures acquired on or after April 1,
2016, for domestic companies.
Pursuant to an amendment to the Corporate Tax Act, the Company adopted ASBJ Practical Issues Task Force No. 32 “Practical
FIN
AN
CIA
L S
EC
TIO
N
28

Solution on a Change in Depreciation Method Due to Tax Reform 2016,” and changed the depreciation method for building improvements
and structures acquired on or after April 1, 2016, from the declining-balance method to the straight-line method. The effect of this amend-
ment was immaterial to the consolidated financial statements.
Depreciation of leased assets is computed by the straight-line method over the lease period.
The range of useful lives is from 5 to 75 years for buildings and structures and from 4 to 17 years for machinery and equipment.
(i) Land RevaluationUnder the “Law of Land Revaluation,” Nippon Drop Forge Co., Ltd., a consolidated subsidiary, elected a one-time revaluation of its own-use
land to a value based on real estate appraisal information at March 31, 1999. The resulting land revaluation surplus represented unrealized
appreciation of land and was stated, net of income taxes, as a component of equity. Continuous readjustment is not permitted, unless the
land value subsequently declines significantly such that the amount of the decline in value should be removed from the land revaluation
surplus account and related deferred tax liabilities. At March 31, 2017, the carrying amount of the land after the above one-time revaluation
and impairment exceeded the market value by ¥920 million ($8,214 thousand).
(j) Long-Lived AssetsThe Group reviews its long-lived assets for impairment whenever events or changes in circumstances indicate the carrying amount of an
asset or asset group may not be recoverable. An impairment loss would be recognized if the carrying amount of an asset or asset group
exceeds the sum of the undiscounted future cash flows expected to result from the continued use and eventual disposition of the asset or
asset group. The impairment loss would be measured at the amount by which the carrying amount of the asset exceeds its recoverable
amount, which is the higher of the discounted cash flows from the continued use and eventual disposition of the asset or the net selling
price at disposition.
(k) Other AssetsIntangible assets are amortized by the straight-line method. Software costs are amortized over five years.
(l) Bond Issue CostsBond issue costs are charged to income as incurred.
(m) Retirement and Pension PlansThe Company and its domestic consolidated subsidiaries have defined retirement benefit plans and unfunded pension plans. Certain con-
solidated subsidiaries have defined contribution pension plans, multi-employer contributory funded pension plans and smaller enterprise
retirement allowance mutual aid plans.
The Group accounts for the liability for retirement benefits based on the projected benefit obligations and plan assets at the balance
sheet date. The projected benefit obligations are attributed to periods on a benefit formula basis. Actuarial gains and losses and past service
costs that are yet to be recognized in profit or loss are recognized within equity (accumulated other comprehensive income), after adjusting
for tax effects and are recognized in profit or loss over 10 years, no longer than the expected average remaining service period of the
employees.
Retirement benefits to directors and Audit & Supervisory Board members of certain subsidiaries are provided at the amount that would
be required if all directors and Audit & Supervisory Board members retired at the consolidated balance sheet date.
(n) Provision for Environmental MeasuresA provision for environmental measures is provided to accrue the estimated costs of PCB (Polychlorinated Biphenyl) waste disposals and
the estimated costs of removal of steel slag products sold in reserve for future expenses. The estimated costs of removal of steel slag prod-
ucts used in construction projects by the Ministry of Land, Infrastructure, Transport and Tourism, Gunma Prefecture, and municipalities in
Gunma were accrued and included in the provision for environmental measures in the consolidated statement of income.
(o) Asset Retirement ObligationsAn asset retirement obligation is defined as a legal obligation imposed either by law or contract that results from the acquisition,
FIN
AN
CIA
L S
EC
TIO
N
29
construction, development, and the normal operation of a tangible fixed asset and is associated with the retirement of such tangible fixed
asset. The asset retirement obligation is recognized as the sum of the discounted cash flows required for the future asset retirement and is
recorded in the period in which the obligation is incurred if a reasonable estimate can be made. If a reasonable estimate of the asset retire-
ment obligation cannot be made in the period the asset retirement obligation is incurred, the liability should be recognized when a reason-
able estimate of asset retirement obligation can be made. Upon initial recognition of a liability for an asset retirement obligation, an asset
retirement cost is capitalized by increasing the carrying amount of the related fixed asset by the amount of the liability. The asset retirement
cost is subsequently allocated to expense through depreciation over the remaining useful life of the asset. Over time, the liability is accreted
to its present value each period. Any subsequent revisions to the timing or the amount of the original estimate of undiscounted cash flows
are reflected as an adjustment to the carrying amount of the liability and the capitalized amount of the related asset retirement cost.
(p) Research and Development CostsResearch and development costs are charged to income as incurred.
(q) Bonuses to Directors and Audit & Supervisory Board MembersBonuses to directors and Audit & Supervisory Board members are accrued at the year-end to which such bonuses are attributable.
(r) Construction ContractsConstruction revenue and construction costs should be recognized by the percentage-of-completion method if the outcome of a construc-
tion contract can be estimated reliably. When total construction revenue, total construction costs, and the stage of completion of the con-
tract at the balance sheet date can be reliably measured, the outcome of a construction contract can be estimated reliably. If the outcome of
a construction contract cannot be reliably estimated, the completed-contract method should be applied. When it is probable that the total
construction costs will exceed total construction revenue, an estimated loss on the contract should be immediately recognized by providing
for a loss on construction contracts.
(s) Income TaxesThe provision for income taxes is computed based on the pretax income included in the consolidated statement of income. The asset and
liability approach is used to recognize deferred tax assets and liabilities for the expected future tax consequences of temporary differences
between the carrying amounts and the tax bases of assets and liabilities. Deferred taxes are measured by applying currently enacted tax
laws to the temporary differences.
The Group applied ASBJ Guidance No. 26, “Guidance on Recoverability of Deferred Tax Assets,” effective April 1, 2016.
(t) Foreign Currency TransactionsAll short-term and long-term monetary receivables and payables denominated in foreign currencies are translated into Japanese yen at the
exchange rates at the consolidated balance sheet date. The foreign exchange gains and losses from translation are recognized in the con-
solidated statement of income to the extent that they are not hedged by forward exchange contracts.
(u) Foreign Currency Financial StatementsThe consolidated balance sheet accounts, and revenue and expense accounts of the consolidated foreign subsidiaries are translated into
Japanese yen at the current exchange rate as of the consolidated balance sheet date except for equity, which is translated at the historical
rate. Differences arising from such translation are shown as “Foreign currency translation adjustments” under accumulated other compre-
hensive income in a separate component of equity.
(v) Derivatives and Hedging ActivitiesThe Group uses derivative financial instruments to manage its exposure to fluctuations in foreign currency exchange and interest rates.
Foreign currency forward contracts, currency swaps and interest rate swaps are utilized by the Group to reduce foreign currency exchange
and interest rate risks. The Group does not enter into derivatives for trading or speculative purposes.
Derivative financial instruments and foreign currency transactions are classified and accounted for as follows: a) all derivatives are recog-
nized as either assets or liabilities and measured at fair value, and, except for those derivatives which qualify for hedge accounting, gains or
FIN
AN
CIA
L S
EC
TIO
N
30

losses are recognized in the consolidated statement of income and b) for derivatives used for hedging purposes, if such derivatives qualify
for hedge accounting because of high correlation and effectiveness between the hedging instruments and the hedged items, gains or losses
are deferred until maturity of the hedged transactions.
Foreign currency forward contracts are measured at fair value, and the unrealized gains (losses) are recognized in the consolidated
statement of income. Forward contracts used to hedge forecasted (or committed) transactions are also measured at fair value, but the
unrealized gains (losses) are deferred until the underlying transactions are completed.
Long-term debt denominated in foreign currencies for which currency swaps are used to hedge the foreign currency fluctuations is
translated at the contracted rate if the swaps qualify for hedge accounting.
Interest rate swaps which qualify for hedge accounting and meet specific matching criteria are not remeasured at market value but the
differential paid or received under the swap agreements is recognized and included in interest expense.
(w) Per Share InformationNet income per share is computed by dividing net income attributable to common shareholders by the weighted-average number of
common shares outstanding for the period.
Diluted net income per share is not disclosed because the Group had no dilutive shares at March 31, 2017 and 2016.
Cash dividends per share presented in the accompanying consolidated statement of income are dividends applicable to the respective
years including dividends to be paid after the end of year.
3. BUSINESS COMBINATIONSYear Ended March 31, 2017
(Transaction under common control)
On October 1, 2016, the Company acquired shares of Daido Kogyo Co., Ltd. (“Daido Kogyo”), a consolidated subsidiary of the Company,
by issuing the Company’s shares to all of the shareholders of Daido Kogyo in exchange for all of the outstanding shares of Daido Kogyo. As
a result, Daido Kogyo became a wholly owned subsidiary of the Company.
a. Outline of the business combination(1) Name of the company and its business outline
Name of the company: Daido Kogyo Co., Ltd.
Business outline: Sale, export and import of specialty steel, nonferrous metals, materials, machinery, etc.
(2) Date of business combination
October 1, 2016
(3) Legal form of business combination
Stock exchange
(4) Name of the company after the business combination
No change
(5) Outline of the business combination
This stock exchange was made in order to strengthen the marketing initiatives in foreign countries and to establish efficient business
models for the turbo materials, magnetic and high alloy businesses.
b. Accounting methodThe business combination was accounted for as a transaction with noncontrolling interests.
c. Acquisition of the subsidiary’s shares(1) The Company acquired the subsidiary’s shares in exchange for the Company’s treasury stock in the amount of ¥5,245 million ($46,830
thousand).
(2) The exchange ratio, formula and number of shares issued to shareholders of noncontrolling interests
The Company allotted 1.53 shares per 1 shares of Daido Kogyo.
The Company and Daido Kogyo determined the exchange ratio by referencing the stock valuation of Daido Kogyo by The Bank of
FIN
AN
CIA
L S
EC
TIO
N
31
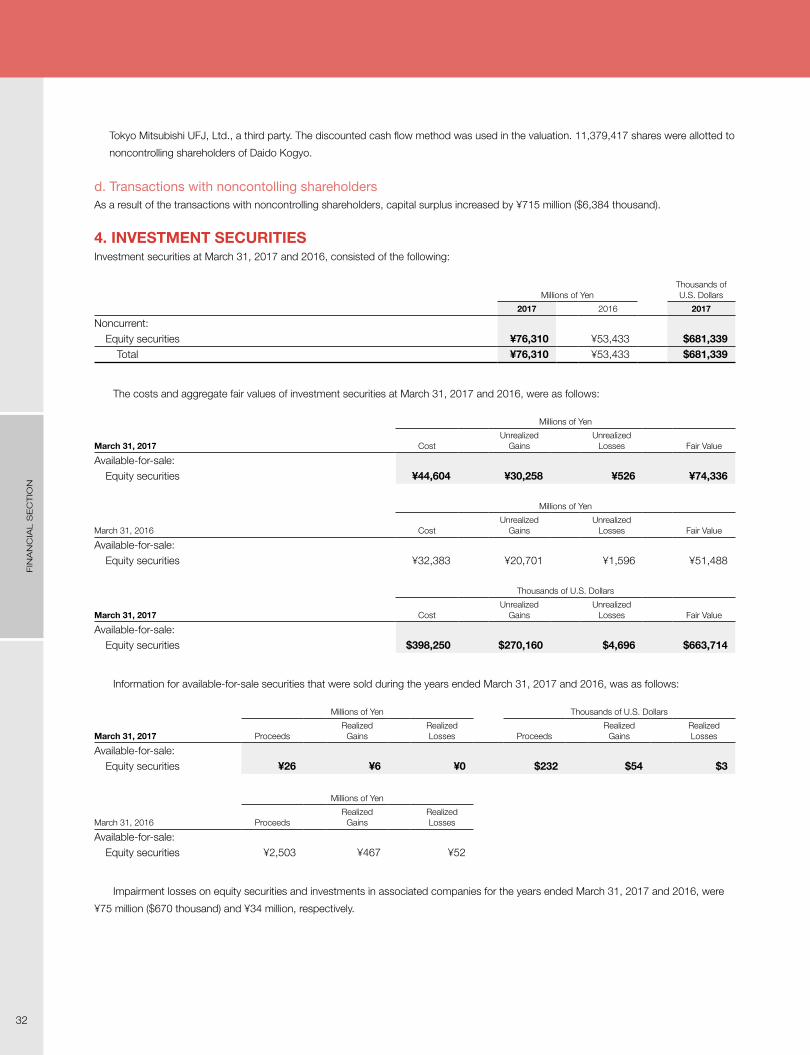
Tokyo Mitsubishi UFJ, Ltd., a third party. The discounted cash flow method was used in the valuation. 11,379,417 shares were allotted to
noncontrolling shareholders of Daido Kogyo.
d. Transactions with noncontolling shareholdersAs a result of the transactions with noncontrolling shareholders, capital surplus increased by ¥715 million ($6,384 thousand).
4. INVESTMENT SECURITIESInvestment securities at March 31, 2017 and 2016, consisted of the following:
Millions of YenThousands of U.S. Dollars
2017 2016 2017
Noncurrent:Equity securities ¥76,310 ¥53,433 $681,339
Total ¥76,310 ¥53,433 $681,339
The costs and aggregate fair values of investment securities at March 31, 2017 and 2016, were as follows:
Millions of Yen
March 31, 2017 CostUnrealized
GainsUnrealized
Losses Fair Value
Available-for-sale:Equity securities ¥44,604 ¥30,258 ¥526 ¥74,336
Millions of Yen
March 31, 2016 CostUnrealized
GainsUnrealized
Losses Fair Value
Available-for-sale:Equity securities ¥32,383 ¥20,701 ¥1,596 ¥51,488
Thousands of U.S. Dollars
March 31, 2017 CostUnrealized
GainsUnrealized
Losses Fair Value
Available-for-sale:Equity securities $398,250 $270,160 $4,696 $663,714
Information for available-for-sale securities that were sold during the years ended March 31, 2017 and 2016, was as follows:
Millions of Yen Thousands of U.S. Dollars
March 31, 2017 ProceedsRealized
GainsRealized Losses Proceeds
Realized Gains
Realized Losses
Available-for-sale:Equity securities ¥26 ¥6 ¥0 $232 $54 $3
March 31, 2016
Millions of Yen
ProceedsRealized
GainsRealized Losses
Available-for-sale:Equity securities ¥2,503 ¥467 ¥52
Impairment losses on equity securities and investments in associated companies for the years ended March 31, 2017 and 2016, were
¥75 million ($670 thousand) and ¥34 million, respectively.
FIN
AN
CIA
L S
EC
TIO
N
32

5. INVENTORIESInventories held by the Group at March 31, 2017 and 2016, consisted of the following:
Millions of YenThousands of U.S. Dollars
2017 2016 2017
Merchandise ¥18,151 ¥18,764 $162,062Finished products 11,724 11,803 104,679Semifinished products 18,201 15,976 162,509Work in process 22,060 21,738 196,964Raw materials 17,081 16,207 152,509Supplies 11,261 10,643 100,545
Total ¥98,478 ¥95,131 $879,268
6. LONG-LIVED ASSETSThe Group reviewed its long-lived assets for impairment as of March 31, 2017 and 2016. As a result, the Group recognized an impairment
loss of ¥1,957 million ($17,473 thousand) as other expense for property, plant and equipment located in Gifu due to devaluation; the carry-
ing amount of the relevant assets was written down to the recoverable amount for the year ended March 31, 2017. The Group recognized
an impairment loss of ¥436 million as other expense for property, plant and equipment located in Nagano due to devaluation; the carrying
amount of the relevant assets was written down to the recoverable amount for the year ended March 31, 2016. Moreover, the Group recog-
nized an impairment loss of ¥5,162 million as other expense for discontinued software development costs for internal use; the carrying
amount of the relevant assets was written down to the recoverable amount for the year ended March 31, 2016. Such amount is included in
loss on discontinued software development of ¥5,586 million.
7. INVESTMENT PROPERTYThe Company and certain consolidated subsidiaries hold some rental properties, such as office buildings and land in Aichi and other areas.
The net amounts of rental income and operating expenses for those rental properties were ¥848 million ($7,571 thousand) and ¥892 million
for the years ended March 31, 2017 and 2016, respectively. Gain on sales of rental property was ¥194 million ($1,732 thousand) for the year
ended March 31, 2017.
The carrying amounts, changes in such balances and fair values of such properties at March 31, 2017 and 2016, were as follows:
Millions of Yen Thousands of U.S. Dollars
Carrying Amount Fair Value Carrying Amount Fair Value
March 31, 2016 Increase, net March 31, 2017 March 31, 2017 March 31, 2016 Increase, net March 31, 2017 March 31, 2017
¥5,655 ¥233 ¥5,422 ¥24,692 $50,491 $2,080 $48,411 $220,464
Millions of Yen
Carrying Amount Fair Value
March 31, 2015 Increase, net March 31, 2016 March 31, 2016
¥5,197 ¥458 ¥5,655 ¥24,805
Notes:(1) The carrying amount recognized in the consolidated balance sheet was net of accumulated depreciation and accumulated impairment losses, if any.(2) The increase during the fiscal year ended March 31, 2016, primarily represents the acquisition of certain properties of ¥565 million. The decreases during the
fiscal years ended March 31, 2017 and 2016, primarily represent depreciation of ¥168 million ($1,500 thousand) and ¥145 million, respectively.(3) The fair value of properties was primarily measured by the Group in accordance with its Real-Estate Appraisal Standard.
8. SHORT-TERM BANK LOANS AND LONG-TERM DEBTShort-term bank loans consisted of notes to banks and bank overdrafts. The weighted-average rates of annual interest applicable to short-
term bank loans at March 31, 2017 and 2016, were 0.56% and 0.78%, respectively.
FIN
AN
CIA
L S
EC
TIO
N
33
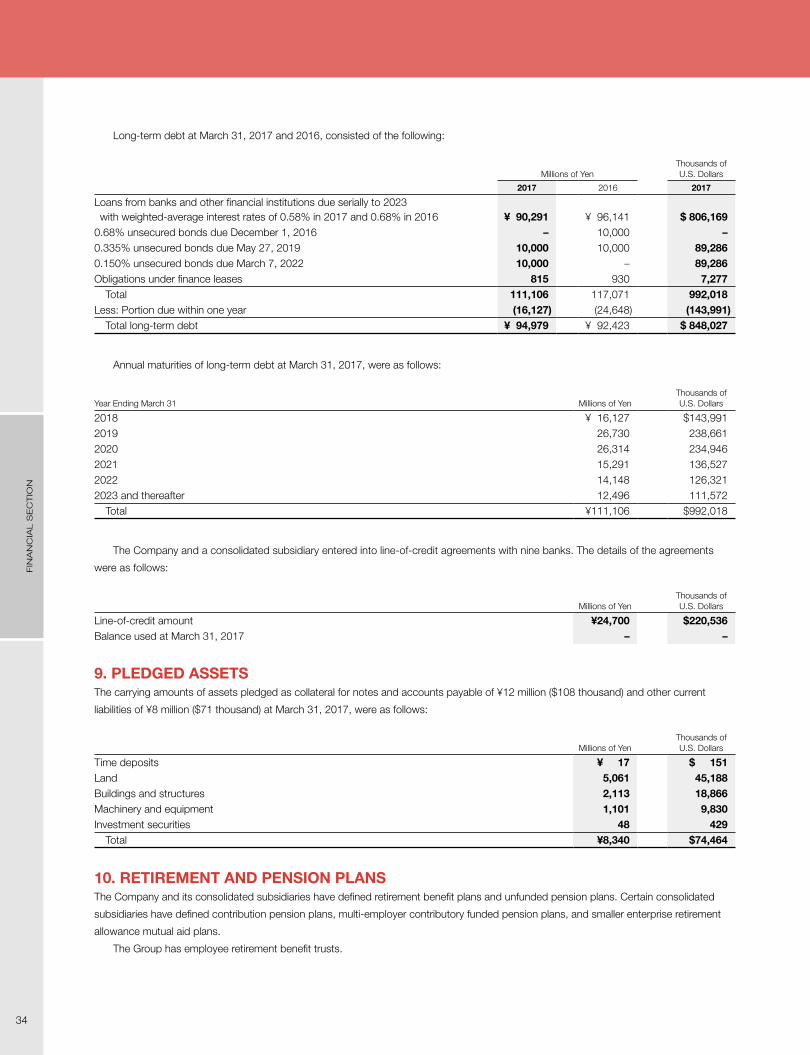
Long-term debt at March 31, 2017 and 2016, consisted of the following:
Millions of YenThousands of U.S. Dollars
2017 2016 2017
Loans from banks and other financial institutions due serially to 2023 with weighted-average interest rates of 0.58% in 2017 and 0.68% in 2016 ¥ 90,291 ¥ 96,141 $ 806,169
0.68% unsecured bonds due December 1, 2016 – 10,000 –0.335% unsecured bonds due May 27, 2019 10,000 10,000 89,2860.150% unsecured bonds due March 7, 2022 10,000 – 89,286Obligations under finance leases 815 930 7,277
Total 111,106 117,071 992,018Less: Portion due within one year (16,127) (24,648) (143,991)
Total long-term debt ¥ 94,979 ¥ 92,423 $ 848,027
Annual maturities of long-term debt at March 31, 2017, were as follows:
Year Ending March 31 Millions of YenThousands of U.S. Dollars
2018 ¥ 16,127 $143,9912019 26,730 238,6612020 26,314 234,9462021 15,291 136,5272022 14,148 126,3212023 and thereafter 12,496 111,572
Total ¥111,106 $992,018
The Company and a consolidated subsidiary entered into line-of-credit agreements with nine banks. The details of the agreements
were as follows:
Millions of YenThousands of U.S. Dollars
Line-of-credit amount ¥24,700 $220,536Balance used at March 31, 2017 – –
9. PLEDGED ASSETSThe carrying amounts of assets pledged as collateral for notes and accounts payable of ¥12 million ($108 thousand) and other current
liabilities of ¥8 million ($71 thousand) at March 31, 2017, were as follows:
Millions of YenThousands of U.S. Dollars
Time deposits ¥ 17 $ 151Land 5,061 45,188Buildings and structures 2,113 18,866Machinery and equipment 1,101 9,830Investment securities 48 429
Total ¥8,340 $74,464
10. RETIREMENT AND PENSION PLANSThe Company and its consolidated subsidiaries have defined retirement benefit plans and unfunded pension plans. Certain consolidated
subsidiaries have defined contribution pension plans, multi-employer contributory funded pension plans, and smaller enterprise retirement
allowance mutual aid plans.
The Group has employee retirement benefit trusts.
FIN
AN
CIA
L S
EC
TIO
N
34
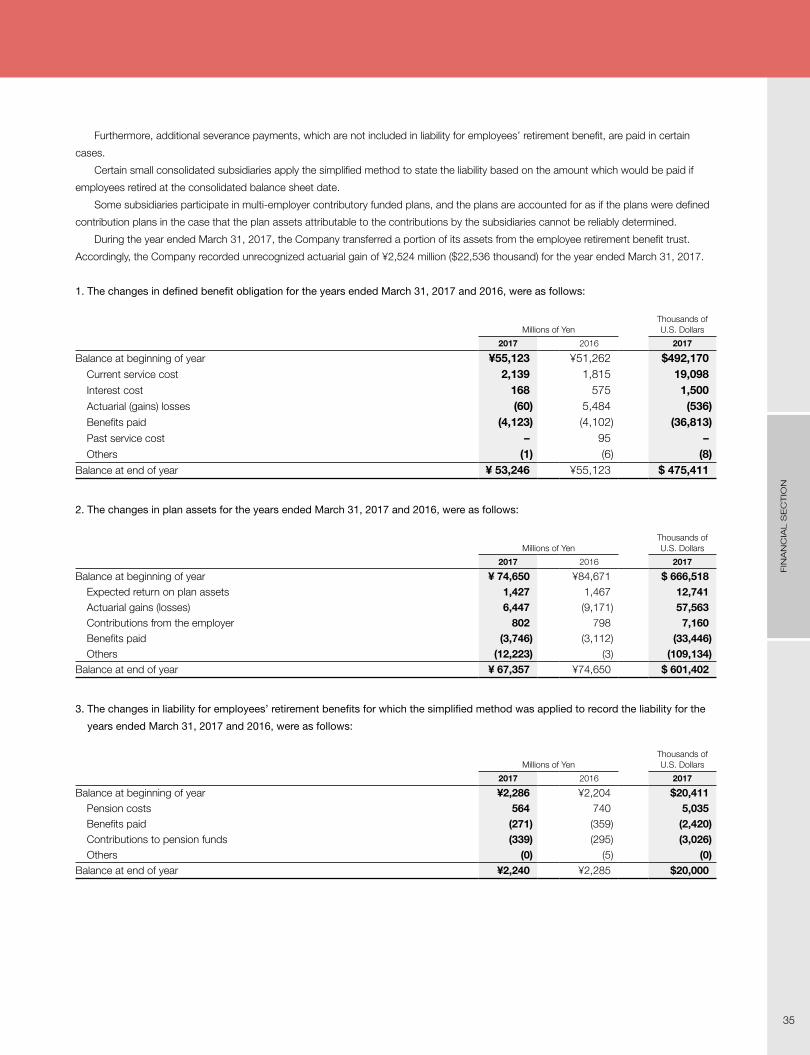
Furthermore, additional severance payments, which are not included in liability for employees’ retirement benefit, are paid in certain
cases.
Certain small consolidated subsidiaries apply the simplified method to state the liability based on the amount which would be paid if
employees retired at the consolidated balance sheet date.
Some subsidiaries participate in multi-employer contributory funded plans, and the plans are accounted for as if the plans were defined
contribution plans in the case that the plan assets attributable to the contributions by the subsidiaries cannot be reliably determined.
During the year ended March 31, 2017, the Company transferred a portion of its assets from the employee retirement benefit trust.
Accordingly, the Company recorded unrecognized actuarial gain of ¥2,524 million ($22,536 thousand) for the year ended March 31, 2017.
1. The changes in defined benefit obligation for the years ended March 31, 2017 and 2016, were as follows:
Millions of YenThousands of U.S. Dollars
2017 2016 2017
Balance at beginning of year ¥55,123 ¥51,262 $492,170Current service cost 2,139 1,815 19,098Interest cost 168 575 1,500Actuarial (gains) losses (60) 5,484 (536)Benefits paid (4,123) (4,102) (36,813)Past service cost – 95 –Others (1) (6) (8)
Balance at end of year ¥ 53,246 ¥55,123 $ 475,411
2. The changes in plan assets for the years ended March 31, 2017 and 2016, were as follows:
Millions of YenThousands of U.S. Dollars
2017 2016 2017
Balance at beginning of year ¥ 74,650 ¥84,671 $ 666,518Expected return on plan assets 1,427 1,467 12,741Actuarial gains (losses) 6,447 (9,171) 57,563Contributions from the employer 802 798 7,160Benefits paid (3,746) (3,112) (33,446)Others (12,223) (3) (109,134)
Balance at end of year ¥ 67,357 ¥74,650 $ 601,402
3. The changes in liability for employees’ retirement benefits for which the simplified method was applied to record the liability for the
years ended March 31, 2017 and 2016, were as follows:
Millions of YenThousands of U.S. Dollars
2017 2016 2017
Balance at beginning of year ¥2,286 ¥2,204 $20,411Pension costs 564 740 5,035Benefits paid (271) (359) (2,420)Contributions to pension funds (339) (295) (3,026)Others (0) (5) (0)
Balance at end of year ¥2,240 ¥2,285 $20,000
FIN
AN
CIA
L S
EC
TIO
N
35
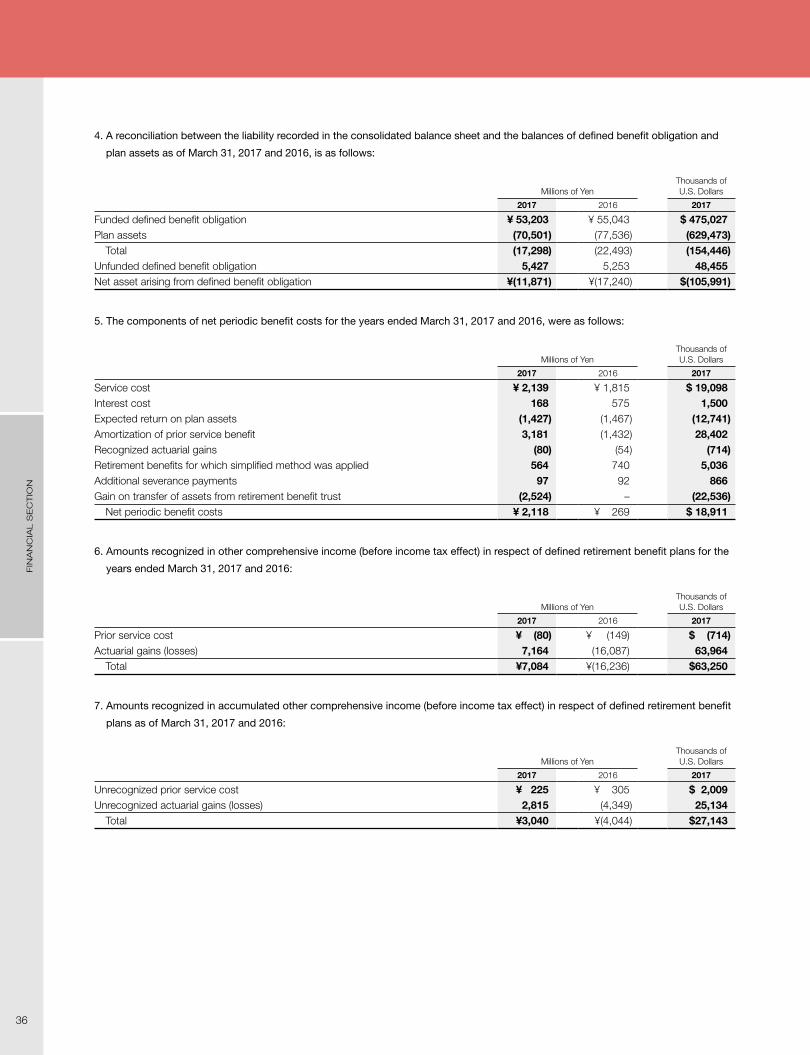
4. A reconciliation between the liability recorded in the consolidated balance sheet and the balances of defined benefit obligation and
plan assets as of March 31, 2017 and 2016, is as follows:
Millions of YenThousands of U.S. Dollars
2017 2016 2017
Funded defined benefit obligation ¥ 53,203 ¥ 55,043 $ 475,027Plan assets (70,501) (77,536) (629,473)
Total (17,298) (22,493) (154,446)Unfunded defined benefit obligation 5,427 5,253 48,455Net asset arising from defined benefit obligation ¥(11,871) ¥(17,240) $(105,991)
5. The components of net periodic benefit costs for the years ended March 31, 2017 and 2016, were as follows:
Millions of YenThousands of U.S. Dollars
2017 2016 2017
Service cost ¥ 2,139 ¥ 1,815 $ 19,098Interest cost 168 575 1,500Expected return on plan assets (1,427) (1,467) (12,741)Amortization of prior service benefit 3,181 (1,432) 28,402Recognized actuarial gains (80) (54) (714)Retirement benefits for which simplified method was applied 564 740 5,036Additional severance payments 97 92 866Gain on transfer of assets from retirement benefit trust (2,524) – (22,536)
Net periodic benefit costs ¥ 2,118 ¥ 269 $ 18,911
6. Amounts recognized in other comprehensive income (before income tax effect) in respect of defined retirement benefit plans for the
years ended March 31, 2017 and 2016:
Millions of YenThousands of U.S. Dollars
2017 2016 2017
Prior service cost ¥ (80) ¥ (149) $ (714)Actuarial gains (losses) 7,164 (16,087) 63,964
Total ¥7,084 ¥(16,236) $63,250
7. Amounts recognized in accumulated other comprehensive income (before income tax effect) in respect of defined retirement benefit
plans as of March 31, 2017 and 2016:
Millions of YenThousands of U.S. Dollars
2017 2016 2017
Unrecognized prior service cost ¥ 225 ¥ 305 $ 2,009Unrecognized actuarial gains (losses) 2,815 (4,349) 25,134
Total ¥3,040 ¥(4,044) $27,143
FIN
AN
CIA
L S
EC
TIO
N
36

8. Plan assets
(1) Components of plan assets
Plan assets consisted of the following:
2017 2016
Debt investments 14% 15%Equity investments 64 65Assets in an insurer’s general account 21 19Others 1 1
Total 100% 100%
(2) Method of determining the expected rate of return on plan assets
The expected rate of return on plan assets is determined considering the long-term rates of return which are expected currently and in the
future from the various components of the plan assets.
9. Assumptions used for the years ended March 31, 2017 and 2016, are set forth as follows:
2017 2016
Discount rate 0.3% 0.3%Expected rate of return on plan assets 2.0 2.0
Some consolidated subsidiaries participate in a multi-employer plan for which the Company cannot reasonably calculate the amount of
plan assets corresponding to the contributions made by the subsidiaries. Therefore, it is accounted for using the same methods as used to
account for a defined contribution plan.
The contributions to such multi-employer plan, which are accounted for using the same method as a defined contribution plan, were
¥265 million ($2,366 thousand) and ¥317 million for the years ended March 31, 2017 and 2016, respectively.
(1) The funded status of the multi-employer plan as of March 31, 2017 and 2016, was as follows:
Millions of YenThousands of U.S. Dollars
2017 2016 2017
Plan assets ¥251,436 ¥263,436 $2,244,964Sum of actuarial liabilities of pension plan and minimum actuarial reserve 253,982 268,703 2,267,696Net balance ¥ (2,546) ¥ (5,267) $ (22,732)
(2) The contribution ratio of the Group in the multi-employer plan for the years ended March 31, 2017 and 2016, was as follows:
2017 2016
The contribution ratio of the Group in the multi-employer plan 2.29% 2.28%
11. ASSET RETIREMENT OBLIGATIONSThe changes in asset retirement obligations for the years ended March 31, 2017 and 2016, were as follows:
Millions of YenThousands of U.S. Dollars
2017 2016 2017
Balance at beginning of year ¥432 ¥426 $3,857Additional provisions associated with the change in the estimated costs of PCB waste disposal – 6 –
Reconciliation associated with passage of time 4 0 35Balance at end of year ¥428 ¥432 $3,822
FIN
AN
CIA
L S
EC
TIO
N
37

12. EQUITYJapanese companies are subject to the Companies Act of Japan (the “Companies Act”). The significant provisions in the Companies Act
that affect financial and accounting matters are summarized below:
(a) DividendsUnder the Companies Act, companies can pay dividends at any time during the fiscal year in addition to the year-end dividend upon resolu-
tion at the Shareholders’ Meeting. Additionally, for companies that meet certain criteria, such as (1) having a Board of Directors, (2) having
independent auditors, (3) having an Audit & Supervisory Board, and (4) the term of service of the directors being prescribed as one year
rather than the normal two-year term by its articles of incorporation, the Board of Directors may declare dividends (except for dividends-in-
kind) at any time during the fiscal year if the company has prescribed so in its articles of incorporation. However, the Company cannot do so
because it does not meet all the above criteria.
The Companies Act permits companies to distribute dividends-in-kind (non-cash assets) to shareholders subject to certain limitations
and additional requirements.
Semiannual interim dividends may also be paid once a year upon resolution by the Board of Directors if the articles of incorporation of
the company so stipulate. The Companies Act provides certain limitations on the amounts available for dividends or the purchase of treasury
stock. The limitation is defined as the amount available for distribution to the shareholders, but the amount of net assets after dividends must
be maintained at no less than ¥3 million.
(b) Increases/Decreases and Transfer of Common Stock, Reserve, and SurplusThe Companies Act requires that an amount equal to 10% of dividends must be appropriated as a legal reserve (a component of retained
earnings) or as additional paid-in capital (a component of capital surplus) depending on the equity account charged upon the payment of
such dividends until the total of the aggregate amount of the legal reserve and additional paid-in capital equals 25% of common stock.
Under the Companies Act, the total amount of additional paid-in capital and legal reserve may be reversed without limitation. The Compa-
nies Act also provides that common stock, legal reserve, additional paid-in capital, other capital surplus, and retained earnings can be trans-
ferred among the accounts within equity under certain conditions upon resolution of the shareholders.
(c) Treasury Stock and Treasury Stock Acquisition RightsThe Companies Act also provides for companies to purchase treasury stock and dispose of such treasury stock by resolution of the Board
of Directors. The amount of treasury stock purchased cannot exceed the amount available for distribution to the shareholders which is
determined by a specific formula. Under the Companies Act, stock acquisition rights are presented as a separate component of equity. The
Companies Act also provides that companies can purchase both treasury stock acquisition rights and treasury stock. Such treasury stock
acquisition rights are presented as a separate component of equity or deducted directly from stock acquisition rights.
13. INCOME TAXESThe Company and its domestic subsidiaries are subject to Japanese national and local income taxes which, in the aggregate, resulted in
normal effective statutory tax rates of approximately 31% and 33% for the years ended March 31, 2017, and 2016, respectively.
FIN
AN
CIA
L S
EC
TIO
N
38
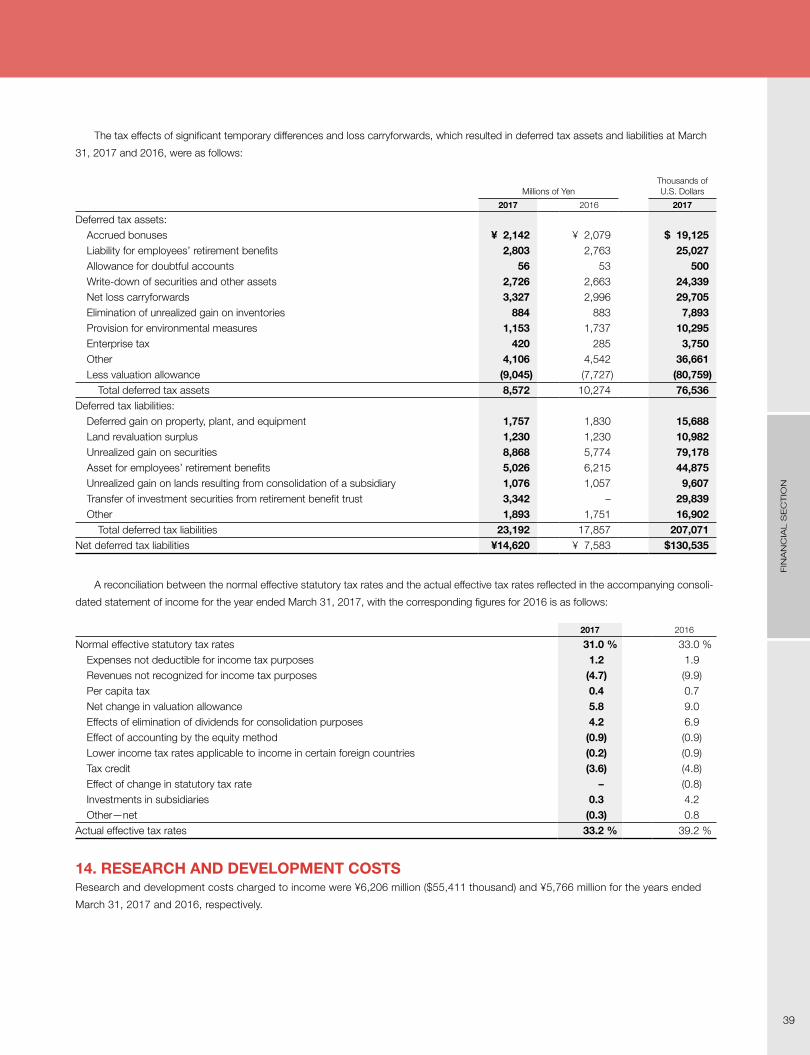
The tax effects of significant temporary differences and loss carryforwards, which resulted in deferred tax assets and liabilities at March
31, 2017 and 2016, were as follows:
Millions of YenThousands of U.S. Dollars
2017 2016 2017
Deferred tax assets:Accrued bonuses ¥ 2,142 ¥ 2,079 $ 19,125Liability for employees’ retirement benefits 2,803 2,763 25,027Allowance for doubtful accounts 56 53 500Write-down of securities and other assets 2,726 2,663 24,339Net loss carryforwards 3,327 2,996 29,705Elimination of unrealized gain on inventories 884 883 7,893Provision for environmental measures 1,153 1,737 10,295Enterprise tax 420 285 3,750Other 4,106 4,542 36,661Less valuation allowance (9,045) (7,727) (80,759)
Total deferred tax assets 8,572 10,274 76,536Deferred tax liabilities:
Deferred gain on property, plant, and equipment 1,757 1,830 15,688Land revaluation surplus 1,230 1,230 10,982Unrealized gain on securities 8,868 5,774 79,178Asset for employees’ retirement benefits 5,026 6,215 44,875Unrealized gain on lands resulting from consolidation of a subsidiary 1,076 1,057 9,607Transfer of investment securities from retirement benefit trust 3,342 – 29,839Other 1,893 1,751 16,902
Total deferred tax liabilities 23,192 17,857 207,071Net deferred tax liabilities ¥14,620 ¥ 7,583 $130,535
A reconciliation between the normal effective statutory tax rates and the actual effective tax rates reflected in the accompanying consoli-
dated statement of income for the year ended March 31, 2017, with the corresponding figures for 2016 is as follows:
2017 2016
Normal effective statutory tax rates 31.0 % 33.0 %Expenses not deductible for income tax purposes 1.2 1.9Revenues not recognized for income tax purposes (4.7) (9.9)Per capita tax 0.4 0.7Net change in valuation allowance 5.8 9.0Effects of elimination of dividends for consolidation purposes 4.2 6.9Effect of accounting by the equity method (0.9) (0.9)Lower income tax rates applicable to income in certain foreign countries (0.2) (0.9)Tax credit (3.6) (4.8)Effect of change in statutory tax rate – (0.8)Investments in subsidiaries 0.3 4.2Other—net (0.3) 0.8
Actual effective tax rates 33.2 % 39.2 %
14. RESEARCH AND DEVELOPMENT COSTSResearch and development costs charged to income were ¥6,206 million ($55,411 thousand) and ¥5,766 million for the years ended
March 31, 2017 and 2016, respectively.
FIN
AN
CIA
L S
EC
TIO
N
39
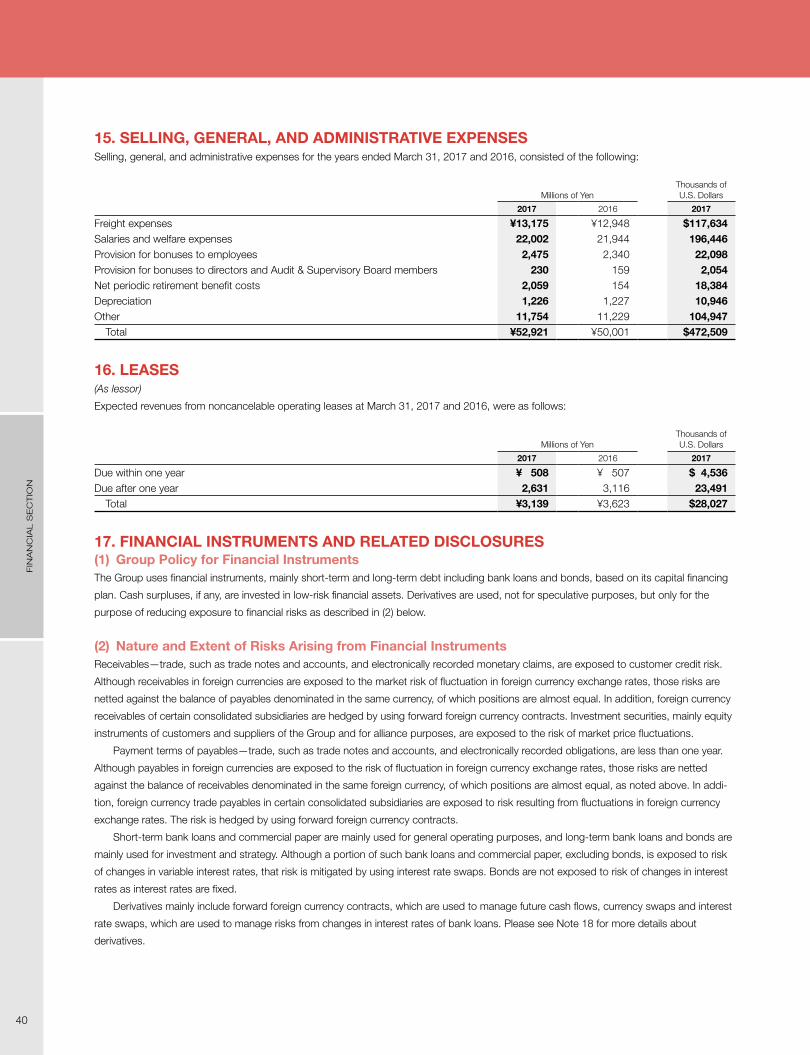
15. SELLING, GENERAL, AND ADMINISTRATIVE EXPENSESSelling, general, and administrative expenses for the years ended March 31, 2017 and 2016, consisted of the following:
Millions of YenThousands of U.S. Dollars
2017 2016 2017
Freight expenses ¥13,175 ¥12,948 $117,634Salaries and welfare expenses 22,002 21,944 196,446Provision for bonuses to employees 2,475 2,340 22,098Provision for bonuses to directors and Audit & Supervisory Board members 230 159 2,054Net periodic retirement benefit costs 2,059 154 18,384Depreciation 1,226 1,227 10,946Other 11,754 11,229 104,947
Total ¥52,921 ¥50,001 $472,509
16. LEASES(As lessor)
Expected revenues from noncancelable operating leases at March 31, 2017 and 2016, were as follows:
Millions of YenThousands of U.S. Dollars
2017 2016 2017
Due within one year ¥ 508 ¥ 507 $ 4,536Due after one year 2,631 3,116 23,491
Total ¥3,139 ¥3,623 $28,027
17. FINANCIAL INSTRUMENTS AND RELATED DISCLOSURES(1) Group Policy for Financial InstrumentsThe Group uses financial instruments, mainly short-term and long-term debt including bank loans and bonds, based on its capital financing
plan. Cash surpluses, if any, are invested in low-risk financial assets. Derivatives are used, not for speculative purposes, but only for the
purpose of reducing exposure to financial risks as described in (2) below.
(2) Nature and Extent of Risks Arising from Financial InstrumentsReceivables—trade, such as trade notes and accounts, and electronically recorded monetary claims, are exposed to customer credit risk.
Although receivables in foreign currencies are exposed to the market risk of fluctuation in foreign currency exchange rates, those risks are
netted against the balance of payables denominated in the same currency, of which positions are almost equal. In addition, foreign currency
receivables of certain consolidated subsidiaries are hedged by using forward foreign currency contracts. Investment securities, mainly equity
instruments of customers and suppliers of the Group and for alliance purposes, are exposed to the risk of market price fluctuations.
Payment terms of payables—trade, such as trade notes and accounts, and electronically recorded obligations, are less than one year.
Although payables in foreign currencies are exposed to the risk of fluctuation in foreign currency exchange rates, those risks are netted
against the balance of receivables denominated in the same foreign currency, of which positions are almost equal, as noted above. In addi-
tion, foreign currency trade payables in certain consolidated subsidiaries are exposed to risk resulting from fluctuations in foreign currency
exchange rates. The risk is hedged by using forward foreign currency contracts.
Short-term bank loans and commercial paper are mainly used for general operating purposes, and long-term bank loans and bonds are
mainly used for investment and strategy. Although a portion of such bank loans and commercial paper, excluding bonds, is exposed to risk
of changes in variable interest rates, that risk is mitigated by using interest rate swaps. Bonds are not exposed to risk of changes in interest
rates as interest rates are fixed.
Derivatives mainly include forward foreign currency contracts, which are used to manage future cash flows, currency swaps and interest
rate swaps, which are used to manage risks from changes in interest rates of bank loans. Please see Note 18 for more details about
derivatives.
FIN
AN
CIA
L S
EC
TIO
N
40

(3) Risk Management for Financial InstrumentsCredit Risk Management
Credit risk is the risk of economic loss arising from a counterparty’s failure to repay or service debt according to the contractual terms. The
Group manages its credit risk from receivables on the basis of internal guidelines, which include monitoring of payment terms and balances
of major customers by each business administration department to identify the default risk of customers at an early stage. To reduce the
counterparty risk, the Group enters into derivative transactions only with highly rated financial institutions. Please see Note 18 for detail
about derivatives.
The maximum credit risk exposure of financial assets is limited to their carrying amounts as of March 31, 2017.
Market Risk Management (Foreign Currency Exchange Rate Risk and Interest Rate Risk)
Foreign currency trade receivables and payables are exposed to market risk resulting from fluctuations in foreign currency exchange rates.
Such risk is netted against the balance of receivables and payables, of which positions are almost equal. In addition, certain consolidated
subsidiaries hedge such risk principally by using forward foreign currency contracts.
Interest rate swaps and currency swaps are used to manage exposure to risks of changes in interest rates of loan payables.
Investment securities are managed by monitoring market values and the financial position of issuers on a regular basis.
Derivative transactions of the Company are undertaken by the finance and accounting department and the procurement center and
reported to directors or the Board of Directors based on internal policies that prescribe the authority and maximum amount for each transac-
tion. Derivative transactions of consolidated subsidiaries are undertaken by the finance and accounting department based on internal
policies.
Liquidity Risk Management
The Group manages its liquidity risk by establishing a cash management plan according to reports from each department.
(4) Fair Values of Financial InstrumentsFair values of financial instruments are based on quoted prices in active markets. If quoted prices are not available, other rational valuation
techniques are used instead. Please see Note 18 for details of the fair value of derivatives.
(a) Fair value of financial instruments
March 31, 2017
Millions of Yen Thousands of U.S. Dollars
Carrying Amount Fair Value
Unrealized Gain (Loss)
Carrying Amount Fair Value
Unrealized Gain (Loss)
Cash and cash equivalents ¥ 33,686 ¥ 33,686 – $ 300,768 $ 300,768 –Time deposits 1,281 1,281 – 11,437 11,437 –Receivables—trade 113,215 113,215 – 1,010,848 1,010,848 –Investment securities 74,336 74,336 – 663,714 663,714 –Investment in an associated company 4,575 3,748 ¥(827) 40,848 33,464 $(7,384)
Total ¥227,093 ¥226,266 ¥(827) $2,027,615 $2,020,231 $(7,384)
Short-term bank loans ¥ 31,108 ¥ 31,108 – $ 277,750 $ 277,750 –Current portion of long-term debt 16,127 16,127 – 143,991 143,991 –Payables—trade 75,160 75,160 – 671,071 671,071 –Income taxes payable 4,636 4,636 – 41,393 41,393 –Long-term debt 94,979 94,730 ¥ 249 848,027 845,804 $ 2,223
Total ¥222,010 ¥221,761 ¥ 249 $1,982,232 $1,980,009 $ 2,223
FIN
AN
CIA
L S
EC
TIO
N
41
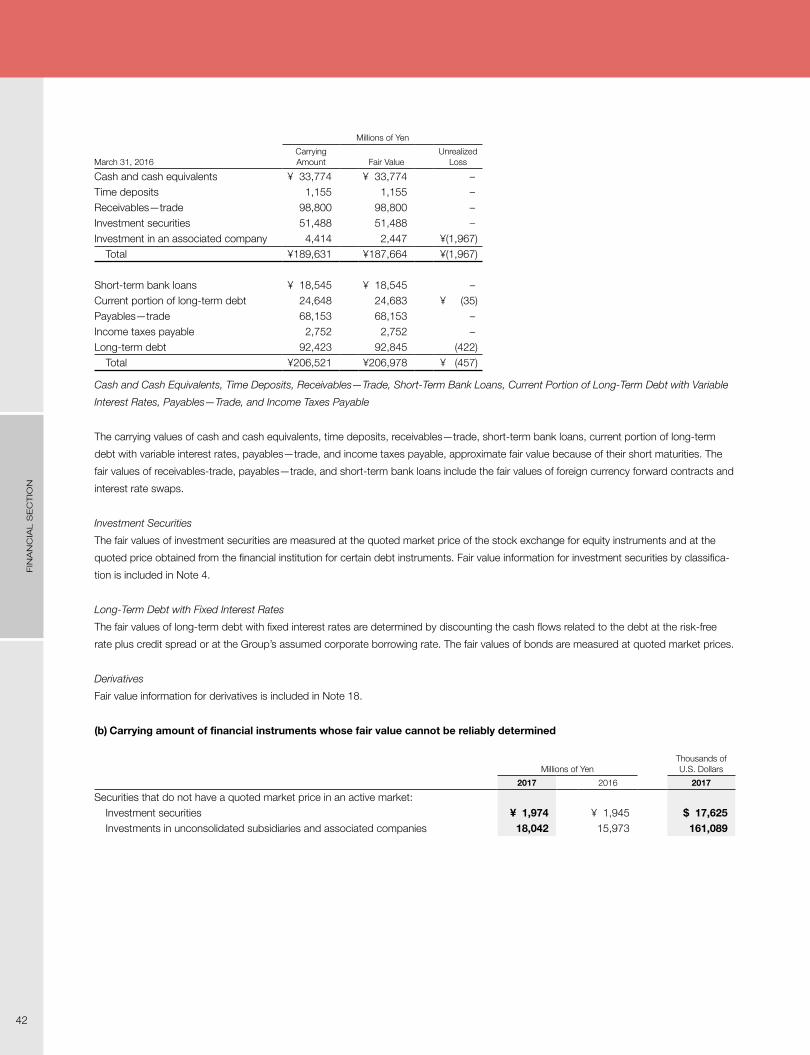
March 31, 2016
Millions of Yen
Carrying Amount Fair Value
Unrealized Loss
Cash and cash equivalents ¥ 33,774 ¥ 33,774 –Time deposits 1,155 1,155 –Receivables—trade 98,800 98,800 –Investment securities 51,488 51,488 –Investment in an associated company 4,414 2,447 ¥(1,967)
Total ¥189,631 ¥187,664 ¥(1,967)
Short-term bank loans ¥ 18,545 ¥ 18,545 –Current portion of long-term debt 24,648 24,683 ¥ (35)Payables—trade 68,153 68,153 –Income taxes payable 2,752 2,752 –Long-term debt 92,423 92,845 (422)
Total ¥206,521 ¥206,978 ¥ (457)
Cash and Cash Equivalents, Time Deposits, Receivables—Trade, Short-Term Bank Loans, Current Portion of Long-Term Debt with Variable
Interest Rates, Payables—Trade, and Income Taxes Payable
The carrying values of cash and cash equivalents, time deposits, receivables—trade, short-term bank loans, current portion of long-term
debt with variable interest rates, payables—trade, and income taxes payable, approximate fair value because of their short maturities. The
fair values of receivables-trade, payables—trade, and short-term bank loans include the fair values of foreign currency forward contracts and
interest rate swaps.
Investment Securities
The fair values of investment securities are measured at the quoted market price of the stock exchange for equity instruments and at the
quoted price obtained from the financial institution for certain debt instruments. Fair value information for investment securities by classifica-
tion is included in Note 4.
Long-Term Debt with Fixed Interest Rates
The fair values of long-term debt with fixed interest rates are determined by discounting the cash flows related to the debt at the risk-free
rate plus credit spread or at the Group’s assumed corporate borrowing rate. The fair values of bonds are measured at quoted market prices.
Derivatives
Fair value information for derivatives is included in Note 18.
(b) Carrying amount of financial instruments whose fair value cannot be reliably determined
Millions of YenThousands of U.S. Dollars
2017 2016 2017
Securities that do not have a quoted market price in an active market:Investment securities ¥ 1,974 ¥ 1,945 $ 17,625Investments in unconsolidated subsidiaries and associated companies 18,042 15,973 161,089
FIN
AN
CIA
L S
EC
TIO
N
42

(5) Maturity Analysis for Financial Assets and Securities with Contractual Maturities
March 31, 2017
Millions of Yen
Due in One Year or Less
Due after One Year through
Five Years
Due after Five Years through
10 YearsDue after 10 Years
Cash and cash equivalents ¥ 33,686 – – –Time deposits 1,281 – – –Receivable—trade 113,215 – – –Total ¥148,182 – – –
March 31, 2017
Thousands of U.S. Dollars
Due in One Year or Less
Due after One Year through
Five Years
Due after Five Years through
10 YearsDue after 10 Years
Cash and cash equivalents $ 300,768 – – –Time deposits 11,437 – – –Receivable—trade 1,010,848 – – –Total $1,323,053 – – –
Please see Note 8 for annual maturities of long-term debt and the current portion of long-term debt.
18. DERIVATIVESThe Group enters into foreign currency forward contracts, interest rate swaps, and currency swaps. The Group does not hold or issue deriv-
atives for trading or speculative purposes. Derivative transactions entered into by the Group have been made in accordance with internal
policies, which regulate hedging policy, authorization, credit limit, and reporting to management. Each derivative transaction is periodically
reported to management, which evaluates and analyzes the derivatives. To reduce the counterparty risk, the Group enters into the derivative
transactions only with highly rated financial institutions. The contract amounts of derivatives which are shown in the following table do not
measure the Group’s exposure to market risk. FIN
AN
CIA
L S
EC
TIO
N
43
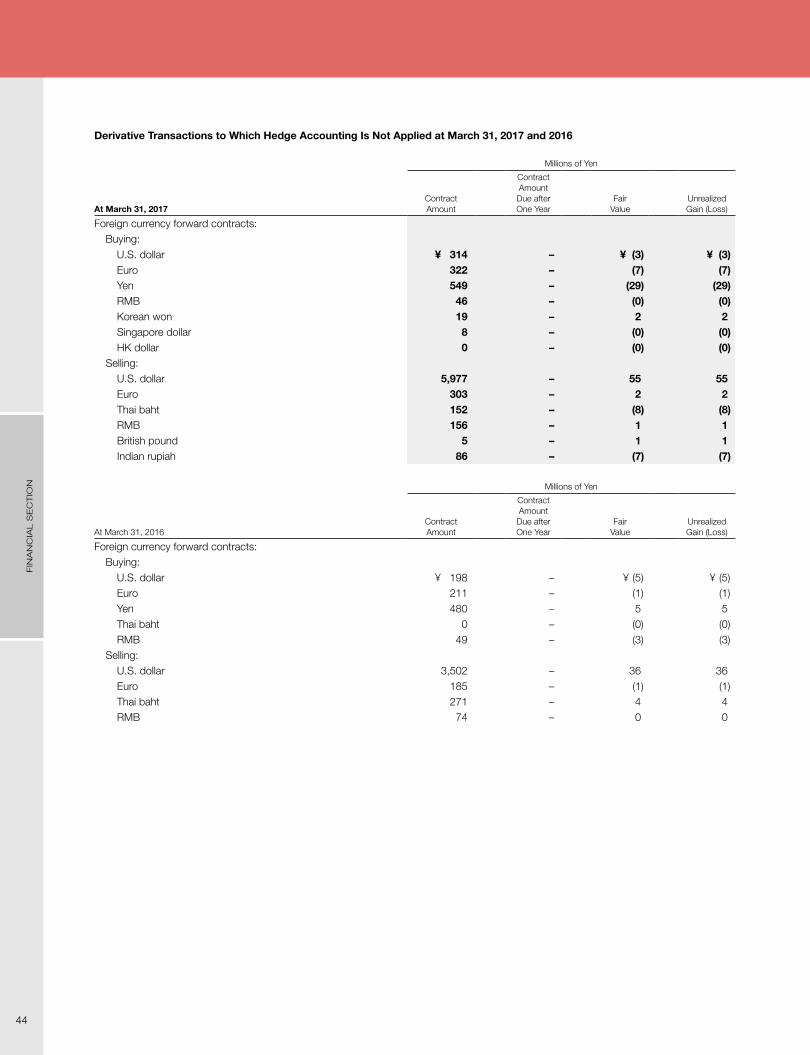
Derivative Transactions to Which Hedge Accounting Is Not Applied at March 31, 2017 and 2016
At March 31, 2017
Millions of Yen
Contract Amount
Contract Amount Due after One Year
Fair Value
Unrealized Gain (Loss)
Foreign currency forward contracts:Buying:
U.S. dollar ¥ 314 – ¥ (3) ¥ (3)Euro 322 – (7) (7)Yen 549 – (29) (29)RMB 46 – (0) (0)Korean won 19 – 2 2Singapore dollar 8 – (0) (0)HK dollar 0 – (0) (0)
Selling:U.S. dollar 5,977 – 55 55Euro 303 – 2 2Thai baht 152 – (8) (8)RMB 156 – 1 1British pound 5 – 1 1Indian rupiah 86 – (7) (7)
At March 31, 2016
Millions of Yen
Contract Amount
Contract Amount Due after One Year
Fair Value
Unrealized Gain (Loss)
Foreign currency forward contracts:Buying:
U.S. dollar ¥ 198 – ¥ (5) ¥ (5)Euro 211 – (1) (1)Yen 480 – 5 5Thai baht 0 – (0) (0)RMB 49 – (3) (3)
Selling:U.S. dollar 3,502 – 36 36Euro 185 – (1) (1)Thai baht 271 – 4 4RMB 74 – 0 0
FIN
AN
CIA
L S
EC
TIO
N
44

At March 31, 2017
Thousands of U.S. Dollars
Contract Amount
Contract Amount Due after One Year
Fair Value
Unrealized Gain (Loss)
Foreign currency forward contracts:Buying:
U.S. dollar $ 2,804 – $ (27) $ (27)Euro 2,875 – (63) (63)Yen 4,902 – (259) (259)RMB 411 – (0) (0)Korean won 170 – 18 18Singapore dollar 71 – (0) (0)HK dollar 0 – (0) (0)
Selling:U.S. dollar 53,366 – 491 491Euro 2,705 – 18 18Thai baht 1,357 – (71) (71)RMB 1,393 – 9 9British pound 45 – 9 9Indian rupiah 768 – (63) (63)
Derivative Transactions to Which Hedge Accounting Is Applied at March 31, 2017 and 2016
At March 31, 2017
Millions of Yen
Hedged ItemContract Amount
Contract Amount Due after One Year
Fair Value
Foreign currency forward contracts:Hedge accounting:
Selling:U.S. dollar Receivables—trade ¥ 443 – ¥2Euro Receivables—trade 15 – 0
Qualified for hedge accounting not remeasured at market value:Selling:
See Note on the
following page
U.S. dollar Receivables—trade 41 –Currency swaps:
Short-term bank loans and long-term debt
Yen payment, U.S. dollar receipt 5,500 ¥ 5,500Interest rate swaps:
Fixed rate payment, floating rate receipt 33,900 24,400
FIN
AN
CIA
L S
EC
TIO
N
45
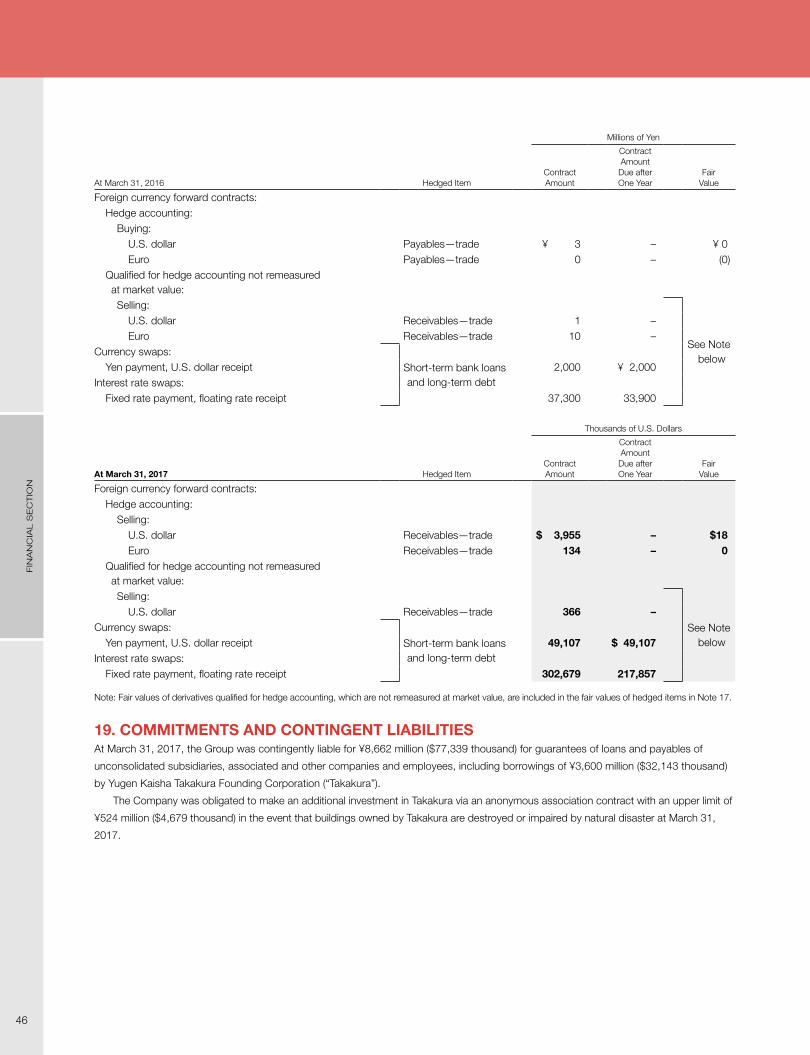
At March 31, 2016
Millions of Yen
Hedged ItemContract Amount
Contract Amount Due after One Year
Fair Value
Foreign currency forward contracts:Hedge accounting:
Buying:U.S. dollar Payables—trade ¥ 3 – ¥ 0Euro Payables—trade 0 – (0)
Qualified for hedge accounting not remeasured at market value:Selling:
See Note below
U.S. dollar Receivables—trade 1 –Euro Receivables—trade 10 –
Currency swaps:
Short-term bank loans and long-term debt
Yen payment, U.S. dollar receipt 2,000 ¥ 2,000Interest rate swaps:
Fixed rate payment, floating rate receipt 37,300 33,900
At March 31, 2017
Thousands of U.S. Dollars
Hedged ItemContract Amount
Contract Amount Due after One Year
Fair Value
Foreign currency forward contracts:Hedge accounting:
Selling:U.S. dollar Receivables—trade $ 3,955 – $18Euro Receivables—trade 134 – 0
Qualified for hedge accounting not remeasured at market value:Selling:
See Note below
U.S. dollar Receivables—trade 366 –Currency swaps:
Short-term bank loans and long-term debt
Yen payment, U.S. dollar receipt 49,107 $ 49,107Interest rate swaps:
Fixed rate payment, floating rate receipt 302,679 217,857
Note: Fair values of derivatives qualified for hedge accounting, which are not remeasured at market value, are included in the fair values of hedged items in Note 17.
19. COMMITMENTS AND CONTINGENT LIABILITIESAt March 31, 2017, the Group was contingently liable for ¥8,662 million ($77,339 thousand) for guarantees of loans and payables of
unconsolidated subsidiaries, associated and other companies and employees, including borrowings of ¥3,600 million ($32,143 thousand)
by Yugen Kaisha Takakura Founding Corporation (“Takakura”).
The Company was obligated to make an additional investment in Takakura via an anonymous association contract with an upper limit of
¥524 million ($4,679 thousand) in the event that buildings owned by Takakura are destroyed or impaired by natural disaster at March 31,
2017.
FIN
AN
CIA
L S
EC
TIO
N
46

20. OTHER COMPREHENSIVE INCOME (LOSS)The components of other comprehensive income (loss) for the years ended March 31, 2017 and 2016, were as follows:
Millions of YenThousands of U.S. Dollars
2017 2016 2017
Unrealized gain on available-for-sale securities:Gains (losses) arising during the year ¥10,422 ¥(17,029) $ 93,054Reclassification adjustments to profit or loss 7 (318) 63Amount before income tax effect 10,429 (17,347) 93,117
Income tax effect (3,090) 5,865 (27,590)
Total 7,339 (11,482) 65,527
Deferred gain on derivatives under hedge accounting:Gains (losses) arising during the year 2 (3) 18Reclassification adjustments to profit or loss – – –Amount before income tax effect 2 (3) 18Income tax effect (1) 1 (9)Total 1 (2) 9
Land revaluation surplus:Income tax effect – 62 –Total – 62 –
Foreign currency translation adjustments:Adjustments arising during the year (855) (1,699) (7,634)Total (855) (1,699) (7,634)
Defined retirement benefit plans:Adjustments arising during the year 6,508 (14,750) 58,107Reclassification adjustments to profit or loss 577 (1,486) 5,152Amount before income tax effect 7,085 (16,236) 63,259Income tax effect (2,219) 5,122 (19,813)Total 4,866 (11,114) 43,446
Share of other comprehensive income (loss) in associates:Gains (losses) arising during the year 42 (81) 375Reclassification adjustments to profit or loss (1) (0) (9)Total 41 (81) 366
Total other comprehensive income (loss) ¥11,392 ¥(24,316) $101,714
21. SUBSEQUENT EVENT
a. Appropriations of retained earningsThe following appropriation of retained earnings at March 31, 2017, was approved at the Company’s Shareholders’ Meeting held on June
28, 2017:
Millions of YenThousands of U.S. Dollars
Year-end cash dividends, ¥6.0 ($0.05) per share ¥2,558 $22,839
b. Share consolidation and change in the number of shares constituting one trading unitThe Company resolved on the share consolidation and partial amendment of the articles of incorporation to change the number of shares
constituting one trading unit at the Company’s Shareholders’ Meeting held on June 28, 2017.
FIN
AN
CIA
L S
EC
TIO
N
47

1. Purpose of share consolidation and change in the number of shares constituting one trading unit
Japanese stock exchanges are aiming to standardize the number of shares per trading unit at 100 shares. In recognition of this aim, the
Company will change its share trading unit size, the number of shares constituting one trading unit, from 1,000 shares to 100 shares. The
purpose of this share consolidation is to maintain the price of one trading unit of its stock at the same level after the number of shares con-
stituting one trading unit is reduced.
2. Details and timing of the share consolidation
The Company shall consolidate the shares on October 1, 2017 by a factor of 10 to 1 based on the shareholders registered on September
30, 2017.
The decrease in shares after the share consolidation will be as follows:
Number of issued shares before the share consolidation as of March 31, 2017 434,487,693 sharesDecrease in shares by the share consolidation 391,038,924 sharesNumber of issued shares after the share consolidation 43,448,769 shares
(Note) These are theoretical figures which are calculated by multiplying the number of issued shares before the share consolidation by the consolidation ratio.
3. Processing for a fraction of less than one share
If a fraction of less than one share is created due to share consolidation, such fractional shares will be sold together pursuant to the provi-
sions of the Companies Act, and the proceeds will be distributed to shareholders who held the fractional shares in proportion to the number
of fractional shares they held.
4. Change in the number of shares constituting one trading unit
The Company will change the number of shares per trading unit from 1,000 shares to 100 shares on October 1, 2017.
5. Change in the number of authorized shares
The number of authorized shares shall be changed from 1,160,000,000 shares to 116,000,000 after the share consolidation.
6. Schedule
Resolution at the Board of Directors’ meeting May 10, 2017Resolution at the Company’s Shareholders’ Meeting June 28, 2017Effective date of the share consolidation and the change in the number of shares per trading unit October 1, 2017
7. Effect on per share information
If the share consolidation was carried out at the beginning of the year ended March 31, 2016, per share information for the years ended
March 31, 2017 and 2016, is as follows:
Yen U.S. Dollars
2017 2016 2017
Net assets per share ¥6,094.74 ¥5,452.58 $54.42Basic net income per share 385.92 156.22 3.45
FIN
AN
CIA
L S
EC
TIO
N
48

22. SEGMENT INFORMATIONUnder ASBJ Statement No. 17, “Accounting Standard for Segment Information Disclosures,” and ASBJ Guidance No. 20, “Guidance on
Accounting Standard for Segment Information Disclosures,” an entity is required to report financial and descriptive information about its
reportable segments. Reportable segments are operating segments or aggregations of operating segments that meet specified criteria.
Operating segments are components of an entity about which separate financial information is available and such information is evaluated
regularly by the chief operating decision-maker in deciding how to allocate resources and in assessing performance. Generally, segment
information is required to be reported on the same basis as is used internally for evaluating operating segment performance and deciding
how to allocate resources to operating segments.
1. Description of reportable segmentsThe Group’s reportable segments are those for which separate financial information is available and regular evaluation by the Company’s
management is being performed in order to decide how resources are allocated among the Group.
The Group has business divisions based on the nature of its products and services. Each division draws up strategies and operates its
own business.
The Group consists of five industries: “Specialty Steel,” “High Performance Materials and Magnetic Materials,” “Parts for Automobile and
Industrial Equipment,” “Engineering,” and “Trading and Service.” “Specialty Steel” industry consists of manufacturing of specialty steel for
automotive and industrial machinery parts.
The “High Performance Materials and Magnetic Materials” industry consists of manufacturing of stainless steel, high alloy and magnetic
materials, titanium products and powder metals for automotive and industrial machinery, and electrical and electronic parts.
The “Parts for Automobile and Industrial Equipment” industry consists of manufacturing of die-forged parts, forging products, and other
products for automotive and industrial machinery parts.
The “Engineering” industry consists of manufacturing and maintenance of steelmaking and environmental equipment, industrial fur-
naces, and associated equipment.
The “Trading and Service” industry consists of real estate-related services and welfare and other services.
2. Methods of measurement for the amounts of sales, profit, assets, and other items for each reportable segment
The accounting policies of each reportable segment are consistent with those disclosed in Note 2, “SUMMARY OF SIGNIFICANT
ACCOUNTING POLICIES.”
Reportable segment profit represents operating income.
3. Information about sales, profit, assets, and other items is as follows:
2017
Millions of Yen
Reportable Segment
Reconciliations ConsolidatedSpecialty
Steel
High Performance Materials and
Magnetic Materials
Parts for Automobile
and Industrial Equipment Engineering
Trading and Service Total
Sales:
Sales to external customers ¥163,087 ¥148,468 ¥ 97,492 ¥23,918 ¥12,158 ¥445,123 – ¥445,123
Intersegment sales or transfers 65,879 15,027 22,839 1,670 11,889 117,304 ¥(117,304) –
Total ¥228,966 ¥163,495 ¥120,331 ¥25,588 ¥24,047 ¥562,427 ¥(117,304) ¥445,123
Segment profit (loss) ¥ 5,813 ¥ 17,417 ¥ (516) ¥ 1,219 ¥ 1,583 ¥ 25,516 ¥ (2) ¥ 25,514
Segment assets 198,352 177,788 127,249 18,143 16,613 538,145 36,024 574,169
Other:
Depreciation and amortization 7,642 7,667 6,598 289 1,080 23,276 – 23,276
Investments in associated companies accounted for by the equity method 4,946 5,109 433 126 – 10,614 468 11,082
Increase in property, plant, and equipment and intangible assets 7,528 9,844 10,503 273 793 28,941 – 28,941
FIN
AN
CIA
L S
EC
TIO
N
49
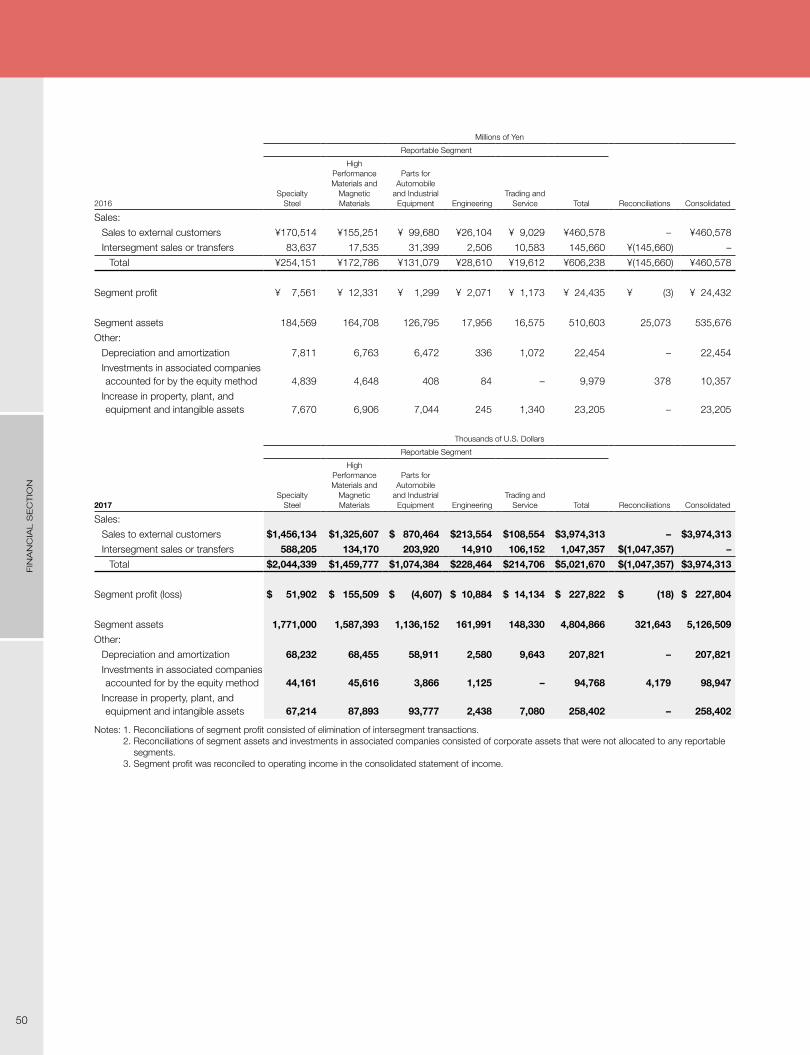
2016
Millions of Yen
Reportable Segment
Reconciliations ConsolidatedSpecialty
Steel
High Performance Materials and
Magnetic Materials
Parts for Automobile
and Industrial Equipment Engineering
Trading and Service Total
Sales:
Sales to external customers ¥170,514 ¥155,251 ¥ 99,680 ¥26,104 ¥ 9,029 ¥460,578 – ¥460,578
Intersegment sales or transfers 83,637 17,535 31,399 2,506 10,583 145,660 ¥(145,660) –
Total ¥254,151 ¥172,786 ¥131,079 ¥28,610 ¥19,612 ¥606,238 ¥(145,660) ¥460,578
Segment profit ¥ 7,561 ¥ 12,331 ¥ 1,299 ¥ 2,071 ¥ 1,173 ¥ 24,435 ¥ (3) ¥ 24,432
Segment assets 184,569 164,708 126,795 17,956 16,575 510,603 25,073 535,676
Other:
Depreciation and amortization 7,811 6,763 6,472 336 1,072 22,454 – 22,454
Investments in associated companies accounted for by the equity method 4,839 4,648 408 84 – 9,979 378 10,357
Increase in property, plant, and equipment and intangible assets 7,670 6,906 7,044 245 1,340 23,205 – 23,205
2017
Thousands of U.S. Dollars
Reportable Segment
Reconciliations ConsolidatedSpecialty
Steel
High Performance Materials and
Magnetic Materials
Parts for Automobile
and Industrial Equipment Engineering
Trading and Service Total
Sales:
Sales to external customers $1,456,134 $1,325,607 $ 870,464 $213,554 $108,554 $3,974,313 – $3,974,313
Intersegment sales or transfers 588,205 134,170 203,920 14,910 106,152 1,047,357 $(1,047,357) –
Total $2,044,339 $1,459,777 $1,074,384 $228,464 $214,706 $5,021,670 $(1,047,357) $3,974,313
Segment profit (loss) $ 51,902 $ 155,509 $ (4,607) $ 10,884 $ 14,134 $ 227,822 $ (18) $ 227,804
Segment assets 1,771,000 1,587,393 1,136,152 161,991 148,330 4,804,866 321,643 5,126,509
Other:
Depreciation and amortization 68,232 68,455 58,911 2,580 9,643 207,821 – 207,821
Investments in associated companies accounted for by the equity method 44,161 45,616 3,866 1,125 – 94,768 4,179 98,947
Increase in property, plant, and equipment and intangible assets 67,214 87,893 93,777 2,438 7,080 258,402 – 258,402
Notes: 1. Reconciliations of segment profit consisted of elimination of intersegment transactions. 2. Reconciliations of segment assets and investments in associated companies consisted of corporate assets that were not allocated to any reportable
segments. 3. Segment profit was reconciled to operating income in the consolidated statement of income.
FIN
AN
CIA
L S
EC
TIO
N
50

4. Associated information(1) Information about geographical areas
Sales
Millions of Yen
2017 Japan North America Asia Other Total
¥343,529 ¥19,266 ¥74,733 ¥7,595 ¥445,123
Millions of Yen
2016 Japan North America Asia Other Total
¥358,914 ¥20,793 ¥72,080 ¥8,791 ¥460,578
Thousands of U.S. Dollars
2017 Japan North America Asia Other Total
$3,067,223 $172,018 $667,259 $67,813 $3,974,313
(2) Information about impairment loss
2017
Millions of Yen
Specialty Steel
High Performance Materials and
Magnetic Materials
Parts for Automobile
and Industrial Equipment Engineering
Trading and Service Total
Impairment loss – ¥372 ¥1,585 – – ¥1,957
2016
Millions of Yen
Specialty Steel
High Performance Materials and
Magnetic Materials
Parts for Automobile
and Industrial Equipment Engineering
Trading and Service Total
Impairment loss ¥2,318 ¥1,527 ¥1,189 ¥128 ¥435 ¥5,597
2017
Thousands of U.S. Dollars
Specialty Steel
High Performance Materials and
Magnetic Materials
Parts for Automobile
and Industrial Equipment Engineering
Trading and Service Total
Impairment loss – $3,321 $14,152 – – $17,473
FIN
AN
CIA
L S
EC
TIO
N
51
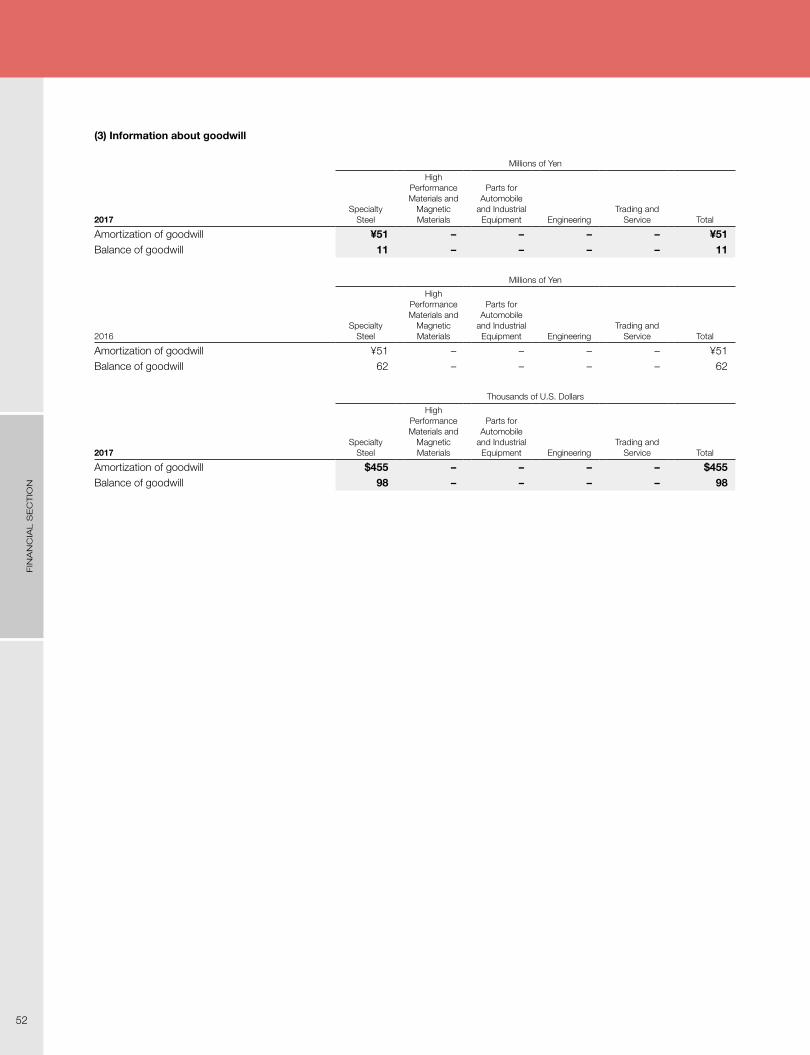
(3) Information about goodwill
2017
Millions of Yen
Specialty Steel
High Performance Materials and
Magnetic Materials
Parts for Automobile
and Industrial Equipment Engineering
Trading and Service Total
Amortization of goodwill ¥51 – – – – ¥51Balance of goodwill 11 – – – – 11
2016
Millions of Yen
Specialty Steel
High Performance Materials and
Magnetic Materials
Parts for Automobile
and Industrial Equipment Engineering
Trading and Service Total
Amortization of goodwill ¥51 – – – – ¥51Balance of goodwill 62 – – – – 62
2017
Thousands of U.S. Dollars
Specialty Steel
High Performance Materials and
Magnetic Materials
Parts for Automobile
and Industrial Equipment Engineering
Trading and Service Total
Amortization of goodwill $455 – – – – $455Balance of goodwill 98 – – – – 98
FIN
AN
CIA
L S
EC
TIO
N
52

INDEPENDENT AUDITOR’S REPORT
•
FIN
AN
CIA
L S
EC
TIO
N
53

DAIDO NETWORK
Offices & BranchesAddress Phone (Facsimile)
Head Office Urbannet Nagoya Building,1-10,
Higashisakura 1-chome,
Higashi-ku, Nagoya, Aichi
461-8581, Japan
81-52-963-7501
(81-52-963-4386)
Tokyo Head Office Daido Shinagawa Building, 6-35,
Konan 1-chome, Minato-ku,
Tokyo 108-8478, Japan
81-3-5495-1253
(81-3-5495-6733)
Osaka Branch Kogin Building, 1-1, Koraibashi
4-chome, Chuo-ku, Osaka 541-
0043, Japan
81-6-6229-6530
(81-6-6202-8663)
Fukuoka Sales Office 13-2, Tenjin 1-chome, Chuo-ku, Fukuoka 810-0001, Japan
81-92-771-4481
(81-92-771-9384)
Research Institute & PlantsDaido Corporate
Research &
Development Center
30, Daido-cho 2-chome,
Minami-ku, Nagoya, Aichi
457-8545, Japan
81-52-611-2522
(81-52-611-9004)
Chita Plant 39, Motohama-machi, Tokai, Aichi
477-0035, Japan
81-562-33-3101
(81-562-33-1570)
Chita
Forging Plant
81-562-33-7461
(81-562-33-1550)
Chita Steel
Strip Plant
81-562-33-7465
(81-562-33-1019)
Hoshizaki Plant 30, Daido-cho 2-chome,
Minami-ku, Nagoya, Aichi
457-8545, Japan
81-52-611-2512
(81-52-614-2492)
Shibukawa Plant 500, Ishihara, Shibukawa, Gunma
377-0007, Japan
81-279-25-2000
(81-279-25-2040)
Kawasaki Techno
Center
4-1, Yako 2-chome,
Kawasaki-ku, Kawasaki,
Kanagawa 210-0863, Japan
81-44-266-3760
(81-44-266-3768)
Tsukiji Techno Center 10, Ryugu-cho, Minato-ku,
Nagoya, Aichi 455-0022, Japan
81-52-691-5181
(81-52-691-5212)
Metal Powder Plant 81-52-691-5186
(81-52-691-5195)
Oji Plant 9-3, Kamiya 3-chome, Kita-ku,
Tokyo 115-0043, Japan
81-3-3901-4161
(81-3-3901-8211)
Kimitsu Plant 1, Kimitsu, Kimitsu, Chiba
299-1141, Japan
81-439-52-1541
(81-439-54-1280)
Takiharu Techno
Center
9, Takiharu-cho, Minami-ku,
Nagoya, Aichi 457-8712, Japan
81-52-613-6801
(81-52-613-6840)
Nakatsugawa
Techno Center
1642-144, Nasubigawa,
Nakatsugawa, Gifu
509-9132, Japan
81-573-68-6171
(81-573-68-6188)
Specialty SteelDAIDO PDM (Thailand) CO., LTD.
Daido Die & Mold Solutions Co., Ltd.
Daido Tienwen Steel Co., Ltd.
DAIDO AMISTAR (M) SDN. BHD.
DAIDO DMS SINGAPORE PTE. LTD.
Daido Shizai Service Co., Ltd.
Daido Technica Co., Ltd.
Daido EcoMet Co., Ltd.
Riken Seiko Co., Ltd.
Tohoku Steel Co., Ltd.
Maruta Transport Co., Ltd.
Sakurai Kosan Co., Ltd.
Izumi Denki Kogyo Co., Ltd.
Kawaichi Sangyo Co., Ltd.
High Performance Materials and Magnetic MaterialsNippon Seisen Co., Ltd.
THAI SEISEN Co., Ltd.
Daido Electronics Co., Ltd.
Daido Electronics (Suzhou) Co., Ltd.
Daido Electronics (Thailand) Co., Ltd.
Shimomura Tokushu Seiko Co., Ltd.
Nissei Seiko Co., Ltd.
Parts for Automobile and Industrial EquipmentDaido Castings Co., Ltd.
Fuji OOZX Inc.
FUJI VALVE (GUANGDONG) CORPORATION
Japan Drop Forge Co., Ltd.
Toyo Sangyo Co., Ltd.
Daido Star Techno Co., Ltd
Daido Precision Industries Ltd.
OHIO STAR FORGE CO.
EngineeringDaido Machinery Co., Ltd.
Daido Environment Engineering Co., Ltd.
Daido Plant Industries Co., Ltd.
Trading and ServiceDaido Kogyo Co., Ltd.
Daido Steel (Shanghai) Co., Ltd.
Daido Life Service Co., Ltd.
Daido Bunseki Research Inc.
Star Info Tech Co., Ltd.
Life Support Co., Ltd.
Kisokoma Heights Co., Ltd.
Daido Steel (America) Inc.
(As of March 31, 2017)
54
DA
IDO
NE
TW
OR
K

CORPORATE DATA (As of March 31, 2017)
Corporate Name: Daido Steel Co., Ltd.
Founded: August 19, 1916
Incorporated: February 1, 1950
Office: (Head Office)
Urbannet Nagoya Building, 1-10, Higashisakura 1-chome,
Higashi-ku, Nagoya, Aichi 461-8581, Japan
Phone: 81-52-963-7501
Facsimile: 81-52-963-4386
(Tokyo Head Office)
Daido Shinagawa Building, 6-35, Konan 1-chome,
Minato-ku, Tokyo 108-8478, Japan
Phone: 81-3-5495-1253
Facsimile: 81-3-5495-6733
Internet Address: http://www.daido.co.jp/en/index.html
Number of Employees
(Non-Consolidated): 3,258
Common Stock: ¥37,172 million
Number of Authorized Shares: 1,160,000,000
Number of Issued Shares: 434,487,693
Number of Shareholders: 21,450
Independent Auditor: Deloitte Touche Tohmatsu LLC
Stock Exchange Listings: Tokyo, Nagoya
Transfer Agent of Common Stock: The Chuo Mitsui Trust and Banking Company, Limited
Principal Shareholders: NIPPON STEEL & SUMITOMO METAL CORPORATION
Meiji Yasuda Life Insurance Company
Japan Trustee Services Bank, Ltd. (Trust Account)
Mizuho Bank, Ltd.
NHK Spring Co., Ltd.
The Bank of Tokyo-Mitsubishi UFJ, Ltd.
HONDA MOTOR CO., LTD.
The Master Trust Bank of Japan, Ltd. (Trust Account)
TOYOTA MOTOR CORPORATION
DENSO CORPORATION
For Further Information,
Please Contact: Investor Relations
(Head Office)
Phone: 81-52-963-7516
Facsimile: 81-52-963-4386
CO
RP
OR
AT
E D
AT
A
55
Printed in JapanThis annual report is printed on recycled paper.
DA
IDO
STE
EL C
O., LT
D. U
TILIZIN
G O
UR
STR
EN
GTH
S, A
IMIN
G AT FU
RTH
ER
GR
OW
TH A
NN
UA
L R
EP
OR
T 2
017
DA
IDO
STE
EL C
O., LT
D. U
TILIZIN
G O
UR
STR
EN
GTH
S, A
IMIN
G AT FU
RTH
ER
GR
OW
TH A
NN
UA
L R
EP
OR
T 2
017


