18
UTStarcom Holdings Corp. Investor Presentation NASDAQ: UTSI March 2017

UTStarcom Holdings Corp.
Investor Presentation NASDAQ: UTSI
March 2017

Disclosure & Forward Looking Statements
This investor presentation contains forward-looking statements, including statements
regarding the Company's expectation regarding its strategic initiatives and business
outlook. Forward-looking statements are based on current expectations, estimates,
forecasts and projections about the Company, the Company’s future performance
and the industries in which the Company operates as well as on the Company
management's assumptions and beliefs.
These forward-looking statements are only predictions and are subject to risks and
uncertainties that may cause actual results to differ materially and adversely from the
Company’s current expectations. These include risks and uncertainties related to,
among other things, changes in the financial condition and cash position of the
Company, changes in the composition of the Company’s management and their
effect on the Company, the Company’s ability to realize anticipated results of
operational improvements and benefits of the divestiture transaction, successfully
operate and grow its services business, execute its business plan and manage
regulatory matters, as well as the risk factors identified in the Company’s latest Annual
Report on Form 20-F, and Current Reports on Form 6-K, as filed with the Securities and
Exchange Commission. We undertake no obligation to update these forward-looking
statements to reflect events or circumstances occurring after the date of this investor
presentation. The Company is in a period of significant transition and the conduct of its
business is exposed to additional risks as a result.
2

Company’s Business Highlights
● Leading Technologies in Packet Optical Transport and SDN
● Innovative and customized solutions that help operators to reduce
opex/capex and quickly launch new services
● Long-term partnerships with global blue-chip carrier customers
● Best-in-class product quality attributable to proven R&D and in-house
manufacturing capabilities
● New growth market opportunities in Residential Gateway, Data Center,
and Smart City
3

Overview of Key Products
4
100G Packet Optical Transport Global spending on Carrier Ethernet Switches:
In 2013: $2.9B. By 2018: $3.7B (projected)
Worldwide carrier router and switch market to grow at
~2% CAGR from 2014 to 2019
● Nearly 20,000 nodes have been deployed.
● Flagship 100G TN765 field deployed in 2015
● New NG-PTN product line announced in 2015: higher
efficiency and advanced SDN-based features
● Integrated precise synchronization solution SyncRing –
2016
● Rich SDN functionality including L3VPN and uFlex BoD
Revolutionary SDN Platform Global spending on SDN:
In 2013: $1.5B. By 2018: $35.6B (projected)
Global carrier SDN and NFV hardware and software to
grow from less than $500 million in 2013 to over $11 billion
in 2018
● Layer3 VPN solution with SDN/NFV enabling – 2015
● Provisioning of pre-planned bandwidth on demand:
uFlex BoD – 2015
● At the forefront of SDN development: SOO SDN
controller launched in 2014 and POC completed in
2014
Virtual Broadband Gateway A new disruptive technology to compete on Residential
and Enterprise Gateway markets.
Global Residential Gateway market is forecasted to grow
at a CAGR of ~7.8% over the period 2014-2019.
Residential networking devices market size in 2014 ~$13.4B
● A technology that brings intelligence to customer’s
edge: service flexibility, high data rates and improved
quality of experience
● North America a primary target market
● Good potential to become an integral part of Smart
City infrastructure
Carrier Wi-Fi A swiftly growing market: The global carrier Wi-Fi
equipment market totaled $713 million in 2015, and is
forecast to reach $1.5 billion in 2020 – market size doubles
over 5 years.
● Carrier-class Wireless Controllers and network
management. Outdoor and indoor Access Points.
● Value Added Services including location-based
services, O2O, big data etc.
● Large potential in India and other developing markets
Sources: Infonetics, SDNCentral, Plexxi,, TechNavio, Crehan Research Inc. and Lightspeed Venture Partners

Product Portfolio
5
Packet Optical Transport Network
• MPLS-TP & CE
• Complete product family from Metro Access and Aggregation to Core Network
• Integrated precise synchronization solution
• Large scale deployments for Tier 1 telecos
Packet Optical Transport Broadband Access
Wireless BB access solution
• Complete Carrier-class Wi-Fi solution: AP & AC, AAA, Billing, Policy, QoS, Portal etc.
• Mobile data offloading
Fixed-line BB access solutions
• MSAN, EAD and FTTx PON
• Over 40M access lines deployed
SDN & Network Management
• SDN product Line: SOO (Software Defined Open Packet Optical) Network
• SOO Station: SDN Sub/Central Controller
• SOO Store/Design/Care: SDN Apps
• Automation, BoD, Centralized L3
Services
• Professional services: planning, deployment, maintenance, technical support, project management etc.
• Large-scale deployments for IP-DSLAM, MSTP, MSAN, PON & Packet Optical systems and networks
SIMPLE NETWORK, SIMPLE OPERATION
• Centralized network and element management solution
• Advanced GUI-based network management with end-to-end service provisioning
• High scalability and reliability
Open Platform:
Open Southbound
I/F managing 3rd
party systems
Open Northbound
CORBA I/F and API
for integration

Packet Optical Transport Product Portfolio
6
GE/1
0G
E E
co
syst
em
1
0G
E/1
00
GE E
co
syst
em
Core Aggregation Access CPE
SDN/NFV
SOO Network
Netman OMC-O
NMS
TN703A 64Gbps SW
GE/XGE
E1/STM-1
TN701B 10Gbps SW
GE SFP/RJ45
Indoor/Outdoor
1U
L2/3 L2/3
TN704A 136bps SW
GE/XGE
E1/STM-1
2U
TN765 960Gbps SW
1/10/100GE
10G POS
L2/3
9U
L2/3
100G
TN703C 6.4Gbps SW
FE/GE/E1 Indoor/Outdoor
TN703E 44Gbps SW
FE/GE/XGE E1/STM-1
TN701A 4.4Gbps SW
GE SFP/FE RJ45 Indoor/Outdoor
1U
TN705 88Gbps SW
2.5/10G POS FE/GE/XGE
E1/STM-1
3U
TN735 400Gbps SW
10GE/10G POS FE/GE
E1/STM-1
TN725 108Gbps SW
2.5/10G POS FE/GE/XGE
E1/STM-1
TN725E 176Gbps SW
FE/GE/XGE E1/STM-1
7U
18U
7U
1U
NG-PTN
PTN
* Development. Specs are subject to change
Network Intelligence
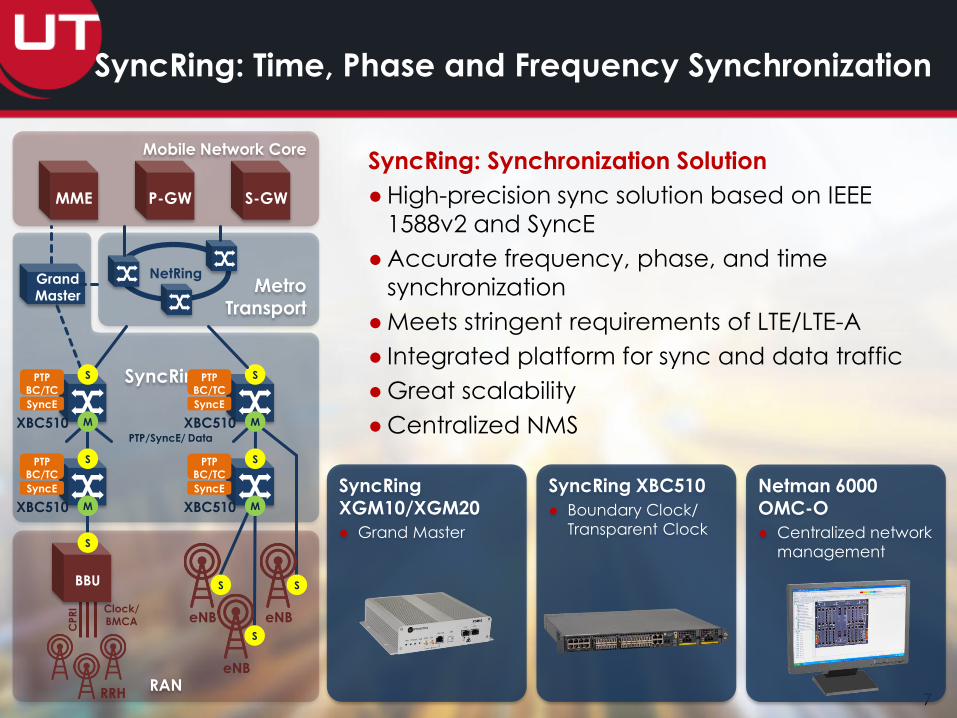
SyncRing: Time, Phase and Frequency Synchronization
SyncRing: Synchronization Solution
● High-precision sync solution based on IEEE
1588v2 and SyncE
● Accurate frequency, phase, and time
synchronization
● Meets stringent requirements of LTE/LTE-A
● Integrated platform for sync and data traffic
● Great scalability
● Centralized NMS
7
SyncRing XGM10/XGM20
● Grand Master
SyncRing XBC510
● Boundary Clock/
Transparent Clock
Netman 6000 OMC-O
● Centralized network
management
SyncRing
RAN RRH
CP
RI Clock/ BMCA
PTP BC/TC
SyncE
XBC510 M
S
eNB
S
PTP/SyncE/ Data
Mobile Network Core
MME P-GW S-GW
BBU
S
PTP BC/TC
SyncE
XBC510 M
S
PTP BC/TC
SyncE
XBC510 M
S
eNB
S
eNB
S
Metro
Transport
NetRing Grand Master
PTP BC/TC
SyncE
XBC510 M
S
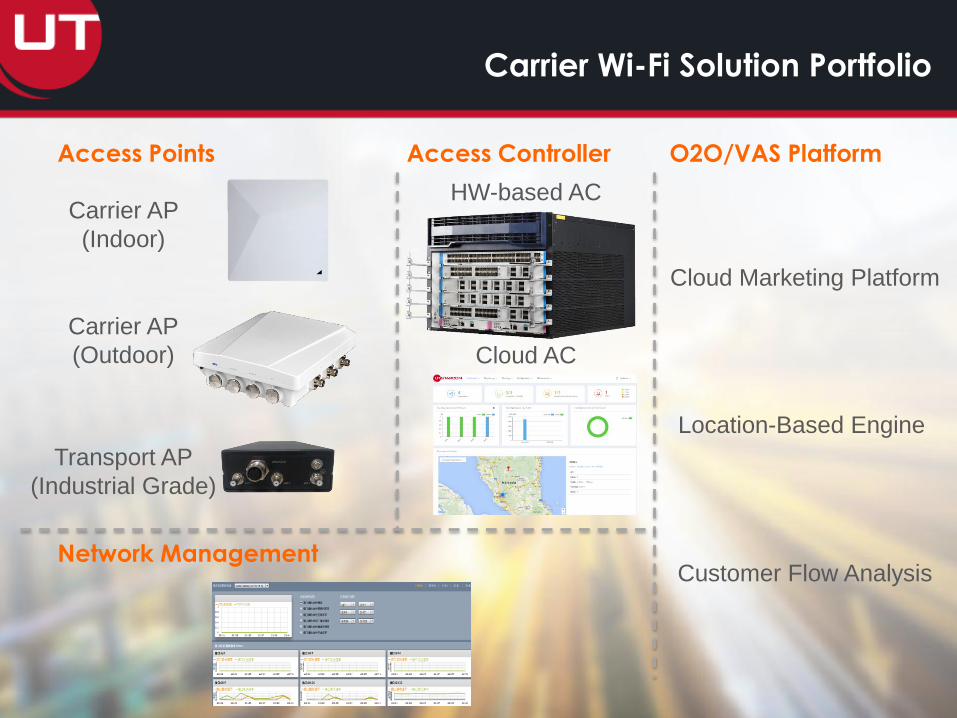
Carrier Wi-Fi Solution Portfolio
Location-Based Engine
HW-based AC
Cloud Marketing Platform
Customer Flow Analysis
Access Points Access Controller O2O/VAS Platform
Network Management
Carrier AP
(Indoor)
Carrier AP
(Outdoor)
Transport AP
(Industrial Grade)
Cloud AC

SOO Platform – Transport SDN
“SOO APP”: In-house/3rd party applications
● In house apps for customer/manager service
ordering, network design etc.
● Open & standard interface for 3rd party’s APPs
integration
“SOO Station”: SDN Controller
● Centralized SDN Controller
● Open APIs for vertical integration of applications
● End-to-end automated service provisioning
● Path computing and management
● Advanced services including Bandwidth on
Demand, L3VPN
“SOO Device”: SDN-ized Network Devices
● Controlled by SOO Station
● NetRing series PTN products
9
3rd Party
Apps
SDN Product Line: “SOO(Software Defined Open Packet Optical ) Network”

Outstanding Manufacturing &
Quality Assurance Capabilities
● Over 20 years manufacturing experience
● Focus on telecom equipment
● Comprehensive manufacturing capabilities: − From PCB Assembly To MEC Assembly To System Integration
− From NPI (New Products Introduction) To MP( Mass Production)
− SMT, THT (PTH), MEC Assembly, Micro BGA, CSP,0201
− BGA Rework and Re-Balling
● The highest quality standards, comprehensive
quality control − Comprehensive quality control process, certified by LRQA for ISO9001/14001, OHSAS 18001,QC080000
− Quality centric culture, implement “Kaizen” supervised by Japan customer and partner
− Field proven, hardware failure rate less than 0.05% per month
● Green, environment friendly, employee care
10
10
54
39
44
35
24
20
26
2930
3332
28
31
3737
45
31
27
21
34
40
48
57
25
36
42
49
46
38
29
45
38
3435
39
36384042
32
27
47
56
32
39
36
10
13
10 9
5
10
5
13
12
3
8
1413
8 8
46 7
11
8
11111210
1514
9 8
1210 9
1412
1919
1614
19
1515
121213 141211
18
0
5
10
15
20
25
30
35
40
45
50
55
60
Apr-05
May-05
Jun-05
Jul-05
Aug-05
Sep-05
Oct-05
Nov-05
Dec-05
Jan-06
Feb-06
Mar-06
Apr-06
May-06
Jun-06
Jul-06
Aug-06
Sep-06
Oct-06
Nov-06
Dec-06
Jan-07
Feb-07
Mar-07
Apr-07
May-07
Jun-07
Jul-07
Aug-07
Sep-07
Oct-07
Nov-07
Dec-07
Jan-08
Feb-08
Mar-08
Apr-08
May-08
Jun-08
Jul-08
Aug-08
Sep-08
Oct-08
Nov-08
Dec-08
Jan-09
Feb-09
0.00
0.05
0.10
0.15
0.20
CISCO故障件数 UTS故障件数 CISCO故障率 UTS故障率
10 10

Multiple Customers Worldwide including Tier-1 Carriers
Japan
● Softbank
● NEC
● SONET
India – ~ 35% broadband market share
● BNSL
● Bharti
● TATA
● Reliance
● MTNL
Korea
● HanaNTS
Latvia
● LMT
11
Taiwan
• Taiwan Chunghwa Telecom
• TW Mobile
Southeast Asia
• Telkomsel, Indonesia
• Sri Lanka Telecom
• Bhutan Telecom
• Nepal Telecom
Brazil
• NEC
USA
• In pursuit of US residential gateway
market
Virtual Gateway Labs (VGL)
Overview
● Founded in 2015, VGL develops next generation products that allow seamless access and
aggregation at the edge of the network
Products
● VGL offers broadband gateway products that implement the next generation deployment model by which the communication provider and the municipality would be deploying a base service network to provide bandwidth and emergency supports. Additional services such as TV
programming, home monitoring, etc., will be deployed and can be offered by a third party vendor without being handled by the offering carrier, which typically aims at 3rd tier to some 2nd tier local and regional carriers
● Home gateway deployment: a simple Active Ethernet outdoor-mountable gateway with SFP-based 1G optical Ethernet uplink with 4 x 10/100 RJ-45 down links. The unit also supports 2xVoIP FXS ports for land line home phones. The gateway is powered by a battery backup pack and a
12V DC power source
Market Opportunity
● VGL’s platform will help fuel tomorrow’s open access network when broadband will be more than just the Internet, and offering a new variety of virtual services including:
− Emergency communications
− Interactive entertainment
− Home automation
− Smart grid
− Connected sensor systems
12

* Source: IHS Carrier WiFi report 2016
** Source: Global Market Insights Inc., Report ID: GMI198, Wi-Fi Hotspot Market … 2016 – 2023
*** Source: Maravedis, Cisco VNI, 2016
Carrier Wi-Fi Market
Carrier Wi-Fi market
● Kept growing since 2007. The global carrier Wi-Fi equipment
market totaled $713 million in 2015, and is forecast to reach $1.5
billion in 2020.*
● Swift growth in number of Wi-Fi hotspots. Wi-Fi hotspot market
size was valued over USD 1.5 billion in 2015 and is likely to reach
around USD 3.5 billion by 2023, growing over 17%.*
● North America, particularly the U.S. Wi-Fi hotspot market size is
estimated to exhibit considerable growth over the forecast
period.** Asia Pacific Leads with 37 Percent Hotspots Worldwide
by 2020.***
● Growing perception of Carrier-grade Wi-Fi value. Carrier-grade
hotspot are going overtake best effort by 2017-2018
Market Opportunity
● UTStarcom’s Carrier Wi-Fi platform offers
full solution for operators including
wireless access infrastructure and value-
added services platform for more
monetization opportunities. Target
market segments:
− Public hotspots
− Venues
− Education
− Transport
− Enterprise
● Priority markets: India, USA
Global Public Wi-Fi
Hotspots***
Smart City Market Opportunities
Smart City
● ICT – vital enabling element of
the Smart City concept
● Requires 100% broadband
penetration both fixed line
and wireless
● Assumes convergence of
Telecom and IT infrastructure:
− Internet access
− Broadband services
− Telecom services
− Data services
− Cloud services
− Security, VPN, Firewall
− Big data analytics
− IoT, M2M
14
Impact as related to UT business
● 100% broadband
Penetration
● 100% wireless
coverage (4/5G, Wi-
Fi)
● More traffic
● IoT, M2M
● IPv6
● Growing need for
NG-PTN metro
network
● Wide use of data
centers
● Need for large
volumes of DC
Switches
● SDN Network
● SDN Experiences
can bring many
benefits
● Municipal
Management
system (MMS)
● High availability and
scalability NMS

Non-GAAP Financial Overview
15
Revenue in $M Gross Margin Percentage
Operating Expenses in $M Net Income (Loss) in $M
32.4
16.7
26.8 25.7 22.3
20.0
16.4
21.2
0
5
10
15
20
25
30
35
2015
Q1
2015
Q2
2015
Q3
2015
Q4
2016
Q1
2016
Q2
2016
Q3
2016
Q4
14.9% 16.2%
22.8%
30.6% 27.2%
41.2%
24.4%
32.0%
0.0%
10.0%
20.0%
30.0%
40.0%
50.0%
2015
Q1
2015
Q2
2015
Q3
2015
Q4
2016
Q1
2016
Q2
2016
Q3
2016
Q4
7.8
11.7
6.7
5.1
6.6 6.4 5.1 5.6
0.0
2.0
4.0
6.0
8.0
10.0
12.0
14.0
2015
Q1
2015
Q2
2015
Q3
2015
Q4
2016
Q1
2016
Q2
2016
Q3
2016
Q4
-5.2
-0.9
-4.8
-14.7
0.3
5.5
-1.5 -1.0
-40.0
-30.0
-20.0
-10.0
-
10.0
20.0
2015
Q1
2015
Q2
2015
Q3
2015
Q4
2016
Q1
2016
Q2
2016
Q3
2016
Q4

Outlook
Q1 2017 Non-GAAP revenue in the range of $18 million - $22 million
Major revenue contributors:
• PTN Products
• SyncRing
16

Investor Relations Contacts
For investor and media inquiries, please contact:
UTStarcom Holdings Corp.
Tel: +852-3951-9757
Fei Wang, IR Director
Email: [email protected]
Ning Jiang, Investor Relations
Email: [email protected]
The Blueshirt Group
Ralph Fong
Tel: +1 (415) 489-2195
Email: [email protected]
17

Thank you!


