Page 1
Car
ollo
Tem
plat
eWat
erW
ave.
pptx
UV Disinfection and Landfill Leachate- a Troublesome
Combination
PNCWA Conference 2012 October 24, 2012
Session 22A
Pierce County Andrew Perez, Amanda Summers, River Wan, and Robert Lowe
Carollo Engineers
Andrew Salveson, Brian Matson, Karl Hadler, Nitin Goel, Alena Bennett, and Morayo Noibi
Page 2
Car
ollo
Tem
plat
eWat
erW
ave.
pptx
Project Background
• Chambers Creek WWTP undergoing UV disinfection improvements
• New UV System: 57 mgd
• Design UVT: 56%
Page 3
Car
ollo
Tem
plat
eWat
erW
ave.
pptx
Why is UVT Important?
$-
$80,000
$160,000
$240,000
$-
$500,000
$1,000,000
$1,500,000
47 57 67 77
An
nu
al O
per
atin
g C
ost
Lam
p C
ost
UVT, %
Capital Cost
Operating Cost
Page 4
Car
ollo
Tem
plat
eWat
erW
ave.
pptx
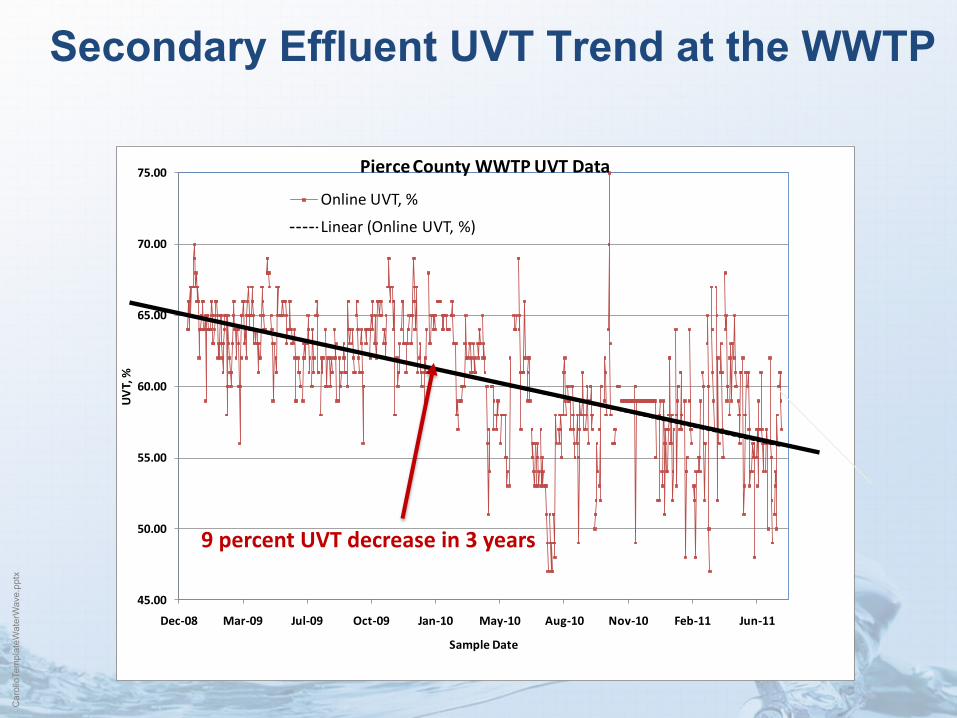
45.00
50.00
55.00
60.00
65.00
70.00
75.00
Dec-‐08 Mar-‐09 Jul-‐09 Oct-‐09 Jan-‐10 May-‐10 Aug-‐10 Nov-‐10 Feb-‐11 Jun-‐11
UVT, %
Sample Date
Pierce County WWTP UVT Data
Online UVT, %
Linear (Online UVT, %)
9 percent UVT decrease in 3 years
Secondary Effluent UVT Trend at the WWTP
Page 5
Car
ollo
Tem
plat
eWat
erW
ave.
pptx
What is the suspected culprit of this downward trend?
Page 6
Car
ollo
Tem
plat
eWat
erW
ave.
pptx
• Carollo was hired to evaluate leachate properties and alternate treatment methods to reduce UVT impacts and secondary effluent
Leachate Treatment at the WWTP
Flow
Average Leachate Flow to WWTP
30,000 gpd (treated at landfill)
Permitted Leachate Flow to WWTP
60,000 gpd
Bypass Leachate Flow to WWTP
Up to 100,000 gpd (mostly untreated)
Page 7
Car
ollo
Tem
plat
eWat
erW
ave.
pptx
What is the effect of Leachate on Operating and Capital Costs at the WWTP?
Current Operational
Conditions Conditions without
Leachate
Design Conditions
Ultraviolet Transmission (%) 56 65
Number of Operating Channels 6 6
Number of Operating Banks per Channel 2 2
Total Number of Operating Lamps 768 480
Lamp Cost $1,777,200 $1,110,700
Operating Conditions
Ultraviolet Transmission (%) 59 68
Total Power Consumed (kW) 134 92
Number of Lamp Changes/year 187 140
Annual Energy Cost (@ $0.055/kW-hr) $58,800 $40,500
Annual Cost of Lamp Changes (@$250 per lamp) $46,700 $35,000 Total Annual Energy and Lamp Maintenance Cost $105,500 $75,500
Page 8
Car
ollo
Tem
plat
eWat
erW
ave.
pptx
Literature Review
Page 9
Car
ollo
Tem
plat
eWat
erW
ave.
pptx
What Constitutes Leachate?
Organic Acids
Oxygenated/Heteroatomic hydrocarbons
Halogenated Hydrocarbons
Organic Bases
Aromatic Hydrocarbons
Aliphatic Hydrocarbons
• Leachate organic component: Up to 75% Humic Acids
• Humic Acids are pigmented polymers that absorb light
Page 10
Car
ollo
Tem
plat
eWat
erW
ave.
pptx
Why aren’t the Humic Acids removed at the Landfill’s Treatment Plant?
Precipitated Solids (e.g. suspended solids, metals)
Coagulation Tank
Leachate
Ferric Chloride
Coagulation Tank
Sodium Hydroxide
Coagulation Tank
Anionic Polymer
Solids Separator
pH adjustment
Sulfuric Acid
Bio-tower
Phosphoric nutrients
Leachate to WWTP
Page 11
Car
ollo
Tem
plat
eWat
erW
ave.
pptx
Why aren’t the Humic Acids removed at the WWTP?
Page 12
Car
ollo
Tem
plat
eWat
erW
ave.
pptx
Landfill Leachate Biodegradability
0
0.1
0.2
0.3
0.4
0.5
0.6
Municipal Wastewater
Young (<5 yrs) Mature (5-10 yrs) Old (>10yrs)
Ave
rag
e B
OD
to
CO
D r
atio
of
Lea
chat
e
Landfill Age
Page 13
Car
ollo
Tem
plat
eWat
erW
ave.
pptx
Leachate Impact
Assessment
Page 14
Car
ollo
Tem
plat
eWat
erW
ave.
pptx
How does Leachate Affect the WWTP UVT?
0
5
10
15
20
25
30
35
40
45
50
55
0.000 0.002 0.004 0.006 0.008 0.010 0.012 0.014 0.016 0.018
UV
T, %
Dilution of leachate in secondary effluent (vol./vol.)
Untreated Leachate
Treated Leachate
Bypass Leachate
Secondary effluent
Page 15
Car
ollo
Tem
plat
eWat
erW
ave.
pptx
How does Leachate Treatment at the Landfill Affect WWTP UVT?
0
5
10
15
20
25
30
35
40
45
50
0.0017 0.0023 0.0156
UV
T, %
Leachate dilution in secondary effluent (vol./vol.)
Untreated Leachate
Treated Leachate
Page 16
Car
ollo
Tem
plat
eWat
erW
ave.
pptx
Literature Review-
Alternate Leachate Treatment Methods
Page 17
Car
ollo
Tem
plat
eWat
erW
ave.
pptx
Landfill Leachate Treatment Methods
Advanced Oxidation Processes
• Ozonation
• TiO2 Photo-Catalytic Oxidation
• H2O2-O3 Treatment
• Ferrate
Physical Treatment Processes
• Powdered Activated Carbon
• Reverse Osmosis
• Nano-Filtration
Page 18
Car
ollo
Tem
plat
eWat
erW
ave.
pptx
How do the Treatment Methods Compare?
Technology/ Application
Ozone TiO2- Photo-
catalysis Peroxide Ferrate PACT®
Adsorption Membranes
Full-scale applications Yes No No No Yes Yes
Dose 0.2g /gCOD 6g /gCOD 0.7g H2O2/gCOD and 0.05g Fe+2/
gCOD
0.7g Fe+6 /gCOD NA 120 Bar
Change in Biodegradability 400% increase 57% increase 63% increase
200% increase
ND- Final values are
non-detects 72% increase
Color Removal 90% 90% ND ND Observed visually
Observed visually
UVT Increase 30% (Dose: 0.6g/gCOD) ND ND ND ND 89% increase
COD Removal 60% 70% (Dose: 7g/gCOD) Up to 50%
70% (Dose: 0.7g/gCOD) 97% 99%
Byproducts/Residue No No No Yes Yes Yes, recycled to Landfill, or incinerated.
Page 19
Car
ollo
Tem
plat
eWat
erW
ave.
pptx
How do the Treatment Methods Compare?
Technology/ Application
Ozone TiO2- Photo-
catalysis Peroxide Ferrate PACT®
Adsorption Membranes
Full-scale applications Yes No No No Yes Yes
Dose 0.2g /gCOD 6g /gCOD 0.7g H2O2/gCOD and 0.05g Fe+2/
gCOD
0.7g Fe+6 /gCOD NA 120 Bar
Change in Biodegradability 400% increase 57% increase 63% increase
200% increase
ND- Final values are
non-detects 72% increase
Color Removal 90% 90% ND ND Observed visually
Observed visually
UVT Increase 30% (Dose: 0.6g/gCOD) ND ND ND ND 89% increase
COD Removal 60% 70% (Dose: 7g/gCOD) Up to 50%
70% (Dose: 0.7g/gCOD) 97% 99%
Byproducts/Residue No No No Yes Yes Yes, recycled to Landfill, or incinerated.
Page 20
Car
ollo
Tem
plat
eWat
erW
ave.
pptx
Results of Benchtop Tests
Page 21
Car
ollo
Tem
plat
eWat
erW
ave.
pptx
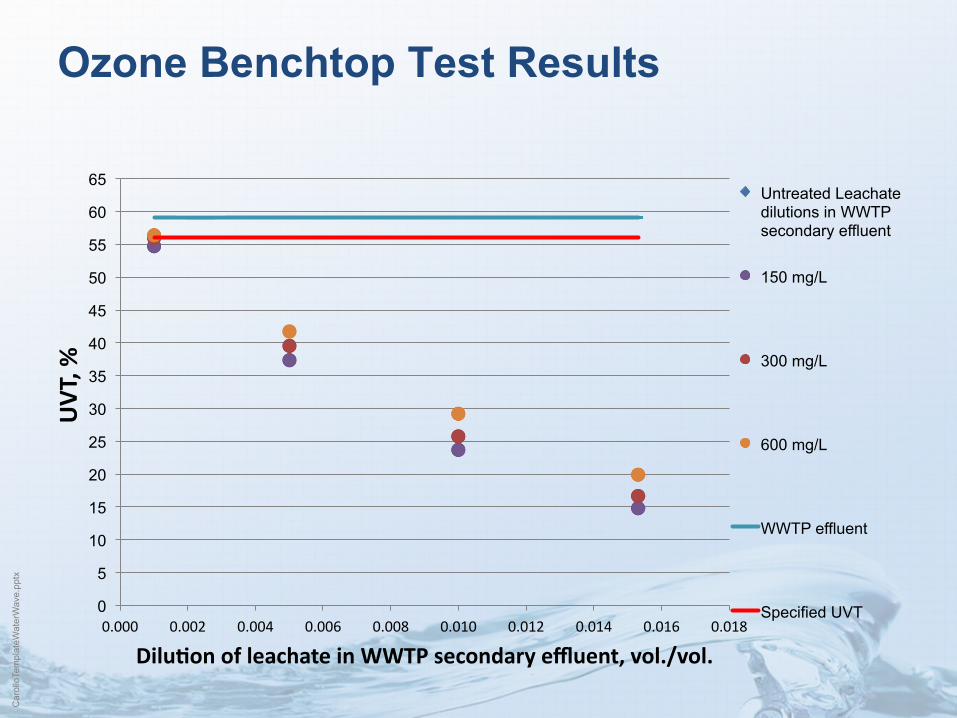
Ozone Benchtop Test Results
0
5
10
15
20
25
30
35
40
45
50
55
60
65
0.000 0.002 0.004 0.006 0.008 0.010 0.012 0.014 0.016 0.018
UVT, %
Dilu7on of leachate in WWTP secondary effluent, vol./vol.
Untreated Leachate dilutions in WWTP secondary effluent
WWTP effluent
Specified UVT
Page 22
Car
ollo
Tem
plat
eWat
erW
ave.
pptx
Ozone Benchtop Test Results
0
5
10
15
20
25
30
35
40
45
50
55
60
65
0.000 0.002 0.004 0.006 0.008 0.010 0.012 0.014 0.016 0.018
UVT, %
Dilu7on of leachate in WWTP secondary effluent, vol./vol.
Untreated Leachate dilutions in WWTP secondary effluent
150 mg/L
WWTP effluent
Specified UVT
Page 23
Car
ollo
Tem
plat
eWat
erW
ave.
pptx
Ozone Benchtop Test Results
0
5
10
15
20
25
30
35
40
45
50
55
60
65
0.000 0.002 0.004 0.006 0.008 0.010 0.012 0.014 0.016 0.018
UVT, %
Dilu7on of leachate in WWTP secondary effluent, vol./vol.
Untreated Leachate dilutions in WWTP secondary effluent
150 mg/L
300 mg/L
WWTP effluent
Specified UVT
Page 24
Car
ollo
Tem
plat
eWat
erW
ave.
pptx
Ozone Benchtop Test Results
0
5
10
15
20
25
30
35
40
45
50
55
60
65
0.000 0.002 0.004 0.006 0.008 0.010 0.012 0.014 0.016 0.018
UVT, %
Dilu7on of leachate in WWTP secondary effluent, vol./vol.
Untreated Leachate dilutions in WWTP secondary effluent
150 mg/L
300 mg/L
600 mg/L
WWTP effluent
Specified UVT
Page 25
Car
ollo
Tem
plat
eWat
erW
ave.
pptx
Ozone Benchtop Test Results
0
5
10
15
20
25
30
35
40
45
50
55
60
65
0.000 0.002 0.004 0.006 0.008 0.010 0.012 0.014 0.016 0.018
UVT, %
Dilu7on of leachate in WWTP secondary effluent, vol./vol.
Untreated Leachate dilutions in WWTP secondary effluent
150 mg/L
300 mg/L
600 mg/L
900 mg/L
WWTP effluent
Specified UVT
Page 26
Car
ollo
Tem
plat
eWat
erW
ave.
pptx
Ozone Benchtop Test Results
0
5
10
15
20
25
30
35
40
45
50
55
60
65
0.000 0.002 0.004 0.006 0.008 0.010 0.012 0.014 0.016 0.018
UVT, %
Dilu7on of leachate in WWTP secondary effluent, vol./vol.
Untreated Leachate dilutions in WWTP secondary effluent
150 mg/L
300 mg/L
600 mg/L
900 mg/L
1200 mg/L
WWTP effluent
Specified UVT
Page 27
Car
ollo
Tem
plat
eWat
erW
ave.
pptx
Ozone Benchtop Test Samples
Page 28
Car
ollo
Tem
plat
eWat
erW
ave.
pptx
Membrane Benchtop Test Results- Reverse Osmosis
0
10
20
30
40
50
60
70
80
40
45
50
55
60
65
70
75
80
0 100 200 300 400 500 600 700 800 900
Rec
ove
ry, %
UV
T, %
Pressure, psig
UVT, % Recovery, %
Page 29
Car
ollo
Tem
plat
eWat
erW
ave.
pptx
Membrane Benchtop Test Results- Nanofiltration
0
10
20
30
40
50
60
70
70
72
74
76
78
80
82
84
0 100 200 300 400 500 600
Rec
ove
ry, %
UV
T, %
Pressure, psig
Average UVT, % Recovery, %
Page 30
Car
ollo
Tem
plat
eWat
erW
ave.
pptx
Membrane Benchtop Test Samples
Secondary effluent and untreated leachate
Secondary effluent and treated leachate
Page 31
Car
ollo
Tem
plat
eWat
erW
ave.
pptx
Planning Level Cost Analysis
Page 32
Car
ollo
Tem
plat
eWat
erW
ave.
pptx
Equipment Costs of Tested Technologies
$0
$500,000
$1,000,000
$1,500,000
$2,000,000
$2,500,000 30,000 gpd
60,000 gpd
Page 33
Car
ollo
Tem
plat
eWat
erW
ave.
pptx
Annual Operating Costs of Tested Technologies
$0
$100,000
$200,000
$300,000
$400,000
$500,000
$600,000
Current Cost to WWTP
Ozonation- LOX System
Ozonation- PSA System
Reverse Osmosis
Nanofiltration
30,000 gpd
60,000 gpd
Page 34
Car
ollo
Tem
plat
eWat
erW
ave.
pptx
Summary and Conclusion
Page 35
Car
ollo
Tem
plat
eWat
erW
ave.
pptx
Conclusions
• Leachate discharge reduces the WWTP UVT by up to 9%, regardless of landfill treatment
• Lower UVT results in approximately: – $666,000 of additional UV equipment cost; – $30,000/yr of additional energy and lamp maintenance
cost
• Current treatment at the landfill is not effective in removing or reducing humic acids- the low UVT and non-biodegradable component of leachate
Page 36
Car
ollo
Tem
plat
eWat
erW
ave.
pptx
Conclusions
• Benchtop testing of Ozone, RO and NF technologies have shown that these technologies can substantially increase leachate UVT
• Leachate pre-treatment cost via Ozone, RO and NF >> NPV of treatment at current conditions
• If low (<56%) plant UVT levels continue, the newly installed UV equipment will not provide a sufficient dose to achieve disinfection
• Providing leachate pre-treatment may be required for WWTP to meet NPDES permit requirements
Page 37
Car
ollo
Tem
plat
eWat
erW
ave.
pptx
Next Steps
• Set up of pretreatment regulation based on cost impacts of reduced UVT
• Carollo and Pierce County worked together to model reduction in UVT impact, based on volume of leachate received
Page 38
Car
ollo
Tem
plat
eWat
erW
ave.
pptx
Contact:
Morayo Noibi
[email protected]
Questions?
Page 39
Car
ollo
Tem
plat
eWat
erW
ave.
pptx
References
• Landfill Leachate photo retrieved online, 10/18/12 http://mikedavidsonent.com/newsite/?p=226
• U.S.EPA, 1995. Manual: Groundwater and Leachate Treatment Systems. Office of Research and Development, Washington, DC, 20460.
• Renou, S., Givaudan .J.G., Poulain, S., Dirassouyan, F., Moulin, P. (2008). Landfill leachate treatment: Review and opportunity. Journal of Hazardous Materials 150 (2008) 468-493.
• Livens, F.R., 1991. Chemical-reactions of metals with humic material. Environ. Pollut., 70(3): 183-208.
• Patoczka, Jurek PhD, PE, 2005. UV Disinfection of Low Transmittance Pharmaceutical Wastewater. Disinfection 2005.
• Petruzzelli, D., Boghetich, G., Petrella, M., Dell’erba, A., L’abbate, P., Sanarica, S., Miraglia, M. Pre-Treatment of Industrial Landfill Leachate by Fenton’s Oxidation. Global NEST Journal, Vol 9, No 1, pp 51-56, 2007.
• Wang, F., Smith, D.W., El-Din, M.G., Application of advanced oxidation methods for landfill leachate treatment, J. Environ. Eng. Sci. 2 (2003) 413–427.
• Wu, J., Wu, C., Ma, H., Chang, C., Treatment of landfill leachate by ozone-based advanced oxidation processes. Chemosphere 54 (2004) 997–1003.
Page 40
Car
ollo
Tem
plat
eWat
erW
ave.
pptx
References
• Meeroff, D., Bloetscher, F., Reddy, D., Gasnier, F., Jain, S., McBarnette, A., Hamaguchi, H.
• Application of photochemical technologies for treatment of landfill leachate. Journal of Hazardous Materials. Volumes 209–210, 30 March 2012, Pages 299–307.
• Reinhart, D. Long-Term Disposal and Treatment of Landfill Leachate. Department of Civil and Environmental Engineering, University of Central Florida. July, 2005.
• Siemens, Landfill Leachate Treatment Using the PACT® System. 2006. http://www.water.siemens.com/SiteCollectionDocuments/Product_Lines/Zimpro/Brochures/ZP-LCH-BR-1206.pdf
• Rochem.Treatment of Landfill Leachate by Membrane Filtration. Retrieved online, March 2012. http://www.sotecnisol.pt/resources/Ambiente/ROCHEM_Landfill.pdf
Page 41
Car
ollo
Tem
plat
eWat
erW
ave.
pptx
Acknowledgements
• Pierce County
• Rochem
• APTWater
Page 42
Car
ollo
Tem
plat
eWat
erW
ave.
pptx
Ozone bench-top test
0
5
10
15
20
25
30
35
40
45
50
55
60
65
0.000 0.002 0.004 0.006 0.008 0.010 0.012 0.014 0.016 0.018
UVT, %
Dilu7on of leachate in WWTP secondary effluent, vol./vol.
Untreated Leachate dilutions in WWTP secondary effluent
150 mg/L
300 mg/L
600 mg/L
900 mg/L
1200 mg/L
WWTP effluent
Specified UVT