88
V. The Vulnerability Sourcebook Annex
V.The Vulnerability Sourcebook Annex

V
A
N
N
E
X
Content
1
2
3
4
1. Template for the implementation plan for
vulnerability assessments (VA implementation plan) 2
VA implementation plan: general information and scope 2
VA implementation plan: knowledge 3
VA implementation plan: resources and partners 4
VA implementation plan: processes and external developments 5
VA implementation plan: objectives and scope 6
VA implementation plan: schedule and responsibilities 7
2. Sample impact chains 8
Sample impact chain for the agriculture sector
(as used in a vulnerability assessment in Burundi) 8
Sample impact chain for the impact ‘change in mortality
caused by malaria’ (as used in a vulnerability assessment in Burundi) 9
Sample impact chain of a trans-boundary vulnerability
assessment on the potential impact ‘change in water availability’ 10
Sample impact chain of a trans-boundary vulnerability
assessment on the potential impact ‘change in area covered by forest’ 11
Sample impact chain of a trans-boundary vulnerability
assessment on the potential impact ‘change in area covered by wetlands’ 12
Sample impact chain of a trans-boundary vulnerability assessment
on the potential impact ‘change in water available for agricultural production’ 13
3. Selected indicators for vulnerability assessments 14
Sample indicators for vulnerability assessments 14
Indicators from the vulnerability assessment for Germany 15
4. Examples for adaptive capacity indicators 17

V
A
N
N
E
X
6
5
8
9
10
7
11
5. Examples for gender-sensitive indicators 19
6. Indicator factsheet 21
Template indicator factsheets 21
Sample indicator factsheets 22
7. Examples for evaluation of indicators 25
Example 1: evaluation of the ‘crop type’ indicator 25
Example 2: evaluation of the ‘population density’ indicator 26
Example 3: evaluation of the ‘degree of slope‘ indicator 27
Example 4: evaluation of the ‘vegetation cover’ indicator 28
Example 5: evaluation of the ‘household income’ indicator 29
8. Excel template for aggregating indicators of exposure,
sensitivity, adaptive capacity and vulnerability components 30
9. Sample structure of a vulnerability assessment report 32
10. Applying the Vulnerability Sourcebook:
vulnerability assessment in Khyber Pakhtunkhwa, Pakistan 35
List of contents: 36
Background of the VA 36
Applying of the Vulnerability Sourcebook in Pakistan 37
Preparing the vulnerability assessment (Module 1) 38
Developing an impact chain (Module 2) 47
Identification of indicators and methods for quantification (Module 3 to 5) 49
Aggregating indicators and vulnerability components (Module 6 and 7) 53
Outcomes of the vulnerability assessment 55
Annex 57
11. Applying the Vulnerability Sourcebook: vulnerability assessment
of smallholder farmers in the community of Chullcu Mayu, Bolivia 59
List of contents: 60
Preparing the vulnerability assessment (Module 1) 60
Developing an impact chain (Module 2) 64
Assessment methodology (Module 3-7) 66
Outcomes of the vulnerability assessment (Module 8) 77

2
1V
A
N
N
E
X
1
1. Template for the implementation plan for vulnerability assessment (VA implementation plan)
VA implementation plan: general information and scope
Excel sheet available online at:
https://gc21.giz.de/ibt/var/app/wp342deP/1443/index.php/knowledge/vulnerability-
assessment/sourcebook-vulnerability/
Title of the VA
Objectives
Thematic scope
(Tentative) Title of your vulnerability assessment
Describe the general objective of your VA (Module 1; Step 2):• Which specific process shall be supported?• What is the information gap?• Who is the target audience?
Describe the specific topic of your VA (Module 1; Step 3):• What exactly is your vulnerability assessment about?
Vulnerability assessment implementation plan
General information
Context Describe the general context of your VA (Module 1; Step 1) in terms of:• What are related processes? • What knowledge is already available? • Which institutions play a role?• What resources are available? • Which external developments are important?
Expected outcomes Describe the expected outcome of your VA (Module 1; Step 2): • How shall the results of your VA be presented?
Scope of the vulnerability assessment
Already identified im-pacts / vulnerabilities
Possibly refer to potential climate impacts that shall be addressed in the VA (Module 1; Step 3):• Do you already have potential climate impacts and vulnerabilities in mind?
Geographical scope Describe the spatial scope of your vulnerability assessment (Module 1; Step 3) • What is the geographical scope of your assessment?
Temporal scope Describe the temporal scope of your VA (Module 1; Step 3): • What is the time period addressed in the assessment?
Methodological approach
Outline the methods foreseen for the assessment (Module 1; Step 3):• What are the right methods for your VA?
Source: adelphi/EURAC 2014.

3
V
A
N
N
E
X
1
VA implementation plan: knowledge
Excel sheet available online at:
https://gc21.giz.de/ibt/var/app/wp342deP/1443/index.php/knowledge/vulnerability-
assessment/sourcebook-vulnerability/
Study 1
Study 2
Study 3
Study 4
Study 5
Study 6
Study 7
Study 8
Study 9
Study 10
Existing studies and information
Date of publication
Existing knowledge (Module 1; Step 1)
Scope / Sector of study
Key informa-tion / Impacts
Knowledge gaps
Remarks
Vulnerability assessment implementation plan
Source: adelphi/EURAC 2014.
4
A
N
N
E
X
1
V
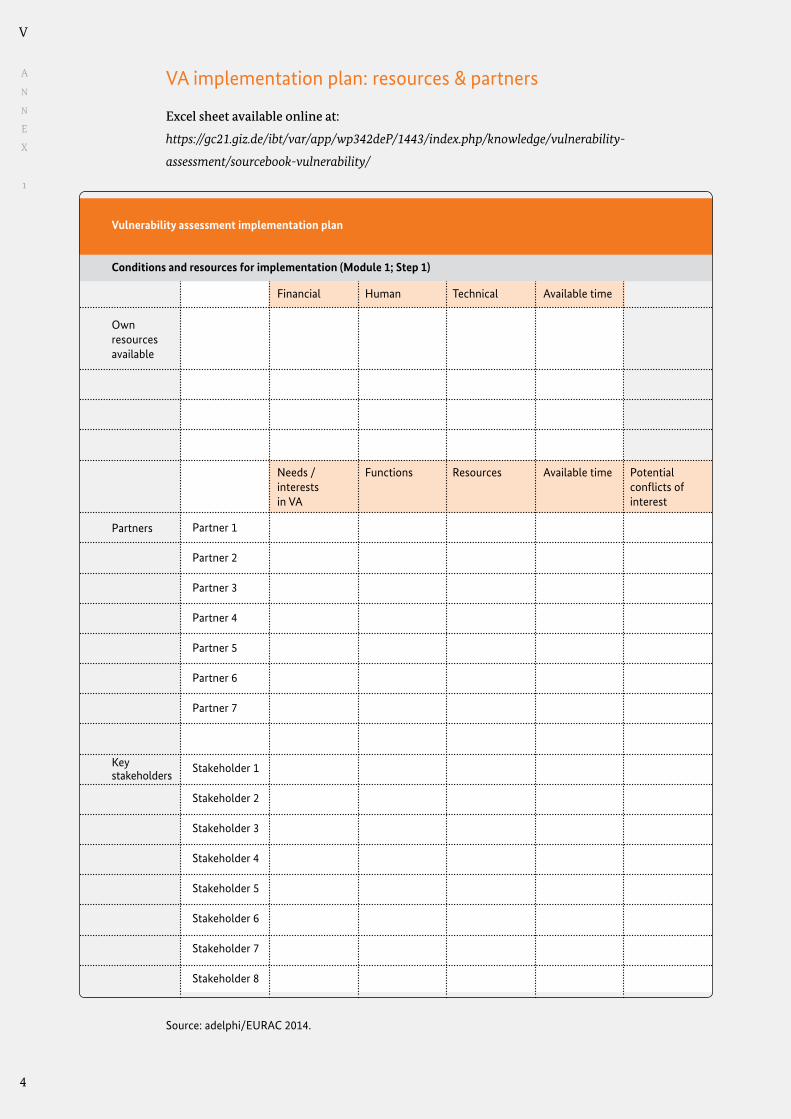
VA implementation plan: resources & partners
Excel sheet available online at:
https://gc21.giz.de/ibt/var/app/wp342deP/1443/index.php/knowledge/vulnerability-
assessment/sourcebook-vulnerability/
Own resources available
Vulnerability assessment implementation plan
Needs / interests in VA
Functions Resources Available time Potential conflicts of interest
Conditions and resources for implementation (Module 1; Step 1)
Financial Human Technical Available time
Key stakeholders
Partners Partner 1
Partner 2
Partner 3
Partner 4
Partner 5
Partner 6
Partner 7
Stakeholder 1
Stakeholder 2
Stakeholder 3
Stakeholder 4
Stakeholder 5
Stakeholder 6
Stakeholder 7
Stakeholder 8
Source: adelphi/EURAC 2014.

5
V
A
N
N
E
X
1
VA implementation plan: processes & external developments
Excel Sheet available online at:
https://gc21.giz.de/ibt/var/app/wp342deP/1443/index.php/knowledge/vulnerability-
assessment/sourcebook-vulnerability/
Vulnerability Assessment Implementation Plan
Processes and External Developments (Module 1; Step 1)
Key Goals Possible Synergies/Overlaps
Remarks
External developments
National Adaptation Plan
Process 2
Process 3
Process 4
Process 5
Process 6
Process 7
Process 8
External Development 1
External Development 2
External Development 3
External Development 4
External Development 5
External Development 6
External Development 7
External Development 8
Related processes in the field of adaptation
Influence on the Subject of the VA
Remarks
Source: adelphi/EURAC 2014.
6
V
A
N
N
E
X
1
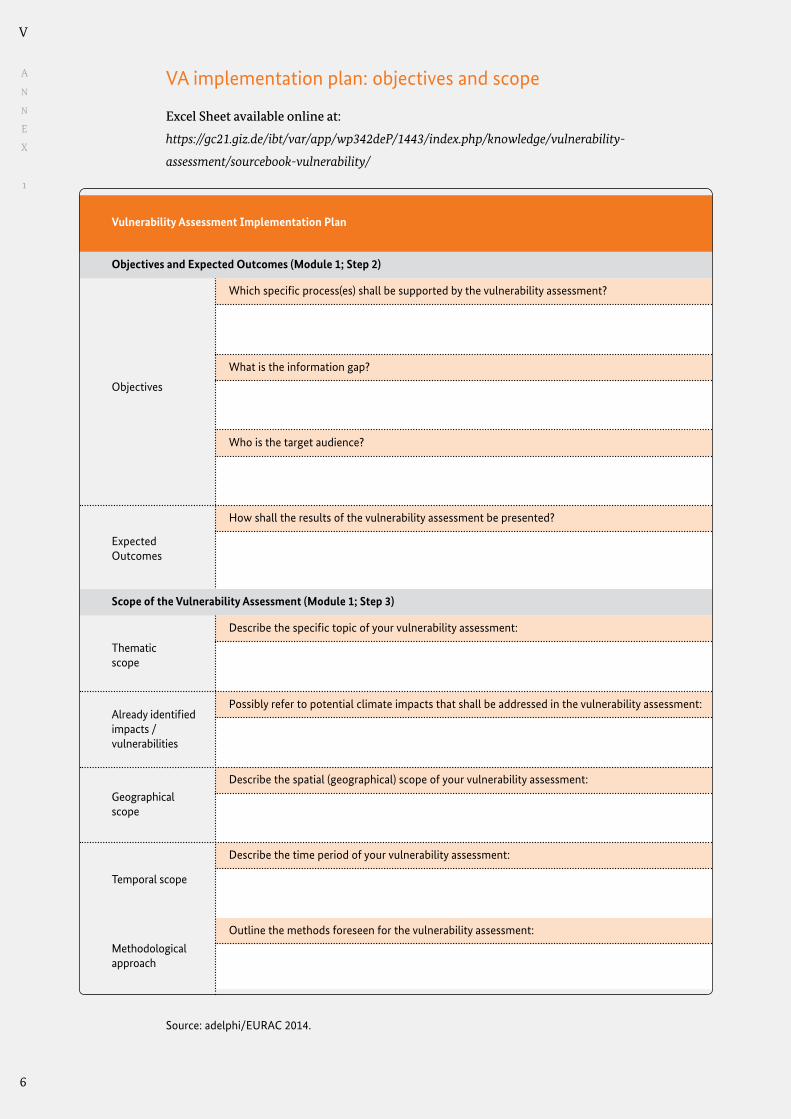
VA implementation plan: objectives and scope
Excel Sheet available online at:
https://gc21.giz.de/ibt/var/app/wp342deP/1443/index.php/knowledge/vulnerability-
assessment/sourcebook-vulnerability/
Objectives
Vulnerability Assessment Implementation Plan
Which specific process(es) shall be supported by the vulnerability assessment?
Thematic scope
Already identified impacts / vulnerabilities
Geographical scope
Temporal scope
Methodological approach
Expected Outcomes
What is the information gap?
Who is the target audience?
How shall the results of the vulnerability assessment be presented?
Describe the specific topic of your vulnerability assessment:
Possibly refer to potential climate impacts that shall be addressed in the vulnerability assessment:
Describe the spatial (geographical) scope of your vulnerability assessment:
Describe the time period of your vulnerability assessment:
Outline the methods foreseen for the vulnerability assessment:
Scope of the Vulnerability Assessment (Module 1; Step 3)
Objectives and Expected Outcomes (Module 1; Step 2)
Source: adelphi/EURAC 2014.

7
V
A
N
N
E
X
1
VA implementation plan: schedule and responsibilities
Excel Sheet available online at:
https://gc21.giz.de/ibt/var/app/wp342deP/1443/index.php/knowledge/vulnerability-
assessment/sourcebook-vulnerability/
Step 1: Understand the context of the VA
Step 2: Identifiy objectives and outcomes
Step 3: Determine scope of the VA
Step 4: Prepare VA imple-mentation plan
Task
Stat
us
Dat
e
Resp
onsi
ble
Part
ies
invo
lved
Inpu
t/Re
sour
ces
Out
put
Mon
th 1
Mon
th 2
Mon
th 3
Mon
th 4
...
Vulnerability Assessment Implementation Plan
Task
Stat
us
Dat
e
Resp
onsi
ble
Part
ies
invo
lved
Inpu
t/Re
sour
ces
Out
put
Mon
th 1
Mon
th 2
Mon
th 3
Mon
th 4
...
#
1.1
1.2
1.3
1.4
Step 1: Identify potential impacts
Step 2: Determine exposure
Step 3: Determine sensitivity
Step 4: Determine adaptive Capacity
Step 5: Optional - brainstorm adap-tation measure
#
2.1
2.2
2.3
2.4
2.5
Module 2: Developing impact chains Time plan
Module 1: Preparing your vulnerability assessment Time plan
Activity & Time plan
Source: adelphi/EURAC 2014.

8
V
A
N
N
E
X
2
22. Sample impact chains
Sample impact chain for the agriculture sector (as used in a vulnerability assessment in Burundi)
Extreme weather eventsTemperture Precipitation
Capacity of rivers and tributaries
Vulnerability of agricultural
production
Anti-erosion measures
Irrigation system
Defor-estation
Crop types
Slope gradient
Use of agricultural techniques
Population density
Soil type
Vegetation coverage
FloodsWater available from precipitation
Water stress of plants
Bush fire
Vermin stress for plants
Waterquality
Land-slides
Soil fertility
Exposure factor
Sensitivity factor
Adaptive Capacity factor
Intermediate impact
Potential Impact
Dimension and access to cultivation areas
Financial resources of households
Access to agricul-tural techniques
Availability of prevention meas-
ures against erosion and droughts
Access to weather forcasts
Access to agricultural training institutions
Ressources and Technologies
Availability of Information
Institutions and Governance
Changes in agricultural
production
Evapotranspiration
Erosion
Vegetation coverage
Source: adelphi/EURAC 2014.

9
V
A
N
N
E
X
2
Sample impact chain for the impact ‘change in mortality caused by malaria’ (as used in a vulnerability assessment in Burundi)
Temperture Precipitation
Vulnerability against changes
in malaria induced mortality
Water quality
Exposure factor
Sensitivity factor
Adaptive Capacity factor
Intermediate impact
Potential Impact
Ressources to the prevention of
malaria
Ressources and Technologies
Availability of Information
Institutions and Governance
Change in mortality by
malaria
Anaemia
Public health situation
Agepattern
Sensitivity to malaria
Spread of plasmodium
falsiparum
Knowledge of malaria treatment
and prevention
Access to healthcare
facilities
Soil type
Vegetation coverage
Coverage with water/marsh
areas
Spread of Anopheles
mosquitos
Altitude
Source: adelphi/EURAC 2014.

10
V
A
N
N
E
X
2
Source: adelphi/EURAC 2014.
Sample impact chain of a trans-boundary vulnerability assessment on the potential impact ‘change in water availability’
Precipitation
Vulnerability
Potential Impact:Change in water
availability
Rate of water reuse/desalination
Water governance
Run-offRecharge
of groundwater
EvapotranspirationSoil moisture
Temperature Share of renewable/
fossil water resources and desalinated water
Land Use Land Cover
Population density
Water consumption per capita
HDI
Exposure Sensitivity
Adaptive Capacity
Water storage capacities
GDP per capita

11
V
A
N
N
E
X
2
Source: adelphi/EURAC 2014.
Sample impact chain of a trans-boundary vulnerability assessment on the potential impact ‘change in area covered by forest’
Precipitation
Vulnerability
Potential Impact:Change in area
covered by forest
GDP per capita
HDI
Run-offRecharge
of groundwater
Soil moisture
Temperature Soil type
Land Use Land Cover
Vegetation degradation
Share of forest area
Human pressure
Environmental governance
Exposure Sensitivity
Adaptive Capacity
Evapotranspiration
Forest area under protection
12
V
A
N
N
E
X
2
Source: adelphi/EURAC 2014.
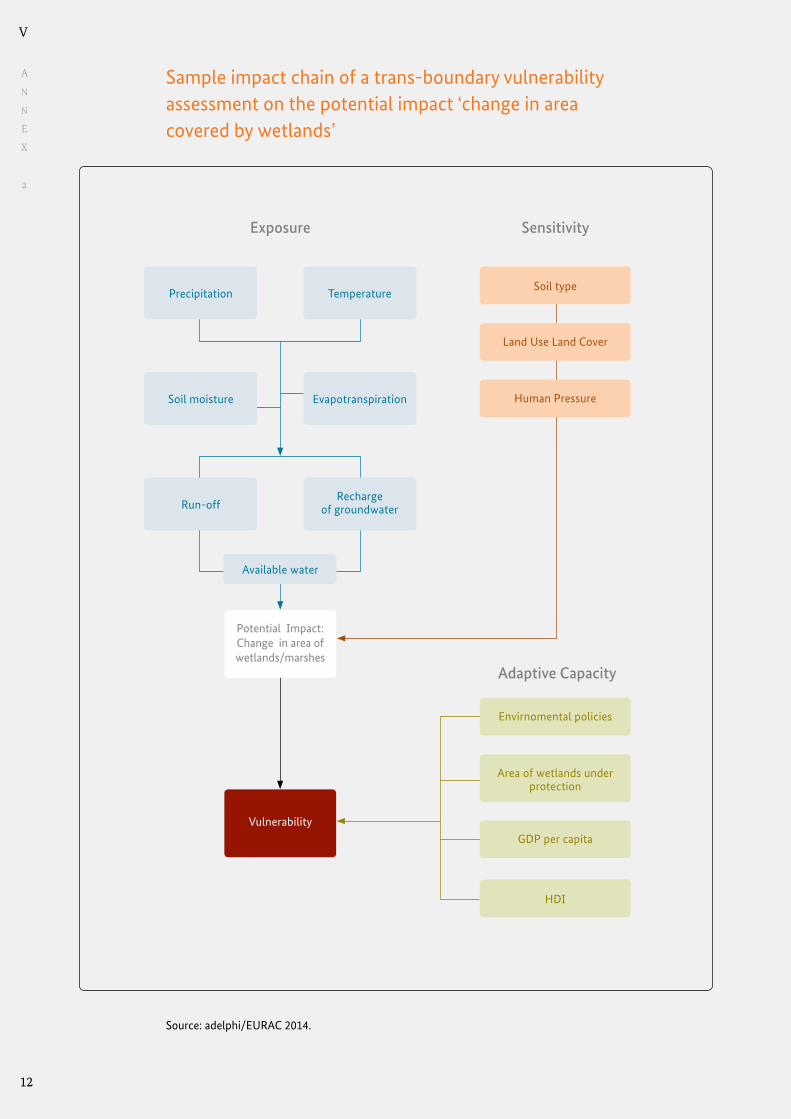
Sample impact chain of a trans-boundary vulnerability assessment on the potential impact ‘change in area covered by wetlands’
Precipitation
Vulnerability
Potential Impact:Change in area of wetlands/marshes
GDP per capita
HDI
Run-offRecharge
of groundwater
EvapotranspirationSoil moisture
Temperature Soil type
Land Use Land Cover
Human Pressure
Area of wetlands under protection
Exposure Sensitivity
Adaptive Capacity
Envirnomental policies
Available water
13
V
A
N
N
E
X
2
Source: adelphi/EURAC 2014.
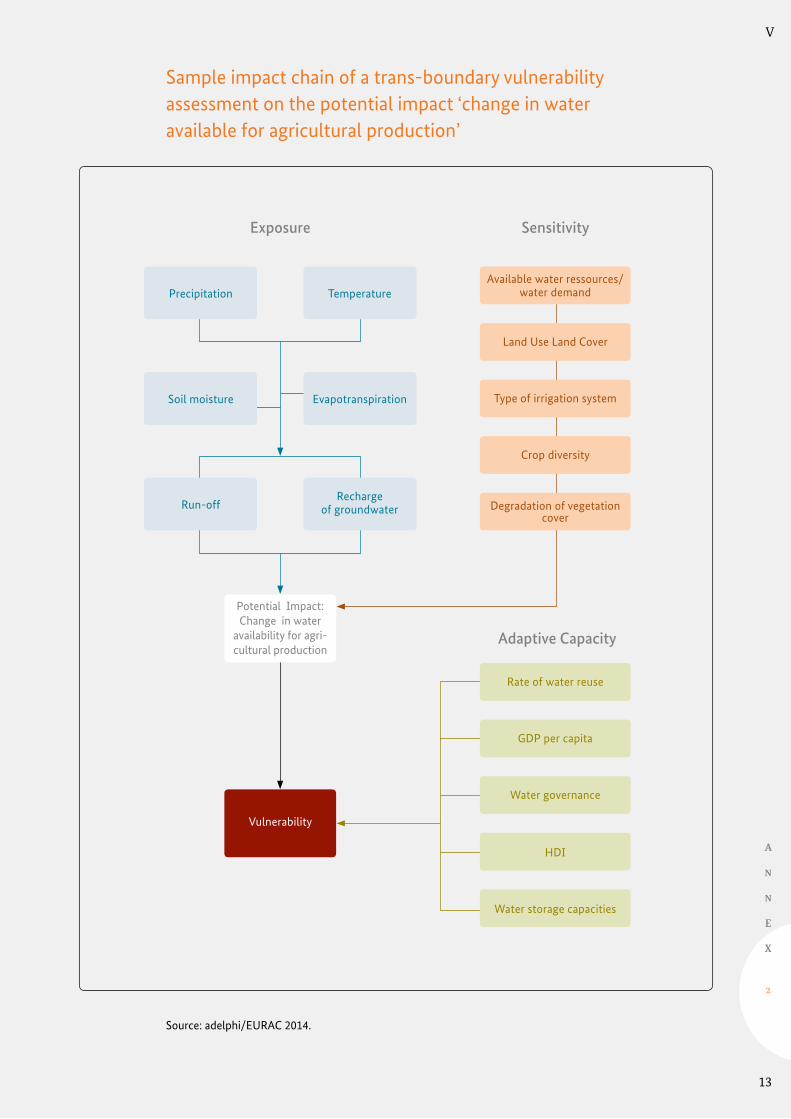
Sample impact chain of a trans-boundary vulnerability assessment on the potential impact ‘change in water available for agricultural production’
Precipitation
Vulnerability
Potential Impact:Change in water
availability for agri-cultural production
HDI
Water storage capacities
Run-offRecharge
of groundwater
EvapotranspirationSoil moisture
Temperature Available water ressources/
water demand
Land Use Land Cover
Type of irrigation system
Crop diversity
Degradation of vegetation cover
GDP per capita
Exposure Sensitivity
Adaptive Capacity
Rate of water reuse
Water governance
14
V
A
N
N
E
X
3
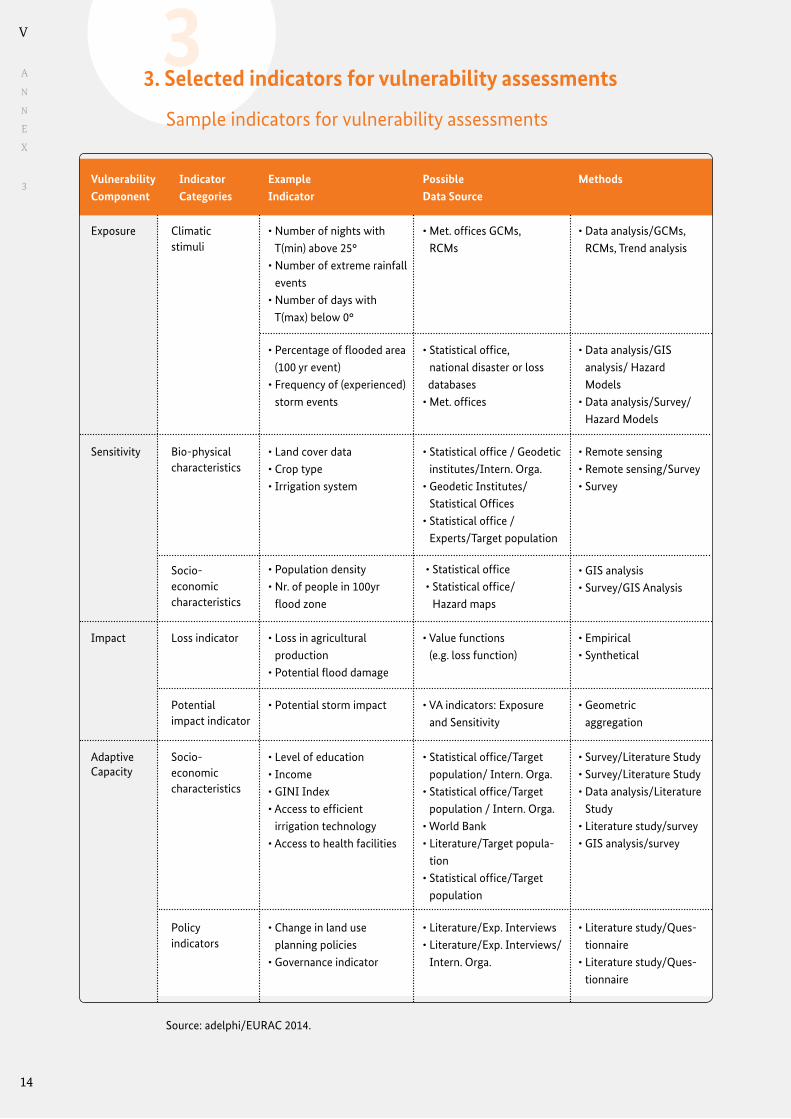
33. Selected indicators for vulnerability assessments
Sample indicators for vulnerability assessments
Vulnerability Component
• Number of nights with T(min) above 25°
• Number of extreme rainfall events
• Number of days with T(max) below 0°
• Met. offices GCMs, RCMs
• Data analysis/GCMs, RCMs, Trend analysis
Climatic stimuli
Exposure
Indicator Categories
Example Indicator
Possible Data Source
Methods
• Percentage of flooded area (100 yr event)
• Frequency of (experienced) storm events
• Statistical office, national disaster or loss databases
• Met. offices
• Data analysis/GIS analysis/ Hazard Models
• Data analysis/Survey/ Hazard Models
• Land cover data• Crop type• Irrigation system
• Statistical office / Geodetic institutes/Intern. Orga.
• Geodetic Institutes/Statistical Offices
• Statistical office /Experts/Target population
• Remote sensing • Remote sensing/Survey• Survey
Bio-physical characteristics
Sensitivity
• Population density• Nr. of people in 100yr
flood zone
• Statistical office• Statistical office/
Hazard maps
• GIS analysis • Survey/GIS Analysis
Socio-economic characteristics
• Loss in agricultural production
• Potential flood damage
• Value functions (e.g. loss function)
• Empirical • Synthetical
Loss indicator Impact
• Potential storm impact • VA indicators: Exposure and Sensitivity
• Geometric aggregation
Potential impact indicator
• Level of education• Income• GINI Index• Access to efficient • irrigation technology• Access to health facilities
• Statistical office/Target population/ Intern. Orga.
• Statistical office/Target population / Intern. Orga.
• World Bank• Literature/Target popula-• tion • Statistical office/Target • population
• Survey/Literature Study • Survey/Literature Study • Data analysis/Literature
Study• Literature study/survey• GIS analysis/survey
Socio-economic characteristics
Adaptive Capacity
Policy indicators
• Change in land use • planning policies• Governance indicator
• Literature/Exp. Interviews• Literature/Exp. Interviews/ •Intern. Orga.
• Literature study/Ques-• tionnaire• Literature study/Ques-• tionnaire
Source: adelphi/EURAC 2014.
15
V
A
N
N
E
X
3
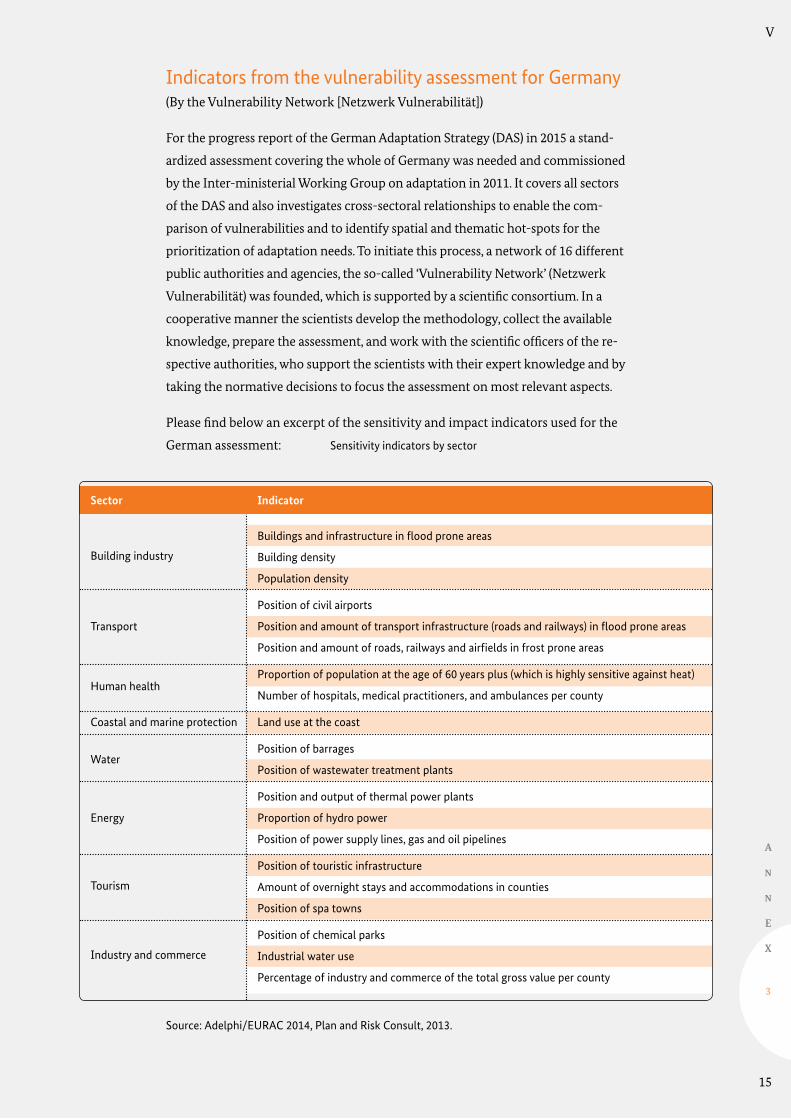
Indicators from the vulnerability assessment for Germany (By the Vulnerability Network [Netzwerk Vulnerabilität])
For the progress report of the German Adaptation Strategy (DAS) in 2015 a stand-
ardized assessment covering the whole of Germany was needed and commissioned
by the Inter-ministerial Working Group on adaptation in 2011. It covers all sectors
of the DAS and also investigates cross-sectoral relationships to enable the com-
parison of vulnerabilities and to identify spatial and thematic hot-spots for the
prioritization of adaptation needs. To initiate this process, a network of 16 different
public authorities and agencies, the so-called ‘Vulnerability Network’ (Netzwerk
Vulnerabilität) was founded, which is supported by a scientific consortium. In a
cooperative manner the scientists develop the methodology, collect the available
knowledge, prepare the assessment, and work with the scientific officers of the re-
spective authorities, who support the scientists with their expert knowledge and by
taking the normative decisions to focus the assessment on most relevant aspects.
Please find below an excerpt of the sensitivity and impact indicators used for the
German assessment: Sensitivity indicators by sector
Building industry
Transport
Human health
Coastal and marine protection
Water
Energy
Tourism
Industry and commerce
Buildings and infrastructure in flood prone areas
Building density
Population density
Position of civil airports
Position and amount of transport infrastructure (roads and railways) in flood prone areas
Position and amount of roads, railways and airfields in frost prone areas
Proportion of population at the age of 60 years plus (which is highly sensitive against heat)
Number of hospitals, medical practitioners, and ambulances per county
Land use at the coast
Position of barrages
Position of wastewater treatment plants
Position and output of thermal power plants
Proportion of hydro power
Position of power supply lines, gas and oil pipelines
Position of touristic infrastructure
Amount of overnight stays and accommodations in counties
Position of spa towns
Position of chemical parks
Industrial water use
Percentage of industry and commerce of the total gross value per county
Sector Indicator
Source: Adelphi/EURAC 2014, Plan and Risk Consult, 2013.

16
V
A
N
N
E
X
3
Building industry
Transport
Human health
Coastal and marine protection
Fishery
Water
Energy
Finance and insurance sector
Tourism
Industry and commerce
Biodiversity
Soil
Forestry
Agriculture
Changing potential damages at buildings and infrastructure through flood
Changing indoor climate
Changing urban heat island
Changing number of days with potential icing of aircrafts
Potential flood damages at roads and railways
Potential frost damages at roads, railways and airfields
Changing number of day with potential heat stress for humans
Changing number of days with weather causing breathing difficulties
Changing number of medical consultation per county
Changing building loads through rising sea levels
Potential damages at coasts through rising sea levels
Changing range of fish species
Changes in growth, reproduction and mortality of fish
Changes in fishing conditions due to extreme weather events
Changing flow rates
Changing number and amplitude of floods
Quality and availability of surface water
Changing demand of heating/cooling energy
Changes in the regional hydro power capacity
Changing availability of cooling water for thermal power plants
Potential damages at power supply lines, gas and oil pipelines
Amount of insured losses due to storm and hail
Changing requirements for insurance and premiums
Changing decisions concerning investments and credits
Changing number of bathing days
Potential damages at touristic infrastructure due to storm
Changing number of days with extreme heat in spa towns
Potential flooding of chemical parks
Potential damages at long-distance transport infrastructure due to storm
Changes in the availability of water for industrial production
Potential distribution of invasive species
Changes in ecosystem areas
Changes in ecosystem services
Changes in water balance
Changes in soil erosion and deflation
Changes in soil functions
Changing number of days with risk of forest fires
Changes in heat and dry stress
Changes in wood production
Changing growth phase of plants
Changing yield
Potential losses due to extreme weather events
Sector Indicator
Source: adelphi/EURAC 2014.
17
V
A
N
N
E
X
4
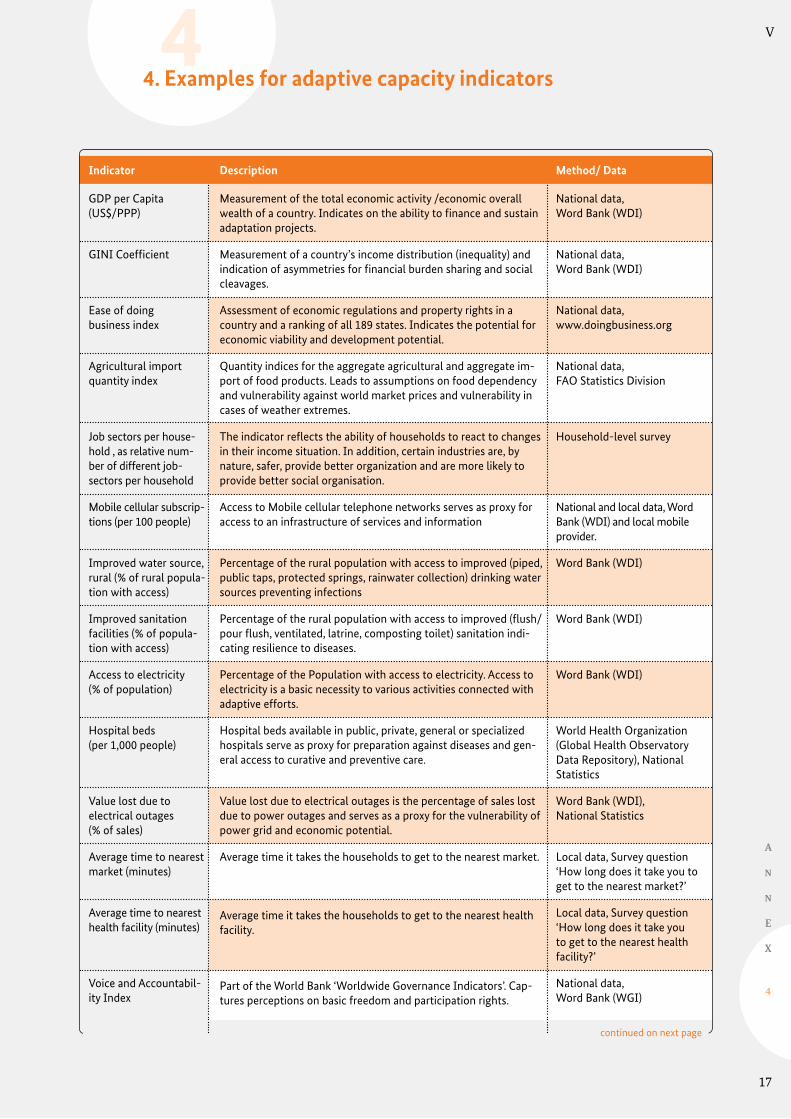
44. Examples for adaptive capacity indicators
GDP per Capita (US$/PPP)
GINI Coefficient
Ease of doing business index
Agricultural import quantity index
Job sectors per house-hold , as relative num-ber of different job-sectors per household
Mobile cellular subscrip-tions (per 100 people)
Improved water source, rural (% of rural popula-tion with access)
Improved sanitation facilities (% of popula-tion with access)
Access to electricity (% of population)
Hospital beds (per 1,000 people)
Value lost due to electrical outages (% of sales)
Average time to nearest market (minutes)
Average time to nearest health facility (minutes)
Voice and Accountabil-ity Index
Measurement of the total economic activity /economic overall wealth of a country. Indicates on the ability to finance and sustain adaptation projects.
Measurement of a country’s income distribution (inequality) and indication of asymmetries for financial burden sharing and social cleavages.
Assessment of economic regulations and property rights in a country and a ranking of all 189 states. Indicates the potential for economic viability and development potential.
Quantity indices for the aggregate agricultural and aggregate im-port of food products. Leads to assumptions on food dependency and vulnerability against world market prices and vulnerability in cases of weather extremes.
The indicator reflects the ability of households to react to changes in their income situation. In addition, certain industries are, by nature, safer, provide better organization and are more likely to provide better social organisation.
Access to Mobile cellular telephone networks serves as proxy for access to an infrastructure of services and information
Percentage of the rural population with access to improved (piped, public taps, protected springs, rainwater collection) drinking water sources preventing infections
Percentage of the rural population with access to improved (flush/pour flush, ventilated, latrine, composting toilet) sanitation indi-cating resilience to diseases.
Percentage of the Population with access to electricity. Access to electricity is a basic necessity to various activities connected with adaptive efforts.
Hospital beds available in public, private, general or specialized hospitals serve as proxy for preparation against diseases and gen-eral access to curative and preventive care.
Value lost due to electrical outages is the percentage of sales lost due to power outages and serves as a proxy for the vulnerability of power grid and economic potential.
Average time it takes the households to get to the nearest market.
Average time it takes the households to get to the nearest health facility.
Part of the World Bank ‘Worldwide Governance Indicators’. Cap-tures perceptions on basic freedom and participation rights.
National data, Word Bank (WDI)
National data, Word Bank (WDI)
National data, www.doingbusiness.org
National data, FAO Statistics Division
Household-level survey
National and local data, Word Bank (WDI) and local mobile provider.
Word Bank (WDI)
Word Bank (WDI)
Word Bank (WDI)
World Health Organization (Global Health Observatory Data Repository), National Statistics
Word Bank (WDI), National Statistics
Local data, Survey question ‘How long does it take you to get to the nearest market?’
Local data, Survey question ‘How long does it take you to get to the nearest health facility?’
National data, Word Bank (WGI)
Indicator Description Method/ Data
continued on next page

18
V
A
N
N
E
X
4
Civil Society Index
Number of local cooperatives/social organisations per 1000 inhabitants
Fraction of villages with NGO activity
Riots and conflict, as fraction of villages with at least one riot
Health expenditure, total (% of GDP)
Central government debt, total (% of GDP)
Internally displaced persons (number, low estimate)
Dependency ratio
Internet users (per 100 people)
Public spending on education, total (% of GDP)
Number of farmers trained on improved irrigation techniques
% of income available for investment into new crop types
Number of local water cooperations
Number of households that practice improved land management me-thods such as improved ploughing or anti-erosi-ve measures
Assesses the health and vitality of national civil societies in a 4 di-mension approach (Structure, Space/Environment, Values, Impact) measuring the political civic culture and political culture in general.
Households rely on a social network that often acts as a substitute for insurance, savings or as a secure livelihood during disruption in an emergency. Social organisations act as a proxy to the level of social organization and the potential to provide material or non-material assistance during recovery.
NGO are considered part of civil society organisations and serve as a proxy to the participatory environment and the degree that different groups of people are able to shape the priorities of (local) government.
Measure the capacity of a society to solve its conflicts internally and without external pressure (political, administrative, militarily). Internal conflict solving is a main reason for strong social ties within communities and facilitates other forms of support.
The sum of public and private health expenditure in relation to the GDP employed as a proxy for commitment on general public interest.
All obligations and liabilities of the government to others, serving as an indicator to fiscal freedom of the given country.
People who have to leave their homes and have not crossed bor-ders. Used as an indicator for internal conflict and administrative burdens.
Ratio of the non-working vs. working population (<15 years and >65 years vs. age 15-65), measuring the economic burden for social policy, care but also intrapersonal networks.
Access to WorldWideWeb serves as an indicator for a general ac-cess to information-networks.
The total public expenditure (current and capital) on education expressed as a percentage of the Gross Domestic Product (GDP) in a given year. Indicates commitment to general education.
The number of farmers trained in improved irrigation techniques is an indicator to the general provision and maintenance of im-proved irrigation systems. It further serves as a proxy to the spread of know-how and awareness about irrigation techniques and irrigation-issues.
Indicator on the capacity to plant more resilient crops. To invest in new crop types is an important ability in facing environmental changes.
A proxy to measure Institutional capacity to improve water distribution.
A proxy to measure the capacity to improve land management.
National data, CIVICUS index
Local data, Project data bases of institutions dealing with civic support , survey
Local data, Project data bases of institutions dealing with civic support , survey
Local data, survey, Fund For Peace CAST Conflict Assess-ment Framework
National data, Word Bank (WDI), National Statistics
National data, Word Bank (WDI), National Statistics
National data, Word Bank (WDI)
National data, local data, Survey question ‘Please list the age and sex of every Person that sleeps and eats in this house’.
National data, Word Bank (WDI)
National data, Word Bank (WDI)
Local data, project data bases of institutions dealing with water-issues, survey
Local data, project data bases of institutions dealing with crop/agrarian issues, survey
Local data, project data bases of institutions dealing with water-issues, survey
Local data, project data bases of institutions dealing with soil/agrarian-issues, survey
Indicator Description Method/ Data Source
continued on next page

19
V
A
N
N
E
X
5
Adult literacy rate, both sexes (% aged 15 and above)
Pupil-teacher ratio, primary education
Research and develop-ment expenditure (% of GDP)
Percentage of the population ages 15 and older who can, with understanding, both read and write. Needed to access basic infor-mation channels and networks.
The number of pupils enrolled in primary school divided by the number of primary school teachers. Endowment of schools is a main indicator for school and education quality.
Expenditures for research and development in relation to the GDP measuring the overall innovation potential and possible techno-logical adaptive capacities.
UNDP 2013 Human Develop-ment Report
National data, local data, Word Bank (WDI), national statistics
National data, Word Bank (WDI)
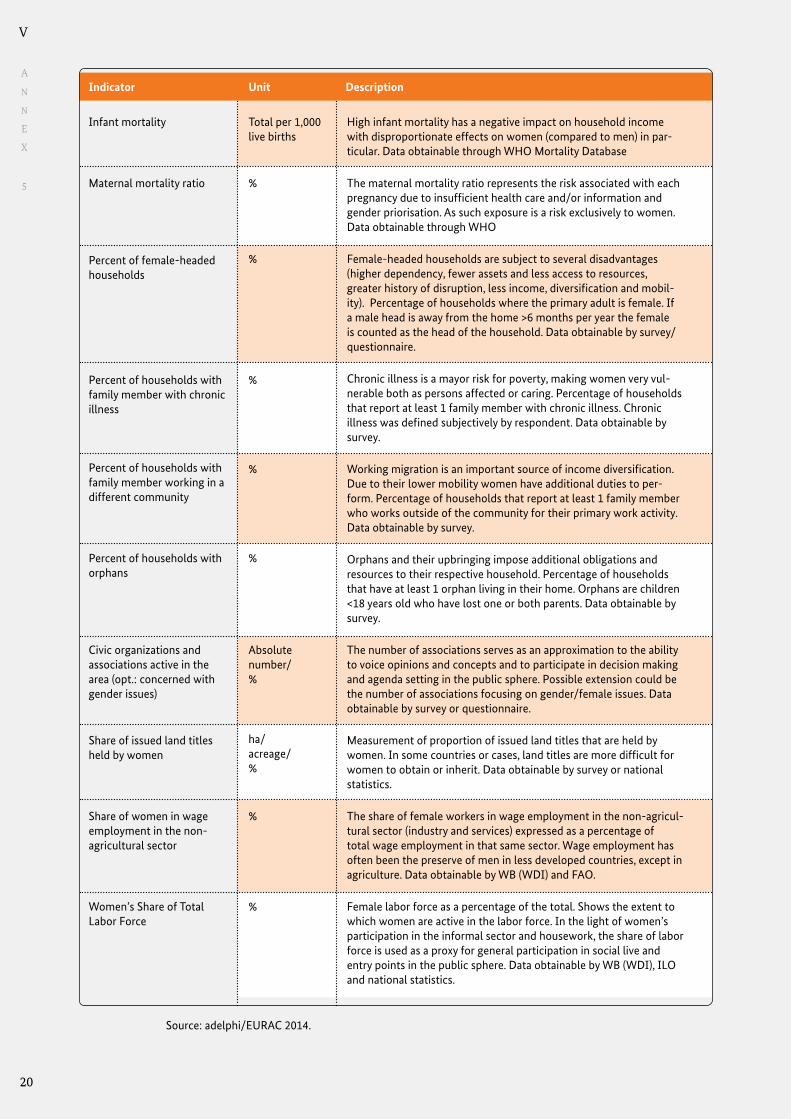
55. Examples for gender-sensitive indicators
Adult literacy Rate: female
Gender Inequality Index (GII), 2012
Gender-Related Devel-opment Index (GRDI)
Gross School Enrolment Ratio - Primary + sec-ondary: female
Ratio of girls to boys in primary and secondary education
Ratio of female to male tertiary enrollment
Progression of females to secondary school
Percentage of females able to read and understand texts.
Composite Index measuring gender inequality along three dimensions: reproductive health, empowerment, and labor market participation, ranking all participating nation-states. Obtainable through UNDP Human Development Indices.
Composite index measuring gender-gaps in life expectancy, education, and incomes. Obtainable through UNDP Human Development Indices.
Total of female enrollment in primary + secondary education as a percentage of the female population of official education age. Data obtainable by WB (WDI), UN and national statistics
Percentage of girls to boys enrolled at primary and secondary levels in public and pri-vate schools. Data obtainable by WB (WDI)
Percentage of men to women enrolled at tertiary level in public and private schools. Data obtainable by WB WDI
The share of female pupils enrolled in the final grade of primary education progressing to secondary school. Data obtainable by WB (WDI)
%
%
%
%
%
Indicator Description Method/ Data
Indicator Unit Description
continued on next page
Source: Adelphi/EURAC 2014, Plan and Risk Consult, 2013.
20
V
A
N
N
E
X
5
Infant mortality
Maternal mortality ratio
Percent of female-headed households
Percent of households with family member with chronic illness
Percent of households with family member working in a different community
Percent of households with orphans
Civic organizations and associations active in the area (opt.: concerned with gender issues)
Share of issued land titles held by women
Share of women in wage employment in the non-agricultural sector
Women’s Share of Total Labor Force
High infant mortality has a negative impact on household income with disproportionate effects on women (compared to men) in par-ticular. Data obtainable through WHO Mortality Database
The maternal mortality ratio represents the risk associated with each pregnancy due to insufficient health care and/or information and gender priorisation. As such exposure is a risk exclusively to women. Data obtainable through WHO
Female-headed households are subject to several disadvantages (higher dependency, fewer assets and less access to resources, greater history of disruption, less income, diversification and mobil-ity). Percentage of households where the primary adult is female. If a male head is away from the home >6 months per year the female is counted as the head of the household. Data obtainable by survey/questionnaire.
Chronic illness is a mayor risk for poverty, making women very vul-nerable both as persons affected or caring. Percentage of households that report at least 1 family member with chronic illness. Chronic illness was defined subjectively by respondent. Data obtainable by survey.
Working migration is an important source of income diversification. Due to their lower mobility women have additional duties to per-form. Percentage of households that report at least 1 family member who works outside of the community for their primary work activity. Data obtainable by survey.
Orphans and their upbringing impose additional obligations and resources to their respective household. Percentage of households that have at least 1 orphan living in their home. Orphans are children <18 years old who have lost one or both parents. Data obtainable by survey.
The number of associations serves as an approximation to the ability to voice opinions and concepts and to participate in decision making and agenda setting in the public sphere. Possible extension could be the number of associations focusing on gender/female issues. Data obtainable by survey or questionnaire.
Measurement of proportion of issued land titles that are held by women. In some countries or cases, land titles are more difficult for women to obtain or inherit. Data obtainable by survey or national statistics.
The share of female workers in wage employment in the non-agricul-tural sector (industry and services) expressed as a percentage of total wage employment in that same sector. Wage employment has often been the preserve of men in less developed countries, except in agriculture. Data obtainable by WB (WDI) and FAO.
Female labor force as a percentage of the total. Shows the extent to which women are active in the labor force. In the light of women’s participation in the informal sector and housework, the share of labor force is used as a proxy for general participation in social live and entry points in the public sphere. Data obtainable by WB (WDI), ILO and national statistics.
Total per 1,000 live births
%
%
%
%
%
Absolute number/ %
ha/ acreage/%
%
%
Indicator Unit Description
Source: adelphi/EURAC 2014.

21
V
A
N
N
E
X
6
66. Indicator factsheet
Template indicator factsheetsFACTSHEET: Number of factsheet (e.g. IMP #1)
Excel sheet available at: https://gc21.giz.de/ibt/var/app/wp342deP/1443/index.
php/knowledge/vulnerability-assessment/sourcebook-vulnerability/
Indicator
Name of the indicatorWater available from precipitation
Which vulnerability component is described by the indicator?Impact
Further description of the indicatorCalculated indicator for the impact ‘water available from precipitation’, Output for: ‘Water available from irrigation’ and ‘water supply for crops’.
Indicator:
Vulnerability component
Description (position in the impact chain)
Additional comments:
Data
Who provides data?University La Paz, department of agriculture
What are the conditions to obtain the data?Official request by the Ministry of agriculture; no costs.
In which format are the data available?Geo-data (shape file)
Coverage and scale of the dataNational coverage, 1 value per district
Which statistical scale do the data have?Metric
In which unit are the data provided? Runoff in m³ / sec
Which method has been applied for calculation?Semi-physical model based on the methodology of Mello 2008
Are sub-indicators needed? Which?For current situation: no, for 2050: re-run of the model necessary with new input values for daily precipita-tion and evapotranspiration
For which year(s) are the data available? 1990-2010, yearly
Trend of climate change impactdecrease
Which classes or thresholds are proposed or determined? Is this a common used classification?Proposed thresholds: more than 100 mm; 100 to 0 mm; 0 to -100 mm; less than -100 mm
Which scale or classes should be used for the assessment?Scale from 0 to 1 (using 200 mm precipitation as zero-point)
Sources of data:
Availability and costs:
Type of data:
Spatial level:
Statistical scale:
Unit of measurement:
Method of calculation:
Input-indicators needed:
Time reference and fre-quency of measurement:
Expected trend without adaptation:
Classes and thresholds:
Rating:
Additional comments:
Sources: Ministry of Environment and Mineral Resources 2012, Plan and Risk Consult 2013.

22
V
Sample indicator factsheets Used in a vulnerability assessment in Pakistan (see Annex 10)
A
N
N
E
X
6
Indicator
Name of the indicatorPoverty line
Which vulnerability component is described by the indicator?Adaptive Capacity
Further description of the indicatorPoverty is increasing in Pakistan. Impact on food security and livelihood options
Poverty increased from 23% in 2008 to 37.4% in 2011. Standard of living has reduced due to less spending in social sector. Increase in inflation, prices and shortage of commodities have further burdened millions of people and pushed them down to poverty line.
Indicator:
Vulnerability component
Description (position in the impact chain)
Additional comments:
Data
Who provides data?1. Ministry of Finance2. Planning Commission of Pakistan3. Economic Affairs Division4. Pakistan Institute of Development Economics (PIDE)5. NWFP Economic Report, World Bank (2005)
What are the conditions to obtain the data?Written request. Normal cost of the copy of the report
In which format are the data available?Reports, tables, graphs
Coverage and scale of the dataNational, provincial
Which statistical scale do the data have?metric
In which unit are the data provided? % of population
Which method has been applied for calculation?Economic Survey
Are sub-indicators needed? Which?Not applicable
For which year(s) are the data available? 2011. No such data has been released for the last 3 years
Trend of climate change impactMore people pushed down below poverty line
Which classes or thresholds are proposed or determined? Is this a common used classification?Based on government current minimum monthly wage of Rs 10,000 for a family of 8 persons, which comes to RS 40 dollar per day
Which scale or classes should be used for the assessment?
No coherent definition for ‘poverty line’ is followed in Pakistan and no authentic and straight forward data is forthcoming.
Sources of data:
Availability and costs:
Type of data:
Spatial level:
Statistical scale:
Unit of measurement:
Method of calculation:
Input-indicators needed:
Time reference and fre-quency of measurement:
Expected trend without adaptation:
Classes and thresholds:
Rating:
Additional comments:
Source: ADMC and adelphi/EURAC 2014.

23
V
A
N
N
E
X
6
Indicator
Name of the indicatorAccess to health services
Which vulnerability component is described by the indicator?Adaptive Capacity
Further description of the indicatorAccess to health services depends upon the number of health services centers, cost of medicine, allied services and affordability which in turn depends upon the economic situation of the country.
Government health facilities are available in all districts of the province. Similarly number of private health services centers has increased but quality of service has declined as a result of which a person has to pay visits again and again. Moreover cost and quality of laboratories and medicines is also questionable.further burdened millions of people and pushed them down to poverty line.
Indicator:
Vulnerability component
Description (position in the impact chain)
Additional comments:
Data
Who provides data?1. Provincial Health Department2. Pakistan Social and Living Standard Measurement Survey3. Provincial Bureau of Statistics
What are the conditions to obtain the data?Written request. Normal cost of the report
In which format are the data available?Reports, tables
Coverage and scale of the dataNational, provincial, local
Which statistical scale do the data have?Metric
In which unit are the data provided? % of persons who have access/ no access
Which method has been applied for calculation?Survey and public sector infrastructure development reports
Are sub-indicators needed? Which?Not applicable
For which year(s) are the data available? Annual Review Report (2012-13)Annual Monitoring & evaluation Report (2011-12)
Trend of climate change impactAccess to health services will be severally affectedIncrease in various kind of diseases and population growth will cause decrease in access to health services
Which classes or thresholds are proposed or determined? Is this a common used classification?% of persons covered by the facilityControl of contagious/infectious diseases
Which scale or classes should be used for the assessment?
There is a whole range of health facilities ranging from allopathic to indigenous and all have their clients in large number
Sources of data:
Availability and costs:
Type of data:
Spatial level:
Statistical scale:
Unit of measurement:
Method of calculation:
Input-indicators needed:
Time reference and frequency of measurement:
Expected trend without adaptation:
Classes and thresholds:
Rating:
Additional comments:
Source: ADMC and adelphi/EURAC 2014.
Access to Health Services

24
V
A
N
N
E
X
6
Indicator
Name of the indicatorRiver discharge
Which vulnerability component is described by the indicator?Impact
Further description of the indicatorDischarge of main rivers at given outlets (Output) , in response to rains / snow recorded at observatories across the catchments (Input) are forecasted by WAPDA through stochastic model per decades observation to manage/ regulate water for irrigation and flood waning.
Indicator:
Vulnerability component
Description (position in the impact chain)
Additional comments:
Data
Who provides data?WAPDA
What are the conditions to obtain the data?Official request has to be made to WAPDA; no costs
In which format are the data available?Digital sheets
Coverage and scale of the dataNational coverage (values per major catchment)
Which statistical scale do the data have?Metric
In which unit are the data provided? Runoff in m³ / sec
Which method has been applied for calculation?The rainfall-discharge data series recorded over decades are statistically correlated towards developing input-output relationships
Are sub-indicators needed? Which?For current situation: no, for 2050 and 2100: re-run of the model necessary with new input varies for daily precipitation and evapotranspiration
For which year(s) are the data available? Updated once per decade
Trend of climate change impactSeasonal variation. More water in the initial years may fall after receding of glaciers
Which classes or thresholds are proposed or determined? Is this a common used classification?
Which scale or classes should be used for the assessment?
Sources of data:
Availability and costs:
Type of data:
Spatial level:
Statistical scale:
Unit of measurement:
Method of calculation:
Input-indicators needed:
Time reference and fre-quency of measurement:
Expected trend without adaptation:
Classes and thresholds:
Rating:
Additional comments:
Source: ADMC and adelphi/EURAC 2014.
River Discharge
25
V
A
N
N
E
X
7
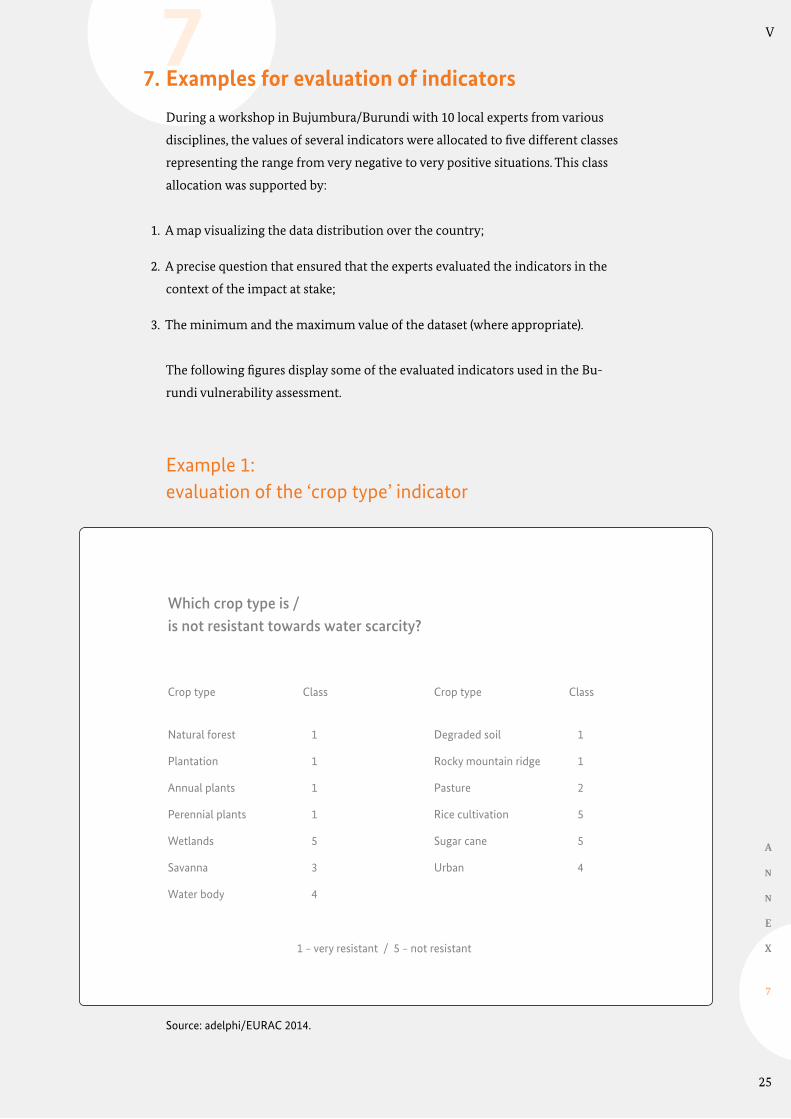
77. Examples for evaluation of indicators
During a workshop in Bujumbura/Burundi with 10 local experts from various
disciplines, the values of several indicators were allocated to five different classes
representing the range from very negative to very positive situations. This class
allocation was supported by:
1. A map visualizing the data distribution over the country;
2. A precise question that ensured that the experts evaluated the indicators in the
context of the impact at stake;
3. The minimum and the maximum value of the dataset (where appropriate).
The following figures display some of the evaluated indicators used in the Bu-
rundi vulnerability assessment.
Example 1: evaluation of the ‘crop type’ indicator
Which crop type is / is not resistant towards water scarcity?
1 – very resistant / 5 – not resistant
Natural forest 1
Plantation 1
Annual plants 1
Perennial plants 1
Wetlands 5
Savanna 3
Water body 4
Crop type Class
Degraded soil 1
Rocky mountain ridge 1
Pasture 2
Rice cultivation 5
Sugar cane 5
Urban 4
Crop type Class
Source: adelphi/EURAC 2014.

26
V
A
N
N
E
X
7
Example 2: evaluation of the ‘population density’ indicator
Which population density allows/ does not allow a sustainable land use?
Number of inhabitants/km2 Class
< 100 1
101 – 200 2
201 – 300 3
301 – 450 4
> 451 5
Min-Max: 34 p/km2 – 4.400 p/km2
1 – allows sustainable land use5 – does not allow sustainable land use
Which population density allows/does not allow a sustainable land use?
Number of inhabitants/km2 Class
< 100 1
101 – 200 2
201 – 300 3
301 – 450 4
> 451 5
Min-Max: 34 p/km2 – 4.400 p/km2
1 – allows sustainable land use5 – does not allow sustainable land use
Which population density allows/does not allow a sustainable land use?
Number of inhabitants/km2 Class
< 100 1
101 – 200 2
201 – 300 3
301 – 450 4
> 451 5
Min-Max: 34 p/km2 – 4.400 p/km2
1 – allows sustainable land use5 – does not allow sustainable land use
Which population density allows/does not allow a sustainable land use?
Number of inhabitants/km2 Class
< 100 1
101 – 200 2
201 – 300 3
301 – 450 4
> 451 5
Min-Max: 34 p/km2 – 4.400 p/km2
1 – allows sustainable land use5 – does not allow sustainable land use
Which population density allows/does not allow a sustainable land use?
Number of inhabitants/km2 Class
< 100 1
101 – 200 2
201 – 300 3
301 – 450 4
> 451 5
Min-Max: 34 p/km2 – 4.400 p/km2
1 – allows sustainable land use5 – does not allow sustainable land use
Which population density allows/does not allow a sustainable land use?
Number of Class
inhabitants/km2
< 100 1
101 – 200 2
201 – 300 3
301 – 450 4
> 451 5 1 - allows sustainable land use / 5 - does not allow sustainable use
< 50 50 – 100 100 – 200 200 – 400 400 – 500 > 500
Population density per km², average per colline
0 12.5 25 50 km
Source: adelphi/EURAC 2014.
27
V
A
N
N
E
X
7
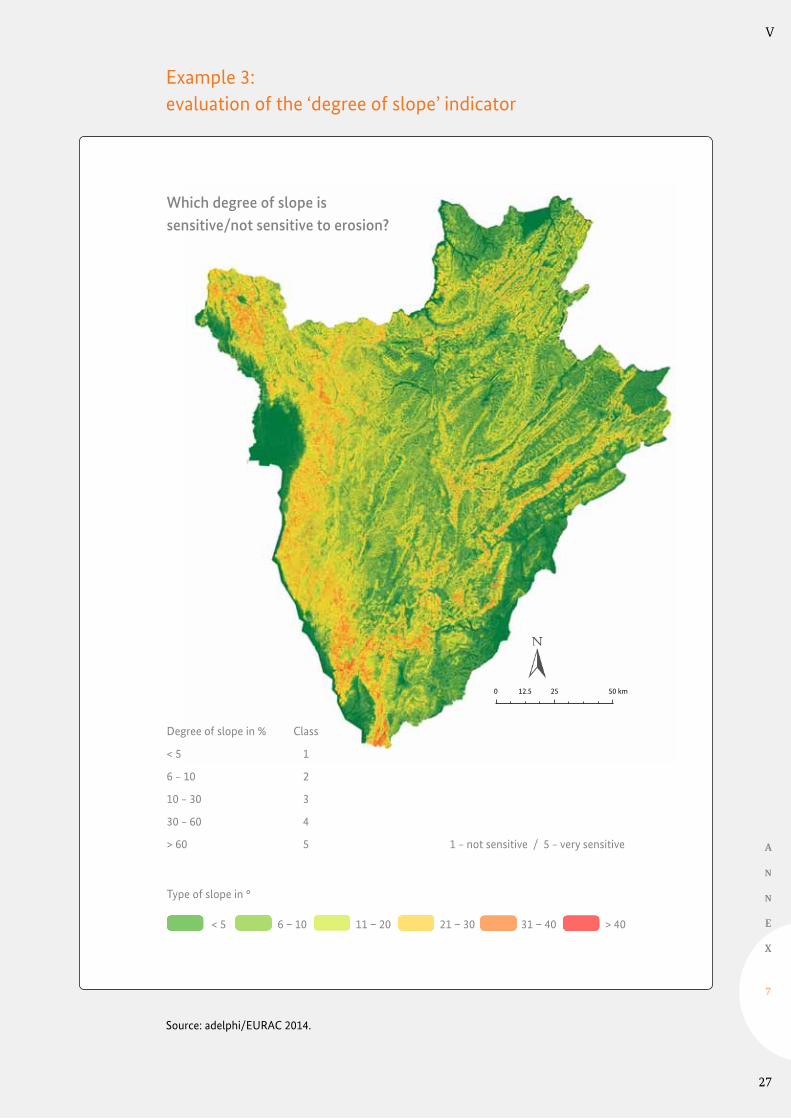
Example 3: evaluation of the ‘degree of slope’ indicator
< 5 6 – 10 11 – 20 21 – 30 31 – 40 > 40
Which degree of slope is sensitive/not sensitive to erosion?
Degree of slope in % Class
< 5 1
6 – 10 2
10 – 30 3
30 – 60 4
> 60 5 1 – not sensitive / 5 – very sensitive
Type of slope in °
0 12.5 25 50 km
Source: adelphi/EURAC 2014.

28
V
A
N
N
E
X
7
Example 4: evaluation of the ‘vegetation cover’ indicator
Forest plantations and tree plantations
Shrub crop
Herbaceous crops
Vegetated urban areas
Forest
Woodland
Closed woody vegetation
Open woody vegetation
Thicket
Shrubland
Tree savannah
Shrub savannah
Grassland
Sparse trees
Sparse shrubs
Sparse herbaceous vegetation
Fields rice
Closed swamp
Open swamp
Woody vegetation
on flooded land
Shrubs on flooded land
Herbaceous vegetation
on flooded land
Artificial surfaces
Bare soil
Water bodies
Snow
Natural forest 1
Plantation 1
Annual plants 1
Perennial plants 1
Wetlands 5
Savanna 3
Water body 4
Degraded soil 1
Rocky mountain ridge 1
Pasture 2
Rice cultivation 5
Sugar cane 5
Urban 4
Vegetation cover Class
Which vegetation type supports the prevalence of mosquitos?
0 10 20 40 60 80 km
Source: adelphi/EURAC 2014.

29
V
A
N
N
E
X
7
Example 5: evaluation of the ‘household income’ indicator
Bubanza 1.090.582 3063 5
Bujumbura rural 1.479.129 4155 4
Bururi 1.072.687 3013 5
Cankuzo 1.584.383 4451 3
Cibitoke 1.416.099 3978 4
Gitega 1.532.542 4305 3
Karuzi 1.534.630 4311 3
Kayanza 726.586 2041 5
Kirundo 1.329.355 3734 4
Makamba 1.621.757 4555 3
Muramvya 1.070.867 3008 5
Muyinga 1.321.536 3712 4
Mwaro 2.066.318 5804 3
Ngozi 620.080 1742 5
Rutana 899.291 2526 5
Ruyigi 1.116.795 3137 4
Province FBU/year FBU/day class
1 – does allow to adapt / 5 – does not allow to adapt
Average farmer household revenue (Fbu)
1416100
1090580
1070870
1479130
999
1072690
726586
62080
1329360
1321540
15843801534630
1116800
899291
1532540
2066320
1621760
Classification: Natural Breaks (Jenks)
no data
0 – 726.586
726.587 – 1.116.800
1.116.801 – 1.416.100
1.416.101 – 1.121.760
1.121.761 – 2.066.320
Which monthly income allows for adaptation?
0 10 20 40 60 80 km
Source: adelphi/EURAC 2014.

30
V
A
N
N
E
X
8
88. Excel template for aggregating indicators of
exposure, sensitivity, adaptive capacity and vulnerability components
Description of Factor
Assessment Scale
Lowest Value Highest Value
Example
Indicator
extreme rain events
number of extreme rain
1
2
3
4
5
6
7
8
Example deforestation % deforestation
1
2
3
4
5
6
7
8
Example lawenforcement
satisfactionlevel
1
2
3
4
5
6
7
8
Observed Value
Normalized Value
0 10 3 0,3 1 0,3
0 100 20 0,2 1 0,2
0 4 1 0,25 1
0
0
0
0
0
0
0
0
0
0
0
0
0
0
0
0
0
0
0
0
0
Exposure
Sensitivity
Adaptive Capacity

31
V
A
N
N
E
X
8
Excel template available online at:
https://gc21.giz.de/ibt/var/app/wp342deP/1443/index.php/knowledge/vulnerability-
assessment/sourcebook-vulnerability/
Weighting Factor for each indicator
Total POTENTIAL IMPACT
Weighting Fac-tor for Potential Impact
ADAPTIVE CAPACITY
Weighting Factor for Adap-tive Capacity
IMPACT TO VULNERABILITY
0
0 0 1 0 1 0
0 10 3 0,3 1 0,3
0 100 20 0,2 1 0,2
0 4 1 0,25 1
Source: adelphi/EURAC 2014.

32
V
A
N
N
E
X
9
99. Sample structure of a vulnerability assessment report
1. Introduction (Refer to Module 1)
What is the context of the VA? (Module 1, Step 1)
E.g. is the VA part of a superior process? Which institutions want to conduct
the VA, who is involved, who are main target users? Are particular climate
change challenges already identified?
What are the objectives of the VA? (Module 1, Step 2)
E.g. is the VA supposed to contribute to concrete adaptation planning?
Is the main objective to identify cross-sectoral hotspots? Or is it supposed to
identify particularly vulnerable population groups?
What are the topic(s), areas and time periods covered by the VA (Module 1, Step 3)?
In short: Who is vulnerable (or which system?), to which climate change impact
and where? (The system can be understood as an economic sector, livelihoods,
segments of population etc.)
E.g. which sectors, segments of populations, livelihoods etc. are the focus of
the VA? On which spatial or administrative level does the VA take place (e.g. on
the level of villages, communities, regions, etc.)? Does the VA concentrate on pre-
sent vulnerability or does it include a forward-looking vulnerability analysis?
Understanding of vulnerability and its components applied for the VA (refer to
Conceptual Framework)
How is vulnerability understood in the analysis? Here, please refer to the
Vulnerability Sourcebook’s approach to vulnerability and highlight and explain
any differences in the concept used (if applicable).
Stakeholders involved in the preparation and implementation of the VA
(Module 1, Step 1)
Who contributed to the VA, which institutions where involved, which civil
society actors or affected communities were involved, etc.?
2. Understanding of climate change impacts (Refer to Module 2)
Which factors contribute to climate change vulnerability? (specific to the system
the VA is concentrating on) (Module 2, Step 1 to 4)

33
V
Factors should be clustered (according to the Vulnerability Sourcebook’s
approach) in exposure, sensitivity, potential impact and adaptive capacity.
Apply and describe impact chains as analytical and visualisation tool.
What are the underlying cause-effect-relationships? For instance, how are expo-
sure, sensitivity and adaptive capacity interlinked to form the vulnerability of the
system? (Module 2, Step 1 to 4)
3. Assessment methodology (Refer to Module 3 – 7)
Key information on the overall implementation process of the VA
E.g. work plan, time needed for the implementation, number of field missions
conducted.
Which indicators were selected for which vulnerability factors? (Module 3)
How were the indicators selected? (E.g. based on the impact chains using a
participatory approach, based on a literature review).
What does the indicator express?
What is the data/information base of the VA? (Module 4)
Which methods are used to quantify the indicators (e.g. models, statistics,
survey, but also expert judgement)/which data sets and information were used?
What were data quality challenges and how were the coped with?
How is data normalised? (Module 5)
Explain normalisation technique (e.g. min-max-normalisation)
Which thresholds were identified for different indicators? (Module 5)
How where these thresholds determined? E.g. expert judgment, thresholds
form the literature.
How were indicators weighted? (Module 6)
Explain if indicators are assigned equal (‘equal weighting is also weighting’)
or different weights
Outline method for weighting, e.g. using a certain participatory approach, based
on expert knowledge, literature review.
What are the aggregation rules on the level of vulnerability components (e.g.
arithmetic aggregation as recommended in the Vulnerability Sourcebook)? (Module 6)
What is the aggregation rule for calculating vulnerability from its components?
(Module 7)
A
N
N
E
X
9

34
V
A
N
N
E
X
9
4. Outcomes of the VA (Refer to Module 8)
What are the key findings from the VA related to its objective?
Which recommendations can be drawn from the VA results?
E.g. for adaptation planning, strategy development, priority areas for action.
What are central lessons-learned from the implementation of the VA?
What are limits and opportunities of the VA?
Which advises can be given to the future use of VAs in similar processes?
5. Annex
Key documents and files used for the implementation, e.g. documentation of
workshops, transcripts of interviews, questionnaires used, tables and maps devel-
oped.
List of data used including meta data (see template of data factsheet above)
Additional background information and literature

35
V
A
N
N
E
X
10
1010. Applying the Vulnerability Sourcebook:
vulnerability assessment in Khyber Pakhtunkhwa, Pakistan
Participants of the vulnerability assessment in Pakistan
Source: adelphi/EURAC 2014.
adelphi
Dr. Philip Bubeck
Project Manager
adelphi consult GmbH
EURAC.research
Dr. Marc Zebisch
Head of Institute for Applied Remote Sensing
EURAC research

36
V
A
N
N
E
X
1 0
List of contents:
Background of the vulnerability assessment 36
Applying of the Vulnerability Sourcebook in Pakistan 37
Preparing the vulnerability assessment (Module 1) 38
Understanding the Context of the vulnerability assessment (Module 1; Step 1) 38
Objective of the vulnerability assessment (Module 1; Step 2) 43
Determine the scope of the vulnerability assessment (Module 1; Step 3): 44
Developing an impact chain (Module 2) 47
Identification of indicators and methods for quantification (Module 3 to 5) 49
Aggregating indicators and vulnerability components (Module 6 and 7) 53
Outcomes of the vulnerability assessment 55
Key findings, recommendations and next steps (Module 8) 55
Lessons learned 56
Annex 57
Background of the vulnerability assessment
Pakistan is ecologically unique and is one of the main biodiversity hotspots worldwide.
It is home to many varieties of endemic wildlife and is rich in indigenous crop diversity
with an estimated 3000 taxa and cultivated plants.
The ecosystems and their biodiversity are not only ecologically important, but they
also play an essential role for economic development. Ecosystems and the services they
provide to humans are crucial for the over 3.5 million people living in Khyber Pakh-
tunkhwa province. However, these resources are seriously threatened by human made
factors such as the overuse of natural resources, which is further reinforced by popula-
tion growth as well as an influx of refugees and internally displaced persons. Moreover,
natural hazards and negative effects of climate change such as heavy rainfall events,
floods and earthquakes considerably affect livelihoods in Khyber Pakhtunkhwa prov-
ince. The impacts of climate change on the living conditions of the population and the
loss of biodiversity have been also acknowledged by the Pakistani government and are
perceived as a threat to national economic and social development.

37
V
Against this background, GIZ is currently implementing the project ‘Conserva-
tion and Sustainable Management of Biodiversity in Khyber Pakhtunkhwa (BKP)’,
on behalf of the Federal Ministry of Economic Cooperation and Development
(BMZ). The project aims at improving the capacity of the Khyber Pakhtunkhwa
government in considering biodiversity (agro-biodiversity) as a core element of
sustainable policy development. Moreover, it comprises the identification and im-
plementation of community-driven and ecosystem-based adaptation measures
against climate change. The project focuses specifically upon the two districts of
Swat and Chitral, where the implementation of pilot measures and best practices
intend to benefit the local communities directly.
Applying of the Vulnerability Sourcebook in Pakistan
An explorative vulnerability assessment was carried out that assessed the climate
vulnerability of Swat and Chitral in a standardized way. The objective of the VA in
the two districts was to (a) raise awareness, (b) identify suitable adaptation meas-
ures at the community level, monitoring and evaluating their effectiveness and (c)
provide policy advice. The assessment primarily followed the modules outlined in
the Vulnerability Sourcebook and will be described in greater detail in the follow-
ing sections (see also Figure 1).
Figure 1: The eight modules of a vulnerability assessment according to the
Vulnerability Sourcebook
Source: adelphi/EURAC 2014.
A
N
N
E
X
10
1Prepare VA(Scoping) 2
DevelopingImpact Chains
3Identifying
and Selecting Indicators
4Data Acqui-sition and
Management
5Normalizing/
Thresold Definition
Vulnerability Assessment
8Presenting
VA outcomes
7Aggregating Vulnerability Components
6Weighting and
Aggregating Indicators

38
A
N
N
E
X
1
V
The explorative VA was implemented during a 3.5 day stakeholder workshop
in December in Islamabad, consisting of two parts. During the first 1.5 days, the
concept of the Vulnerability Sourcebook was introduced to a wide range of about
35 stakeholders from national, provincial and district level, and their expertise on
climate change vulnerabilities and possible data sources for such an assessment
was gathered. During the final 1.5 days, the explorative VA was prepared together
with the implementation teams and BKP project staff for the two pilot areas.
The implementation teams consisted of agricultural and forestry experts from
districts’ administrations. These implementation teams will be responsible to
carry out additional explorative VAs together with local communities in Swat and
Chitral subsequent to the workshop and to oversee the implementation of the
identified adaptation measures.
Preparing the vulnerability assessment (Module 1)
In line with Module 1 of the Vulnerability Sourcebook, the explorative vulnera-
bility assessment was prepared by assessing the context of the analysis, defining
its objectives and making key decisions on scope and topics.
To gain a solid understanding of the context in which the VA was implemented,
a local consultant was commissioned in advance to prepare a scoping study.
This provided information on the case study areas of Chitral and Swat and their
climate vulnerabilities. Moreover, it covered ongoing activities on adaptation and
vulnerability and already identified possible data sources and availability. In total,
about 30 person days were invested in the scoping study to lay the groundwork
for the vulnerability assessment. It proved to be a very useful input for the work-
shop and the conduction of the VA.
During the workshop, the key attributes of the VA in Pakistan were further
defined together with the implementation teams from Swat and Chitral and GIZ
project staff. This included the definition of the objective of the VA, its spatial and
temporal scale, reference group, methodological approach, required resources,
partners and stakeholders, as well as key topics.
Understanding the context of the vulnerability assessment (Module 1; Step 1)
Case study areas
The Swat district can be divided into lower Swat and upper Swat. Lower Swat is
affected by monsoons and offers a sub-tropical to temperate climate. Crops of
all kinds, especially vegetables and fruits, are cultivated here. This part of Swat is
known for its high quality walnuts and deemed particularly suited for commer-
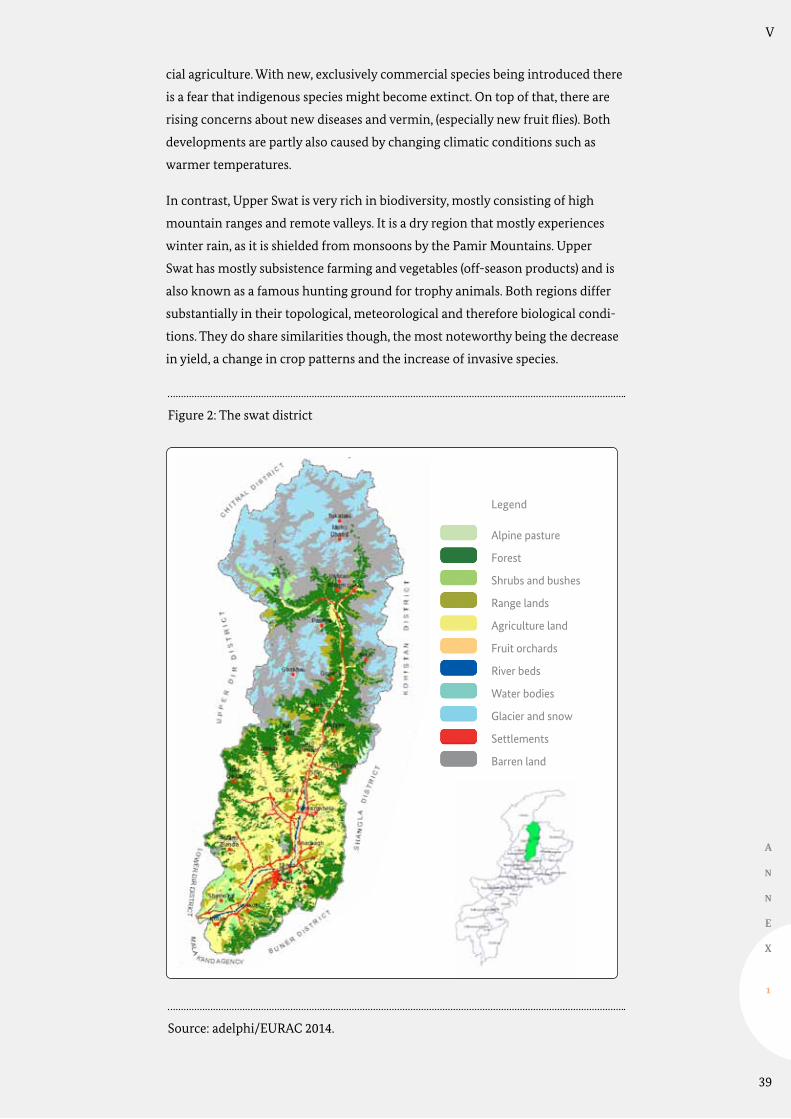
39
V
A
N
N
E
X
1
cial agriculture. With new, exclusively commercial species being introduced there
is a fear that indigenous species might become extinct. On top of that, there are
rising concerns about new diseases and vermin, (especially new fruit flies). Both
developments are partly also caused by changing climatic conditions such as
warmer temperatures.
In contrast, Upper Swat is very rich in biodiversity, mostly consisting of high
mountain ranges and remote valleys. It is a dry region that mostly experiences
winter rain, as it is shielded from monsoons by the Pamir Mountains. Upper
Swat has mostly subsistence farming and vegetables (off-season products) and is
also known as a famous hunting ground for trophy animals. Both regions differ
substantially in their topological, meteorological and therefore biological condi-
tions. They do share similarities though, the most noteworthy being the decrease
in yield, a change in crop patterns and the increase of invasive species.
Figure 2: The swat district
Source: adelphi/EURAC 2014.
Legend
Alpine pasture
Forest
Shrubs and bushes
Range lands
Agriculture land
Fruit orchards
River beds
Water bodies
Glacier and snow
Settlements
Barren land
40
V
A
N
N
E
X
1 0
Last but not least, both of the Swat areas incorporate a large number of rivers,
tributaries and melt water reservoirs, which are responsible for several flash
floods over the last years, creating concern over erosion and the growing damage
as a result of such floods. Flood risk might be further enhanced due to shifts in
precipitation patterns as well as anthropogenic land use change.
Chitral is a high altitude valley-district that borders Afghanistan. It is one of the
remotest areas of Pakistan and almost inaccessible during wintertime. Except
for one highway, its roads are closed during winter, secluding the valley from the
outside. Famed for its wildlife, it is rich in biodiversity yet comparably poor in
economic terms. The economy is determined by subsistence farming and trophy
hunting. 9 % of its surface is covered by forests (a famous oak forest is found in
Chitral), providing habitat for a rich diversity of indigenous species and making
up 1/5 of the entire Khyber Pakhtunkhwa province’s forests.
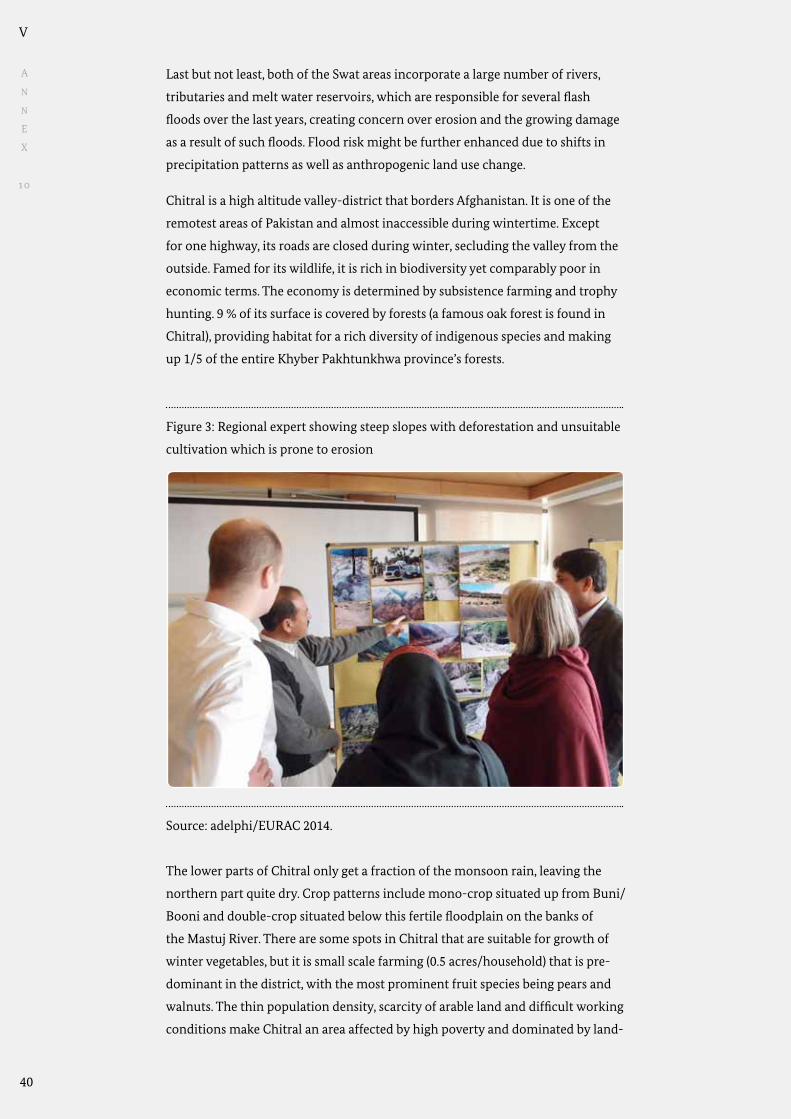
Figure 3: Regional expert showing steep slopes with deforestation and unsuitable
cultivation which is prone to erosion
Source: adelphi/EURAC 2014.
The lower parts of Chitral only get a fraction of the monsoon rain, leaving the
northern part quite dry. Crop patterns include mono-crop situated up from Buni/
Booni and double-crop situated below this fertile floodplain on the banks of
the Mastuj River. There are some spots in Chitral that are suitable for growth of
winter vegetables, but it is small scale farming (0.5 acres/household) that is pre-
dominant in the district, with the most prominent fruit species being pears and
walnuts. The thin population density, scarcity of arable land and difficult working
conditions make Chitral an area affected by high poverty and dominated by land-

41
V
A
N
N
E
X
10
lords. High transportation costs are a primary reason for the low export orienta-
tion of agricultural products. Chitral can thus be characterized as a region of high
food insecurity, especially due to seasonal road and tunnel closures. Deforestation
and the cultivation of unsuitable plants pose an added threat to the ecosystem
which is accelerated by climate change making the need for adaptation even
more important. In addition, Chitral experiences landslides, erosion and degrada-
tion which pose a threat to both ecosystems and subsistence farmers.
Climate vulnerabilities
In line with the Vulnerability Sourcebook’s terminology, climate vulnerability
was assessed with respect to exposure, sensitivity and adaptive capacity to get a
clearer understanding of the area under review.
In terms of exposure, over the last century, a temperature increase of about
0.06°C per decade has been observed in Pakistan, showing increased acceleration
over recent decades. Precipitation trends also seem to have shifted, as indicated
by late winter rains, heavy snowfall and a shift in monsoon patterns. Over the last
60 years, monsoons have shifted by about 80-100km from the northwest of the
country towards the northeast of the country (see Figure 4).
Figure 4: Monsoon shift in Pakistan based on the records of the past 60 years
Source: Pakistan Meteorological Department.
Rainfall on 26th to 29th July 2010
0 10 25 50 75 100 150 200 250 300 >300
Precipitation (mm)
Pastmonsoon

42
V
A
N
N
E
X
1 0
Various studies of the Global Change Impact Studies Centre (GCISC) and the
Pakistan Meteorological Department (PMD) indicate that temperatures in the
mountain areas are increasing at a faster rate than in the other parts of the coun-
try. While this may be seen as an opportunity rather than a threat, especially since
these areas are short of heat, any increase in temperature will be beneficial for
enhanced agriculture productivity and vegetation growth. However, increasing
temperatures may shift conifers northwards and thus could be replaced by fast-
growing, invasive species that occupy a larger area and may endanger biodiver-
sity. Simultaneously, the precipitation pattern is expected to change with more
intense monsoons and winter snowfalls causing hazards that include soil erosion,
flash floods, avalanches and Glacier Lakes Outburst Floods (GLOFs). The frequency
of hydro-meteorological disasters has already increased in Pakistan, particularly
in the mountain regions, which are fragile and inaccessible, and under increasing
pressure due to rising population and unsustainable agricultural practices. Thus
mountain communities are already suffering from high climatic risks today.
Figure 5: Landslide and soil erosion in the case study area
Source: GIZ 2013.
In terms of sensitivity, the country suffered from a reduction of about 25% of its
forests during the last two decades, mostly in the mountain areas, aggravating the
problem of soil erosion (Figure 5). Furthermore, there is an ongoing loss of fertile
top soil due to surface and gully erosion due to heavy rainfalls and events causing
auxiliary extinction of species, habitat, and agricultural land productivity. This
pattern of overall natural resource degradation is not only affecting the liveli-

43
V
A
N
N
E
X
10
hoods of the poor people who depend on them but also poses serious environ-
mental threats to the mountain ecosystems.
While Pakistan is heavily affected by climate change impacts, it has a low adap-
tive capacity due to its high dependency on natural resources that have largely
degraded and the carrying capacity of these resources having declined over time.
Moreover, the majority of the rural poor lives in highly vulnerable areas and
traditional coping mechanisms often have become ineffective due to changing
climatic conditions, land holdings are small and the mountain people lack alter-
native sources of income. The recurring flash floods have further deteriorated
their resource base. In addition, there are limited resources allocated for research
and extension on climate-related aspects, and institutional capacities to deal with
associated challenges are low. All these aspects hold especially true for mountain
areas such as Swat and Chitral.
Resources
The following resources were available for the preparation and implementa-
tion of the VA in Pakistan (second part of the workshop). During the stakehold-
ers’ workshop in Islamabad, a vulnerability assessment in the two pilot regions
was prepared, as well as the implementation of an explorative VA. Participants
consisted of rural extension workers and GIZ BKP technical advisors. Moreover,
a local consultant and two international consultants from adelphi and EURAC
were involved.
Following the workshop, additional explorative VAs will be conducted in the pilot
areas, focusing on additional bio-diversity related topics over a period of three
to four months. The implementation teams responsible for conducting the VA,
which also participated in the workshop, consist of approximately 16 team mem-
bers, including technical advisors of the GIZ BKP project team as well as technical
experts from local authorities and institutions. Furthermore, a local consultant
and possibly two international experts from adelphi/EURAC will provide back-
stopping. The overall time frame for the field surveys was estimated roughly at 2
days per valley. Two to three years after completion of the BKP project, the suc-
cess of the implemented measures shall be assessed by repeating the vulnerability
assessments at the end of the project.
Objective of the vulnerability assessment (Module 1; Step 2)
The objective of the VA in the two districts was to (a) raise awareness, (b) identify
suitable adaptation measures at the community level, monitoring and evaluating
their effectiveness and (c) provide policy advice. The VA overall objectives were
derived from the targets set by the project and an understanding between the
relevant stakeholders, which was achieved during the workshop.

44
V
A
N
N
E
X
1 0
a)
Raising awareness was the first and foremost objective as it served as the basis for
further action on adaptation. The aim was to have stakeholders understand the
different range and varying forms of vulnerability to climate change within the
BKP project area, especially related to biodiversity issues.
b)
Closely related to highlighting awareness on climate change vulnerabilities was
the VA’s focus on interventions. The VA was used to identify suitable adaptation
measures together with the stakeholders, experts, district-representatives and the
BKP project staff. A repeated VA shall furthermore be used to monitor and evalu-
ate adaptation effectiveness at the end of the BKP project.
c)
Attention was given to provide tangible policy advice to local authorities and rep-
resentatives of the people concerned. The main aim here was to identify suitable
climate change adaptation elements, which can be proposed within the Biodiver-
sity Action Plan for Capacity, and builds to support specific adaptation measures.
Determine the scope of the vulnerability assessment (Module 1; Step 3):
Selection of key topics
Important factors for the four vulnerability components exposure, sensitivity,
impact and adaptive capacity were first gathered by the presentation of the scop-
ing study.
These factors were pinned on boards and presented to the workshop participants,
who were then invited to add additional factors.
Figure 6: Results of the participatory session
Source: adelphi/EURAC 2014.

45
V
A
N
N
E
X
10
Using this large collection of possible impacts as a basis, all workshop participants
were then asked to identify the key impacts for the two case study areas. To do
this, each participant received three red dots that signified prioritized impacts
for Swat and three blue dots signifying prioritized impacts for Chitral (see Figure
7). This exercise resulted in the participants’ identification of the following key
impacts:
Land degradation: Erosion, landslides, flash floods
Agriculture: Change in yield (+ and -), change in fodder for livestock, options for
new crops due to climatic changes
Indirect effects of climate change on population and behavior: Climate migration
into the Swat/Chitral region, increasing fuel wood requirements, movement from
flood plains to slopes due to increasing risk of floods
Ecosystems: Shift in ecosystems, invasive species, reduction of indigenous spe-
cies, change in species richness
Water: Seasonal droughts, critical droughts
Figure 7: Participants assessing and budgeting impacts
Source: adelphi/EURAC 2014.

46
V
A
N
N
E
X
1 0
Figure 8: Result of the selection of potential impacts to be considered within the
vulnerability assessment
Source: adelphi/EURAC 2014.
Spatial and temporal scale and reference groups
As previously mentioned, the VA analyzed communities (valleys) at a local level
in two Pakistani districts. Two pilot valleys, one from Swat and one from Chi-
tral were focused on during the workshop. 2 to 3 pilot-communities (valleys) in
each district will be examined in the additional VAs that will be carried by the
implementation teams subsequent to the workshop. It was also decided that the
temporal scope of the VA covers current vulnerability and thus takes climatic data
of the past 30 years into account. The reference group is the total population of
the respective valley/village, although sub-groups and gender aspects must also
be taken into account.
Methodological approach
Considering the objective of the VA, its time-frame and the resources available, it
was decided to implement an explorative VA that predominantly relies on expert
judgment and participatory approaches. During the workshop, the expertise of
the participating stakeholders was used to conduct the VA. For future imple-
mentation of additional explorative VAs in the pilot valleys, questionnaires and
participatory rural appraisal techniques such as village meetings and focus group
discussion will be used, possibly including any available census data as well as
spatial data (such as land use or soil maps).
47
V
A
N
N
E
X
10
Developing an impact chain (Module 2)
In line with Module 2 of the Vulnerability Sourcebook, impact chains were
used to visualize and structure the cause-effect-relationships of vulnerability
towards soil erosion in the two pilot regions. The impact chains were also used
to brainstorm on possible adaptation measures.
During the second part of the workshop, an impact chain was developed for one
of the prioritized impacts: vulnerability towards land degradation, erosion and
landslides. As described in the Vulnerability Sourcebook, impact chains are used
to systemize the factors assumed to affect the vulnerability of a system and visu-
alize cause-effect relationships. Hence, all factors that contributed to the different
vulnerability components (exposure, sensitivity, adaptive capacity) were identi-
fied and systematically ordered in terms of cause-effect relations), as described in
Steps 1 to 4 of Module 2 of the Vulnerability Sourcebook.
We once again followed a stepwise procedure. Starting from the potential impact,
the different factors of exposure, sensitivity and adaptive capacity contributing
to vulnerability towards soil erosion were discussed with the implementation
teams. The expert-knowledge, specific know-how and varying perspectives of the
stakeholders proved to be an invaluable asset. Figure 9 depicts the subsequently
developed impact chain for soil erosion, landslides and land degradation vulner-
ability. Exposure is bound to the factor ‘Erratic but intensive precipitation events’.
Sensitivity towards soil erosion was thought to be influenced mainly by the
factors ‘deforestation’, ‘overgrazing’, ‘unsuitable cultivation of steep slopes’ and
‘soil type’. Adaptive capacity was defined by the factors ‘effectively enforced land
management’, ‘high dependency on natural resources’, ‘small land holdings’ and
‘farmers’ knowledge of proper land management’.
Brainstorm Adaptation Measures (Module 2; Step 5)
Impact chains are already one important result of a vulnerability assessment, as
they represent a conceptual model of all identified important relationships and
already enable adaptation planning and awareness raising. Adaptation options
can either decrease sensitivity or increase adaptive capacity. In our case, partici-
pants brainstormed on potential adaptation measures that could reduce defor-
estation and unsuitable cultivation, or increase law enforcement and/or farmers’
knowledge of proper land management. Adaptation options proposed to decrease
sensitivity factors were:
Forest/Deforestation: Afforestation with indigenous species
Grassland/overgrazing: Pasture management plan to restrict grazing
Unsuitable cultivation of steep slopes: Plant suitable crops such as wild rhubarb
Adaptation options proposed to increase adaptive capacity were providing train-
ing for farmers, policy advice, broadcasts on land management in the farmers’

48
V
A
N
N
E
X
1 0
radio, as well as sermons on biodiversity in mosques during Friday prayers. Im-
pressions from the brainstorming exercise during the workshop using Metaplan
are shown in Figure 10.
Figure 9: Impact chain for vulnerability towards ‘land degradation, erosion and
landslides’
Source: adelphi/EURAC 2014.
Figure 10: Impressions from the brainstorming exercise on adaptation options to
reduce sensitivity factors (left) and increase adaptive capacity (right) to vulner-
ability towards soil erosion.
Source: adelphi/EURAC 2014.
Exposure Sensitivity
land degradation
Vulnerability Adaptive Capacity
Forest: deforestation
Grassland: overgrazing
Soil Type (sand, silt, loam)
Effectively enforced land management
High depend-ency on natural
resources
Knowledge of farmers on proper land
management
Small land holdings
Erosion and Landslides
Vulnerabilityof village farmers to
land degradation, erosion + landslides
Arable land: Unsuitable
cultivation of steep slopes
Impact
Erratic but in-tensive precipi-
tation events
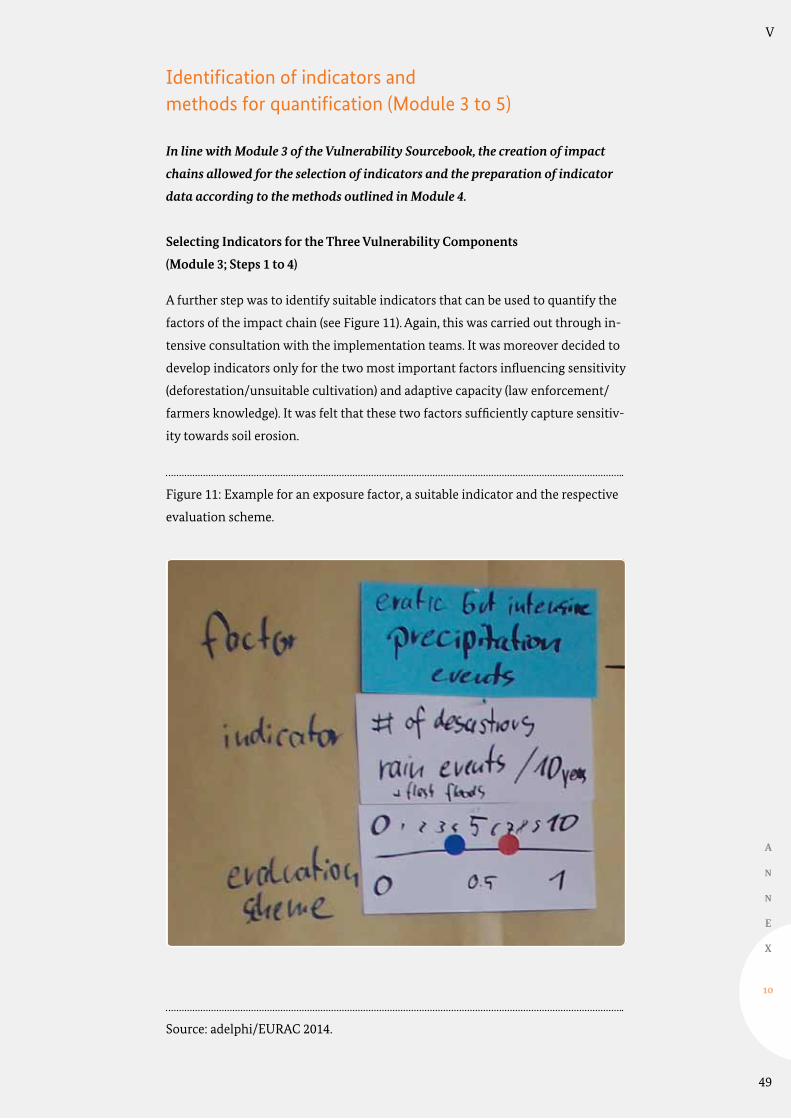
49
V
A
N
N
E
X
10
Identification of indicators and methods for quantification (Module 3 to 5)
In line with Module 3 of the Vulnerability Sourcebook, the creation of impact
chains allowed for the selection of indicators and the preparation of indicator
data according to the methods outlined in Module 4.
Selecting Indicators for the Three Vulnerability Components
(Module 3; Steps 1 to 4)
A further step was to identify suitable indicators that can be used to quantify the
factors of the impact chain (see Figure 11). Again, this was carried out through in-
tensive consultation with the implementation teams. It was moreover decided to
develop indicators only for the two most important factors influencing sensitivity
(deforestation/unsuitable cultivation) and adaptive capacity (law enforcement/
farmers knowledge). It was felt that these two factors sufficiently capture sensitiv-
ity towards soil erosion.
Figure 11: Example for an exposure factor, a suitable indicator and the respective
evaluation scheme.
Source: adelphi/EURAC 2014.

50
V
A
N
N
E
X
1 0
During the selection of indicators it was kept in mind that as they were quantified
through expert knowledge or participatory approaches, they therefore needed to
be formulated in an easy and comprehensive way. The following indicators were
identified and agreed upon by the workshop participants (see figure 12):
Exposure:
# of days where catastrophic rain events took place in the last 10 years
Sensitivity:
% of deforestation on slopes > 15°
% of area of unsuitable cultivation on slopes >15°
Adaptive capacity:
Villagers satisfaction with law enforcement
# of good management-practices
Figure 12: Indicators for the Impact Chain ‘Land Degradation, Erosion and Landslides’
Source: adelphi/EURAC 2014.
Exposure Sensitivity
Vulnerability Adaptive Capacity
Forest: deforestation
Effectively enforced land management
Knowledge of farmers on proper land management
Vulnerabilityof village farmers to
land degradation, erosion + landslides
Arable land: Unsuit-able cultivation of
steep slopes
% of deforestation on slopes > 15°
% of area of unsuitable cultivation on slopes > 15°
0 = much 1= rather much 2 = rather few3 = few; 4 = no
# of good management q practices Terracingq Cover croppingq Intermediate croppingq Bio-engineering
Erosion and Landslides Impact
Erratic but inten-sive precipitation
events
# of days with disas-trous rain events in
the last 10 years

51
V
A
N
N
E
X
10
Evaluation of indicators (Module 5)
In line with Module 5 of the Vulnerability Sourcebook, the indicators were then
normalized to a common unit-less scale from 0-1.
To be able to perform a vulnerability assessment, each indicator needed to be
evaluated in accordance with a standardized assessment scheme from 0 to 1 with:
‘0’ in the context of exposure and sensitivity
An exposure value (climate, weather) which does not pose any harm to the
system.
A sensitivity value, which does not sensitize the system to climate or weather
related exposure under average conditions, (the system is ‘climate proof’).
An adaptive capacity indicating social or economic conditions, or available
adaptation options, which do not enable adaptation and would harm a system
in such a magnitude that it seriously threatens the system.
‘1’ in the context of exposure and sensitivity
An exposure value (climate, weather) which harms a system in such a
magnitude that it seriously threatens the system, and cannot be entirely com-
pensated by low sensitivity or high adaptive capacity. Extreme events/years in
the past where catastrophic impact has taken place might serve as a reference.
A sensitivity, which does not provide any buffer to exposure and leads to a high
potential impact, even under low exposure.
An adaptive capacity indicating optimum adaptive capacity, which does not
constrain adaptation measures (but still may not compensate a very high
impact).
To that end, an evaluation scheme for each indicator was developed together with
the participants. In terms of the adaptive capacity indicator ‘effectively enforced
land management’), for instance, it was agreed that a rating from 0 (= much en-
forcement) to 5 (= no enforcement) will be applied, which has then been trans-
ferred (normalised) to the scale from 0 to 1 (see ‘law enforcement’ in Figure 13).
The evaluation schemes for all indicators are provided in the following illustra-
tion (see Figure 13).
Subsequently, the expert teams from both districts evaluated each indicator for
two selected valleys: Chel Valley in Swat and Rambur Valley in Chitral. The evalu-
ation provided by the participants is shown in Figure 14.
The evaluation revealed that individual factors of the two valleys in Swat and
Chitral differ significantly: While exposure to intensive rain events is higher in
the Swat region, which is affected by monsoons, in Chitral sensitivity is greater
due to high deforestation rates and high percentages of unsuitable cultivation on
steep slopes.
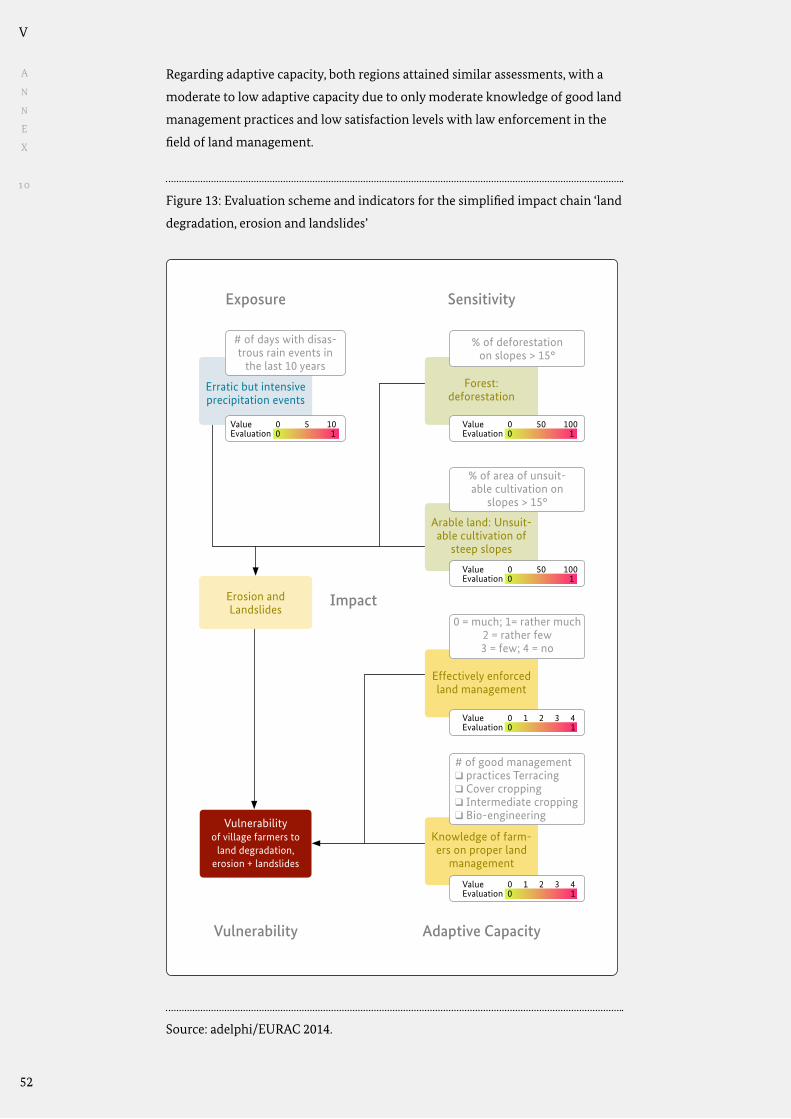
A
N
N
E
X
1 0
Regarding adaptive capacity, both regions attained similar assessments, with a
moderate to low adaptive capacity due to only moderate knowledge of good land
management practices and low satisfaction levels with law enforcement in the
field of land management.
Figure 13: Evaluation scheme and indicators for the simplified impact chain ‘land
degradation, erosion and landslides’
Source: adelphi/EURAC 2014.
Exposure
Impact
Vulnerability Adaptive Capacity
Forest: deforestation
Effectively enforced land management
Knowledge of farm-ers on proper land
management
Vulnerabilityof village farmers to
land degradation, erosion + landslides
Arable land: Unsuit-able cultivation of
steep slopes
% of deforestation on slopes > 15°
% of area of unsuit-able cultivation on
slopes > 15°
0 = much; 1= rather much 2 = rather few3 = few; 4 = no
# of good management q practices Terracingq Cover croppingq Intermediate croppingq Bio-engineering
Erosion and Landslides
Value 0 50 100Evaluation 0 1
Value 0 50 100Evaluation 0 1
Value 0 1 2 3 4Evaluation 0 1
Value 0 1 2 3 4Evaluation 0 1
Sensitivity
Erratic but intensive precipitation events
# of days with disas-trous rain events in
the last 10 years
Value 0 5 10Evaluation 0 1
52
V

V
Aggregating indicators and vulnerability components (Module 6 and 7)
In accordance with the Vulnerability Sourcebook’s concept, weighting and ag-
gregation of individual indicators to vulnerability components (Module 6) to
overall vulnerability (Module 7) was carried out in three steps.
First Step:
Aggregation of individual vulnerability component indicators (exposure, sensitiv-
ity, adaptive capacity)
All individual exposure indicators were aggregated to one value for the vulner-
ability component ‘exposure’.
All individual sensitivity indicators were aggregated to one value for the vulner-
ability component ‘sensitivity’.
All adaptive capacity indicators were aggregated to one value for the vulnerability
component ‘adaptive capacity’. Since equal weighting was applied to all indica-
tors, the aggregation equation was simply:
Formula 1:
Second Step:
Aggregation of exposure and sensitivity to potential impact (again using weighted
arithmetic mean aggregation).
Third Step:
Aggregation of impact and adaptive capacity to vulnerability. Here, again a
weighted arithmetic mean aggregation was applied.
Formula 2:
The result of the aggregation procedure is presented in Figure 14.
53
vulnerability component index = I1 + I2
2
V = I + AC
with V = Vulnerability I= Impact AC = Adaptive Capacity 2
A
N
N
E
X
10
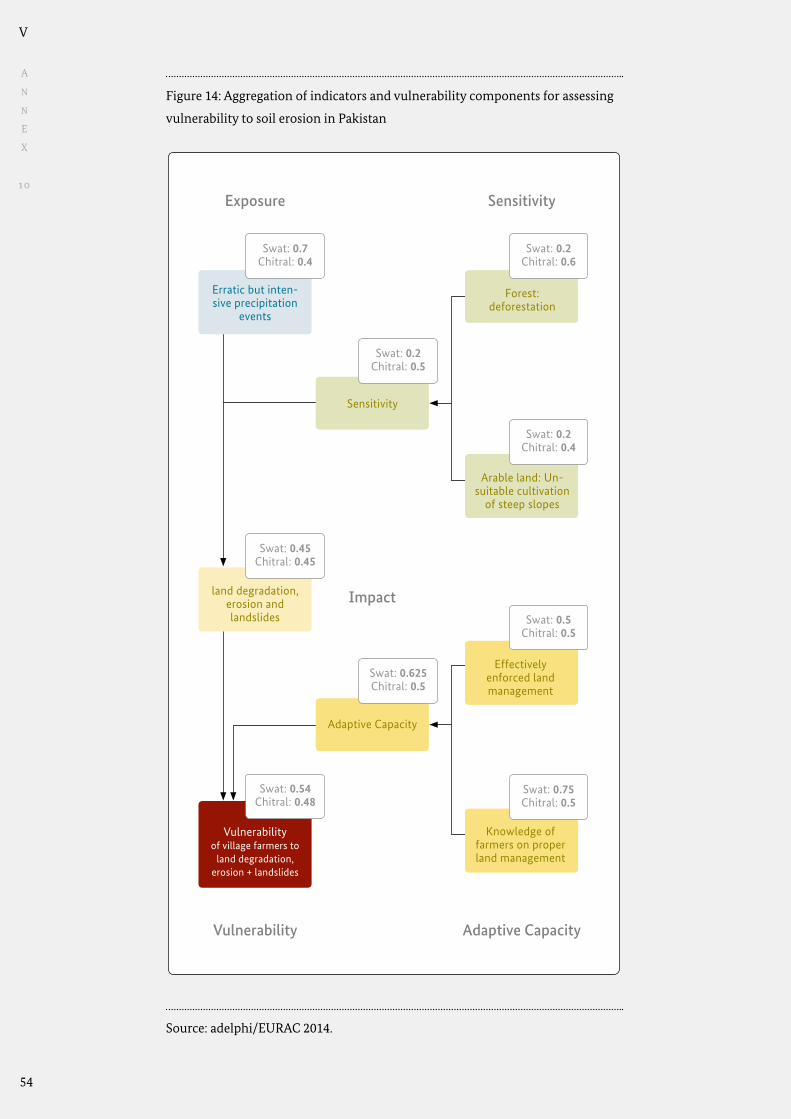
54
V
A
N
N
E
X
1 0
Figure 14: Aggregation of indicators and vulnerability components for assessing
vulnerability to soil erosion in Pakistan
Source: adelphi/EURAC 2014.
Exposure
Impact
Vulnerability Adaptive Capacity
Effectively enforced land management
Knowledge of farmers on proper land management
Vulnerabilityof village farmers to
land degradation, erosion + landslides
land degradation,erosion and landslides
Sensitivity
Erratic but inten-sive precipitation
events
Swat: 0.7Chitral: 0.4
Sensitivity
Swat: 0.2Chitral: 0.5
Forest: deforestation
Swat: 0.2Chitral: 0.6
Arable land: Un-suitable cultivation
of steep slopes
Swat: 0.2Chitral: 0.4
Swat: 0.45Chitral: 0.45
Swat: 0.5Chitral: 0.5
Swat: 0.75Chitral: 0.5
Adaptive Capacity
Swat: 0.625Chitral: 0.5
Swat: 0.54Chitral: 0.48

55
V
A
N
N
E
X
10
Outcomes of the vulnerability assessment
Key findings, recommendations and next steps (Module 8)
The explorative VA in Pakistan provided several key insights: Chel Valley in
Swat is more exposed to erratic but intensive rain events than Rambur Valley in
Chitral. At the same time, Chel Valley is less sensitive, since it has suffered less de-
forestation and even the degree of unsuitable cultivation on steep slopes is lower.
Variations within the two vulnerability components ‘sensitivity’ and ‘exposure’
between the two districts results in an identical potential impact for both valleys.
This again highlights the importance of also considering individual vulnerability
components and even individual indicators when interpreting the results of a VA.
Adaptive capacity is somewhat higher in Rambur, due to a slightly higher level of
law enforcement. Overall vulnerability in both regions is medium with a slightly
higher level of vulnerability in Chel Valley.
Most interesting is identifying the weak points within the system, since these are
the entry points for adaptation options. For instance, the high degree of deforest-
ation in Rambur should be mentioned, which could be tackled by afforestation,
for example with indigenous plants. Unsuitable practices on steep slopes could
be addressed by providing training courses, or by broadcasting information on
sustainable practices over the farmers’ radio. Follow-up steps for the implementa-
tion teams in line with the explorative VA include:
Developing impact chains for other impacts related to biodiversity
Finding appropriate indicators which can be included in the Participative Rural
Appraisal (PRA) at village level
Agreeing on an evaluation scheme for each factor/indicator of the newly devel-
oped impact chains
Performing field surveys
Analyzing and reviewing the results
Documenting the VA
Communicating results
Identifying adaptation measures
Implementing suitable adaptation measures
Once the measures have been implemented, adaptation effectiveness shall be
monitored and evaluated (M&E) by repeating the vulnerability assessment at the
end of the BKP project life span. The documentation requirements for Monitor-
ing and Evaluation can be found in detailed explanations within the M&E Chap-
ter of the Vulnerability Sourcebook and include:
A thorough documentation of the entire VA and its related processes
Ensure reliability of indicators
Describe procedures for quantifying indicators
Keep assessment rules constant
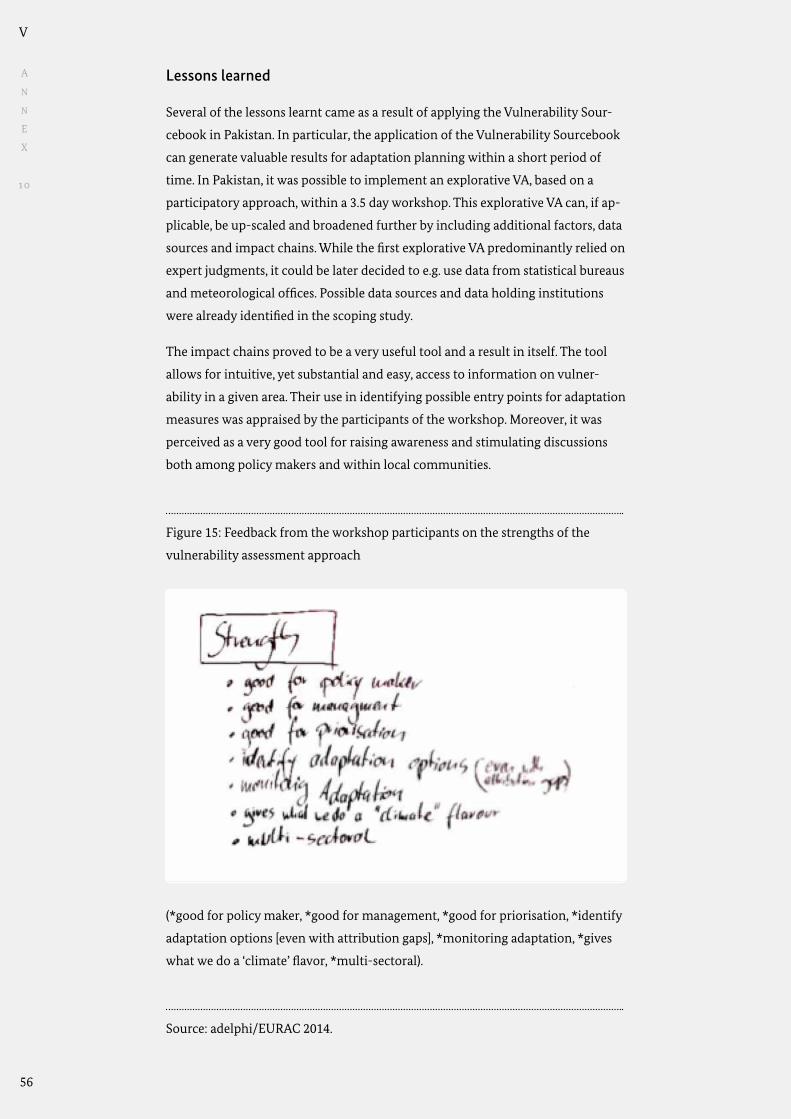
56
V
A
N
N
E
X
1 0
Lessons learned
Several of the lessons learnt came as a result of applying the Vulnerability Sour-
cebook in Pakistan. In particular, the application of the Vulnerability Sourcebook
can generate valuable results for adaptation planning within a short period of
time. In Pakistan, it was possible to implement an explorative VA, based on a
participatory approach, within a 3.5 day workshop. This explorative VA can, if ap-
plicable, be up-scaled and broadened further by including additional factors, data
sources and impact chains. While the first explorative VA predominantly relied on
expert judgments, it could be later decided to e.g. use data from statistical bureaus
and meteorological offices. Possible data sources and data holding institutions
were already identified in the scoping study.
The impact chains proved to be a very useful tool and a result in itself. The tool
allows for intuitive, yet substantial and easy, access to information on vulner-
ability in a given area. Their use in identifying possible entry points for adaptation
measures was appraised by the participants of the workshop. Moreover, it was
perceived as a very good tool for raising awareness and stimulating discussions
both among policy makers and within local communities.
Figure 15: Feedback from the workshop participants on the strengths of the
vulnerability assessment approach
(*good for policy maker, *good for management, *good for priorisation, *identify
adaptation options [even with attribution gaps], *monitoring adaptation, *gives
what we do a ‘climate’ flavor, *multi-sectoral).
Source: adelphi/EURAC 2014.
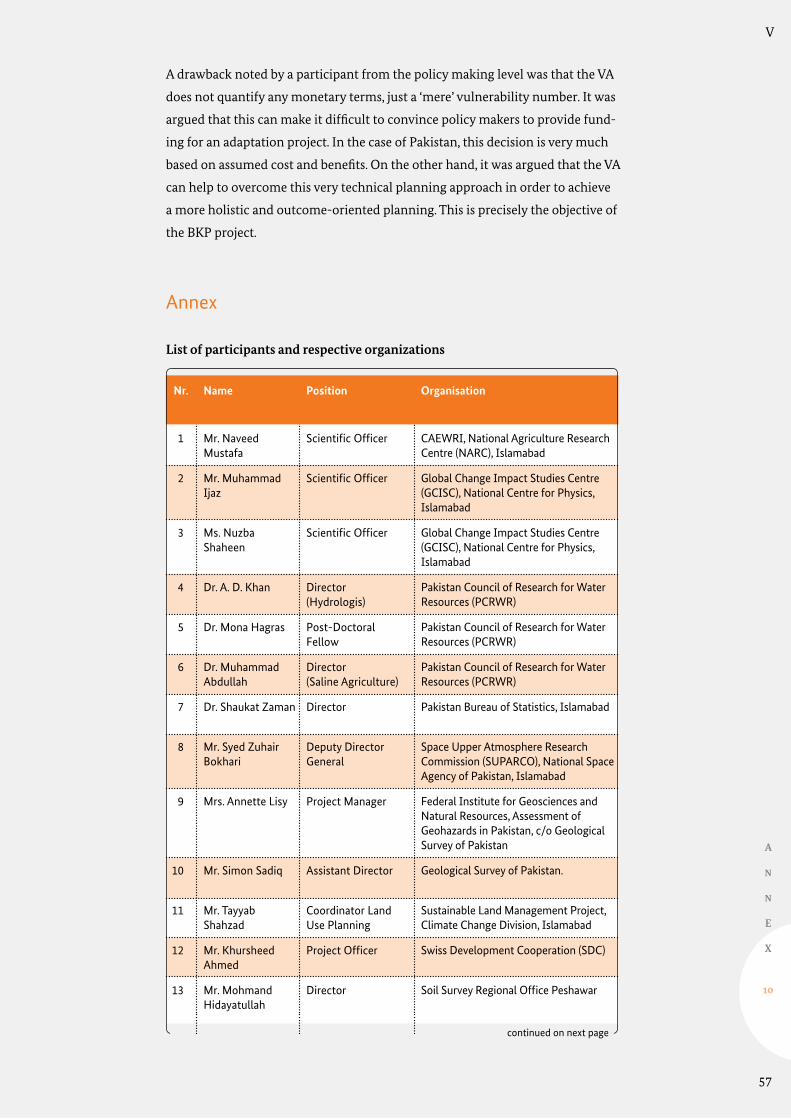
57
V
A
N
N
E
X
10
A drawback noted by a participant from the policy making level was that the VA
does not quantify any monetary terms, just a ‘mere’ vulnerability number. It was
argued that this can make it difficult to convince policy makers to provide fund-
ing for an adaptation project. In the case of Pakistan, this decision is very much
based on assumed cost and benefits. On the other hand, it was argued that the VA
can help to overcome this very technical planning approach in order to achieve
a more holistic and outcome-oriented planning. This is precisely the objective of
the BKP project.
Annex
List of participants and respective organizations
Scientific Officer
Scientific Officer
Scientific Officer
Director (Hydrologis)
Post-Doctoral Fellow
Director (Saline Agriculture)
Director
Deputy Director General
Project Manager
Assistant Director
Coordinator Land Use Planning
Project Officer
Director
Mr. Naveed Mustafa
Mr. Muhammad Ijaz
Ms. Nuzba Shaheen
Dr. A. D. Khan
Dr. Mona Hagras
Dr. Muhammad Abdullah
Dr. Shaukat Zaman
Mr. Syed Zuhair Bokhari
Mrs. Annette Lisy
Mr. Simon Sadiq
Mr. Tayyab Shahzad
Mr. Khursheed Ahmed
Mr. Mohmand Hidayatullah
CAEWRI, National Agriculture Research Centre (NARC), Islamabad
Global Change Impact Studies Centre (GCISC), National Centre for Physics, Islamabad
Global Change Impact Studies Centre (GCISC), National Centre for Physics, Islamabad
Pakistan Council of Research for Water Resources (PCRWR)
Pakistan Council of Research for Water Resources (PCRWR)
Pakistan Council of Research for Water Resources (PCRWR)
Pakistan Bureau of Statistics, Islamabad
Space Upper Atmosphere Research Commission (SUPARCO), National Space Agency of Pakistan, Islamabad
Federal Institute for Geosciences and Natural Resources, Assessment of Geohazards in Pakistan, c/o Geological Survey of Pakistan
Geological Survey of Pakistan.
Sustainable Land Management Project, Climate Change Division, Islamabad
Swiss Development Cooperation (SDC)
Soil Survey Regional Office Peshawar
1
2
3
4
5
6
7
8
9
10
11
12
13
Position OrganisationNameNr.
continued on next page
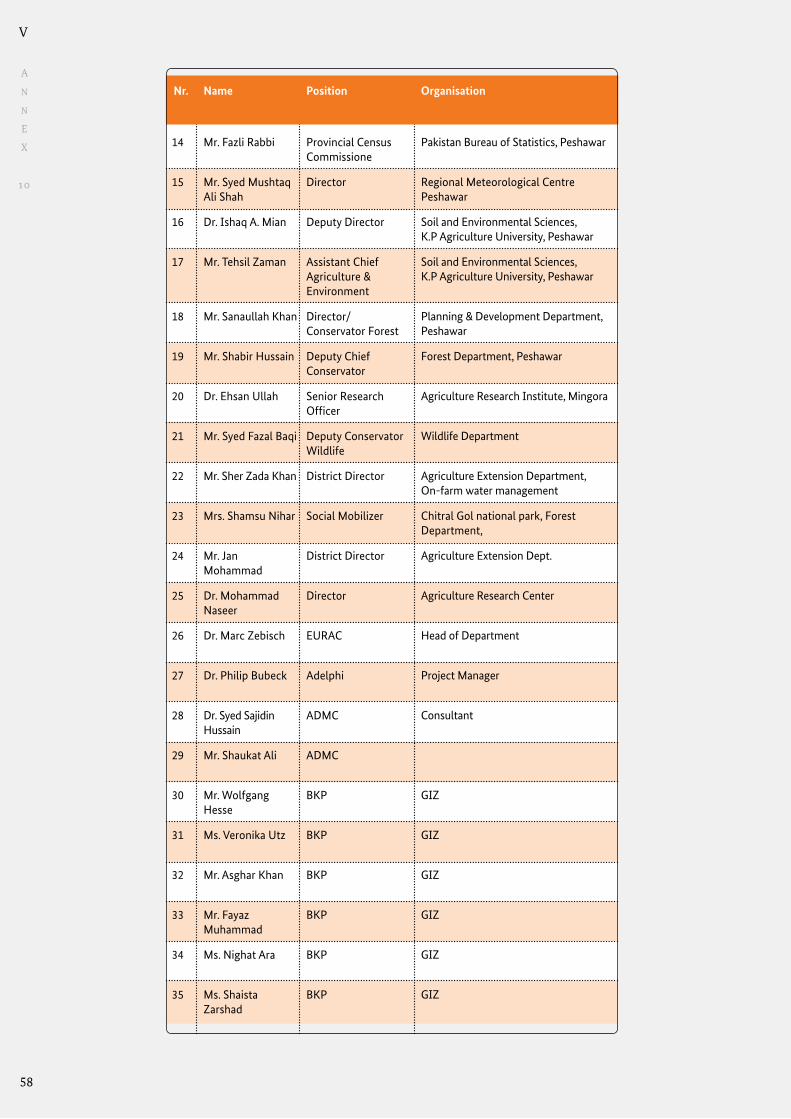
58
V
A
N
N
E
X
1 0
Provincial Census Commissione
Director
Deputy Director
Assistant Chief Agriculture & Environment
Director/Conservator Forest
Deputy Chief Conservator
Senior Research Officer
Deputy Conservator Wildlife
District Director
Social Mobilizer
District Director
Director
EURAC
Adelphi
ADMC
ADMC
BKP
BKP
BKP
BKP
BKP
BKP
Mr. Fazli Rabbi
Mr. Syed Mushtaq Ali Shah
Dr. Ishaq A. Mian
Mr. Tehsil Zaman
Mr. Sanaullah Khan
Mr. Shabir Hussain
Dr. Ehsan Ullah
Mr. Syed Fazal Baqi
Mr. Sher Zada Khan
Mrs. Shamsu Nihar
Mr. Jan Mohammad
Dr. Mohammad Naseer
Dr. Marc Zebisch
Dr. Philip Bubeck
Dr. Syed Sajidin Hussain
Mr. Shaukat Ali
Mr. Wolfgang Hesse
Ms. Veronika Utz
Mr. Asghar Khan
Mr. Fayaz Muhammad
Ms. Nighat Ara
Ms. Shaista Zarshad
Pakistan Bureau of Statistics, Peshawar
Regional Meteorological Centre Peshawar
Soil and Environmental Sciences, K.P Agriculture University, Peshawar
Soil and Environmental Sciences, K.P Agriculture University, Peshawar
Planning & Development Department, Peshawar
Forest Department, Peshawar
Agriculture Research Institute, Mingora
Wildlife Department
Agriculture Extension Department,On-farm water management
Chitral Gol national park, Forest Department,
Agriculture Extension Dept.
Agriculture Research Center
Head of Department
Project Manager
Consultant
GIZ
GIZ
GIZ
GIZ
GIZ
GIZ
14
15
16
17
18
19
20
21
22
23
24
25
26
27
28
29
30
31
32
33
34
35
Position OrganisationNameNr.
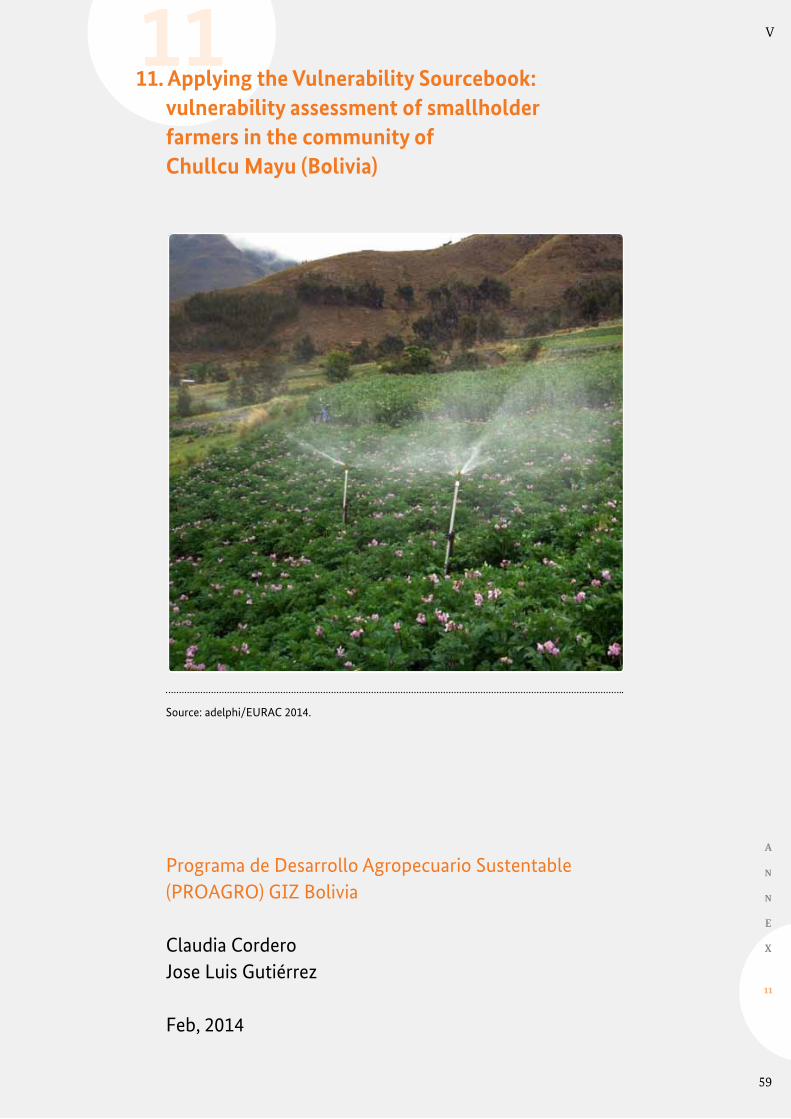
59
V
A
N
N
E
X
11
1111. Applying the Vulnerability Sourcebook:
vulnerability assessment of smallholder farmers in the community of Chullcu Mayu (Bolivia)
Source: adelphi/EURAC 2014.
Programa de Desarrollo Agropecuario Sustentable (PROAGRO) GIZ Bolivia
Claudia CorderoJose Luis Gutiérrez
Feb, 2014

60
V
A
N
N
E
X
1 1
List of contents:
Preparing the vulnerability assessment (Module 1) 60
Understanding the context of the vulnerability assessment (Module 1, Step 1) 60
Objectives of the vulnerability assessment (Module 1; Step 2) 61
Determine the scope of the vulnerability assessment (Module 1; Step 3) 61
Developing an impact chain (Module 2) 64
Assessment methodology (Module 3-7) 66
Key information on the overall implementation process of the vulnerability assessment 66
Identification of indicators (Module 3) 67
Identification of methods for quantifying the indicators (Module 4) 67
Weighting of indicators (Module 6) 72
Normalisation and evaluation of indicators (Module 5) 74
Aggregation of indicators and vulnerability components (Module 7) 76
Outcomes of the vulnerability assessment (Module 8) 77
Key findings 77
Climate impact under extreme precipitation conditions 78
The potential climate change impact in the future 80
Recommendations drawn from the vulnerability assessment 82
Lessons-learned from the implementation of the vulnerability assessment 84
Preparing the Vulnerability Assessment (Module 1)
Understanding the context of the vulnerability assessment (Module 1, Step 1)
The Sustainable Agricultural Development Program (PROAGRO, for its acro-
nyms in Spanish) is implemented by the Deutsche Gesellschaft für Internation-
ale Zusammenarbeit (GIZ) in Bolivia. The Program, co-financed by the Swedish
International Development Agency during its second phase covering 2011-2014,
focuses on strengthening small-holder farmers’ resilience to climate change in
dry areas of Bolivia.
In this context, the Program promotes together with national and subnational
stakeholders the implementation of the so-called Management Models, successful
experiences on agricultural development at a local level, documented to promote

61
V
A
N
N
E
X
11
its scaling up and knowledge management. One of this Management Models is
the ‘Technified Irrigation for a more efficient use of water in agriculture’ (from
now on, Technified Irrigation), as a response to water scarcity and low efficien-
cies of the traditional irrigation systems in rural communities of dry areas. Even
more, erratic rainfall reduces the potential for agricultural production, conse-
quently small-holder farmers living in dry areas are highly vulnerable to climate
change, and the sustainability of its livelihoods is at risk due to low production
levels, hence low agricultural incomes. To cope with this challenge, the Manage-
ment Model aims to apply new technologies for improving the intake, convey-
ance, distribution and application of water into crops with a localized irrigation,
to increase the irrigation area with the same water source, and to increase the
frequency of irrigation, which eventually allows crop diversification, rise in yields
and more incomes.
Agricultural development projects need to integrate climate change adaptation
into its planning, in order to reduce the climate vulnerability of farmers, espe-
cially in arid and semiarid regions, where producers with scarce livelihoods are
highly exposed to climate risks due to erratic rainfall and rise in temperatures.
In order to improve the understanding of the vulnerability components in these
agricultural areas for a better adaptation planning, PROAGRO is interested to
learn to what extend the small-holder farmers´ vulnerability to climate change is
reduced by implementing the Technified Irrigation management model.
Objectives of the vulnerability assessment (Module 1; Step 2)
PROAGRO promotes a Technified Irrigation management model for a more ef-
ficient water use in agriculture, as a measure for climate change adaptation of
smallholder farmers’ vulnerability to climate change.
Farmers in the Chullcu Mayu community have implemented this type of project,
hence, the objective of the assessment is to quantify to which extent climate vulner-
ability was reduced with the technification of the community’s irrigation system.
Determine the scope of the vulnerability assessment (Module 1; Step 3)
The lands in Chullcu Mayu are suitable for agriculture (Figure 1); however the low
water availability for irrigation is a constraint for increasing the agricultural pro-
duction; therefore in 2005 a gravity fed irrigation system was designed in order to
improve the livelihoods of the families. This community is located in the region
of inter-Andean valleys characterized by an uneven physiography, with precipi-
tation levels between 400 – 800 mm, and soil losses due to erosion. The water
scarcity is an obstacle for this fertile part of the country.
The problem for agricultural production in this region is water scarcity due to
erratic rainfall and low efficiency in their traditional irrigation systems. Therefore,

62
V
A
N
N
E
X
1 1
the main potential climate change impact is the reduction of the cropping area
under optimal irrigation.
Figure 1: View of Chullcu Mayu Community (Cochabamba, Bolivia)
Source: adelphi/EURAC 2014.
In this context, a semi-quantitative vulnerability assessment was conducted in
the community, considering vulnerability factors before and after the implemen-
tation of the Technified Irrigation system. The assessment focuses on the present
vulnerability, considering climate average conditions before implementing the
project (period 1960-1990), and after (period 1991-2011) project implementation.
In this special case study the vulnerability assessment was thus conducted to
compare two historic periods, one with adaptation and one without as an ap-
proach to evaluate the success of the adaptation measure (see section 4.4 about
possible different time periods for vulnerability assessments and chapter 12 for
monitoring and evaluation of adaptation measures with a VA).
In order to develop a better understanding of the system, additional assessments
were made on the impact of climate variability in the traditional irrigation sys-
tem, considering extreme events of lowest precipitation (year 2000) and highest
precipitation (year 1986). Likewise, an assessment was made as to how future
climate conditions (trends for 2030) according to the PRECIS climate regional
model, could affect the irrigation system. Table 1 explains the temporal scales of
the VA.
The spatial scope is the Chullcu Mayu community, part of the Tiraque municipal-
ity, located in the Department of Cochabamba (Bolivia). Its geographic location
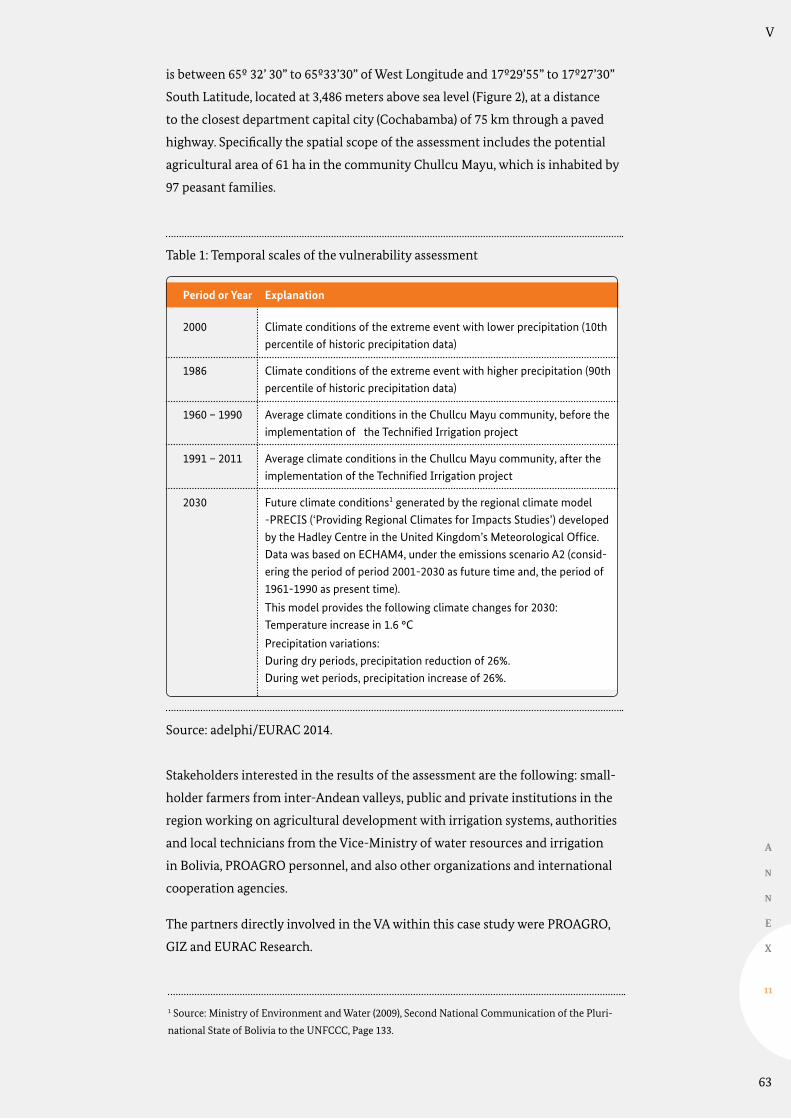
63
V
A
N
N
E
X
11
is between 65º 32’ 30” to 65º33’30” of West Longitude and 17º29’55” to 17º27’30”
South Latitude, located at 3,486 meters above sea level (Figure 2), at a distance
to the closest department capital city (Cochabamba) of 75 km through a paved
highway. Specifically the spatial scope of the assessment includes the potential
agricultural area of 61 ha in the community Chullcu Mayu, which is inhabited by
97 peasant families.
Table 1: Temporal scales of the vulnerability assessment
Source: adelphi/EURAC 2014.
Stakeholders interested in the results of the assessment are the following: small-
holder farmers from inter-Andean valleys, public and private institutions in the
region working on agricultural development with irrigation systems, authorities
and local technicians from the Vice-Ministry of water resources and irrigation
in Bolivia, PROAGRO personnel, and also other organizations and international
cooperation agencies.
The partners directly involved in the VA within this case study were PROAGRO,
GIZ and EURAC Research.
1 Source: Ministry of Environment and Water (2009), Second National Communication of the Pluri-
national State of Bolivia to the UNFCCC, Page 133.
Period or Year
Climate conditions of the extreme event with lower precipitation (10th percentile of historic precipitation data)
Climate conditions of the extreme event with higher precipitation (90th percentile of historic precipitation data)
Average climate conditions in the Chullcu Mayu community, before the implementation of the Technified Irrigation project
Average climate conditions in the Chullcu Mayu community, after the implementation of the Technified Irrigation project
Future climate conditions1 generated by the regional climate model -PRECIS (‘Providing Regional Climates for Impacts Studies’) developed by the Hadley Centre in the United Kingdom’s Meteorological Office. Data was based on ECHAM4, under the emissions scenario A2 (consid-ering the period of period 2001-2030 as future time and, the period of 1961-1990 as present time).
This model provides the following climate changes for 2030: Temperature increase in 1.6 °C
Precipitation variations:During dry periods, precipitation reduction of 26%. During wet periods, precipitation increase of 26%.
2000
1986
1960 – 1990
1991 – 2011
2030
Explanation
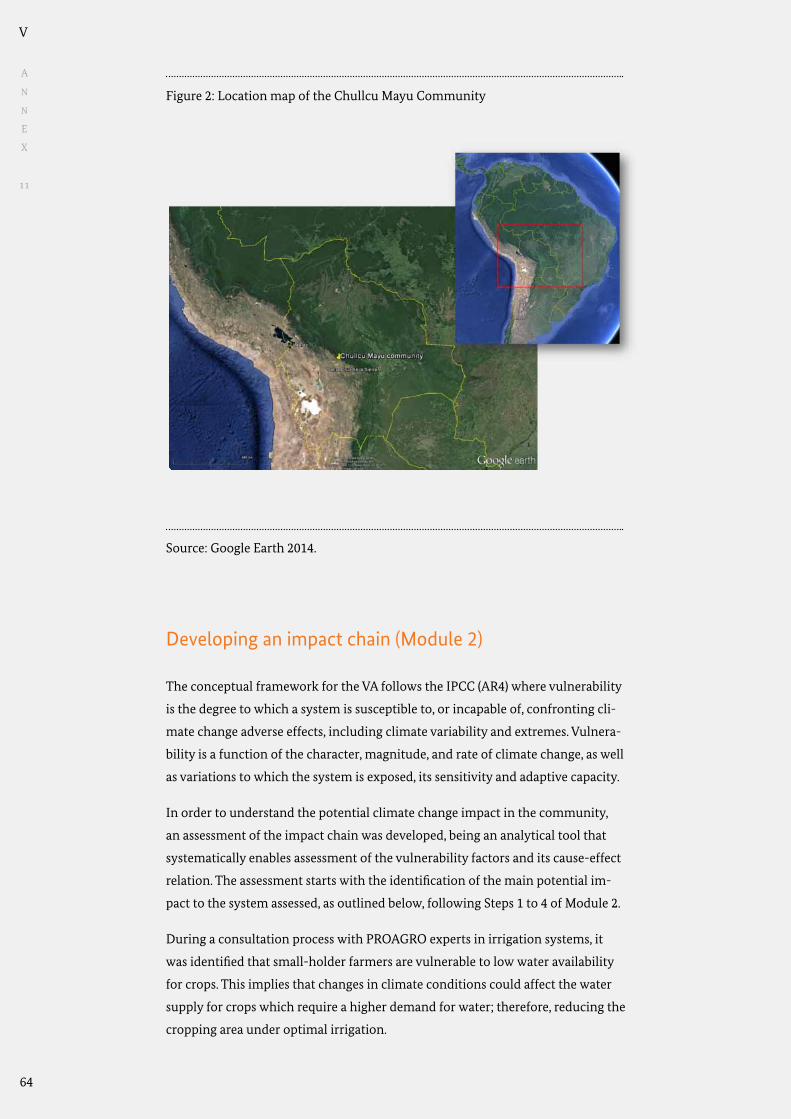
64
V
A
N
N
E
X
1 1
Figure 2: Location map of the Chullcu Mayu Community
Source: Google Earth 2014.
Developing an impact chain (Module 2)
The conceptual framework for the VA follows the IPCC (AR4) where vulnerability
is the degree to which a system is susceptible to, or incapable of, confronting cli-
mate change adverse effects, including climate variability and extremes. Vulnera-
bility is a function of the character, magnitude, and rate of climate change, as well
as variations to which the system is exposed, its sensitivity and adaptive capacity.
In order to understand the potential climate change impact in the community,
an assessment of the impact chain was developed, being an analytical tool that
systematically enables assessment of the vulnerability factors and its cause-effect
relation. The assessment starts with the identification of the main potential im-
pact to the system assessed, as outlined below, following Steps 1 to 4 of Module 2.
During a consultation process with PROAGRO experts in irrigation systems, it
was identified that small-holder farmers are vulnerable to low water availability
for crops. This implies that changes in climate conditions could affect the water
supply for crops which require a higher demand for water; therefore, reducing the
cropping area under optimal irrigation.
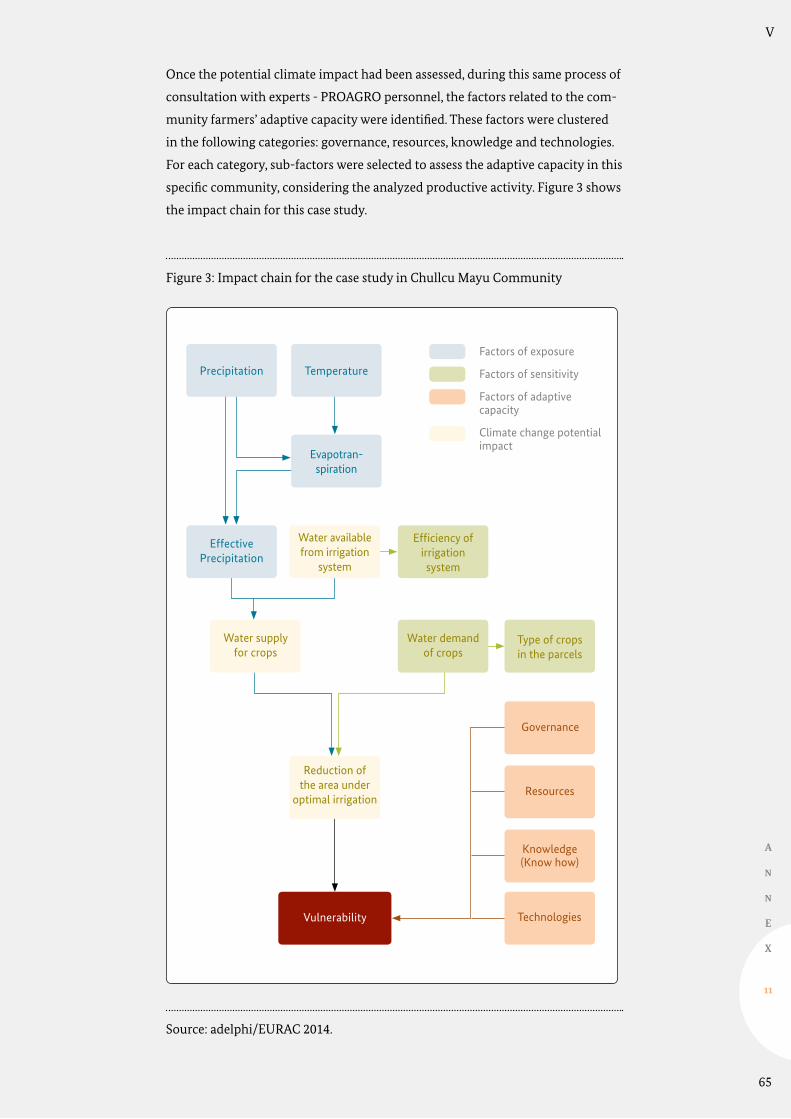
65
V
A
N
N
E
X
11
Once the potential climate impact had been assessed, during this same process of
consultation with experts - PROAGRO personnel, the factors related to the com-
munity farmers’ adaptive capacity were identified. These factors were clustered
in the following categories: governance, resources, knowledge and technologies.
For each category, sub-factors were selected to assess the adaptive capacity in this
specific community, considering the analyzed productive activity. Figure 3 shows
the impact chain for this case study.
Figure 3: Impact chain for the case study in Chullcu Mayu Community
Source: adelphi/EURAC 2014.
Precipitation Temperature
Water supply for crops
Evapotran-spiration
Resources
Governance
Knowledge (Know how)
Technologies
Efficiency of irrigation system
Type of crops in the parcels
Vulnerability
Effective Precipitation
Water available from irrigation
system
Water demand of crops
Reduction of the area under
optimal irrigation
Factors of exposure
Factors of sensitivity
Factors of adaptive capacity
Climate change potential impact

66
V
A
N
N
E
X
1 1
According to this impact chain, climate vulnerability in the Chullcu Mayu com-
munity is determined by:
Exposure: temperature and precipitation variations affect evapotranspiration and
effective precipitation levels.
Sensitivity: the agricultural production system in Chullcu Mayu is sensitive to cli-
mate variations due to low efficiency in the traditional irrigation system and the
type of crops cultivated in the parcels, aspects that determine the crops demand
for water.
Climate change potential impact: the reduction of the area under optimal irriga-
tion (soil moisture), is the main climate impact identified in the Chullcu Mayu
community, which depends on the balance of water supply and demand for
crops. According to this balance, the cropping area under optimal irrigation in the
system can be estimated.
Adaptive capacity: aspects like the level of governance or social organization, re-
sources available in the community, farmer’s specific know how on crop manage-
ment and productive systems or technologies available for agricultural produc-
tion, are factors that determine the farmers’ capacity of to cope with potential
climate impacts in their system.
Assessment methodology (Module 3-7)
Key information on the overall implementation process of the vulnerability assessment
This type of vulnerability assessment applied for the Chullcu Mayu test applica-
tion is focused on a very specific topic and uses a mixed method approach. A purely
quantitative approach is applied for assessing exposure, sensitivity, and impacts;. A
semi-quantitative approach is applied for assessing adaptive capacity, based on the
criteria of ‘expert opinion’, using proxy indicators that consider aspects clustered in
the following categories: governance, resources, knowledge, and technology.
The process started with a visit from the EURAC Research team to Bolivia in order
to explore the opportunities for a pilot application of the Vulnerability Source-
book Vulnerability, where a workshop was developed with PROAGRO personnel.
As a result, the irrigation project in Chullcu Mayu was selected for the VA, since it
had been implemented a few years ago, and it would be interesting to measure or
quantify the impact results regarding beneficiary farmers’ vulnerability.
The resources used for the VA included the ABRO software (acronym in Spanish
for Area under Optimal Irrigation), a tool officially used in the Bolivian water sec-
tor for designing irrigation projects financed by public funds, the regional climate

67
V
A
N
N
E
X
11
model PRECIS and historical meteorological records. After a first evaluation of
the available data, a consultant was hired to support the statistic modeling of the
meteorological data, introduce new climate data and run the ABRO software, and
the assessment of adaptive capacity. Three workshops and a field visit includ-
ing personal interview with a farmer were conducted with the PROAGRO team
linked with the Technified Irrigation project in this community. Two additional
workshops were carried out to present the results to the same team. Additionally,
the EURAC Research team made a second visit to Bolivia to backstop the process
and learn about the results on the application of the Vulnerability Sourcebook. In
total, about four months were needed to implement the VA.
Identification of indicators (Module 3)
Together with the PROAGRO and EURAC Research team, a visit was made to the
Chullcu Mayu community to get to know the area and obtain key information
form the local farmers involved. With this information, a first impact chain was
built. From that proposal, the PROAGRO team finalized construction of the im-
pact chain based on the factors that determine the small-holder farmers’ vulner-
ability in this community.
According to the local perceptions of the farmers interviewed in the field visit, in
this community the main climate hazards are deficit and erratic precipitations,
as well as extreme events like hail, frost and heat waves. From all these, the deficit
of precipitation has the most significant impact due to the low water availability
for agriculture, and consequently a reduction in production levels, food security
and agricultural income levels. Therefore, it was identified that the main potential
impact was the reduced water availability for agriculture in the community.
Once the potential impact to be assessed was identified, the team realized its dif-
ficulties to measure it directly; hence, a proxy indicator was identified: the area
under optimal irrigation (soil moisture). The rationale for this is that a reduction
in the availability of water due to less precipitation implies that the area under
optimal irrigation would reduce.
Identification of methods for quantifying the indicators (Module 4)
The methods to assess the climate vulnerability components are presented in the
following illustration (Figure 4): to assess the impact, the software ABRO is used;
to assess the adaptive capacity, the expert opinion elicitation is used.
The following tables (Table 2, Table 3), provide detailed information on each of the
vulnerability components (exposition, sensitivity and adaptive capacity), regard-
ing its calculation and additional information if corresponds, like measurement
frequency, source and owner of data.

68
V
A
N
N
E
X
1 1
Figure 4: Methods to assess vulnerability components
Source: adelphi/EURAC 2014.
Precipitation Temperature
Water supply for crops
Evapotran-spiration
Resources
Governance
Knowledge (Know how)
Technologies
Efficiency of irrigation system
Vulnerability
Effective Precipitation
Water available from irrigation
system
Water demand of crops
Reduction of the area under
optimal irrigation
Factors of exposure
Factors of sensitivity
Factors of adaptive capacity
Climate change potential impact
Factors modeled by
ABRO 3.1 software
Factors assessed by
expert opinion
Type of crops in the parcels

69
V
A
N
N
E
X
11
Table 2: Factors related to exposure
Source: adelphi/EURAC 2014.
Table 3: Factors related to sensitivity
Source: adelphi/EURAC 2014.
Factor (Unit of mea-surement)
These two factors are needed as input data in order to run the model ABRO 3.1The frequency of the measurement is monthly. The owner of the data is SENAMHI (National Service of Information on Meteorology and Hydrology). In order to use temperature and precipitation records of more than 30 years, these data were estimated with statisti-cal models (linear regression) from the Tiraque meteoro-logical station (with data from 1960 to 2011) to complete the same number of records for the Toralapa meteorologi-cal station (used for this project design).
Calculated by ABRO 3.1, with Max and Min Temperature, data modeled for Toralapa station, based on data of Tiraque station.
Calculated by ABRO 3.1., according to the climate conditions of the highlands, where Chullcu Mayu community is located. Input data for model ABRO 3.1
The information used for the calculation derives from measurements of water flow in the year 2007, in the water sources of the existent irrigation system and the projected sources that would increase the water flow for irrigation.
Corresponds to the sum of effective precipitation and water availability in the system, intended for crop irrigation.
Precipitation(mm)
Temperature(max and min) (°C)
Evapotran-spiration(mm/day)
EffectivePrecipitation(mm)
Water avai-lable in the irrigation system (m3)
Water avai-lable for crops
CommentsMethod of Calculation
Direct mea-surement
Direct mea-surement
ABRO 3.1Model
ABRO 3.1Model
ABRO 3.1Model
ABRO 3.1Model
Factor
The provided information is the type of crop, the month of sowing and the area cultivated.
Calculation base on the composition of crops in the parcels
Calculation based on the efficiency of the components of the irrigation system: intake, conveyance, distribution and application of water in parcels.
CropParcels
Crop water demand
Irrigation system Efficiency
CommentsMethod of Calculation
Input data for ABRO 3.1
ABRO 3.1Model
Input data for ABRO 3.1

70
V
A
N
N
E
X
1 1
The potential climate impact for small-holder farmers in Chullcu Mayu is as-
sessed based on the indicators mentioned above for exposition and sensitivity.
The proxy indicator for this purpose (area under optimal irrigation) is validated
with the criteria explained below (Table 4):
Table 4: Criteria to verify the appropriateness of the proxy indicator
Source: adelphi/EURAC 2014.
The adaptive capacity factors have been selected, considering how these aspects
help the farmers cope with the low water availability for agriculture in the com-
munity of Chullcu Mayu. The factors are the following (Table 5):
Criteria
The land surface area under optimal irrigation depends on the water provided by the irrigation system, the precipitation levels and temperatures (max and min), therefore it shows the impact of climate variables in the amount of hectares that can receive an optimum irrigation. This amount of hectares will be reduced when there is less rainfall than expected and higher temperatures that increase the water demand, regardless of the source that provides water for the system.
Technicians that elaborate irrigation projects use the area under optimal irrigation as a parameter of design of the projects, applying the ABRO software. PROAGRO experts agree that this proxy indicator is useful, con-sidering that there are no direct measurements representing in a better way the climate variations in agricultural production considering the available information in Bolivia.
The ABRO software, which calculates the area under optimal irrigation has the versatility to keep constant some parameters of the irrigation system operation (e.g. composition of the types of crops in the parcel, quantity of water to feed the system, etc.) and allows to change the climate condi-tions like precipitation and temperature, hence, it shows how the system responds to different climate conditions through time.
The ABRO software has been developed based on various experiences in irrigation systems design in Bolivia, and its use is extended throughout the national territory. Therefore, the measurement of the land surface area under optimal irrigation calculated by this software is reliable.
The use of the ABRO software to calculate the area under optimum irriga-tion as an indirect indicator of climate change, does comply with the criteria of practical, affordable , and simple, since it is a software of simple applica-tion that includes a manual for is installation in any computer which has a basic hardware configuration. It is affordable since it can be downloaded from the web free of charge.
The sensitivity of the ABRO software to detect small variations of climate conditions is not very high, which is a limitation for climate change vulner-ability assessments. However, due to the lack of information to feed more sophisticated and possibly more sensitive models, the current case study is obliged to use the ABRO software, considering this limitation.
Validity
Precise meaning
Applicability
Reliability
Practicability
Sensitivity
Comments

71
V
A
N
N
E
X
11
Table 5: Factors related to adaptive capacity
Source: adelphi/EURAC 2014.
It is important to mention the constraints faced when accessing data for the
assessment. The project mainly used data from the meteorological Station in
Toralapa, which only had records for a 10 year period. Therefore, a statistical model
was developed to increase the number of records. Hence, the climate information
used, corresponds to historical series statistically modeled with linear regression
techniques for the Toralapa Station; having used the precipitation and temperature
(maximum and minimum) of the Tiraque Station, located in the same basin, with
historical records of 52 years. It was verified that the correlation coefficients and
the p-value have a significant statistical association between the records of both
Stations, which guarantees reliability on the Toralapa’s Station modeled data.
Figure 5, shows historical records of the annual precipitations modeled for the
Toralapa Station. The graph shows a high variability with five peaks where the
level of precipitation is either greater than the 90th percentile of total records
(850mm) or below the 10th percentile (461mm) of precipitation records. Addition-
Factor or Year
Assessment of Chullcu Mayu farmers’ social and productive organization conditions in regards to the irrigation system, including:Organization of Producers related to the irrigation system and the rights to water access, as defined by them.
Assessment of the community’s available resources which may improve the agricultural production, including:Chullcu Mayu producers’ land availability Chullcu Mayu producers’ access to institutional support (Mainly referred to technical assistance).Chullcu Mayu producers’ access to information technology and servicesCommunity’s proximity to trade channels
Assessment of Chullcu Mayu producers’ knowledge (know how), which may improve agricultural production, be it traditional or introduced (through contemporary techniques), including:Introduction of new cropsCrop Management Adjustment to the agricultural calendar
Assessment of Chullcu Mayu producers’ application techniques to improve the agricultural production, including.Technology for soil managementTechnology for seed managementTechnology for plague and disease control
Gover-nance
Resources
Knowl-edge
Techno-logies
Observation
Expert opinion
Expert opinion
Expert opinion
Expert opinion
Method of calculation

72
V
A
N
N
E
X
1 1
ally, it can be observed that the annual precipitation used to design the irrigation
system (590mm) is below the average annual precipitation for the period between
1960 and 2011 (640mm). Therefore, the irrigation system can be considered to be
adapted even to low precipitation years.
Figure 5: Annual precipitations modeled for the Toralapa meteorological station
Source: adelphi/EURAC 2014, based on data from the Bolivian National Service of
Information on Meteorology and Hydrology – SENAMHI
Weighting of indicators (Module 6)
The ABRO software was used to calculate the potential climate impact before
the implementation of the irrigation measure and after the implementation (see
Table 6). The results of the model show that with average climate conditions and
without implementing the project, the traditional irrigation system supplied
water for only 4.94 ha of cropping area; and with the implementation of the Tech-
nified Irrigation project, the cropping area was increased up to 56.12 ha under
optimal irrigation.
In order to estimate the adaptive capacity in the community of Chullcu Mayu,
the expert opinion criteria was used, by allocating a specific weight to each factor
according to the experience and criteria of the experts that participated in the
assessment. With this purpose, a meeting was held with four technicians from
PROAGRO, to analyze the existing capacities for agricultural production among
the producers of the community; based on certain elements referred to govern-
ance, resources, technologies and knowledge applied to agricultural production.
An analysis was made for each of these factors to find out which are the most im-
portant aspects that determine a greater area under optimal irrigation, in a scale
between 0 and 100 ( scale: 0 = inexistent adaptive capacity, 100 = high adaptive
capacity). Based on the expert opinion it was defined that the factor of Govern-
ance was worth 35 points (main element), both Resources and Technologies were
1960 1965 1970 1975 1980 1985 1990 1995 2000 2005 2010
900.0
800.0
700.0
600.0
500.0
400.0
300.0
Modeled precipitation Toralapa Annual precipitation Toralpa Percentile 10 Percentile 90 Average Project Precipitation of calculation

73
V
A
N
N
E
X
11
worth 25 points and Knowledge 15 points. These groups of values are the criteria
used to assess the adaptive capacity.
Table 6: Area under optimal irrigation for climate conditions before and after the
implementation of the project
Source: adelphi/EURAC 2014.
As a next step, adaptive capacity elements were determined for each of the cat-
egories defined (e.g. governance, resources, see Table 7). For example, to assess the
Technologies, it is considered that the producers in Chullu Mayu who practice soil
and seed management and plague control, can better cope with adverse climate
impacts. Each one of these factors has been given a weight as shown in the fol-
lowing table.
Table 7: Weighting of factors for adaptive capacity
Source: adelphi/EURAC 2014.
Farmer’s irrigation organization
Land availability
Institutional Support (Technical Assistance)
Access to information
Proximity to trade channels
Knowledge on introduction of new crops
Crop management knowledge
Adjustments to agricultural calendar
Soil management
Seed management
Plague and disease control
Governance
Resources
Knowledge (know how)
Technologies
35
25
15
25
100
40
10
25
25
30
30
40
30
35
35
Factor CommentsWeight Weight
Factor or Year
632.8
16.1
2.2
1,229.00
4.94
Annual Precipitation (mm)
Average Annual Temperature (°C)
Annual Evapotranspiration (mm)
Area under optimal irrigaion (ha)
1960 – 1990(without project)
Maximum
Minimum
650.8
17.0
1.9
1,295.77
56.12
1991 – 2011(with project)

74
V
A
N
N
E
X
1 1
Normalisation and evaluation of indicators (Module 5)
Once the factors, indicators and calculation parameters were established, the next
step was to normalize the data in order to transform it in comparable aggregated
units of measurement. Since the calculation of the potential impact is made on a
metric scale and the calculation of adaptive capacity is made on an ordinal scale,
the data had to be normalized in order to achieve a measurement of vulnerability
that is both standardized and comparable throughout time (see Module 5 of the
Vulnerability Sourcebook). Therefore, a normalization technique was used when
calculating the impact of climate change in Chullcu Mayu’s productive system,
before and after the Technified Irrigation system was implemented.
Acknowledging the fact that Chullcu Mayu has 61 ha for potential agricultural
production, climate impact was analyzed using Formula 1:
Formula 1:
Where, the value of 61 corresponds to the total land surface available for agricul-
tural production. Therefore, the greatest expected impact is equal to 100 points,
which would imply that the area under optimal irrigation would be 0 ha, since the
climate conditions would be so adverse that not enough water would be supplied
for an optimal irrigation. On the contrary, a result of 61 ha, under optimal irriga-
tion would imply that the climate conditions have no impact whatsoever (equal
to 0 points). The table below (Table 8) shows the application of this equation.
Table 8: Climate impact assessment in Chullcu Mayu
Source: adelphi/EURAC 2014.
This implies that without the project, in the past, there was a high climate impact
(91,9 points). Presently, as of the implementation of the project, climate impact
Climate Impact = 61 ha-Area under optimal irrigation in ha
* 100 61 ha
Situation
4.9
56.1
Without Project
With Project
Area under optimal irrigation
91.9
8.0
Climate Impact (points)
Period(years)
1960 – 1990
1991 – 2011
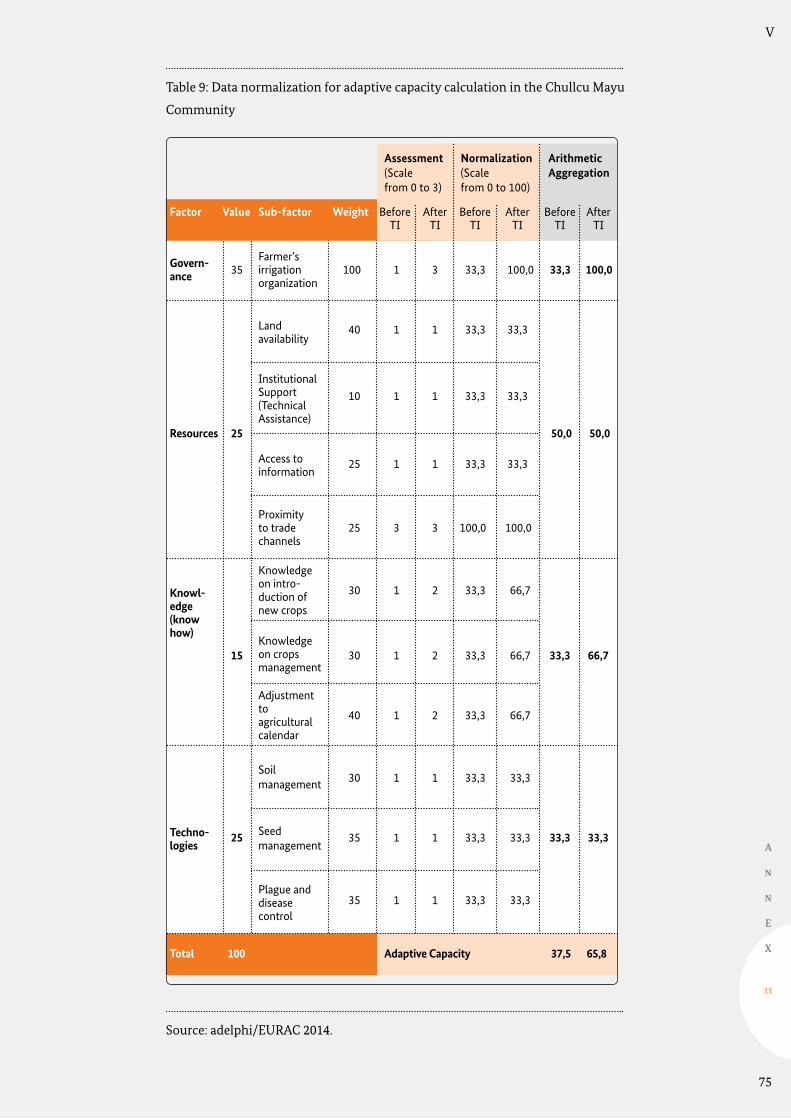
75
V
A
N
N
E
X
11
Table 9: Data normalization for adaptive capacity calculation in the Chullcu Mayu
Community
Source: adelphi/EURAC 2014.
Factor
ArithmeticAggregation
Normalization(Scale from 0 to 100)
Assessment(Scale from 0 to 3)
Value Sub-factor Weight
Govern-ance
Resources
Knowl-edge(know how)
Techno-logies
35 100 1 3 33,3 100,0 33,3 100,0
40 1 1 33,3 33,3
10 1 1 33,3 33,3
25 50,0 50,0
25 1 1 33,3 33,3
25 3 3 100,0 100,0
30 1 2 33,3 66,7
15 30 1 2 33,3 66,7 33,3 66,7
40 1 2 33,3 66,7
30 1 1 33,3 33,3
25 35 1 1 33,3 33,3 33,3 33,3
35 1 1 33,3 33,3
Farmer’s irrigation organization
Land availability
InstitutionalSupport(TechnicalAssistance)
Access to information
Proximity to trade channels
Knowledge on intro-duction of new crops
Knowledge on crops management
Adjustment to agricultural calendar
Soil management
Seed management
Plague and disease control
BeforeTI
AfterTI
BeforeTI
AfterTI
BeforeTI
AfterTI
Total 100 Adaptive Capacity 37,5 65,8
76
V
A
N
N
E
X
1 1
is lower in Chullcu Mayu (just 8 points), because there is a larger surface of land
under optimal irrigation (56,1 ha, instead of 4,9 ha).
In regards to the adaptive capacity, based on the identified factors and the estab-
lishment of criteria for its evaluation, the adaptive capacity was estimated for
the situation before the implementation of the project, and the situation after its
implementation. To do this, each of the sub-factors was assessed in a scale from 0
to 3. The corresponding values are 0= ‘inexistent adaptive capacity’, 1= ‘low adap-
tive capacity’, 2 = ‘medium adaptive capacity’ and 3= ‘high adaptive capacity’. The
qualification for each factor was developed in conjunction with the PROAGRO
team discussing the arguments for the assigned qualifications. The results are
presented in Table 9. Once the values were assessed according to the weighted
scale, the data was normalized and combined using arithmetic aggregation. This
enables to have an absolute value of the adaptive capacity for the cases with and
without Technified Irrigation project implementation.
The information in the previous table denotes that before the Technified Irriga-
tion system was implemented, there was a low adaptive capacity among the
producers of the community, which increased with the implementation of the
project. This is because the project strengthened farmer’s organization for the
irrigation system, promoted introduction of new crops, management of crops,
and adjustments to the agricultural calendar. Notwithstanding, however that the
farmers in the community require to improve their knowledge and practices in
regards to soil management, and probably access to seeds, as well as control of
plagues and diseases.
Aggregation of indicators and vulnerability components (Module 7)
For the calculation of climate vulnerability with and without implementation of
the Technified Irrigation system, a mathematical relation was identified to link
the climate change impact data and the adaptive capacity, both measured in a
scale from 1 to 100. The mathematical equation is the following (Formula 2):
Formula 2:
When aggregating climate change impact and adaptive capacity, it must be consid-
ered that both factors have different directions in terms of its influence on vulner-
ability (high adaptive capacity reduces vulnerability, high impact increases vulner-
ability). Therefore, the adjustment of this equation is as follows (Formula 3):
Formula 3:
Vulnerability = Impact — Adaptive Capacity
Vulnerability = 100 — ((100 — Impact) + Adaptive Capacity)
2

77
V
A
N
N
E
X
11
Note: According to the Vulnerability Sourcebook, all indicators are already
aligned in the direction in Module 5. In this case, there is no need to calculate the
inverse of the ‘Impact’ as it is done in Equation 3.
The following table (Table 10) shows the results of this equation’s application on
this case study.
Table 10: Calculation of climate vulnerability to climate change
Source: adelphi/EURAC 2014.
With the implementation of Technified Irrigation, the vulnerability of Chullcu
Mayu’s small-holder farmers has reduced because, on one hand the adaptive
capacity has increased, and on the other, the impact has been reduced in a great
magnitude with the supply of secure water through the technification of the ir-
rigation system.
It is important to remark that for the situation of ‘with project’, even though the
adaptive capacity further improved (which would imply 100 points), vulnerability
is not reduced to zero. Vulnerability reduces in magnitudes from 77 to 21 points;
showing that to cope with climate change, it is important to implement strategies
to reduce climate sensitivity. For example, it is important to implement strategies
to reduce the sensitivity of the system, like adjusting the type of crops, in order to
reduce water deficit, and consequently reduce climate vulnerability of producers
to extreme events.
Outcomes of the vulnerabilty assessment (Module 8)
Key findings
The Technified Irrigation Management Model has efficiently contributed to
reduce the climate vulnerability of small-holder farmers in the community of
Chullcu Mayu through the following:
Reduction of the sensitivity in the system, through adjustments in the type of
crops and the dates for sowing, with the certainty of secure water supply and with
a greater efficiency in the parcels, which has increased the land surface under
optimal irrigation.
Situation
38
66
Before Technified Irrigation
After Technified Irrigation
Adaptive Capacity
77
21
VulnerabilityImpact
92
8

78
V
A
N
N
E
X
1 1
Increase of adaptive capacity, through strengthening the farmers’ organization
for the irrigation system, an effective use of the available resources (optimal use
of the land, proximity to trade channels), a greater access to knowledge (intro-
duction of new crops, adjustments to the agricultural calendar), and applica-
tion of production technologies (with soil and seeds management, and plague
control).
In the past, climate variability had a more severe impact than the climate change
in the agricultural activities of the Chullcu Mayu Community. This negative
climate impact was substantially reduced with the implementation of the Techni-
fied Irrigation Project, because the greater water supply increased the cropping
area under optimal irrigation, and this contributed to improving food security
and agricultural income. As observed on table 10, the project, having reduced the
vulnerability of the producers (from 77 to 21 points, on a scale of 100), has been
established as an efficient measure for climate change adaptation.
The reduction of vulnerability to climate impacts of small-holder farmers with
Technified Irrigation is due to an increase in the adaptive capacity and reduction
of the potential climate impact. As this situation is known, the following sections
show results as to how the project has reduced the potential climate impact to
extreme events and to future climate change.
Climate impact under extreme precipitation conditions
The impact of climate variability was analyzed in the production area of the
Chullcu Mayu community, with a meteorological historical data series, where
it was identified that in the year 2000 the area had the lowest precipitation level
(close to the 10th percentile), and on the other extreme, in 1986 records show the
highest precipitation level (close to the 90th percentile). These data were intro-
duced in the ABRO software in order to model the land surface under optimal
irrigation (indirect indicator of climate change impact), on both extreme events.
The results are shown in the following table (Table 11).
In Chullcu Mayu, extreme climate events are caused by the variations in precipi-
tation levels (among the two extreme events occurred in 1986 and 2000 there is a
difference of 402mm, equivalent to 88%). Temperature (and evapotranspiration)
variations are very slight.
When analyzing the situation in Chullcu Mayu without the project, it is observed
that extreme variations in precipitation determine the increase or decrease of the
land surface under optimal irrigation.
For the situation with the implementation of the project, on the other hand, the
land surface under optimal irrigation is not affected by the level of precipitation,
be it high or low, since the Technified Irrigation system is in operation, which
complements water supply under any precipitation deficit. In fact, the Techni-

79
V
A
N
N
E
X
11
fied Irrigation project increases the irrigation system’s efficiency, and therefore,
reduces the climate sensitivity of the system.
In conclusion, the project allows the reduction of climate variability impact:
variations in the precipitation, does not affect the area under optimal irrigation.
By increasing the efficiency of the irrigation system with technification, climate
sensitivity of the system is reduced, and there is available and secure water supply
for agricultural production.
Table 11: Area under optimal irrigation for extreme precipitation conditions in
Chullcu Mayu
Source: adelphi/EURAC 2014, based on ABRO software and modeled data from
the Toralapa Station.
Analysis
C. Difference
(1986 with respect to 2000)
B. 1986A. 200
Annual Precipitation
Average Annual Temperature
Annual Evapotranspiration
Area under optimal irrigation without the project
Area under optimal irrigation with the project
455.3 mm
16.9 °C
1.7 °C
1,294.81 mm
1.14 ha.
0.49 ha.
0.27 ha.
0.49 ha.
0.30 ha.
2.69 ha.
18.51 ha.
10.10 ha.
5.89 ha.
8.41 ha.
8.41 ha.
51.32 ha.
Precipitation – 10th percentile
Precipitation –90th percentile
Year
857.5 mm
16.8 °C
1.4 °C
1,300.25 mm
1.85 ha.
0.80 ha.
0.43 ha.
0.80 ha.
0.49 ha.
4.37 ha.
18.61 ha.
10.15 ha.
5.92 ha.
8.46 ha.
8.46 ha.
51.60 ha.
402.2 mm
0.1 °C
0.3 °C
5.44 mm
0.71 ha. (+62.28 %)
0.31 ha. (+63.27 %)
0.16 ha. (+59.26 %)
0.31 ha. (+63.27 %)
0.19 ha. (+63.33 %)
1.68 ha. (+62.45 %)
0.10 ha. (+0.54 %)
0.05 ha. (+0.50 %)
0.03 ha. (+0.51 %)
0.05 ha. (+0.59 %)
0 05 ha. (+0.59 %)
0.28 ha. (+0.55 %)
Maximum
Minimum
Potato (late)
Fava bean (dry)
Carrot
Oat (fodder)
Gladiolus
Potato (late)
Potato (early)
Fava bean (green)
Carrot
Oat (fodder)
Gladiolus
Total Area

80
V
A
N
N
E
X
1 1
The potential climate change impact in the future
Information was used from the regional model ‘Providing Regional Climates
for Impacts Studies’ (PRECIS), to analyze future potential climate change
impact on the productive activity of Chullcu Mayu. This model considers the
time the periods between 1961 and 1990 as present and as future period 2001
to 2030. In the present time, an average of the precipitation and temperature
was made and future climate conditions were calculated. The model projects a
temperature raise of 1,6 °C and a mixed trend for precipitation. The rainfall is
projected to be reduced during dry season to 26% and increased during rainy
season by 26%.
It must be noted, that the climate information projected towards the future
shows a good consistency in both increase and magnitude of precipitation and
maximum temperature in relation to the historically recorded data. However, the
trend of the minimum temperature is contrary in relation to the recorded data.
In future the minimum temperature has a tendency to increase, however histori-
cal registries show a tendency to descend. Despite this fact and the uncertainty of
that the climate change model implies, the results of the PRECIS model were pre-
sented in the II National Bolivian Communication to the UNFCCC; therefore, till
this moment the data pertains to the country’s official information. Climate data
for the present and the future has been introduced to the ABRO model in order to
observe climate change impact on the land surface under optimum irrigation for
Chullcu Mayu.
Table 12 shows, that the projected future climate conditions are: a greater annual
average precipitation in 129 mm, increase of the minimum average temperature
from 2.2°C to 3.8°C, and an increase of the maximum average temperature from
16.1°C to 17.7° C. In general this could signify overall improved climatic condi-
tions for agricultural production in Chullcu Mayu. However, the increase in
temperature implies an increase in evapotranspiration, which will increase water
demand for crops, and in turn compensates precipitation increase, resulting in a
net increase of only 72 mm.
Evapotranspiration increase in the future implies a special attention in consider-
ing which crops are adequate for future climate conditions that will optimize
water and soil use for a sustainable agricultural production. Therefore, in the fu-
ture, a strategy to reduce climate change vulnerability consists in sowing different
types of crops, considering water demand, with the purpose of reducing climate
sensitivity of the agricultural system.
Without the Technified Irrigation Project Chullcu Mayu community presently
would only posess 5 ha for production under optimal irrigation, and in the future
may attain up to 6 ha (column A and B, mid-section), due to precipitation in-
crease, which is almost proportionate to increase of the cropping area.
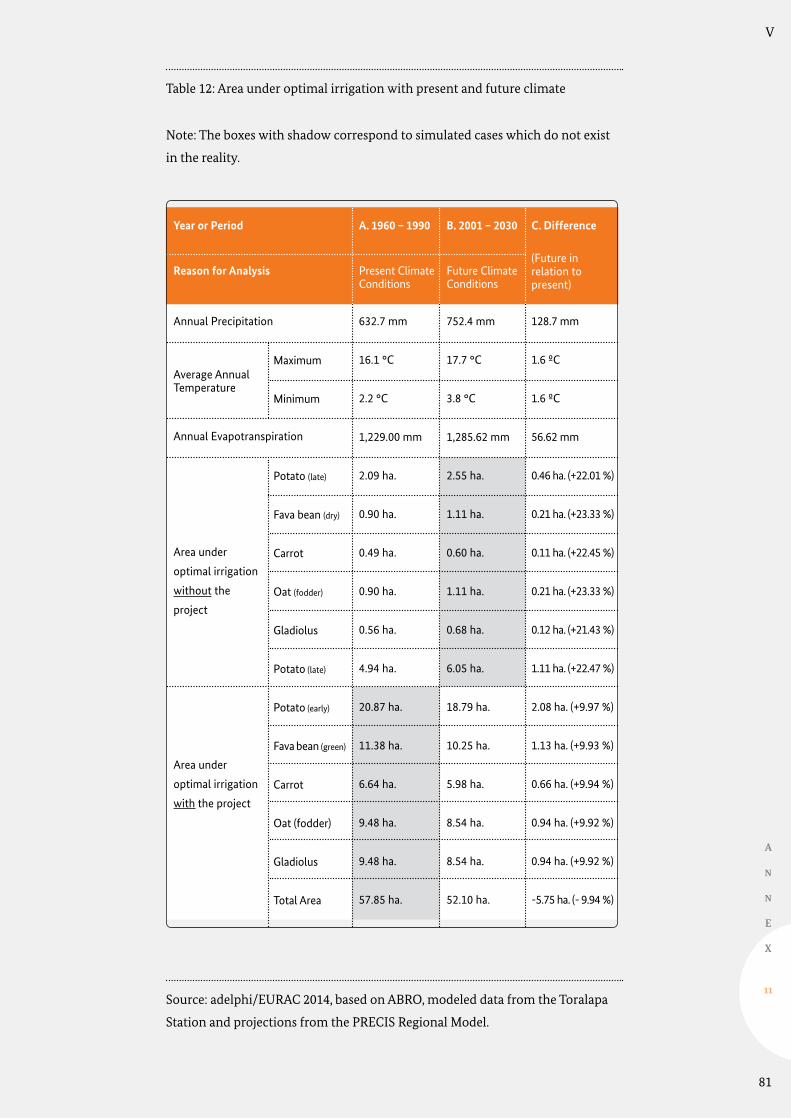
81
V
A
N
N
E
X
11
Table 12: Area under optimal irrigation with present and future climate
Note: The boxes with shadow correspond to simulated cases which do not exist
in the reality.
Source: adelphi/EURAC 2014, based on ABRO, modeled data from the Toralapa
Station and projections from the PRECIS Regional Model.
Reason for Analysis
C. Difference
(Future in relation to present)
B. 2001 – 2030A. 1960 – 1990
Annual Precipitation
Average Annual Temperature
Annual Evapotranspiration
Area under
optimal irrigation
without the
project
Area under
optimal irrigation
with the project
632.7 mm
16.1 °C
2.2 °C
1,229.00 mm
2.09 ha.
0.90 ha.
0.49 ha.
0.90 ha.
0.56 ha.
4.94 ha.
20.87 ha.
11.38 ha.
6.64 ha.
9.48 ha.
9.48 ha.
57.85 ha.
Present Climate Conditions
Future Climate Conditions
Year or Period
752.4 mm
17.7 °C
3.8 °C
1,285.62 mm
2.55 ha.
1.11 ha.
0.60 ha.
1.11 ha.
0.68 ha.
6.05 ha.
18.79 ha.
10.25 ha.
5.98 ha.
8.54 ha.
8.54 ha.
52.10 ha.
128.7 mm
1.6 ºC
1.6 ºC
56.62 mm
0.46 ha. (+22.01 %)
0.21 ha. (+23.33 %)
0.11 ha. (+22.45 %)
0.21 ha. (+23.33 %)
0.12 ha. (+21.43 %)
1.11 ha. (+22.47 %)
2.08 ha. (+9.97 %)
1.13 ha. (+9.93 %)
0.66 ha. (+9.94 %)
0.94 ha. (+9.92 %)
0.94 ha. (+9.92 %)
-5.75 ha. (- 9.94 %)
Maximum
Minimum
Potato (late)
Fava bean (dry)
Carrot
Oat (fodder)
Gladiolus
Potato (late)
Potato (early)
Fava bean (green)
Carrot
Oat (fodder)
Gladiolus
Total Area
82
V
A
N
N
E
X
1 1
The situation with project implementation shows that under present climate
conditions, there would be 57.9 ha under optimal irrigation; however with future
climate conditions only 52.1 ha would have been achieved (column A and B, lower
section). Even if the average annual precipitation has increased by 20%, through-
out the year and particularly during the dry season, there are various months in
which the projected monthly precipitation level will be lower than in the same
months of the present time. According to this lower precipitation and a higher
evapotranspiration due to high temperature levels in the future, the area under
optimal irrigation with the project would be almost 10% less in the future than in
the present time.
Additionally, the ABRO exercise for the future did not adjust introduction of dif-
ferent types of crops for the new climate conditions, and as a consequence availa-
ble water is not optimized. Therefore, it would seem that the area under irrigation
is reduced in the future, when in reality it only responds to having used the same
types of crops in the ABRO system as in the present time. If technological adapta-
tion measures would have been taken into account in the model, there would be a
greater area under optimal irrigation; however in this case study, climate effect on
the cropping area is observed.
This shows that a strategy to reduce potential climate change impact in the crop-
ping area, would consist in reducing the effects of increased evapotranspiration
and taking advantage of increased precipitation in some months of the year,
through the following: i) adjustments to types of crops sown, introducing crops
with less water requirement and adequate to future climate conditions, and ii)
adjustments to the agricultural calendar.
Recommendations drawn from the vulnerability assessment
Based on the climate records of precipitation and temperature used in this case
study, the constant change in climate conditions is evident, and these have often
negative impacts for the agricultural activity. However, as long as the Techni-
fied Irrigation system is working, and adaptive capacities are strengthened (for
example making adjustment to the agricultural calendar), these impacts would
not be significant for Chullcu Mayu farmers. A strategy for reducing the potential
climate impact in the cropping area would be to reduce the effects of increased
evapotranspiration, and take advantage of precipitation increase in some months
of the year, through the following: i) adjustments types of crops sown, introduc-
ing crops with less water requirement and, and ii) adjustments to the agricultural
calendar. This shows the need to include an integrated technical assistance in
project designs in order to make adjustments according to climate variations, as
well as the importance of monitoring climate conditions to adjust measures for
agricultural development and optimize resources.
83
V
A
N
N
E
X
11
Even though, the implementation of Technified Irrigation in Chullcu Mayu, has
reduced climate vulnerability under lower levels, there is still a residual impact
under the present climate conditions, which could be reduced through adjust-
ments to types of crops sown and measures taken to strengthen the farmers’
adaptive capacity in the community.
Therefore, it is important to acknowledge the vulnerability determinants of the
analyzed system, since the adaptive process to climate change requires various
strategies in different areas, such as: productive system management (at infra-
structure level and human capacities to maintain an efficient system), ii) in the
area of productive organization to improve negotiation capacities which allow
the group access to resources, technologies and knowledge, and iii) in the area
of integral technical assistance to farmers, around diverse infrastructures, that
normally consist of external service (municipal or national) in order to guarantee
technical assistance to public sector investments.
Therefore, the implementation of productive projects require an integrated focus
that improves adaptive capacity and reduces climate sensitivity , considering
climate factors and its influence on natural resources output (water, soil, crops).
Hence, monitoring these climate factors and achieved outputs is essential to
make the necessary adjustment to the system and optimize resources.
In order to take advantage of the Technified Irrigation system in the community,
the farmer’s adaptive capacity should be strengthened. This may not be possible
in some areas, for example, the farmers in Chullcu Mayu have limited access to
available land and this will not change in the future. However, aspects such as
knowledge and technologies, as well as access to technical assistance, could be
optimized, reducing farmers’ vulnerability to climate change. This does not imply
that they require external assistance, but that farmers need to strengthen their
networks and alliances to achieve better negotiation conditions with the munici-
pality, non-governmental entities, and governmental rural programs, in order to
have better services for their crops. Also, they require more information on prices
and markets, products and agricultural inputs, which could be achieved, through
a strong social-productive organization in the community.
Even though, the irrigation system reduces vulnerability to precipitation and
temperature changes, it has a limited effect on avoiding or reducing negative im-
pacts of frosting on agricultural production. Therefore, it is necessary to establish
adaptive strategies in order to avoid damages and losses due to frost. Likewise, a
similar analysis should be made for hailstorm.
Considering that in this case study, the area under optimal irrigation has been
used as an indirect indicator of climate change, maintaining the other variables
of the irrigation system constant, it is necessary to periodically monitor the fol-
lowing: efficiency, and water quantity harboring the technified irrigation system,
verifying that these are not below the design levels.

84
V
A
N
N
E
X
1 1
Lessons-Learned from the Implementation of the vulnerability assessment
In order to develop the vulnerability assessment, it is important to understand
the impact chain, since it provides a clear view on the cause-effect relation in the
system analyzed, and allows identification of points for adaptation. Therefore, this
analysis of the impact chain with participative methods to involve diverse actors
is useful in improving comprehension regarding the vulnerability of the system,
and the need to adapt. It is to say, that this tool not only provides the guide to
progress with assessment, identifying the vulnerability factors, but can be used to
increase awareness on the need to adapt to climate change and develop capacities.
For quantitative, date driven approaches there will normally be a breach between
the information required to follow through a vulnerability assessment and the
necessary available information, be it historical or future models. Furthermore,
the level of uncertainty will be high. Therefore, it is important to find a balance
between the effort of a data driven approach and explanatory power of quantita-
tive results. Often, the value added of the assessment will be the comprehension
of the system’s vulnerability, identification of points of entry for adaptation and
the definition of the indicators for monitoring and tracking adaptations.
A pending element in the Chullcu Mayu case study was to give feedback from the
assessment results to the farmers that benefitted from the Technified Irrigation
Project, which was not possible due to lack of time. However, the recommenda-
tion is to consider feedback to the local actors as a fundamental input for results
to be implemented by the direct user involved in the system analysed.
Comments or suggestion about the case study: [email protected]

85
V
A
N
N
E
X
11


