Page 1
CHAPTER - V
CUSTOMER SERVICE AND CONSUMER SATISFACTION
INTRODUCTION
This chapter presents customer perception about and satisfaction
with Milma products. A brief profile of respondents such as residential area,
qualification, employment, annual income, numbers of members in the family
etc., of consumers of Milma milk and milk products is presented first. Then
the first part of the third secondary objective, the customer service level of
MRCMPU to maximise the perceived value of the customer was evaluated. In
the next part of this chapter, the last part of the third secondary objective,
consumer satisfaction was evaluated and an attempt was made to ascertain
consumer satisfaction score. Finally, residential area, qualification,
employment, annual income, numbers of members in the family etc., of non
users of Milma milk, purchase of milk and milk products by the non users of
Milma milk and the general matters affecting the quality of milk and milk
products were examined.
GENERAL
In this study, about forty consumers of Milma milk and milk products
(35 households and five non households) each from three districts such as
235
Page 2
Kannur, Kozhikode and Malapuram districts were taken as samples. Out of the
one hundred and twenty consumers (households & non households), 59.0
percent of consumers belong to rural area living in Villages, 27.0 percent
belong to certain corporation area living in Corporation and 14.0 percent
belong to Municipality, a sort of suburban area (Appendix 5.1). About 39.0
percent of the consumers (households only) were post graduates, 26.0 percent
held S.S.L.C. and Plus Two, 25.0 percent graduates, 7.0 percent below
S.S.L.C. and the remaining 3.0 percent held technical qualification (Appendix
5.2). Out of one hundred and five respondents (households only), 55.0 percent
employees working in govt. and semi govt. departments, 15.0 percent doing
business, 6.0 percent working in private organisations, about 1.0 percent
professionals and the remaining 23.0 percent retired hands and un employed
(Appendix 5.3). About 42.0 percent of the consumers had an annual income
varying from Rs 50,000 to one lakh, 24.0 percent, above Rs. 2 lakhs, 15.0
percent, varying from Rs 1 lakh to Rs 1.5 lakhs, 13.0 percent of the
consumers, below Rs. 50, 000, and 6.0 percent, varying from Rs 1.5 lakh to Rs
2 lakhs (Appendix 5.4). About 44.0 percent of the consumers had two adults in
the family, 19.0 percent, had three adults in the family, 17.0 percent had four
adults in the family, 11.0 percent had five adults in a family, 4.0 percent had
six adults in the family, 3.0 percent had seven adults in the family, and 2.0
percent had one adult in a family. Similarly 34.0 percent had two children in
236
Page 3
the family, 25.0 percent had one child in the family and 33.0 percent of the
consumers had no child in the family (Appendix 5.5).
As the first part of the third sub objectives of this study is to evaluate
the customer service level of MRCMPU for maximising the perceived value
of the customer, the opinion of the consumers of Milma milk and milk
products under the following heads are evaluated. They are:-
1. Awareness of Milma milk and milk products.
2. Availability of Milma milk and milk products.
3. Purchase of Milma milk and milk products.
4. Loyalty of consumers of Milma milk and milk products.
AWARENESS OF MILMA MILK AND MILK PRODUCTS
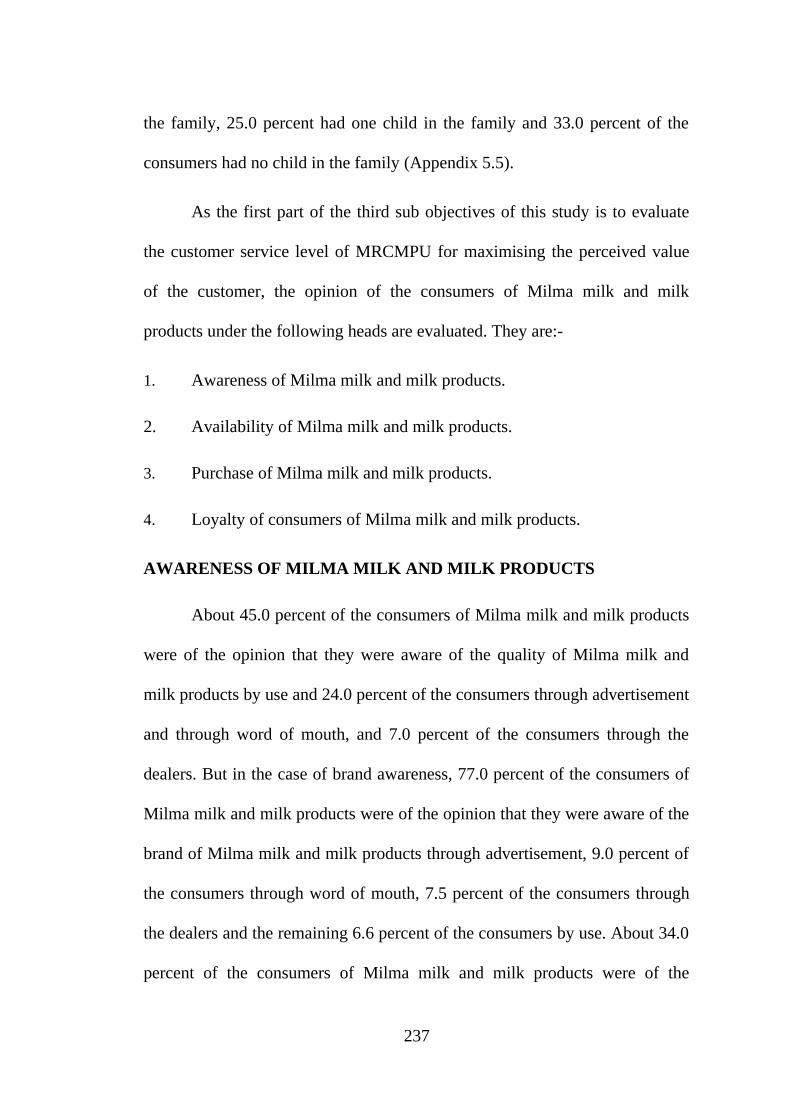
About 45.0 percent of the consumers of Milma milk and milk products
were of the opinion that they were aware of the quality of Milma milk and
milk products by use and 24.0 percent of the consumers through advertisement
and through word of mouth, and 7.0 percent of the consumers through the
dealers. But in the case of brand awareness, 77.0 percent of the consumers of
Milma milk and milk products were of the opinion that they were aware of the
brand of Milma milk and milk products through advertisement, 9.0 percent of
the consumers through word of mouth, 7.5 percent of the consumers through
the dealers and the remaining 6.6 percent of the consumers by use. About 34.0
percent of the consumers of Milma milk and milk products were of the
237
Page 4
opinion that they were aware of the price of Milma milk and milk products
through the dealers, 28.0 percent of the consumers through advertisement and
by use, and 10.0 percent of the consumers through word of mouth (Table 5.1).
Table 5.1: Awareness of Milma Milk and Milk Products
Quality Awareness
Brand Awareness
Price Awareness
Through advertisement 29 24.2 92 76.7 34 28.3
Through word of mouth 29 24.2 11 9.2 12 10.0
Through the dealers 8 6.7 9 7.5 41 34.2
By use 54 44.9 8 6.6 33 27.5
Total 120 100.0 120 100.0 120 100.0
AVAILABILITY OF MILMA MILK
In the case of the availability of Milma milk, various varieties of Milma
milk such as Toned Milk, Milma Rich (STD), Milma Smart, and Homogenous
Toned Milk were considered. Out of ninety consumers of Toned Milk, about
93.3 percent of the consumers of Milma milk were of the opinion that Toned
Milk was always available in summer, 96.7 percent of the consumers of
Milma milk were of the opinion that Toned Milk was always available in
monsoon and winter. It showed that there was the possibility of shortage of
Toned Milk in summer season. Similarly out of twenty three consumers of
Milma Rich, 95.7 percent of the consumers of Milma milk were of the opinion
that Milma Rich was always available in all seasons. But cent percent of the
238
Page 5
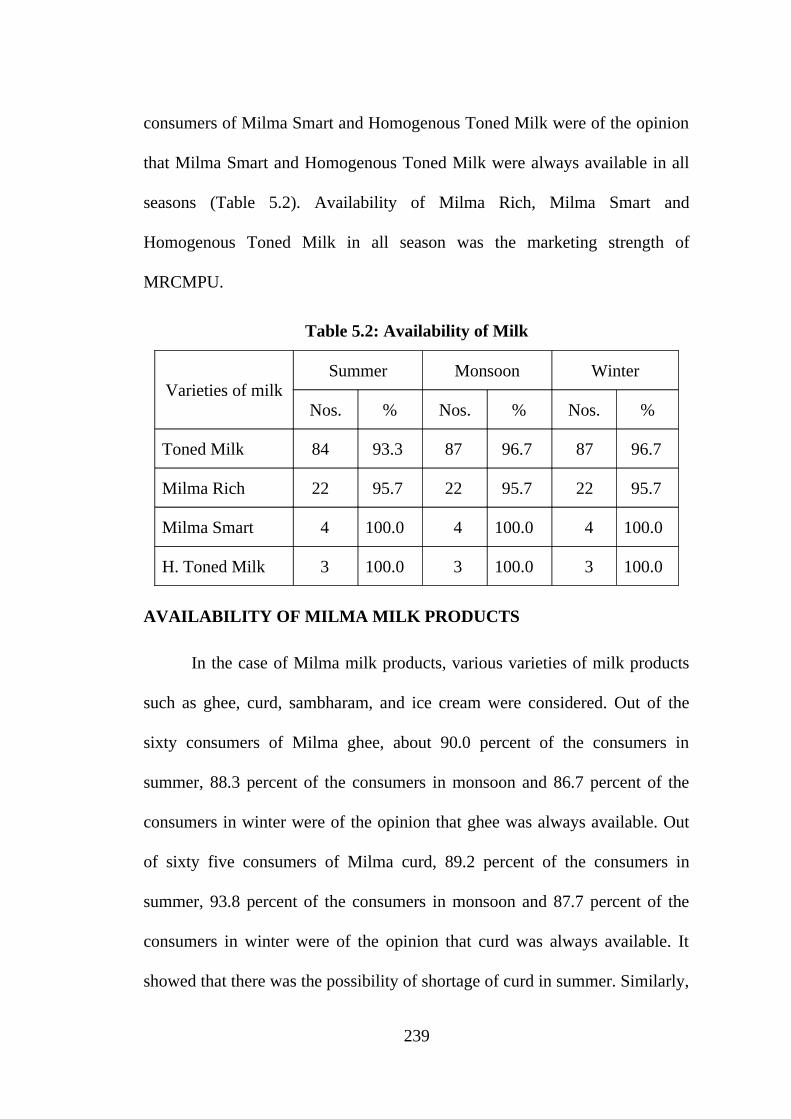
consumers of Milma Smart and Homogenous Toned Milk were of the opinion
that Milma Smart and Homogenous Toned Milk were always available in all
seasons (Table 5.2). Availability of Milma Rich, Milma Smart and
Homogenous Toned Milk in all season was the marketing strength of
MRCMPU.
Table 5.2: Availability of Milk
Varieties of milkSummer Monsoon Winter
Nos. % Nos. % Nos. %
Toned Milk 84 93.3 87 96.7 87 96.7
Milma Rich 22 95.7 22 95.7 22 95.7
Milma Smart 4 100.0 4 100.0 4 100.0
H. Toned Milk 3 100.0 3 100.0 3 100.0
AVAILABILITY OF MILMA MILK PRODUCTS
In the case of Milma milk products, various varieties of milk products
such as ghee, curd, sambharam, and ice cream were considered. Out of the
sixty consumers of Milma ghee, about 90.0 percent of the consumers in
summer, 88.3 percent of the consumers in monsoon and 86.7 percent of the
consumers in winter were of the opinion that ghee was always available. Out
of sixty five consumers of Milma curd, 89.2 percent of the consumers in
summer, 93.8 percent of the consumers in monsoon and 87.7 percent of the
consumers in winter were of the opinion that curd was always available. It
showed that there was the possibility of shortage of curd in summer. Similarly,
239
Page 6
out of sixteen consumers of Milma sambharam, about 81.3 percent of the
consumers in summer; 75.0 percent of the consumers in monsoon and 68.8
percent of the consumers in winter were of the opinion that sambharam was
always available. It again showed that there was the possibility of shortage of
sambharam in summer. In the case of ice cream, cent percent of the consumers
were of the opinion that ice cream was always available in summer and winter.
But 90.0 percent of the consumers were of the opinion that ice cream was
available in monsoon (Table 5.3). As majority of the consumers were of the
opinion that Milma milk products were available in all seasons, MRCMPU
had marketing strength.
Table 5.3: Availability of Milk Products
Varieties of Milk Products
Summer Monsoon Winter
Nos. % Nos. % Nos. %
Ghee 54 90.0 53 88.3 52 86.7
Curd 58 89.2 61 93.8 57 87.7
Sambharam 13 81.3 12 75.0 11 68.8
Ice cream 10 100.0 9 90.0 10 100.0
Milk on Special Occasions
As per Table 5.4, about 55.8 percent of the consumers were of the
opinion that they purchase Milma milk on special occasions like marriage etc.
About one fourth of consumers prefer other private firms, 12.0 percent of the
240
Page 7
consumers purchase milk from traditional societies and 7.5 percent of the
consumers purchase milk from nearby house.
Table 5.4: Purchase of Milk on Special Occasions
Nos. Percentage
Traditional societies 14 11.7
Other private firms 29 24.2
Other co-operative dairies 1 0.8
Milma 67 55.8
Nearby house 9 7.5
Total 120 100.0
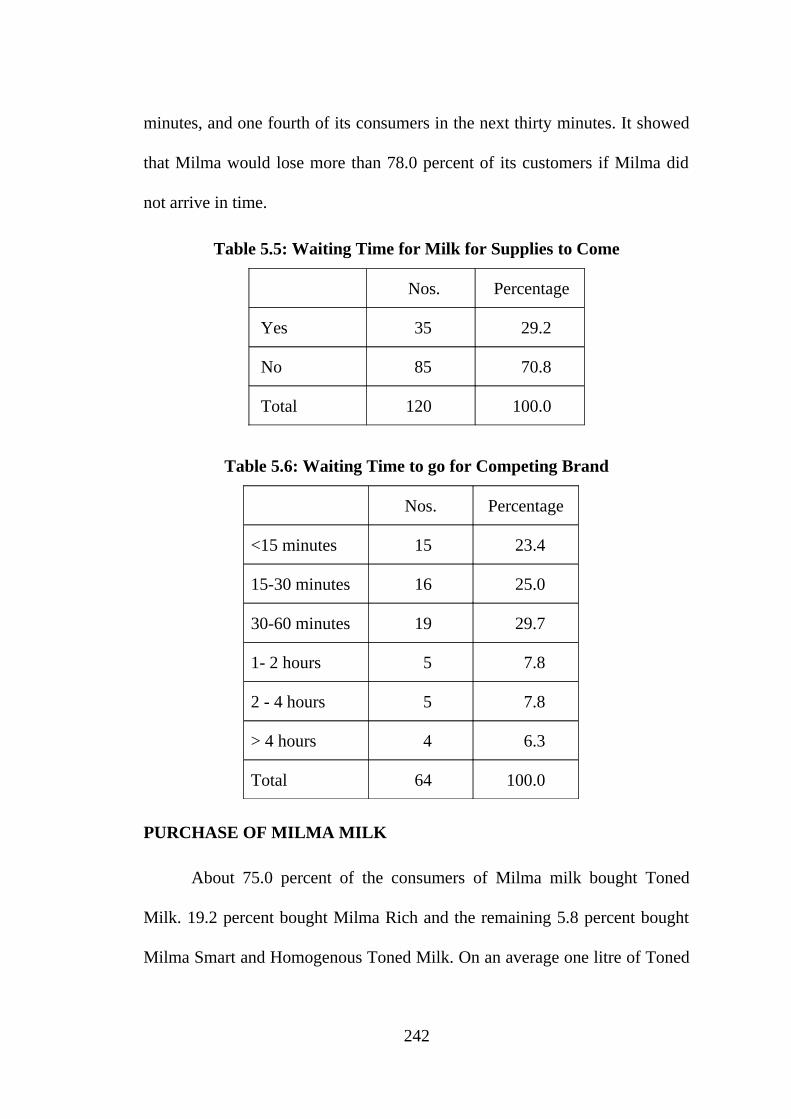
Waiting Time for Milma Milk
As per Table 5.5, about 29.2 percent of the consumers were of the
opinion that they had to wait for supplies of Milma to come. Moreover 23.4
percent of the consumers were ready to wait upto fifteen minutes if Milma did
not arrive in time. Not less than 25.0 percent of the consumers were ready to
wait for a period of fifteen to thirty minutes, and 29.7 percent of the
consumers were ready to wait for thirty to sixty minutes. About 8.0 percent h
of the consumers were ready to wait for one to two hours and two to four
hours. About 6.0 percent of the consumers were ready to wait for more than
four hours if Milma does not arrive in time (Table 5.6). It meant that Milma
would lose about one fourth of its consumers within fifteen minutes of
delivery time, again one fourth of its consumers within the next fifteen
241
Page 8
minutes, and one fourth of its consumers in the next thirty minutes. It showed
that Milma would lose more than 78.0 percent of its customers if Milma did
not arrive in time.
Table 5.5: Waiting Time for Milk for Supplies to Come
Nos. Percentage
Yes 35 29.2
No 85 70.8
Total 120 100.0
Table 5.6: Waiting Time to go for Competing Brand
Nos. Percentage
<15 minutes 15 23.4
15-30 minutes 16 25.0
30-60 minutes 19 29.7
1- 2 hours 5 7.8
2 - 4 hours 5 7.8
> 4 hours 4 6.3
Total 64 100.0
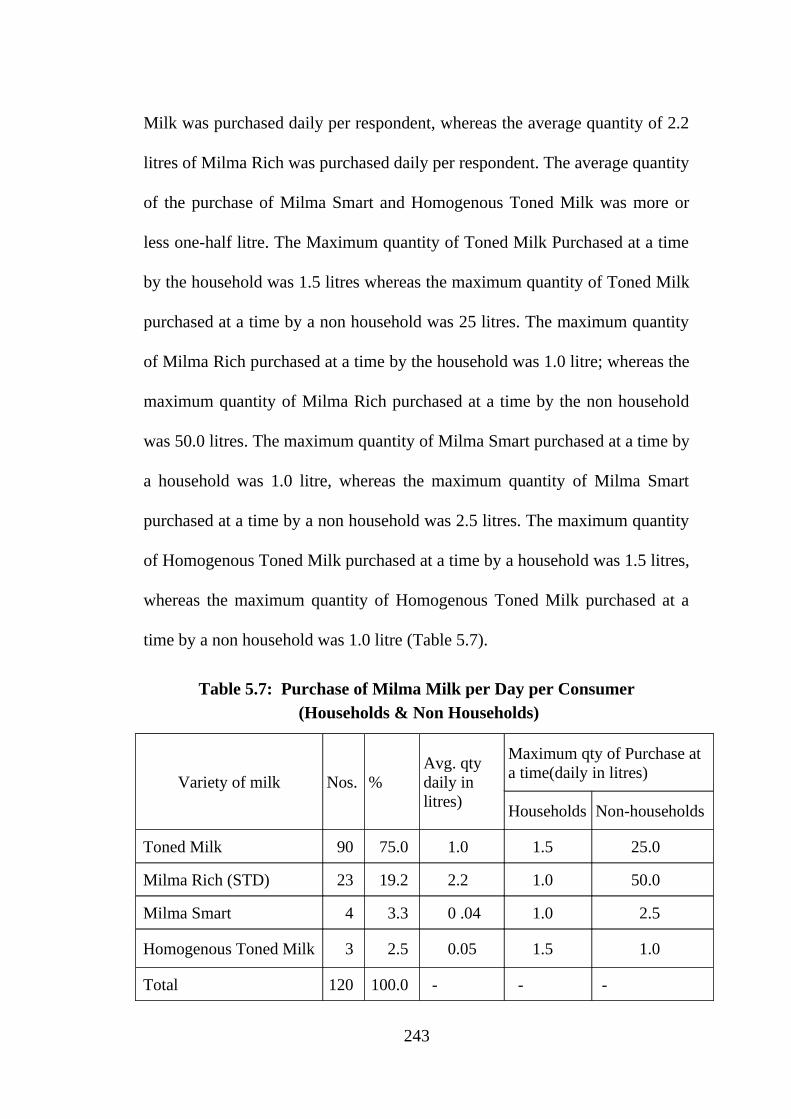
PURCHASE OF MILMA MILK
About 75.0 percent of the consumers of Milma milk bought Toned
Milk. 19.2 percent bought Milma Rich and the remaining 5.8 percent bought
Milma Smart and Homogenous Toned Milk. On an average one litre of Toned
242
Page 9
Milk was purchased daily per respondent, whereas the average quantity of 2.2
litres of Milma Rich was purchased daily per respondent. The average quantity
of the purchase of Milma Smart and Homogenous Toned Milk was more or
less one-half litre. The Maximum quantity of Toned Milk Purchased at a time
by the household was 1.5 litres whereas the maximum quantity of Toned Milk
purchased at a time by a non household was 25 litres. The maximum quantity
of Milma Rich purchased at a time by the household was 1.0 litre; whereas the
maximum quantity of Milma Rich purchased at a time by the non household
was 50.0 litres. The maximum quantity of Milma Smart purchased at a time by
a household was 1.0 litre, whereas the maximum quantity of Milma Smart
purchased at a time by a non household was 2.5 litres. The maximum quantity
of Homogenous Toned Milk purchased at a time by a household was 1.5 litres,
whereas the maximum quantity of Homogenous Toned Milk purchased at a
time by a non household was 1.0 litre (Table 5.7).
Table 5.7: Purchase of Milma Milk per Day per Consumer (Households & Non Households)
Variety of milk Nos. %Avg. qty daily in litres)
Maximum qty of Purchase at a time(daily in litres)
Households Non-households
Toned Milk 90 75.0 1.0 1.5 25.0
Milma Rich (STD) 23 19.2 2.2 1.0 50.0
Milma Smart 4 3.3 0 .04 1.0 2.5
Homogenous Toned Milk 3 2.5 0.05 1.5 1.0
Total 120 100.0 - - -
243
Page 10
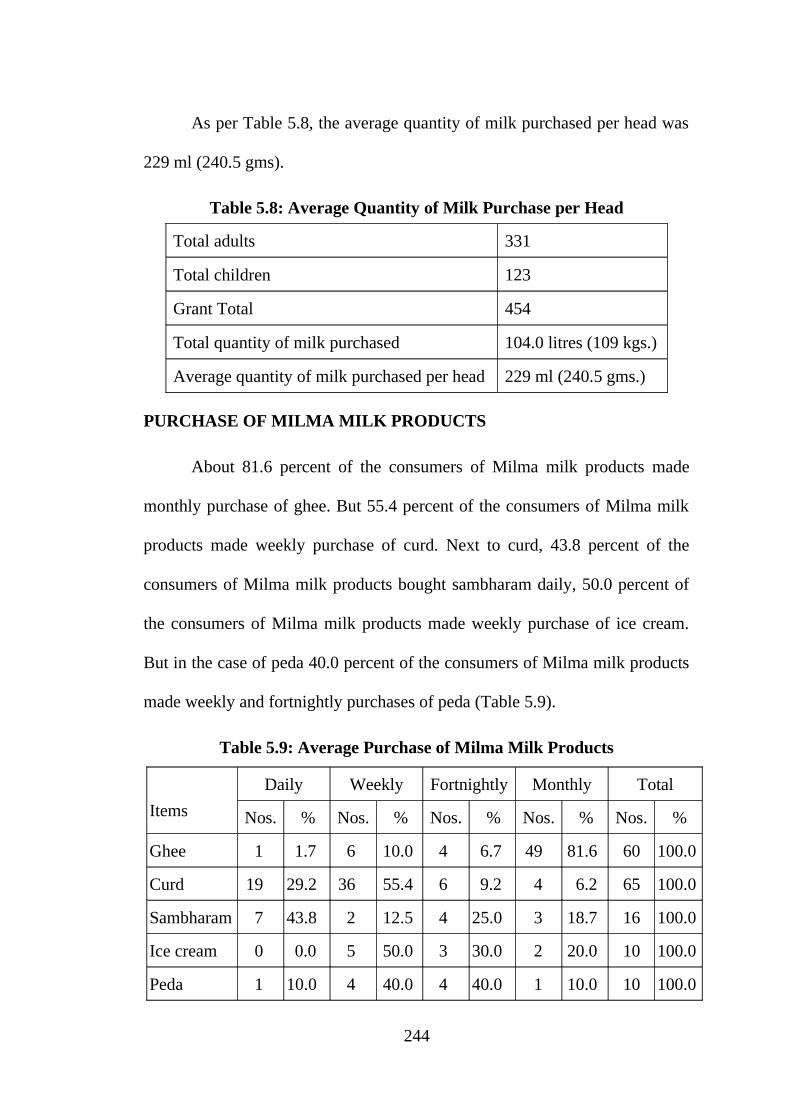
As per Table 5.8, the average quantity of milk purchased per head was
229 ml (240.5 gms).
Table 5.8: Average Quantity of Milk Purchase per Head
Total adults 331
Total children 123
Grant Total 454
Total quantity of milk purchased 104.0 litres (109 kgs.)
Average quantity of milk purchased per head 229 ml (240.5 gms.)
PURCHASE OF MILMA MILK PRODUCTS
About 81.6 percent of the consumers of Milma milk products made
monthly purchase of ghee. But 55.4 percent of the consumers of Milma milk
products made weekly purchase of curd. Next to curd, 43.8 percent of the
consumers of Milma milk products bought sambharam daily, 50.0 percent of
the consumers of Milma milk products made weekly purchase of ice cream.
But in the case of peda 40.0 percent of the consumers of Milma milk products
made weekly and fortnightly purchases of peda (Table 5.9).
Table 5.9: Average Purchase of Milma Milk Products
Items
Daily Weekly Fortnightly Monthly Total
Nos. % Nos. % Nos. % Nos. % Nos. %
Ghee 1 1.7 6 10.0 4 6.7 49 81.6 60 100.0
Curd 19 29.2 36 55.4 6 9.2 4 6.2 65 100.0
Sambharam 7 43.8 2 12.5 4 25.0 3 18.7 16 100.0
Ice cream 0 0.0 5 50.0 3 30.0 2 20.0 10 100.0
Peda 1 10.0 4 40.0 4 40.0 1 10.0 10 100.0
244
Page 11
As per Table 5.10 purchase of ghee by household consumers was high
in Malapuram district. On an average, 826 gms. of ghee was purchased per
household per month. In Kozhikode district, the average purchase of ghee was
624 gms. and in Kannur district the average purchase of ghee was 400 gms.
per month. With regard to purchase of curd, Malapuram district also ranked
first. On an average, 2.88 litres of curd were purchased per household per
week. In Kozhikode district, the average purchase of curd was 2.850 litres and
in Kannur district, the average purchase of curd was 1.530 litres per week.
But, in the case of purchase of sambharam, Kannur district ranked first. On an
average, 300 ml of sambharam was purchased per household per day. In
Kozhikode district the average purchase of sambharam was 289 ml and in
Malapuram district, the average purchase of sambharam was 133.3 ml per day.
In the case of ice cream Kozhikode district ranked first. On an average, 14.4
cups of ice cream was purchased per household per month. In Malapuram
district, the average purchase of ice cream was 8 cups per month. In the case
of purchase of peda, Malapuram district ranked first. On an average, about
54.2 pieces of peda were purchased per household per month. In Kozhikode
district, the average purchase of peda was 47 in numbers per household in a
month. In Kannur no household consumer purchased ice cream and peda. In
short, household consumers of Malapuram district purchased ghee, curd and
peda in large quantities than in the other two districts.
245
Page 12
Table 5.10: Purchase of Milk Products per Household Consumer of Milma – Districtwise
Districts & Items Nos. Total Qty Per Household
Kannur
Ghee (Monthly) 12 4.8 kgs. 400 gms.
Curd (Weekly) 17 26 litres 1.53 litres
Sambharam (Daily) 4 6 pkts. 300 ml
Ice cream (Monthly) 0 0 0
Peda (Monthly) 2 0 0
Kozhikode
Ghee (Monthly) 25 15.6 kgs. 624 gms.
Curd (Weekly) 20 57 litres 2.85 litres
Sambharam (Daily) 9 13 pkts. 289 ml
Ice cream (Monthly) 9 130 cups 14.4 cups
Peda (Monthly) 6 280 pieces 47 pieces
Malapuram
Ghee (Monthly) 23 19 Kg 826 gms
Curd (Weekly) 21 60.5 litres 2.88 litres
Sambharam(Daily) 3 2 pkts. 133.3 ml
Ice cream (Monthly) 1 8 cups 8 cups
Peda (Monthly) 1 208 pieces 208 pieces
Total
Ghee (Monthly) 60 39.4 kgs. 657 gms.
Curd (Weekly) 58 143.5 litres 2.47 litres
Sambharam (Daily) 16 21 packets 1.3 packets
Ice cream (Monthly) 10 138 cups 13.8 cups
Peda (Monthly) 9 488 pieces 54.2 pieces
246
Page 13
On the basis of opinion of consumers, various varieties of Milma milk
and milk products can be ranked. Out of the 120 consumers, 75.0 percent of
the consumers purchased Toned Milk. About 54.2 percent purchased curd.
50.0 percent purchased ghee. 19.2 percent and 13.3 percent of the consumers
purchased Milma Rich and sambharam respectively. On an average, 8.3
percent of the consumers purchased peda and ice cream. About 3.3 percent
and 2.5 percent of consumers purchased Milma Smart and Homogenous
Toned Milk respectively (Table 5.11).
Table 5.11: Purchase of Milma Milk and Milk Products
Items Nos. Percentage
Toned Milk 90 75.0
Curd 65 54.2
Ghee 60 50.0
Milma Rich (STD) 23 19.2
Sambharam 16 13.3
Peda 10 8.3
Ice cream 10 8.3
Milma Smart 4 3.3
Homogenous Toned Milk 3 2.5
Purchase of Fresh Milk other than Milma Milk
About 32.5 percent 20.0 percent and 24.0 percent of the consumers of
Milma milk in Kannur, Kozhikode and Malapuram districts respectively were
247
Page 14
of the opinion that other than Milma, fresh milk was available during the
normal business hours. On an aggregate it was 22.5. But 40.0 percent, 50.0
percent and 60.0 percent of the consumers of Milma milk in Kannur,
Kozhikode, and Malapuram districts respectively were of the opinion that
fresh milk other than Milma was not available during normal business hours.
On an aggregate, it was 50.0 percent. Finally, 27.5 percent, 30.0 percent and
15.0 percent of the consumers of Milma milk in Kannur, Kozhikode, and
Malapuram districts were of the opinion that they had not tried to get fresh
milk other than Milma during normal business hours. On an aggregate, it was
27.5 percent (Table 5.12). It means that the majority of the consumers of
Milma milk had no alternative source of milk other than Milma.
Table 5.12: Availability of Fresh Milk other than Milma Milk
DistrictsYes No Had not tried Total
Nos. % Nos. % Nos. % Nos. %
Kannur 13 32.5 16 40.0 11 27.5 40 100.0
Kozhikode 8 20.0 20 50.0 12 30.0 40 100.0
Malapuram 6 15.0 24 60.0 10 15.0 40 100.0
Total 27 22.5 60 50.0 33 27.5 120 100.0
Purchase of the Same Grade of Milk at a Lower Price other than Milma Milk
More over 85.0 percent, 90.0 percent, and 92.5 percent of the
consumers of Milma milk in Kannur, Kozhikode and Malapuram districts
respectively were of the opinion that the same grade of milk at lower price was
248
Page 15
not available other than Milma milk. On an aggregate, it was 89.2 percent
(Table 5.13). It also supported that the majority of the consumers of Milma
milk had no alternative source of milk at lower price other than Milma.
Table 5.13: Availability of Same Grade of Milk at a lower price other than Milma Milk
DistrictsYes No Had not tried Total
Nos. % Nos. % Nos. % Nos. %
Kannur 6 15.0 34 85.0 0 0.0 40 100.0
Kozhikode 1 2.5 36 90.0 3 7.5 40 100.0
Malapuram 3 7.5 37 92.5 0 0.0 40 100.0
Total 10 8.3 107 89.2 3 2.5 120 100.0
Purchase of Enough Quantity Milk
About 77.5 percent, of the consumers of Milma milk in Kannur district,
and 85.0 percent of the consumers of Milma milk in Kozhikode and
Malapuram districts were of the opinion that they purchased enough quantity
of milk for domestic use. On an average, 82.5 percent of the consumers of
Milma milk purchased enough quantity of milk for domestic use. It means
majority of the consumers of Milma milk purchased enough quantity of milk
for their domestic use (Table 5.14).
249
Page 16
Table 5.14: Purchase of Enough Quantity of Milk for Domestic Use
DistrictsYes No Total
Nos. % Nos. % Nos. %
Kannur 31 77.5 9 22.5 40 100.0
Kozhikode 34 85.0 6 15.0 40 100.0
Malapuram 34 85.0 6 15.0 40 100.0
Total 99 82.5 21 17.5 120 100.0
Purchase of Enough Quantity of Milk Products
About 67.5 percent, 77.5 percent, 62.5 percent of the consumers of
Milma milk products in Kannur, Kozhikode, and Malapuram districts were of
the opinion that they purchased enough quantity of milk products for domestic
use. On an aggregate, 69.2 percent of the consumers of Milma milk products
purchased enough quantity of milk products for domestic use (Table 5.15).
Table 5.15: Purchase of Enough Quantity of Milk Products for Domestic Use
DistrictsYes No Total
Nos. % Nos. % Nos. %
Kannur 27 67.5 13 32.5 40 100.0
Kozhikode 31 77.5 9 22.5 40 100.0
Malapuram 25 62.5 15 38.5 40 100.0
Total 83 69.2 37 30.8 120 100.0
250
Page 17
Purchase of Milk Substitutes
About 52.5 percent, of the consumers of Milma milk in Kannur district,
and 38.5 percent of the consumers of Milma milk in Kozhikode and
Malapuram districts purchased milk substitute for domestic use. On an
aggregate, 42.5 percent of the consumers of Milma milk purchased milk
substitute for domestic use (Table 5.16).
Table 5.16: Purchase of Milk Substitute – Districtwise
DistrictsYes No Total
Nos. % Nos. % Nos. %
Kannur 21 52.5 19 47.5 40 100.0
Kozhikode 15 38.5 25 61.5 40 100.0
Malapuram 15 38.5 25 61.5 40 100.0
Total 51 42.5 69 57.5 120 100.0
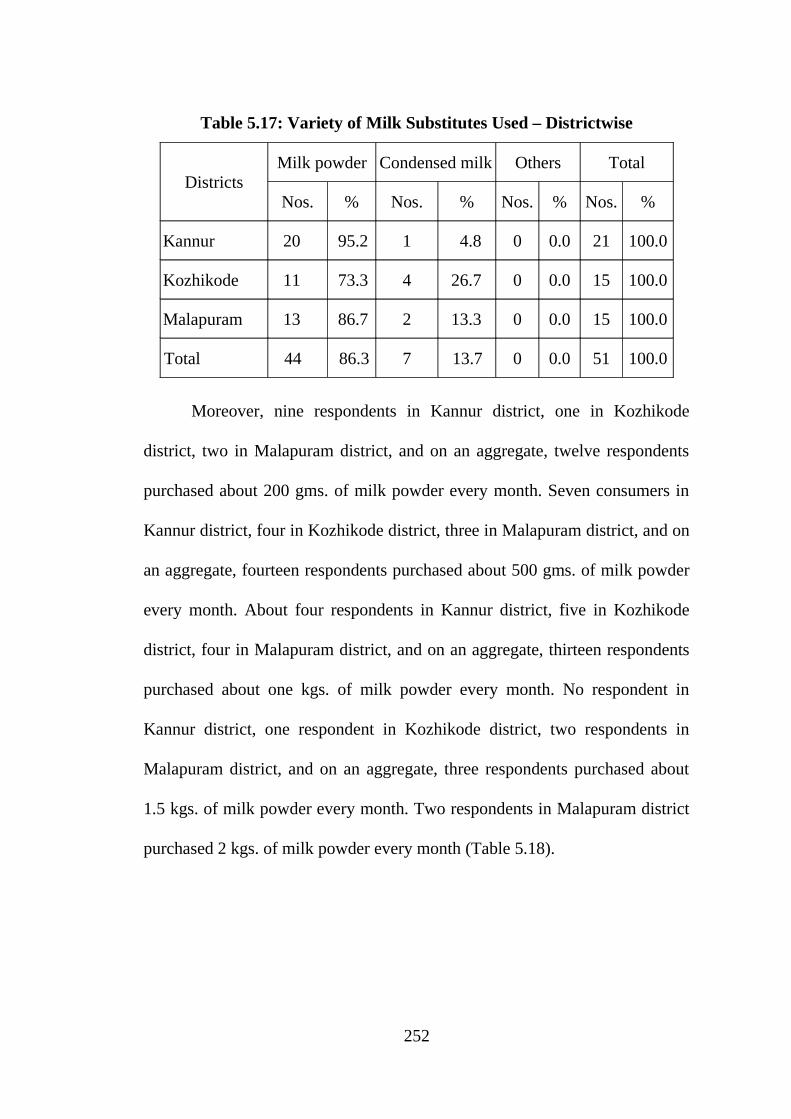
Out of this, 95.2 percent of the respondents in Kannur district used milk
powder and the remaining 4.8 percent used condensed milk. Similarly 73.3
percent in Kozhikode district used milk powder and the remaining 26.7
percent used condensed milk. In Malapuram district, about 86.7 used milk
powder and the remaining 13.3 percent used condensed milk. On an aggregate,
86.3 percent of the consumers of Milma milk used milk powder and the
remaining 13.7 percent used condensed milk (Table 5.17).
251
Page 18
Table 5.17: Variety of Milk Substitutes Used – Districtwise
DistrictsMilk powder Condensed milk Others Total
Nos. % Nos. % Nos. % Nos. %
Kannur 20 95.2 1 4.8 0 0.0 21 100.0
Kozhikode 11 73.3 4 26.7 0 0.0 15 100.0
Malapuram 13 86.7 2 13.3 0 0.0 15 100.0
Total 44 86.3 7 13.7 0 0.0 51 100.0
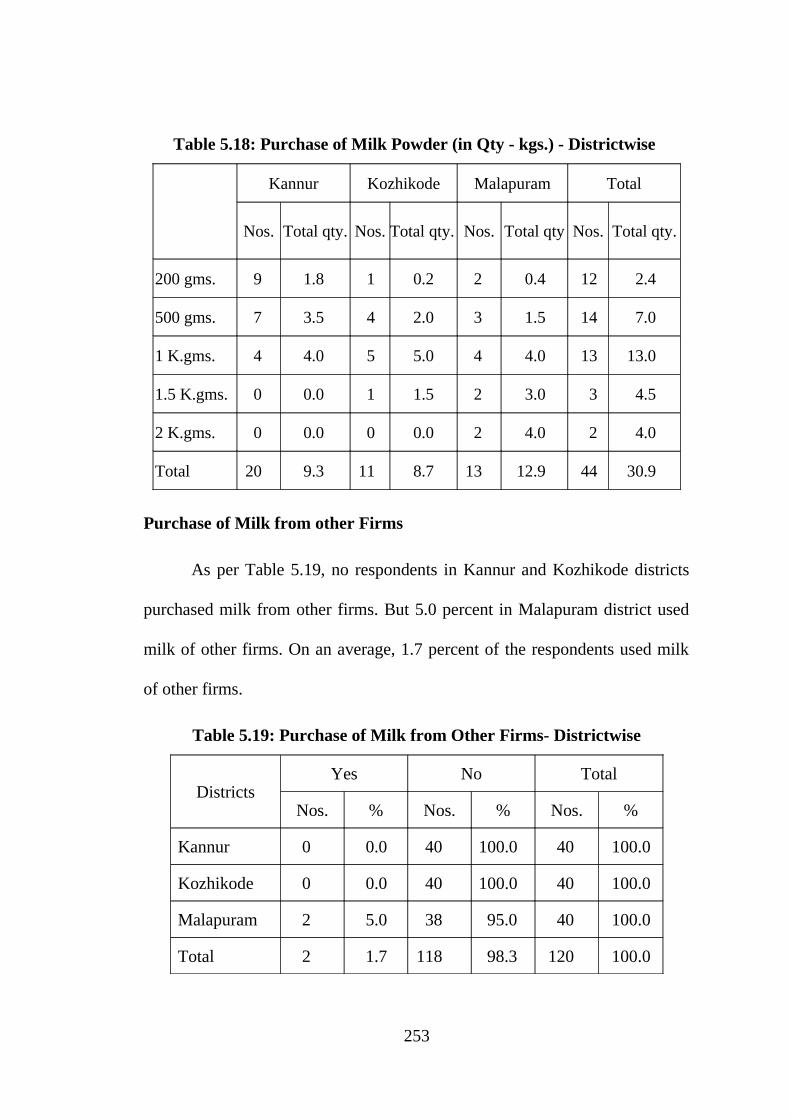
Moreover, nine respondents in Kannur district, one in Kozhikode
district, two in Malapuram district, and on an aggregate, twelve respondents
purchased about 200 gms. of milk powder every month. Seven consumers in
Kannur district, four in Kozhikode district, three in Malapuram district, and on
an aggregate, fourteen respondents purchased about 500 gms. of milk powder
every month. About four respondents in Kannur district, five in Kozhikode
district, four in Malapuram district, and on an aggregate, thirteen respondents
purchased about one kgs. of milk powder every month. No respondent in
Kannur district, one respondent in Kozhikode district, two respondents in
Malapuram district, and on an aggregate, three respondents purchased about
1.5 kgs. of milk powder every month. Two respondents in Malapuram district
purchased 2 kgs. of milk powder every month (Table 5.18).
252
Page 19
Table 5.18: Purchase of Milk Powder (in Qty - kgs.) - Districtwise
Kannur Kozhikode Malapuram Total
Nos. Total qty. Nos. Total qty. Nos. Total qty Nos. Total qty.
200 gms. 9 1.8 1 0.2 2 0.4 12 2.4
500 gms. 7 3.5 4 2.0 3 1.5 14 7.0
1 K.gms. 4 4.0 5 5.0 4 4.0 13 13.0
1.5 K.gms. 0 0.0 1 1.5 2 3.0 3 4.5
2 K.gms. 0 0.0 0 0.0 2 4.0 2 4.0
Total 20 9.3 11 8.7 13 12.9 44 30.9
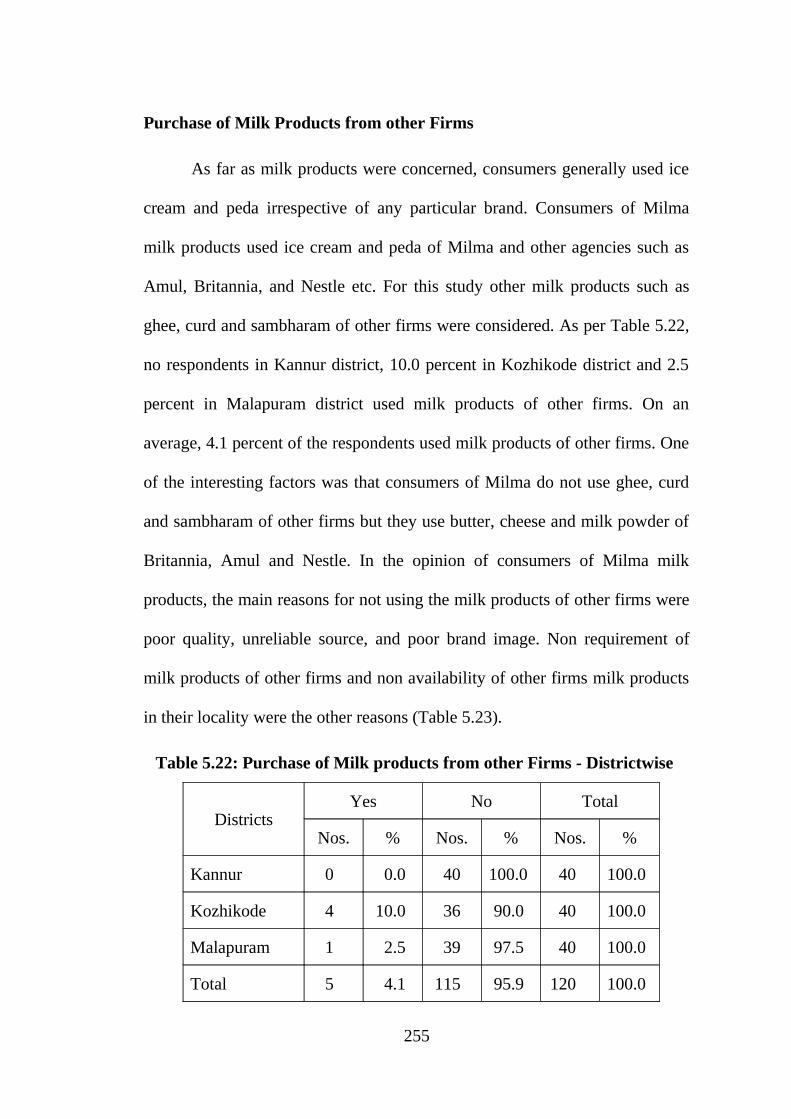
Purchase of Milk from other Firms
As per Table 5.19, no respondents in Kannur and Kozhikode districts
purchased milk from other firms. But 5.0 percent in Malapuram district used
milk of other firms. On an average, 1.7 percent of the respondents used milk
of other firms.
Table 5.19: Purchase of Milk from Other Firms- Districtwise
DistrictsYes No Total
Nos. % Nos. % Nos. %
Kannur 0 0.0 40 100.0 40 100.0
Kozhikode 0 0.0 40 100.0 40 100.0
Malapuram 2 5.0 38 95.0 40 100.0
Total 2 1.7 118 98.3 120 100.0
253
Page 20
According to the opinion of consumers of Milma milk, the main
reasons for not using the milk of other firms were poor quality and unreliable
source. In the case of other reasons for not using the milk of other firms,
respondents were of the opinion that they did not require the milk of other
firms and the non availability of other firms milk in their locality (Table 5.20).
Table 5.20: Reasons for Non Purchase of other Firms Milk- Districtwise
Kannur Kozhikode Malapuram Total
Nos. % Nos. % Nos. % Nos. %
High price 0 0.0 2 6.5 2 7.1 4 4.3
Unreliable source 7 20.6 8 25.8 4 14.3 19 20.4
Poor quality 11 32.4 11 35.4 8 28.6 30 32.3
Poor brand image 2 5.8 2 6.5 2 7.1 6 6.5
Others 14 41.2 8 25.8 12 42.9 34 36.5
Total 34 100.0 31 100.0 28 100.0 93 100.0
Moreover, the respondents purchased 0.5 to 1 litre of milk from other
firms in Malapuram district (Table 5.21). In Malapuram consumers of Milma
milk used the milk of Amrut and S. K. It can be concluded that the consumers
of Milma milk solely depended on the Milma milk.
Table 5.21: Purchase of other Firms Milk (Quantity) - Districtwise
Districts Quantity (in litres)
Kannur 0.0
Kozhikode 0.0
Malapuram 0.5 to 1
254
Page 21
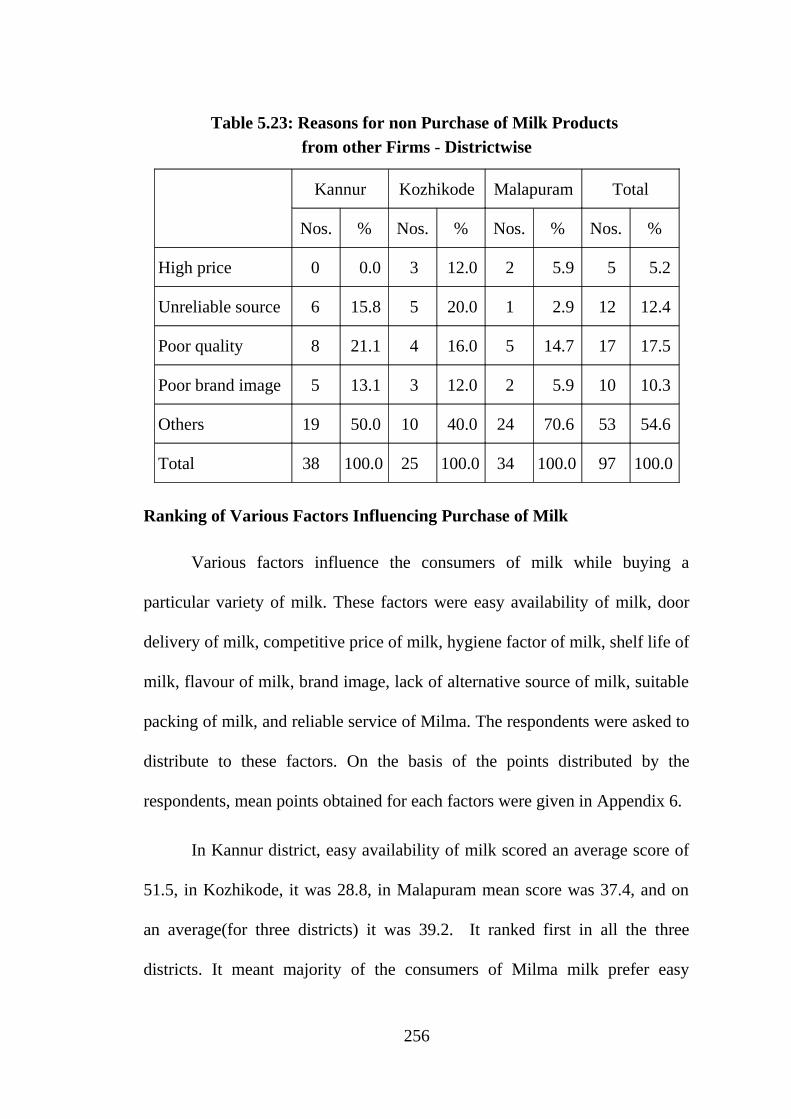
Purchase of Milk Products from other Firms
As far as milk products were concerned, consumers generally used ice
cream and peda irrespective of any particular brand. Consumers of Milma
milk products used ice cream and peda of Milma and other agencies such as
Amul, Britannia, and Nestle etc. For this study other milk products such as
ghee, curd and sambharam of other firms were considered. As per Table 5.22,
no respondents in Kannur district, 10.0 percent in Kozhikode district and 2.5
percent in Malapuram district used milk products of other firms. On an
average, 4.1 percent of the respondents used milk products of other firms. One
of the interesting factors was that consumers of Milma do not use ghee, curd
and sambharam of other firms but they use butter, cheese and milk powder of
Britannia, Amul and Nestle. In the opinion of consumers of Milma milk
products, the main reasons for not using the milk products of other firms were
poor quality, unreliable source, and poor brand image. Non requirement of
milk products of other firms and non availability of other firms milk products
in their locality were the other reasons (Table 5.23).
Table 5.22: Purchase of Milk products from other Firms - Districtwise
DistrictsYes No Total
Nos. % Nos. % Nos. %
Kannur 0 0.0 40 100.0 40 100.0
Kozhikode 4 10.0 36 90.0 40 100.0
Malapuram 1 2.5 39 97.5 40 100.0
Total 5 4.1 115 95.9 120 100.0
255
Page 22
Table 5.23: Reasons for non Purchase of Milk Products
from other Firms - Districtwise
Kannur Kozhikode Malapuram Total
Nos. % Nos. % Nos. % Nos. %
High price 0 0.0 3 12.0 2 5.9 5 5.2
Unreliable source 6 15.8 5 20.0 1 2.9 12 12.4
Poor quality 8 21.1 4 16.0 5 14.7 17 17.5
Poor brand image 5 13.1 3 12.0 2 5.9 10 10.3
Others 19 50.0 10 40.0 24 70.6 53 54.6
Total 38 100.0 25 100.0 34 100.0 97 100.0
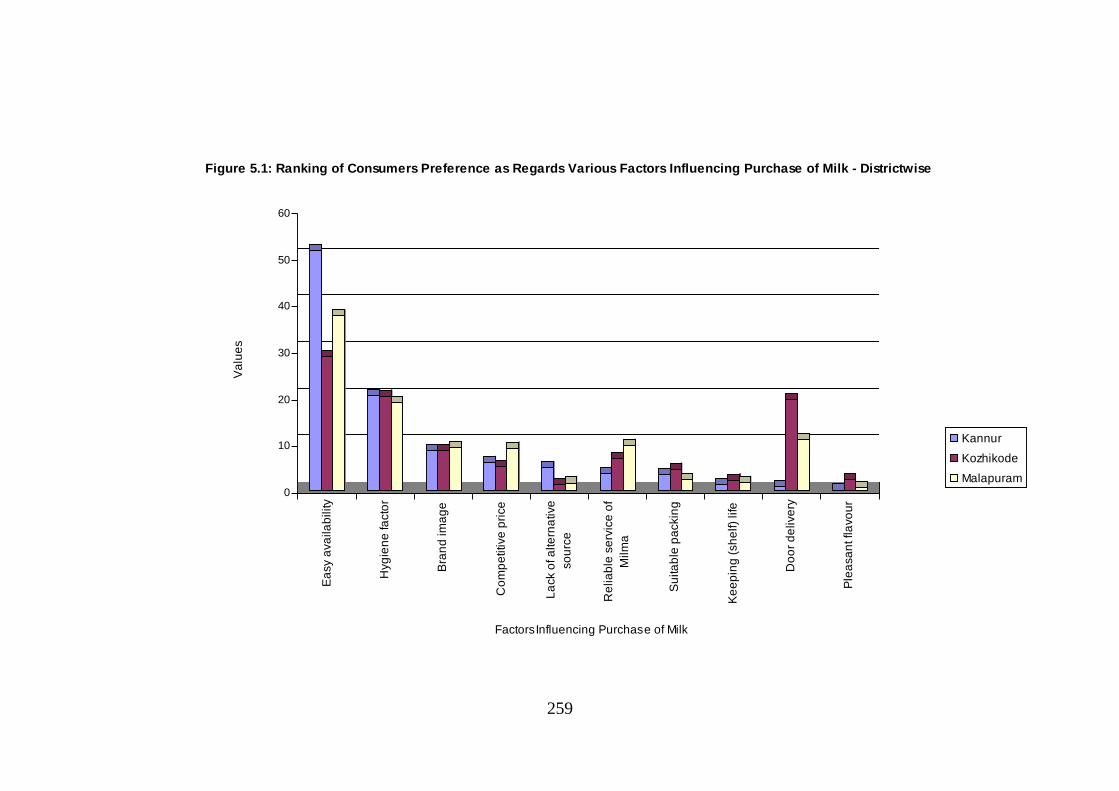
Ranking of Various Factors Influencing Purchase of Milk
Various factors influence the consumers of milk while buying a
particular variety of milk. These factors were easy availability of milk, door
delivery of milk, competitive price of milk, hygiene factor of milk, shelf life of
milk, flavour of milk, brand image, lack of alternative source of milk, suitable
packing of milk, and reliable service of Milma. The respondents were asked to
distribute to these factors. On the basis of the points distributed by the
respondents, mean points obtained for each factors were given in Appendix 6.
In Kannur district, easy availability of milk scored an average score of
51.5, in Kozhikode, it was 28.8, in Malapuram mean score was 37.4, and on
an average(for three districts) it was 39.2. It ranked first in all the three
districts. It meant majority of the consumers of Milma milk prefer easy
256
Page 23
availability of milk. Generally, Milma was focusing tactically on the quality of
milk and milk products. In all the three districts, hygiene factor ranked second,
and on an average, it also ranked second. It supported that tactics on hygiene
factor was adaptable. Next to hygiene factor, price was another important
factor. In Kannur, competitive price ranked fourth position, whereas in
Kozhikode and Malapuram districts, it ranked sixth position, and on an
average, price of milk ranked fifth position. It meant price of Milma milk was
not competitive. One of the strengths of Milma was its brand image. Hence
brand image was evaluated next. In Kannur district, it scored 8.5 and ranked
third, in Kozhikode it scored 8.5 but ranked fourth, In Malapuram; it scored
9.3 but ranked fifth. On an average, it scored 8.8 for all three districts and
ranked fourth position.
In the case of reliable service of Milma, Kannur, Kozhikode and
Malapuram districts scored 3.6, 6.8 and 9.6 respectively. On an average, it
scored 6.7. It ranked sixth in Kannur district, fifth position in Kozhikode
district, and fourth position in Malapuram district. On an average, its position
was sixth. In the case of suitability of packing of Milma milk, Kannur,
Kozhikode and Malapuram districts scored 3.5, 4.5 and 2.3 respectively. On
an average, it scored 3.4. It ranked seventh position in all districts. In the case
of keeping (shelf) life of Milma milk, Kannur, Kozhikode and Malapuram
districts scored 1.3, 2.1, and 1.7 respectively. On an average, it scored 1.7. It
ranked eight position in Kannur and Malapuram districts, and ninth position in
257
Page 24
Kozhikode district. On an average, its position was ninth. It meant Milma milk
couldn’t be kept for long hours.
In the case of pleasant flavour of Milma milk, Kannur, Kozhikode and
Malapuram districts scored 0.1, 2.4, and 0.7 respectively. On an average, it
scored 1.1. It ranked last position in Kannur and Malapuram districts, and
eighth position in Kozhikode district. On an average, its position was last. In
the case of door delivery of milk, Kannur, Kozhikode and Malapuram districts
scored 0.9, 19.6, and 11.0 respectively. On an average, it scored 10.5. In
Kannur it ranked ninth position, in Kozhikode and Malapuram districts it
ranked third. On an average its position was third. It meant that the door
delivery of Milma milk was very poor in Kannur district, whereas it was
efficient in Kozhikode and Malapuram districts.
In the case of lack of alternative source, Kannur, Kozhikode and
Malapuram districts scored 4.9, 1.3, and 1.6 respectively. On an average, it
scored 2.6. In Kannur, it ranked fifth position, in Kozhikode it ranked last
position and in Malapuram district it ranked ninth. On an average, it ranked
eighth position. It meant consumers of Milma milk in Kozhikode and
Malapuram district had alternative source to get milk than in Kannur district.
It again supported competition from other firms in Kozhikode and Malapuram
districts (Appendix 5.6).
258
Page 25
0
10
20
30
40
50
60
Va
lue
s
Ea
sy a
vaila
bili
ty
Hyg
ien
e fa
cto
r
Bra
nd
ima
ge
Co
mp
etit
ive
pri
ce
La
ck o
f alte
rna
tive
sou
rce
Re
liab
le s
erv
ice
of
Milm
a
Su
itab
le p
ack
ing
Ke
ep
ing
(sh
elf)
life
Do
or
de
live
ry
Ple
asa
nt f
lavo
ur
FactorsInfluencing Purchase of Milk
Figure 5.1: Ranking of Consumers Preference as Regards Various Factors Influencing Purchase of Milk - Districtwise
Kannur
Kozhikode
Malapuram
259
Page 26
It was interesting to know the ranking of various factors of milk by
household consumers and non households. As per table 5.24 both the
households and non households ranked the factor easy availability of milk as
first. Again, both of them ranked hygiene and door delivery of milk as second
and third. In the case of competitive price, it got very little score from the part
of non households.
But in the case of brand image, it got more score from the part of non
households. It meant non households got milk at competitive price from other
sources but they preferred Milma milk due to its brand reputation. In the case
of keeping (shelf) life of milk, no score was obtained from the part of non
households. It meant that non households were not of an opinion that Milma
milk could be kept for long hours. In the case of pleasant flavour, it got score
more or less from the part of households and non households. In the case of
lack of alternative sources, very little score was obtained from the part of non
households. It again supported that non households had alternative source to
get milk. But in the cases of packing of Milma milk and reliable service of
Milma, very little score were obtained from the part of non households. It
meant that leakage of milk was high in the case of non households as they
take large quantities of milk and they faced shortage of Milma milk too.
260
Page 27
Table 5.24: Factors Influencing Purchase of Milk
(Households & Non Households)
FactorsMean Score
Households Non households
Easy availability 38.1 47.0
Hygiene factor 19.9 18.7
Door delivery 10.6 10.0
Brand image 7.5 17.3
Competitive price 7.4 1.3
Reliable service of Milma 7.3 2.0
Keeping (shelf) life 1.9 0.0
Pleasant flavour 1.0 1.7
Lack of alternative source 2.9 0.3
Suitable packing 3.9 0.3
Ranking of Various Factors Influencing Purchase of Milk Products
Like milk, consumers of Milma milk products were asked to distribute
100 points over various factors of milk products such as ghee, curd,
sambharam, ice-cream and peda. Various factors already considered in the
case of milk were also given for Distribution. In the case of ghee, easy
availability scored mean point 11.2 and ranked first. Next to easy availability,
hygiene factor ranked second and competitive price and brand image ranked
third and fourth respectively. Reliable service of Milma and suitable packing
261
Page 28
ranked fifth and sixth positions with slight variation in mean points. Pleasant
flavour and shelf life ranked seventh and eighth positions whereas lack of
alternative source and door delivery got the last position (Appendix 5.7).In
the case of curd, easy availability and hygiene factor ranked first and second
but lack of alternative source and brand image ranked third and fourth
positions. Reliable service of Milma ranked fifth. The interesting factor was
that competitive price scored 1.9 and ranked sixth. It meant that the price of
curd was not competitive as dealers of Milma were of the same opinion that
curd price of Milma was higher than that of other firms. Suitable packing
scored 1.8 and ranked seventh. Pleasant flavour and door delivery ranked
eighth and ninth positions respectively and shelf life got the last rank
(Appendix 5.7). It meant that curd could not be kept for long hours.
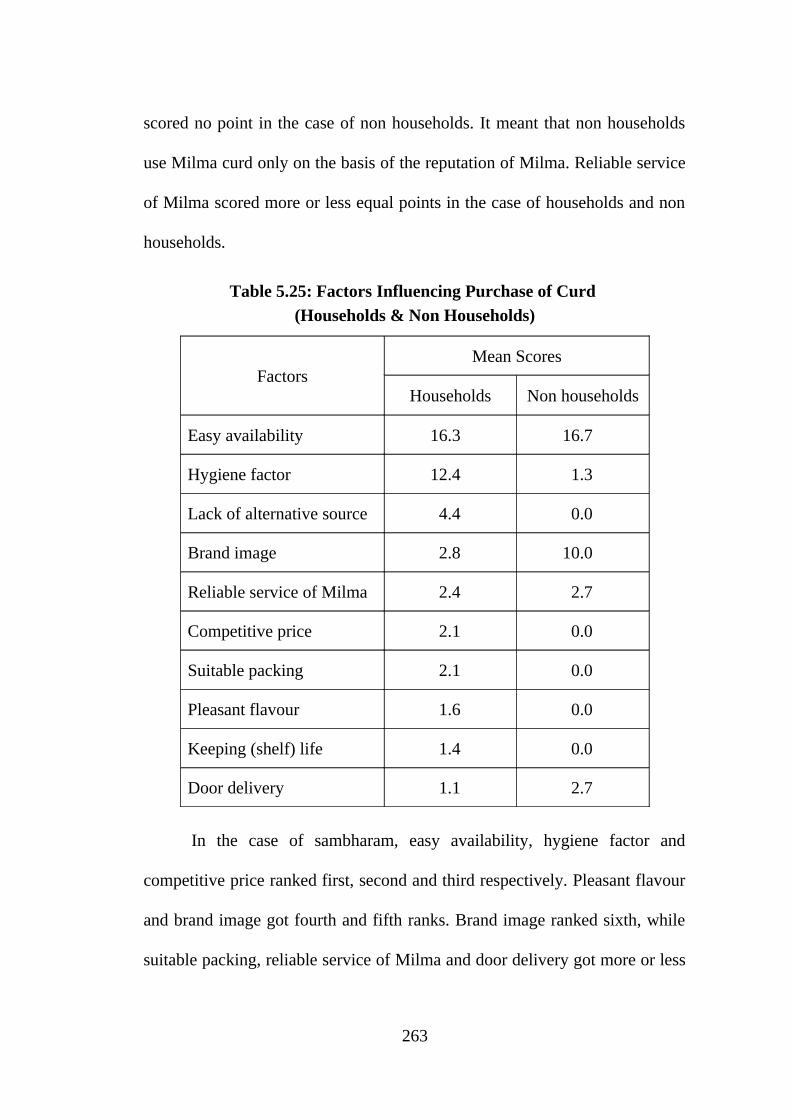
Like milk, various factors of curd ranked by households and non
households can be evaluated. As per Table 5.25, both households and non
households gave first rank to easy availability as a factor influencing purchase
of curd. As competitive price scored points in non households, they were not
satisfied with the price of curd. It again supported that they could get curd at a
price less than that of Milma from other firms. In the case of hygiene, there
was considerable variation in the mean score obtained on the basis of the
opinion of households and non households. As shelf life and suitable packing
scored no points, non households were dissatisfied in the quality of curd and
its packing. Brand image scored high points and lack of alternative source
262
Page 29
scored no point in the case of non households. It meant that non households
use Milma curd only on the basis of the reputation of Milma. Reliable service
of Milma scored more or less equal points in the case of households and non
households.
Table 5.25: Factors Influencing Purchase of Curd
(Households & Non Households)
FactorsMean Scores
Households Non households
Easy availability 16.3 16.7
Hygiene factor 12.4 1.3
Lack of alternative source 4.4 0.0
Brand image 2.8 10.0
Reliable service of Milma 2.4 2.7
Competitive price 2.1 0.0
Suitable packing 2.1 0.0
Pleasant flavour 1.6 0.0
Keeping (shelf) life 1.4 0.0
Door delivery 1.1 2.7
In the case of sambharam, easy availability, hygiene factor and
competitive price ranked first, second and third respectively. Pleasant flavour
and brand image got fourth and fifth ranks. Brand image ranked sixth, while
suitable packing, reliable service of Milma and door delivery got more or less
263
Page 30
equal points. Shelf life got no points and ranked last (Appendix 5.7). In the
case of ice cream, pleasant flavour, competitive price, and hygiene factor
ranked first, second and third positions respectively, but easy availability,
reliable service of Milma and brand image got fourth, fifth and sixth ranks.
While suitable packing, shelf life and door delivery got seventh, eighth and
ninth ranks. Lack of alternative source got no points and ranked last
(Appendix 5.7). In the case of peda, pleasant flavour, easy availability, and
hygiene factor ranked first, second and third positions respectively. But
reliable service of Milma, competitive price and brand image got fourth, fifth
and sixth ranks. While, shelf life, lack of alternative source and suitable
packing got seventh, eighth and ninth ranks. Door delivery got no points and
ranked last (Appendix 5.7).
LOYALTY OF CONSUMERS OF MILMA MILK
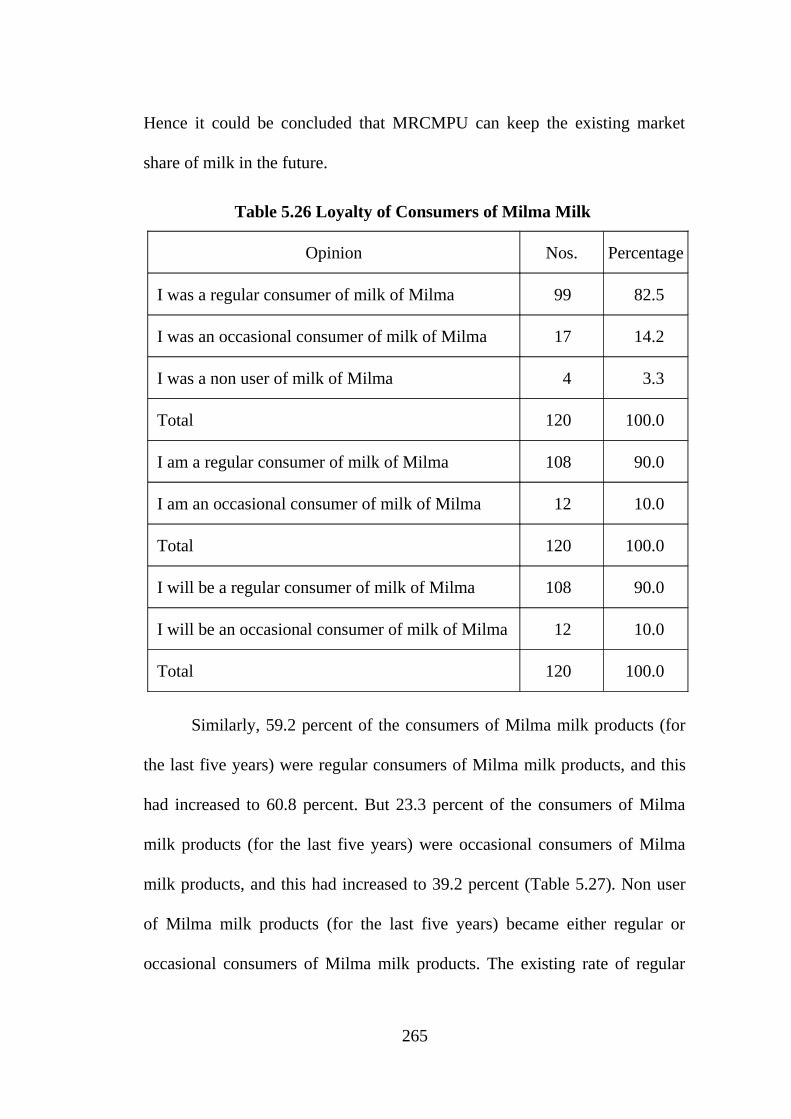
As per Table 5.26, about 82.5 percent of the consumers of Milma milk
(for the last five yeas) were the regular consumers of Milma milk, and it
increased to 90.0 percent. Moreover 14.2 percent of the consumers (for the
last five yeas) were the occasional consumers of Milma milk, which
decreased to 10.0 percent. It meant 4.2 percent of consumers (occasional) of
Milma milk became regular consumers of Milma milk. Again 3.3 percent of
the consumers of Milma milk (for the last five years) who were non users of
Milma milk became regular consumer of Milma milk. The existing rate of
regular and occasional consumers of Milma milk will be maintained in future.
264
Page 31
Hence it could be concluded that MRCMPU can keep the existing market
share of milk in the future.
Table 5.26 Loyalty of Consumers of Milma Milk
Opinion Nos. Percentage
I was a regular consumer of milk of Milma 99 82.5
I was an occasional consumer of milk of Milma 17 14.2
I was a non user of milk of Milma 4 3.3
Total 120 100.0
I am a regular consumer of milk of Milma 108 90.0
I am an occasional consumer of milk of Milma 12 10.0
Total 120 100.0
I will be a regular consumer of milk of Milma 108 90.0
I will be an occasional consumer of milk of Milma 12 10.0
Total 120 100.0
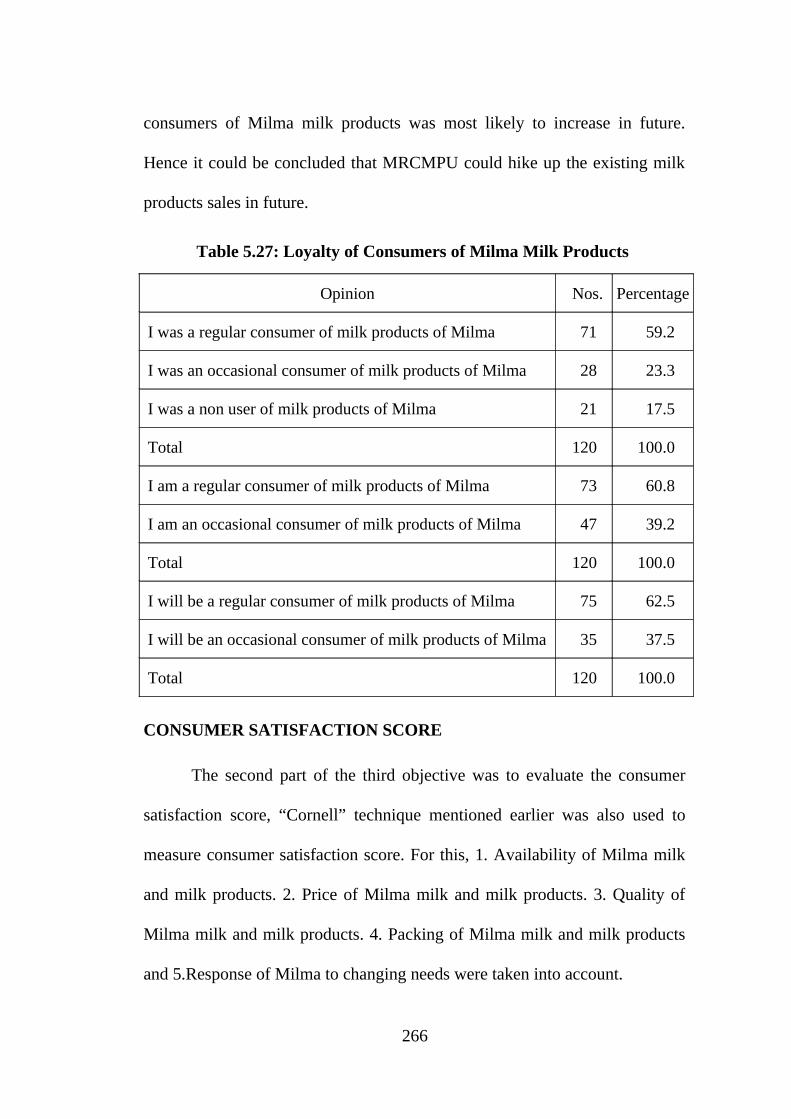
Similarly, 59.2 percent of the consumers of Milma milk products (for
the last five years) were regular consumers of Milma milk products, and this
had increased to 60.8 percent. But 23.3 percent of the consumers of Milma
milk products (for the last five years) were occasional consumers of Milma
milk products, and this had increased to 39.2 percent (Table 5.27). Non user
of Milma milk products (for the last five years) became either regular or
occasional consumers of Milma milk products. The existing rate of regular
265
Page 32
consumers of Milma milk products was most likely to increase in future.
Hence it could be concluded that MRCMPU could hike up the existing milk
products sales in future.
Table 5.27: Loyalty of Consumers of Milma Milk Products
Opinion Nos. Percentage
I was a regular consumer of milk products of Milma 71 59.2
I was an occasional consumer of milk products of Milma 28 23.3
I was a non user of milk products of Milma 21 17.5
Total 120 100.0
I am a regular consumer of milk products of Milma 73 60.8
I am an occasional consumer of milk products of Milma 47 39.2
Total 120 100.0
I will be a regular consumer of milk products of Milma 75 62.5
I will be an occasional consumer of milk products of Milma 35 37.5
Total 120 100.0
CONSUMER SATISFACTION SCORE
The second part of the third objective was to evaluate the consumer
satisfaction score, “Cornell” technique mentioned earlier was also used to
measure consumer satisfaction score. For this, 1. Availability of Milma milk
and milk products. 2. Price of Milma milk and milk products. 3. Quality of
Milma milk and milk products. 4. Packing of Milma milk and milk products
and 5.Response of Milma to changing needs were taken into account.
266
Page 33
Availability of Milma Milk
As per Table 5.28, about eighty five consumers of Toned Milk (out of
ninety) i.e., 94.4 percent in summer came under average satisfaction, but in
monsoon and winter, eighty seven consumers of Toned Milk i.e., 96.7 percent
came under average satisfaction. Similarly, in summer, monsoon and winter
twenty two consumers of Milma Rich (out of twenty three) i.e., 95.7 percent
came under average satisfaction. But in the case of Milma Smart four
consumers (out of four) i.e. cent percent came under average satisfaction in all
seasons. In the case of Homogenous Toned Milk three consumers of (out of
three) i.e., cent percent came under average satisfaction in all seasons. Hence
MRCMPU was in a position of competitive parity in the case of availability
of all varieties of milk in all seasons.
Table 5.28: Consumer Satisfaction Score on Availability of Milma Milk
Variety of
Milk
Summer Monsoon Winter
Low Average High Low Average High Low Average High
Toned Milk 5 85 0 3 87 0 3 87 0
Milma Rich 1 22 0 1 22 0 1 22 0
Milma Smart 0 4 0 0 4 0 0 4 0
H. Toned Milk 0 3 0 0 3 0 0 3 0
Availability of Milma Milk Products
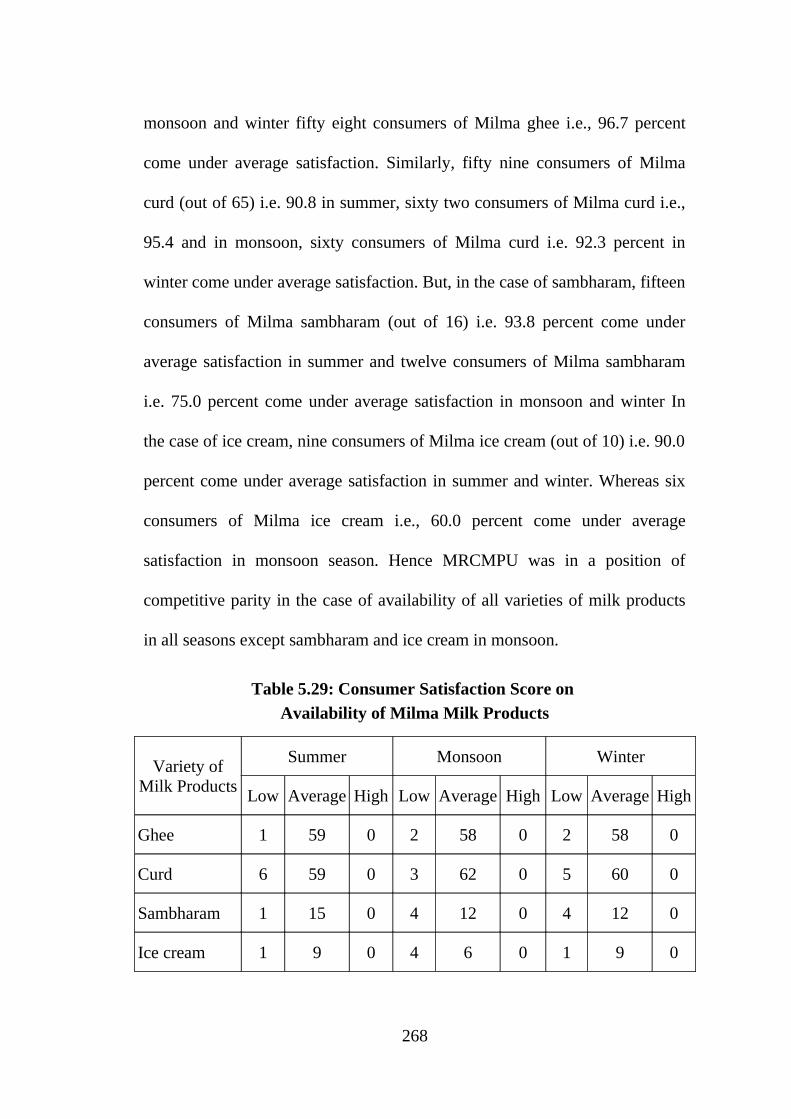
As per Table 5.29, about fifty nine consumers of Milma ghee (out of
60) i.e., 98.3 percent in summer season come under average satisfaction. In
267
Page 34
monsoon and winter fifty eight consumers of Milma ghee i.e., 96.7 percent
come under average satisfaction. Similarly, fifty nine consumers of Milma
curd (out of 65) i.e. 90.8 in summer, sixty two consumers of Milma curd i.e.,
95.4 and in monsoon, sixty consumers of Milma curd i.e. 92.3 percent in
winter come under average satisfaction. But, in the case of sambharam, fifteen
consumers of Milma sambharam (out of 16) i.e. 93.8 percent come under
average satisfaction in summer and twelve consumers of Milma sambharam
i.e. 75.0 percent come under average satisfaction in monsoon and winter In
the case of ice cream, nine consumers of Milma ice cream (out of 10) i.e. 90.0
percent come under average satisfaction in summer and winter. Whereas six
consumers of Milma ice cream i.e., 60.0 percent come under average
satisfaction in monsoon season. Hence MRCMPU was in a position of
competitive parity in the case of availability of all varieties of milk products
in all seasons except sambharam and ice cream in monsoon.
Table 5.29: Consumer Satisfaction Score on
Availability of Milma Milk Products
Variety of Milk Products
Summer Monsoon Winter
Low Average High Low Average High Low Average High
Ghee 1 59 0 2 58 0 2 58 0
Curd 6 59 0 3 62 0 5 60 0
Sambharam 1 15 0 4 12 0 4 12 0
Ice cream 1 9 0 4 6 0 1 9 0
268
Page 35
Price of Milma Milk
About thirty consumers (87.5 percent) in Kannur district, thirty eight
consumers (95.0 percent), in Kozhikode district, thirty six consumers (90.0
percent) in Malapuram district, and on an aggregate one hundred and nine
consumers (90.8 percent) had average satisfaction. Five consumers (12.5
percent) in Kannur district, two consumers (5.0 percent) in Kozhikode
district, four consumers (10.0 percent) in Malapuram district, and eleven
consumers (9.2 percent) in aggregate had low satisfaction. But no consumer
in the three districts had high satisfaction (Table 5.30). As far as the price of
Milma milk was considered MRCMPU was in a position of competitive
parity.
Table 5.30: Consumer Satisfaction Score on Price of Milma Milk -
Districtwise
DistrictsLow Average High Total
Nos. % Nos. % Nos. % Nos. %
Kannur 5 12.5 35 87.5 0 0.0 40 10.0
Kozhikode 2 5.0 38 95.0 0 0.0 40 100.0
Malapuram 4 10.0 36 90.0 0 0.0 40 100.0
Total 11 9.2 109 90.8 0 0.0 120 100.0
Analysis of variance can be used to evaluate whether there was
significant variegation in the consumer satisfaction scored among the three
districts. Hence various sub hypotheses were set up and tested.
269
Page 36
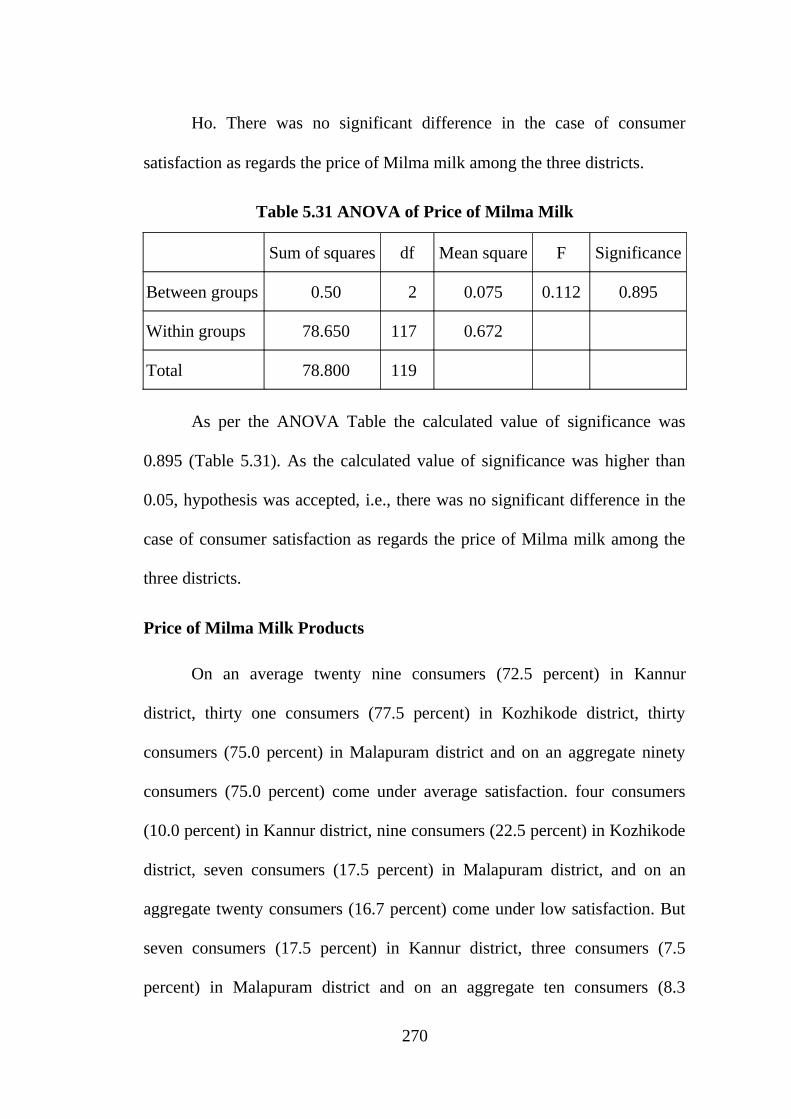
Ho. There was no significant difference in the case of consumer
satisfaction as regards the price of Milma milk among the three districts.
Table 5.31 ANOVA of Price of Milma Milk
Sum of squares df Mean square F Significance
Between groups 0.50 2 0.075 0.112 0.895
Within groups 78.650 117 0.672
Total 78.800 119
As per the ANOVA Table the calculated value of significance was
0.895 (Table 5.31). As the calculated value of significance was higher than
0.05, hypothesis was accepted, i.e., there was no significant difference in the
case of consumer satisfaction as regards the price of Milma milk among the
three districts.
Price of Milma Milk Products
On an average twenty nine consumers (72.5 percent) in Kannur
district, thirty one consumers (77.5 percent) in Kozhikode district, thirty
consumers (75.0 percent) in Malapuram district and on an aggregate ninety
consumers (75.0 percent) come under average satisfaction. four consumers
(10.0 percent) in Kannur district, nine consumers (22.5 percent) in Kozhikode
district, seven consumers (17.5 percent) in Malapuram district, and on an
aggregate twenty consumers (16.7 percent) come under low satisfaction. But
seven consumers (17.5 percent) in Kannur district, three consumers (7.5
percent) in Malapuram district and on an aggregate ten consumers (8.3
270
Page 37
percent) come under high satisfaction (Table 5.32). As far as the price of
Milma milk products was concerned, MRCMPU was in a position of
competitive parity.
Table 5.32: Consumer Satisfaction Score of the Price of Milma Milk Products - Districtwise
Districts
Low Average High Total
Nos. % Nos. % Nos. % Nos. %
Kannur 4 10.0 29 72.5 7 17.5 40 100.0
Kozhikode 9 22.5 31 77.5 0 0.0 40 100.0
Malapuram 7 17.5 30 75.0 3 7.5 40 100.0
Total 20 16.7 90 75.0 10 8.3 120 100.0
Ho. There was no significant difference in the case of consumer
satisfaction as regards the price of Milma milk products among the three
districts.
Table 5.33: ANOVA of Price of Milma Milk Products
Sum of squares df Mean square F Significance
Between groups 13.087 2 6.544 6.103 0.003
Within groups 124.375 116 1.072
Total 137.462 118
As per the ANOVA Table the calculated value of significance was
0.003 (Table 5.33). As the calculated value of significance was less than 0.05,
the hypothesis was rejected i.e., there was significant difference in the case of
271
Page 38
consumer satisfaction with respect to the price of Milma milk products among
the three districts.
Quality of Milma Milk
About 60.0 percent of the consumers in Kannur district, 70.0 percent of
the consumers in Kozhikode district, and 65.0 percent of the consumers in
Malapuram district and on an aggregate 65.0 percent of consumers came
under average satisfaction. But 30.0 percent of the consumers in Kannur
district, 22.5 percent consumers in Kozhikode district, 17.5 percent of the
consumers in Malapuram district, and on an aggregate 23.3 percent of the
consumers came under low satisfaction. About 10.0 percent of the consumers
in Kannur district, 7.5 percent of the consumers in Kozhikode district, and
17.5 percent of the consumers in Malapuram district and on an aggregate 11.7
percent of the consumers came under high satisfaction (Table 5.34). As far as
quality of Milma milk was concerned MRCMPU was in a position of
competitive parity.
Table 5.34: Consumer Satisfaction Score of the Quality of Milma Milk - Districtwise
DistrictsLow Average High Total
Nos. % Nos. % Nos. % Nos. %
Kannur 12 30.0 24 60.0 4 10.0 40 100.0
Kozhikode 9 22.5 28 70.0 3 7.5 40 100.0
Malapuram 7 17.5 26 65.0 7 17.5 40 100.0
Total 28 23.3 78 65.0 14 11.7 120 100.0
272
Page 39
Ho. There was no significant difference in the case of consumer
satisfaction in terms of quality of Milma milk and milk products among the
three districts.
Table 5.35: ANOVA of the Quality of Milma Milk
Sum of squares df Mean square F Significance
Between groups 0.950 2 0.475 1.318 0.272
Within groups 42.175 117 0.360
Total 43.125 119
As per the ANOVA Table the calculated value of significance was
0.272 (Table 5.35). As the value of significance was higher than 0.05, this
hypothesis was accepted, i.e., there was no significant difference in the case
of consumer satisfaction in terms of quality of Milma milk among the three
districts.
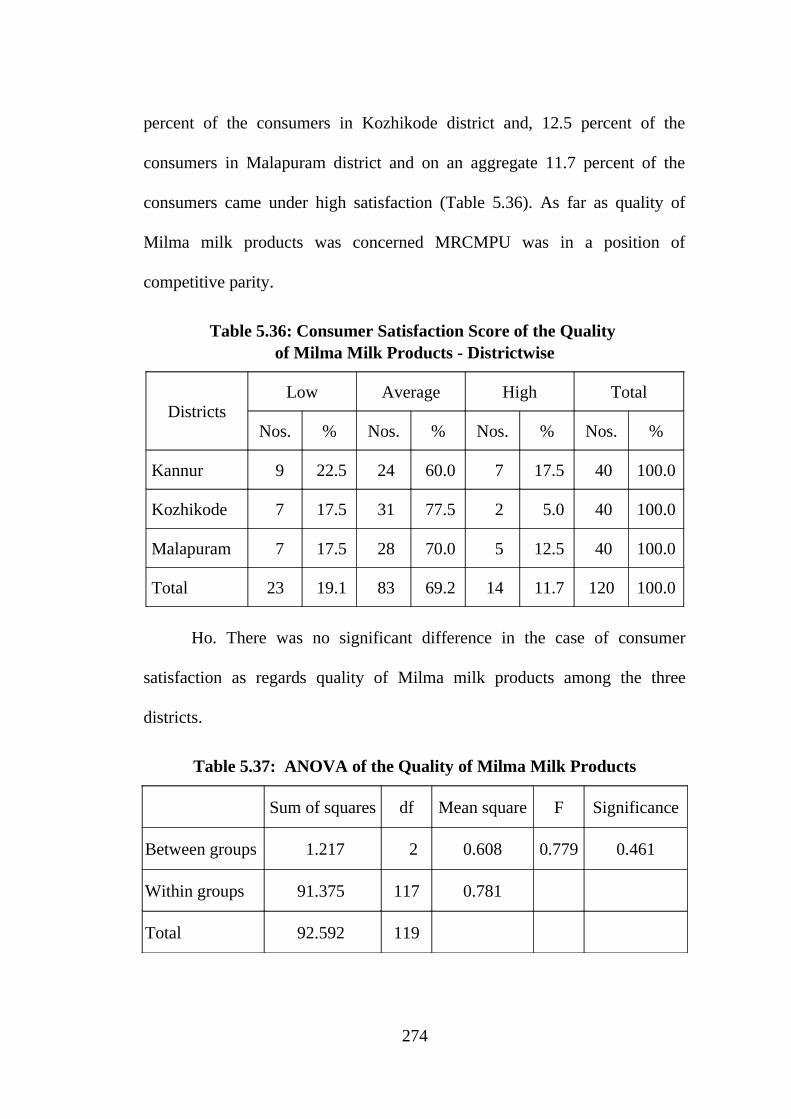
Quality of Milma Milk Products
60.0 percent of the consumers in Kannur district, 77.5 percent of the
consumers in Kozhikode district, and 70.0 percent of the consumers in
Malapuram district and on an aggregate, 69.2 percent of the consumers came
under average satisfaction But 22.5 percent of the consumers in Kannur
district, and 17.5 percent of the consumers each in Kozhikode and Malapuram
districts, and on an aggregate, 19.1 percent of the consumers came under low
satisfaction About 17.5 percent of the consumers in Kannur district, 5.0
273
Page 40
percent of the consumers in Kozhikode district and, 12.5 percent of the
consumers in Malapuram district and on an aggregate 11.7 percent of the
consumers came under high satisfaction (Table 5.36). As far as quality of
Milma milk products was concerned MRCMPU was in a position of
competitive parity.
Table 5.36: Consumer Satisfaction Score of the Quality of Milma Milk Products - Districtwise
DistrictsLow Average High Total
Nos. % Nos. % Nos. % Nos. %
Kannur 9 22.5 24 60.0 7 17.5 40 100.0
Kozhikode 7 17.5 31 77.5 2 5.0 40 100.0
Malapuram 7 17.5 28 70.0 5 12.5 40 100.0
Total 23 19.1 83 69.2 14 11.7 120 100.0
Ho. There was no significant difference in the case of consumer
satisfaction as regards quality of Milma milk products among the three
districts.
Table 5.37: ANOVA of the Quality of Milma Milk Products
Sum of squares df Mean square F Significance
Between groups 1.217 2 0.608 0.779 0.461
Within groups 91.375 117 0.781
Total 92.592 119
274
Page 41
As per the ANOVA Table the calculated value of significance was
0.461(Table 5.37). As the calculated value of significance was higher than
0.05, this hypothesis was accepted, i.e., there was no significant difference in
the case of consumer satisfaction with regard to the quality of Milma milk
products among the three districts.
Packing of Milma Milk
About 71.0 percent of the consumers in Kannur district, 60.0 percent of
the consumers in Kozhikode district, and 47.5 percent of the consumers in
Malapuram district and on an aggregate, 59.2 percent of the consumers came
under average satisfaction. But 7.5 percent of the consumers in Kannur
district, 27.5 percent of the consumers in Kozhikode district, 25.0 percent of
the consumers in Malapuram district and, on an aggregate, 20.0 percent of the
consumers came under low satisfaction About 21.5 percent of the consumers
in Kannur district, 12.5 percent of the consumers in Kozhikode district, 27.5
percent of the consumers in Malapuram district, and on an aggregate, 20.8
percent of the consumers came under high satisfaction (Table 5.38). As far as
packing of Milma milk was concerned MRCMPU was in a position of
competitive parity.
275
Page 42
Table 5.38: Consumer Satisfaction Score of Packing
of Milma Milk - Districtwise
DistrictsLow Average High Total
Nos. % Nos. % Nos. % Nos. %
Kannur 3 7.5 28 71.0 9 21.5 40 100.0
Kozhikode 11 27.5 24 60.0 5 12.5 40 100.0
Malapuram 10 25.0 19 47.5 11 27.5 40 100.0
Total 24 20.0 71 59.2 25 20.8 120 100.0
Packing of Milma Milk Products
About 82.5 percent of the consumers in Kannur district, 80.0 percent of
the consumers in Kozhikode district, and 70.0 percent of the consumers in
Malapuram, and on an aggregate, 77.5 percent of the consumers came under
average satisfaction. About 17.5 percent of the consumers in Kannur district,
5.0 percent of the consumers in Kozhikode district, and 12.5 percent of the
consumers in Malapuram district, and on an aggregate, 11.7 percent of
consumers came under high satisfaction. But no consumer in Kannur district,
15.0 percent of the consumers in Kozhikode district, and 17.5 percent of the
consumers in Malapuram district, and on an aggregate, 10.8 percent of the
consumers came under low satisfaction (Table 5.39). As far as packing of
Milma milk products was concerned MRCMPU was in a position of
competitive parity.
276
Page 43
Table 5.39: Consumer Satisfaction Score of Packing of Milma Milk Products - Districtwise
DistrictsLow Average High Total
Nos. % Nos. % Nos. % Nos. %
Kannur 0 0.0 33 82.5 7 17.5 40 100.0
Kozhikode 6 15.0 32 80.0 2 5.0 40 100.0
Malapuram 7 17.5 28 70.0 5 12.5 40 100.0
Total 13 10.8 93 77.5 14 11.7 120 100.0
Response of Milma to Changing Needs
Under this head four variables were taken into account. They were:-
a. Handling of consumers complaints
b. Innovation in marketing
c. Scheduling of delivery time in the locality of consumers
d. Granting of agencies in the locality of consumers
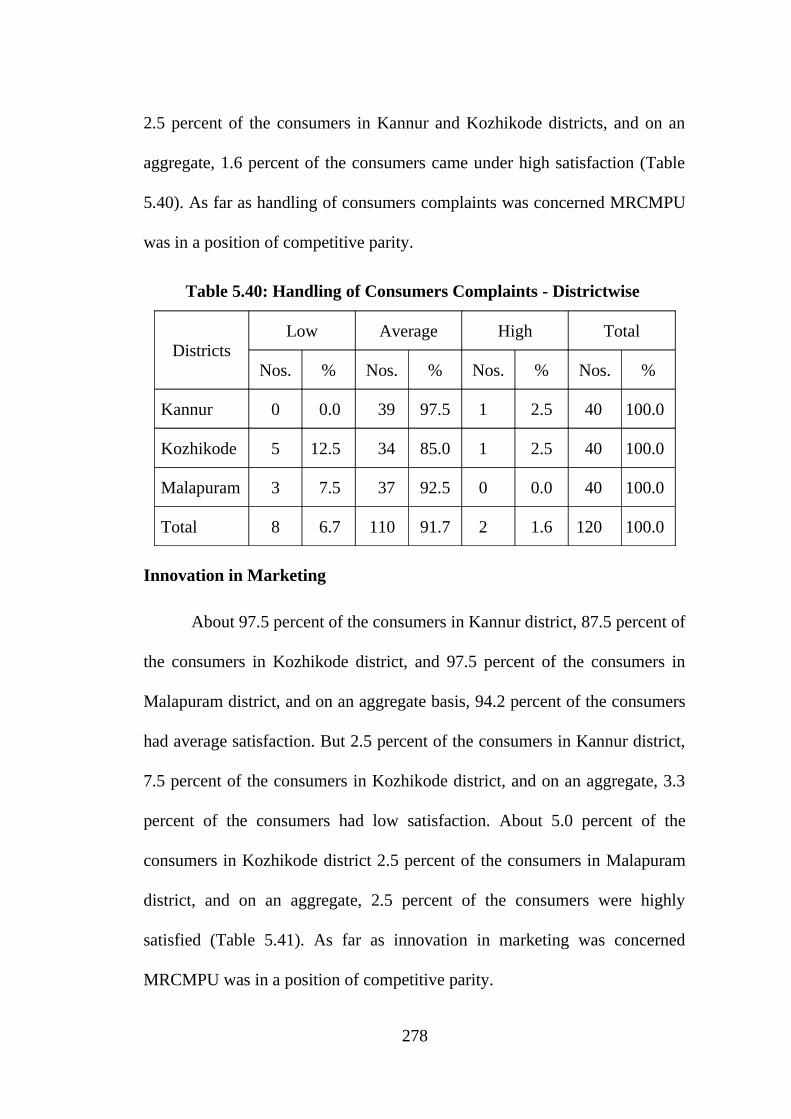
Handling of Consumers Complaints
About 97.5 percent of the consumers in Kannur district, 85.0 percent of
the consumers in Kozhikode district, and 92.5 percent of the consumers in
Malapuram district and on an aggregate 91.7 percent of the consumers came
under average satisfaction. But 12.5 percent of the consumers in Kozhikode
district, 7.5 percent of the consumers in Malapuram district, and on an
aggregate, 6.7 percent of the consumers came under low satisfaction. About
277
Page 44
2.5 percent of the consumers in Kannur and Kozhikode districts, and on an
aggregate, 1.6 percent of the consumers came under high satisfaction (Table
5.40). As far as handling of consumers complaints was concerned MRCMPU
was in a position of competitive parity.
Table 5.40: Handling of Consumers Complaints - Districtwise
DistrictsLow Average High Total
Nos. % Nos. % Nos. % Nos. %
Kannur 0 0.0 39 97.5 1 2.5 40 100.0
Kozhikode 5 12.5 34 85.0 1 2.5 40 100.0
Malapuram 3 7.5 37 92.5 0 0.0 40 100.0
Total 8 6.7 110 91.7 2 1.6 120 100.0
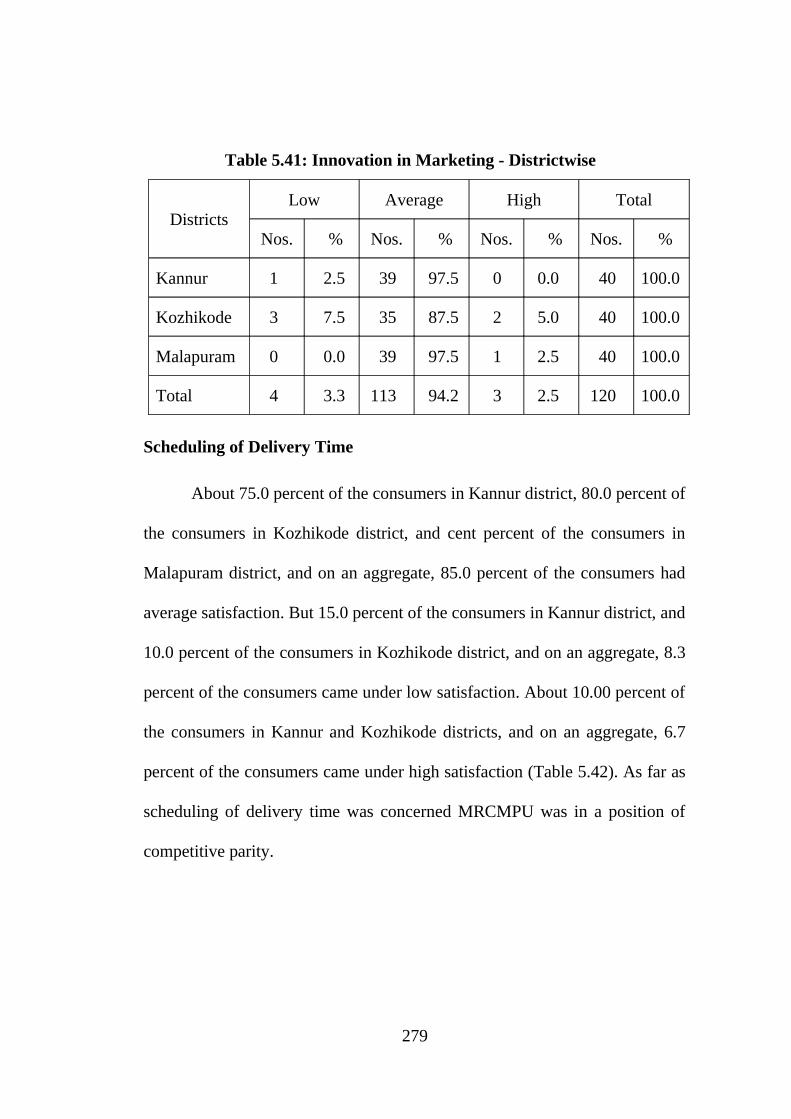
Innovation in Marketing
About 97.5 percent of the consumers in Kannur district, 87.5 percent of
the consumers in Kozhikode district, and 97.5 percent of the consumers in
Malapuram district, and on an aggregate basis, 94.2 percent of the consumers
had average satisfaction. But 2.5 percent of the consumers in Kannur district,
7.5 percent of the consumers in Kozhikode district, and on an aggregate, 3.3
percent of the consumers had low satisfaction. About 5.0 percent of the
consumers in Kozhikode district 2.5 percent of the consumers in Malapuram
district, and on an aggregate, 2.5 percent of the consumers were highly
satisfied (Table 5.41). As far as innovation in marketing was concerned
MRCMPU was in a position of competitive parity.
278
Page 45
Table 5.41: Innovation in Marketing - Districtwise
DistrictsLow Average High Total
Nos. % Nos. % Nos. % Nos. %
Kannur 1 2.5 39 97.5 0 0.0 40 100.0
Kozhikode 3 7.5 35 87.5 2 5.0 40 100.0
Malapuram 0 0.0 39 97.5 1 2.5 40 100.0
Total 4 3.3 113 94.2 3 2.5 120 100.0
Scheduling of Delivery Time
About 75.0 percent of the consumers in Kannur district, 80.0 percent of
the consumers in Kozhikode district, and cent percent of the consumers in
Malapuram district, and on an aggregate, 85.0 percent of the consumers had
average satisfaction. But 15.0 percent of the consumers in Kannur district, and
10.0 percent of the consumers in Kozhikode district, and on an aggregate, 8.3
percent of the consumers came under low satisfaction. About 10.00 percent of
the consumers in Kannur and Kozhikode districts, and on an aggregate, 6.7
percent of the consumers came under high satisfaction (Table 5.42). As far as
scheduling of delivery time was concerned MRCMPU was in a position of
competitive parity.
279
Page 46
Table 5.42: Scheduling of Delivery Time - Districtwise
DistrictsLow Average High Total
Nos. % Nos. % Nos. % Nos. %
Kannur 6 15.0 30 75.0 4 10.0 40 100.0
Kozhikode 4 10.0 32 80.0 4 10.0 40 100.0
Malapuram 0 0.0 40 100.0 0 0.0 40 100.0
Total 10 8.3 102 85.0 8 6.7 120 100.0
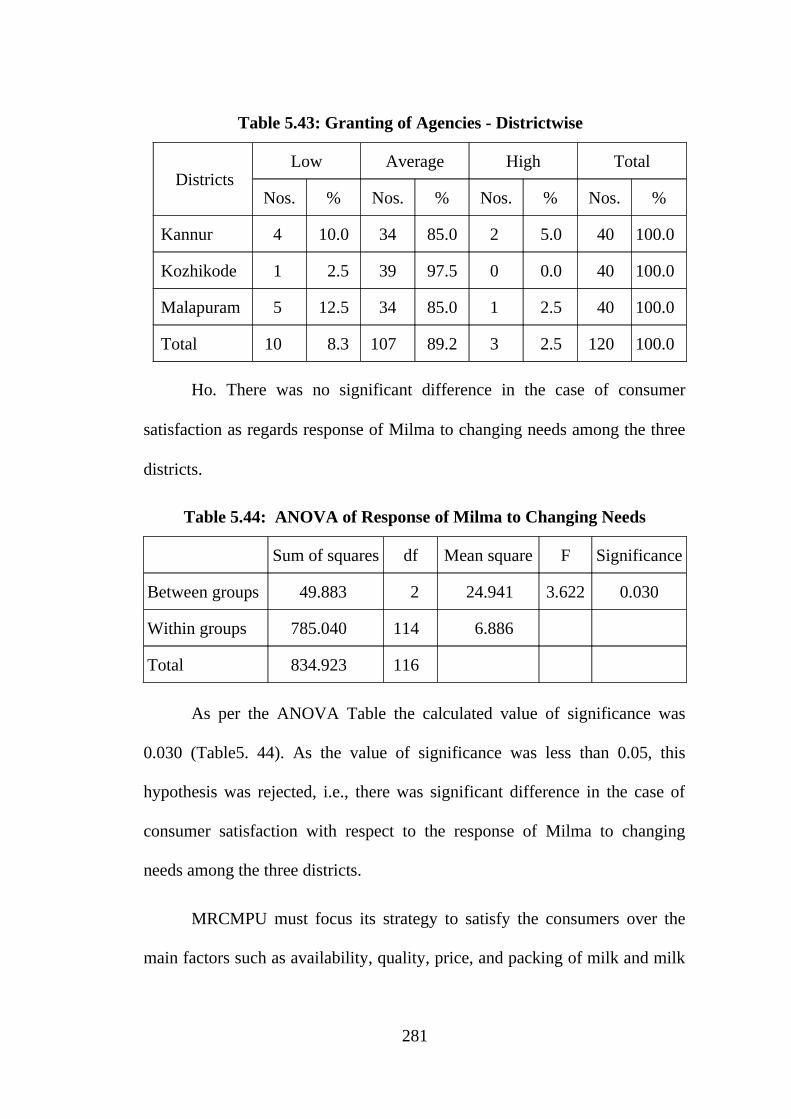
Granting of Agencies
About 85.0 percent of the consumers in Kannur and Malapuram
districts, 97.5 percent of the consumers in Kozhikode district, and on an
aggregate, 89.2 percent of the consumers came under average satisfaction.
But 10.0 percent of the consumers in Kannur district, 2.5 percent of the
consumers in Kozhikode district, 12.5 percent of the consumers in Malapuram
district, and on an aggregate, 8.3 percent of the consumers came under low
satisfaction. About 5.0 percent of the consumers in Kannur district, 2.5
percent of the consumers in Malapuram district, and on an aggregate, 2.5
percent of the consumers came under high satisfaction (Table 5.43). As far as
granting of agencies was considered MRCMPU was in a position of
competitive parity.
280
Page 47
Table 5.43: Granting of Agencies - Districtwise
DistrictsLow Average High Total
Nos. % Nos. % Nos. % Nos. %
Kannur 4 10.0 34 85.0 2 5.0 40 100.0
Kozhikode 1 2.5 39 97.5 0 0.0 40 100.0
Malapuram 5 12.5 34 85.0 1 2.5 40 100.0
Total 10 8.3 107 89.2 3 2.5 120 100.0
Ho. There was no significant difference in the case of consumer
satisfaction as regards response of Milma to changing needs among the three
districts.
Table 5.44: ANOVA of Response of Milma to Changing Needs
Sum of squares df Mean square F Significance
Between groups 49.883 2 24.941 3.622 0.030
Within groups 785.040 114 6.886
Total 834.923 116
As per the ANOVA Table the calculated value of significance was
0.030 (Table5. 44). As the value of significance was less than 0.05, this
hypothesis was rejected, i.e., there was significant difference in the case of
consumer satisfaction with respect to the response of Milma to changing
needs among the three districts.
MRCMPU must focus its strategy to satisfy the consumers over the
main factors such as availability, quality, price, and packing of milk and milk
281
Page 48
products. The mean score that go higher than 4.0 was treated as strength of
MRCMPU. As the mean score of price of Milma milk and milk products, and
packing of Milma milk products were above the score of 4.0. These factors
were considered as marketing strengths of MRCMPU. The mean score of
quality of Milma milk and milk products, packing of Milma milk, were nearly
4.0. Hence these factors were not treated as strengths of MRCMPU.
Similarly, the other factors such as handling of consumers’ complaints,
innovation in marketing, scheduling of delivery time, granting of agencies had
scored a mean score ranging between 3.5 and 3.8 (Table 5.45). These factors
also could not be treated as strengths of MRCMPU.
Table 5.45: Mean Score of Various Factors of Milma Milk and Milk Products
Sl. No Particulars Mean score
1. Price of Milk 4.6
2. Price of milk products 4.2
3. Quality of milk 3.9
4. Quality of milk products 4.0
5. Packing of milk 4.0
6. Packing of milk products 4.1
7. Handling of consumers complaints 3.5
8. Innovation in marketing 3.6
9. Scheduling of delivery time 3.8
10. Granting of agencies 3.7
282
Page 49
Complaints and Suggestions
A few consumers made complaints. Their complaints and suggestions
were:-
1. As the milk was supplied in containers, sometimes milk may be
unhygienic.
2. As the dealer opens the freezer frequently for supplying milk to the
consumers, it may affect the quality of milk adversely.
3. The dealer who makes door delivery charges Re. one per day. It was
too much.
4. Proper discipline should be ensured throughout the distribution
network with sincere supervision.
NON USERS
In this study, non users who do not purchase Milma milk were
considered. Ten non users of Milma milk each (households only) from three
districts such as Kannur, Kozhikode and Malapuram districts were taken as
samples. In this part, general matters of non users such as residential area,
qualification, employment, annual income, numbers of members in the family
etc., were taken first. Then, the purchase of milk and milk products, their
opinion about the price and quality of Milma milk and milk products, loyalty
and the general matters affecting the quality of milk and milk products were
taken into account.
283
Page 50
Out of thirty samples 76.6 percent of the non users of Milma milk
belong to rural area living in village, 16.7 percent of the non users belong to
Municipality a sort of sub urban area, and 6.7percent of the non users belong
to urban area living in Corporation (Appendix 5.8). About 36.6 percent of
the non users were post graduate, 26.7 percent below S.S.L.C and the same
hold S.S.L.C & Plus Two, and 10.0 percent graduates (Appendix 5.9). Out of
the thirty respondents, 53.4 percent were employees of govt. and semi govt.
department, 33.0 percent retired hands and unemployed, 10.0 percent doing
business, and 3.3 percent employees of private organisations (Appendix 5.10).
About 23.3 percent of the respondents had an annual income below Rs.50,
000, and the same had Rs 50,000 to one lakh, About 6.8 percent had an
annual income varying from Rs.1 lakh to 1.5 lakhs, 23.3 percent had an
annual income from 1.5 lakhs to 2 lakhs, and the same had above Rs. 2 lakhs
(Appendix 5.11). About 43.4 percent of the respondents had two adults in the
family, 10.0 percent had three adults in the family, 23.3 percent had four
adults in the family, 16.7 percent had five adults in the family, and 3.3 percent
had seven or eight adults in the family. Similarly, 36.7 percent of the
respondents had two children in the family, 20.0 percent had three children in
the family, 13.3 percent had one child in the family and 26.7 percent had no
child in the family (Appendix 5.12).
284
Page 51
PURCHASE OF MILK
On an average, 1.0 litre of milk was purchased at a time, Maximum
quantity of milk Purchase at a time was 3.0 litres and minimum quantity of
milk purchase at a time was 200 ml. About 66.8 percent of non users purchase
milk from nearby household, 23.3 percent use their own milk, and 3.3 percent
of non users each purchases from nearby society, private firms and others
(Table 5.46).
Table 5.46: Purchase of Milk - Non Users
Nos. Percent
Own 7 23.3
Nearby household 20 66.8
Nearby society 1 3.3
Private firms 1 3.3
Others 1 3.3
Total 30 100.0
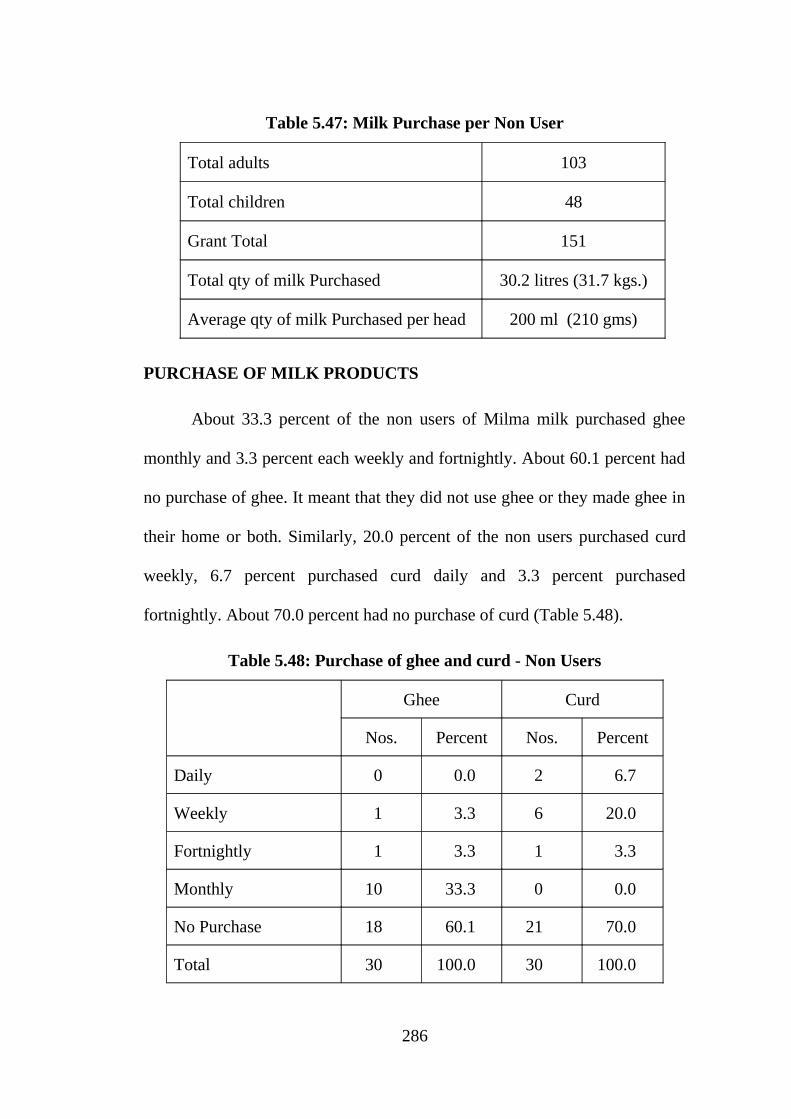
As per Table 5.47, the total number of adults in a sample of 30
households was one hundred and three and the total number of children was
forty eight. Total number of adults and children was 151. Total quantity of
milk purchased by thirty households was 30.2 litres. As 1.05 kgs. of milk was
equivalent to one litre of milk, total quantity of milk purchased was 31.7 kgs.
per day. Average quantity of milk purchased per head was 200 ml (210 gms.)
per day (Total quantity of milk purchased by total number of adults and
children).
285
Page 52
Table 5.47: Milk Purchase per Non User
Total adults 103
Total children 48
Grant Total 151
Total qty of milk Purchased 30.2 litres (31.7 kgs.)
Average qty of milk Purchased per head 200 ml (210 gms)
PURCHASE OF MILK PRODUCTS
About 33.3 percent of the non users of Milma milk purchased ghee
monthly and 3.3 percent each weekly and fortnightly. About 60.1 percent had
no purchase of ghee. It meant that they did not use ghee or they made ghee in
their home or both. Similarly, 20.0 percent of the non users purchased curd
weekly, 6.7 percent purchased curd daily and 3.3 percent purchased
fortnightly. About 70.0 percent had no purchase of curd (Table 5.48).
Table 5.48: Purchase of ghee and curd - Non Users
Ghee Curd
Nos. Percent Nos. Percent
Daily 0 0.0 2 6.7
Weekly 1 3.3 6 20.0
Fortnightly 1 3.3 1 3.3
Monthly 10 33.3 0 0.0
No Purchase 18 60.1 21 70.0
Total 30 100.0 30 100.0
286
Page 53
About 3.3 percent of non users each purchase sambharam weekly,
fortnightly and monthly. 90.1 percent had no purchase of sambharam. 13.3
percent of the non users purchase ice cream monthly and 3.3 percent purchase
ice cream fortnightly. About 83.4 percent had no purchase of ice cream. But
in the case of peda about 3.3 percent of the non users purchase peda daily,
weekly and fortnightly and 90.1 percent had no purchase of peda (Table
5.49).
Table 5.49: Purchase of Sambharam, Ice cream and Peda - Non Users
Sambharam Ice cream Peda
Nos. Percent Nos. Percent Nos. Percent
Daily 0 0.0 0 0.0 1 3.3
Weekly 1 3.3 0 0.0 1 3.3
Fortnightly 1 3.3 1 3.3 1 3.3
Monthly 1 3.3 4 13.3 0 0.0
No Purchase 27 90.1 25 83.4 27 90.1
Total 30 100.0 30 100.0 30 100.0
Majority of the non users of Milma milk did not purchase milk
products or they made milk products such as ghee, curd, sambharam etc in
their home or both. Similarly majority of the non users did not purchase ice
cream and peda. In the case of ghee, about 33.3 percent of the non users made
ghee themselves, 16.6 percent purchased ghee from nearby house and 16.6
percent purchased ghee from other private firms. The remaining 6.7 percent
287
Page 54
purchased ghee from Milma, margin free market, super market etc. But in the
case of curd about 46.7 percent of the non users made curd themselves, 6.6
percent purchased curd from nearby society and 10.0 percent purchased curd
from other private firms. The remaining 13.3 percent purchased from Milma
and margin free market. In the case of sambharam, about 6.7 percent of the
non users made sambharam themselves, 3.3 percent purchased sambharam
from nearby house, other private firms and from Milma. But in the case of ice
cream, 13.3 percent of the non users purchased ice cream from other firms
and 3.3 percent purchased ice cream from Milma. Similarly in the case of
peda 10.0 percent of the non users purchased peda from other firms and had
no purchase of peda from Milma (Table 5.50).
Table 5.50: Purchase of Milk Products - Non Users
Ghee Curd Sambharam Ice cream Peda
Nos. % Nos. % Nos. % Nos. % Nos. %
Own 10 33.3 14 46.7 2 6.7 0 0.0 0 0.0
Nearby house 5 16.6 2 6.6 1 3.3 0 0.0 0 0.0
Nearby societies 0 0.0 0 0.0 0 0.0 0 0.0 0 0.0
Pvt. firms 5 16.6 3 10.0 1 3.3 4 13.3 3 10.0
Others 2 6.7 4 13.3 1 3.3 1 3.3 0 0.0
No Purchase 8 26.8 7 23.4 25 83.4 25 83.4 27 90.0
Total 30 100.0 30 100.0 30 100.0 30 100.0 30 100.0
288
Page 55
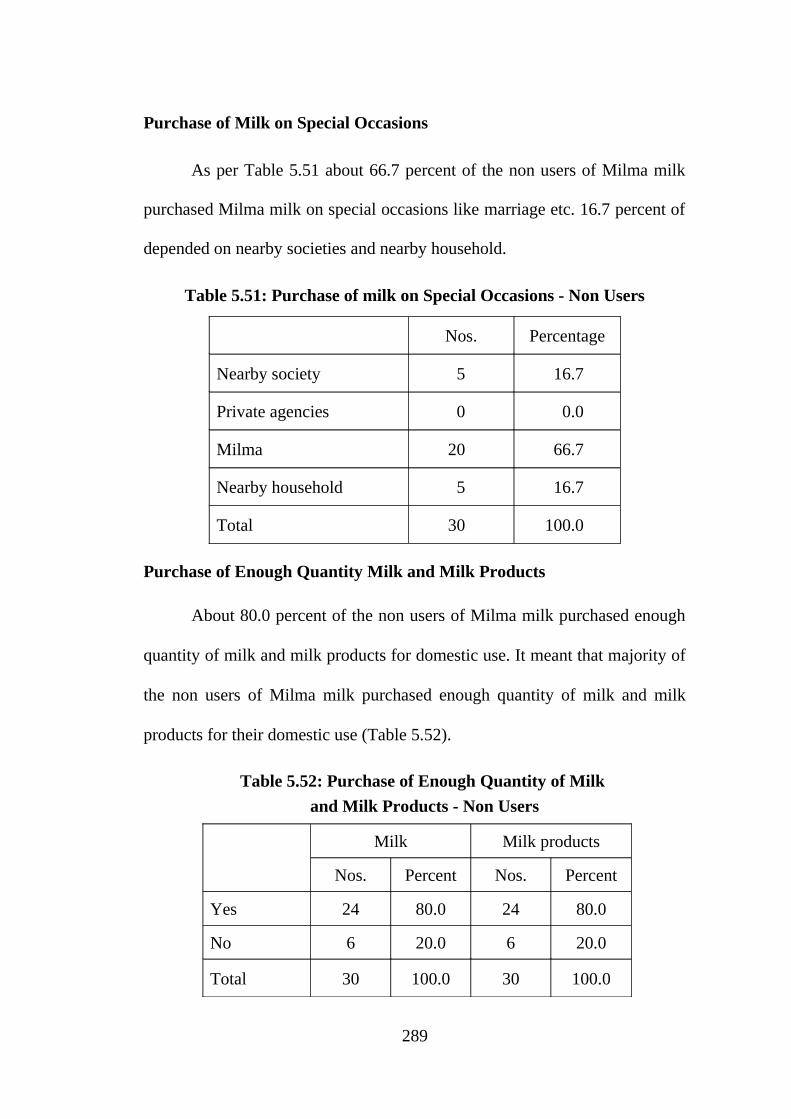
Purchase of Milk on Special Occasions
As per Table 5.51 about 66.7 percent of the non users of Milma milk
purchased Milma milk on special occasions like marriage etc. 16.7 percent of
depended on nearby societies and nearby household.
Table 5.51: Purchase of milk on Special Occasions - Non Users
Nos. Percentage
Nearby society 5 16.7
Private agencies 0 0.0
Milma 20 66.7
Nearby household 5 16.7
Total 30 100.0
Purchase of Enough Quantity Milk and Milk Products
About 80.0 percent of the non users of Milma milk purchased enough
quantity of milk and milk products for domestic use. It meant that majority of
the non users of Milma milk purchased enough quantity of milk and milk
products for their domestic use (Table 5.52).
Table 5.52: Purchase of Enough Quantity of Milk
and Milk Products - Non Users
Milk Milk products
Nos. Percent Nos. Percent
Yes 24 80.0 24 80.0
No 6 20.0 6 20.0
Total 30 100.0 30 100.0
289
Page 56
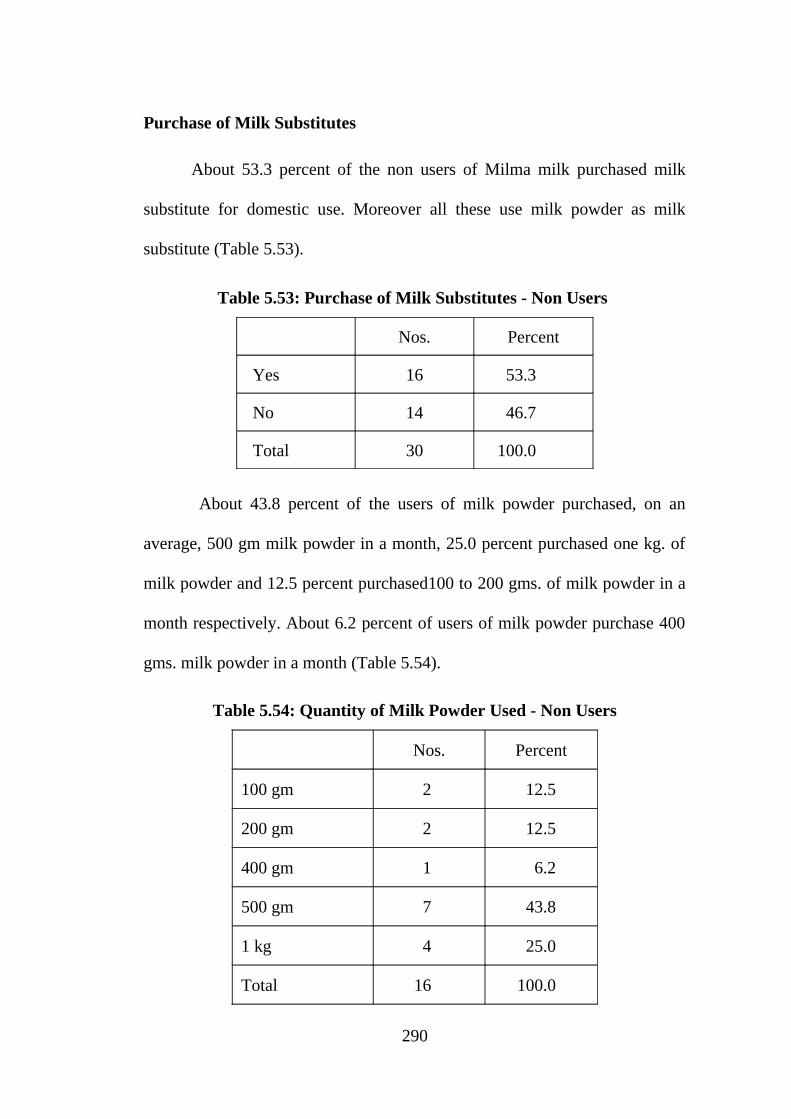
Purchase of Milk Substitutes
About 53.3 percent of the non users of Milma milk purchased milk
substitute for domestic use. Moreover all these use milk powder as milk
substitute (Table 5.53).
Table 5.53: Purchase of Milk Substitutes - Non Users
Nos. Percent
Yes 16 53.3
No 14 46.7
Total 30 100.0
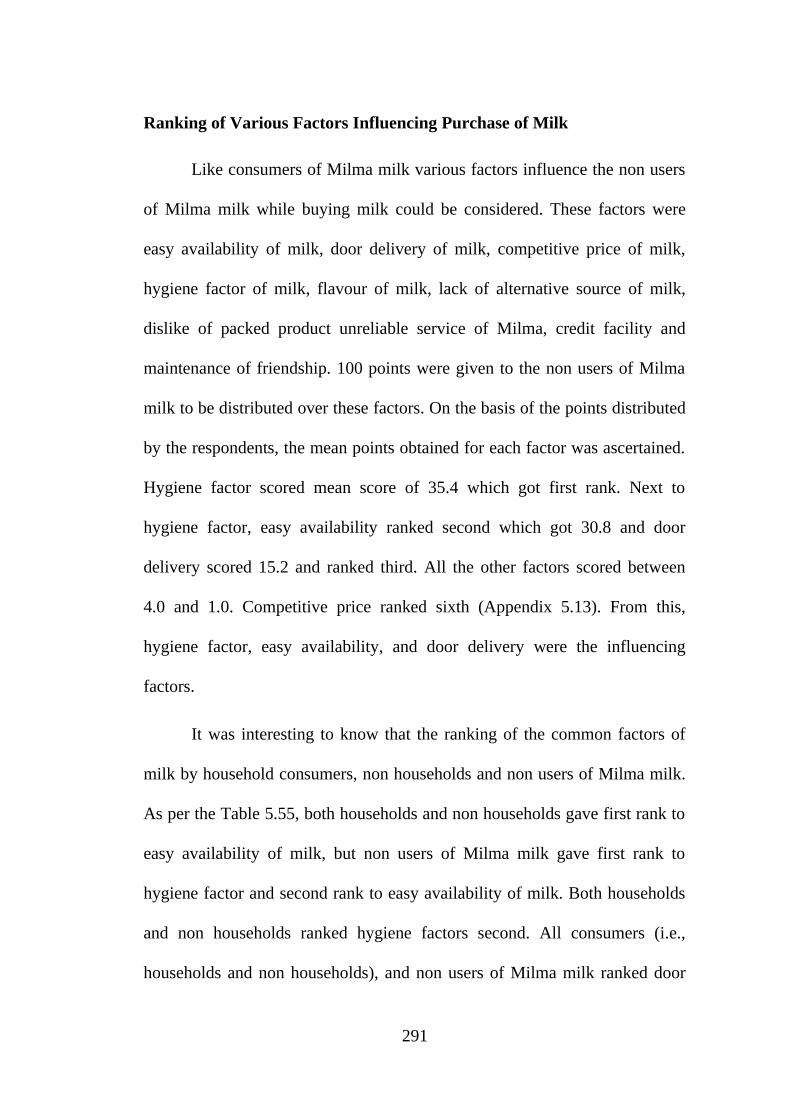
About 43.8 percent of the users of milk powder purchased, on an
average, 500 gm milk powder in a month, 25.0 percent purchased one kg. of
milk powder and 12.5 percent purchased100 to 200 gms. of milk powder in a
month respectively. About 6.2 percent of users of milk powder purchase 400
gms. milk powder in a month (Table 5.54).
Table 5.54: Quantity of Milk Powder Used - Non Users
Nos. Percent
100 gm 2 12.5
200 gm 2 12.5
400 gm 1 6.2
500 gm 7 43.8
1 kg 4 25.0
Total 16 100.0
290
Page 57
Ranking of Various Factors Influencing Purchase of Milk
Like consumers of Milma milk various factors influence the non users
of Milma milk while buying milk could be considered. These factors were
easy availability of milk, door delivery of milk, competitive price of milk,
hygiene factor of milk, flavour of milk, lack of alternative source of milk,
dislike of packed product unreliable service of Milma, credit facility and
maintenance of friendship. 100 points were given to the non users of Milma
milk to be distributed over these factors. On the basis of the points distributed
by the respondents, the mean points obtained for each factor was ascertained.
Hygiene factor scored mean score of 35.4 which got first rank. Next to
hygiene factor, easy availability ranked second which got 30.8 and door
delivery scored 15.2 and ranked third. All the other factors scored between
4.0 and 1.0. Competitive price ranked sixth (Appendix 5.13). From this,
hygiene factor, easy availability, and door delivery were the influencing
factors.
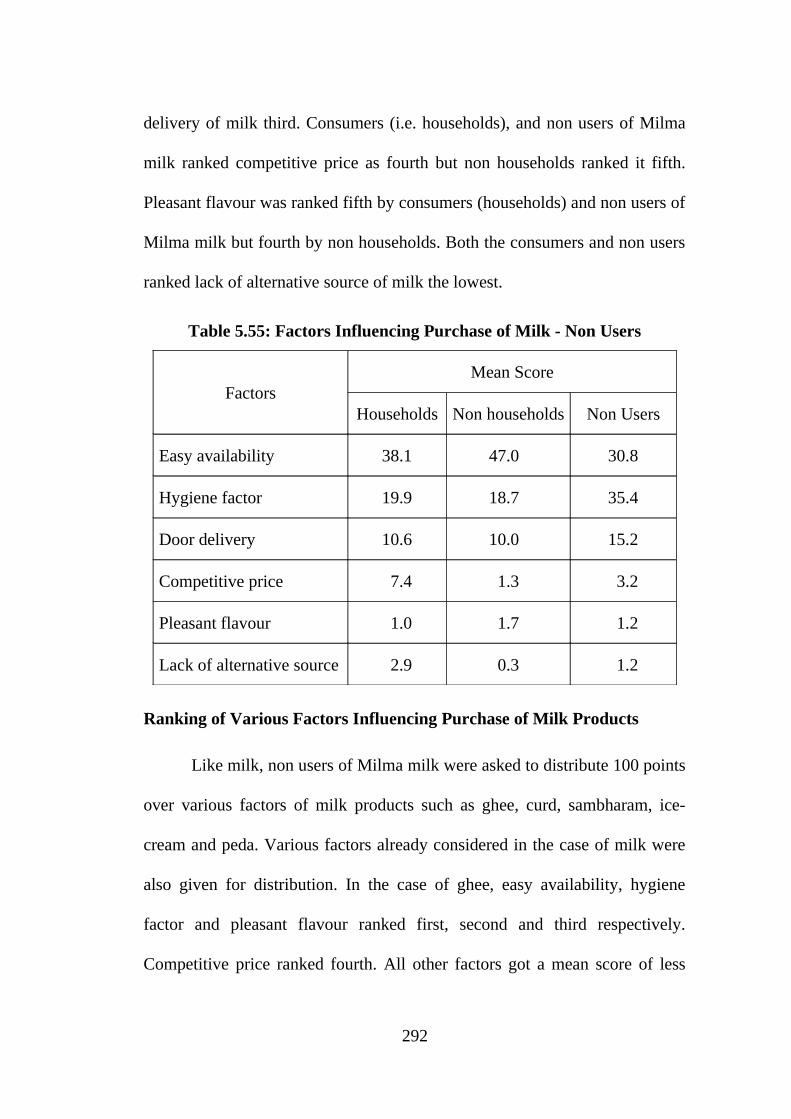
It was interesting to know that the ranking of the common factors of
milk by household consumers, non households and non users of Milma milk.
As per the Table 5.55, both households and non households gave first rank to
easy availability of milk, but non users of Milma milk gave first rank to
hygiene factor and second rank to easy availability of milk. Both households
and non households ranked hygiene factors second. All consumers (i.e.,
households and non households), and non users of Milma milk ranked door
291
Page 58
delivery of milk third. Consumers (i.e. households), and non users of Milma
milk ranked competitive price as fourth but non households ranked it fifth.
Pleasant flavour was ranked fifth by consumers (households) and non users of
Milma milk but fourth by non households. Both the consumers and non users
ranked lack of alternative source of milk the lowest.
Table 5.55: Factors Influencing Purchase of Milk - Non Users
FactorsMean Score
Households Non households Non Users
Easy availability 38.1 47.0 30.8
Hygiene factor 19.9 18.7 35.4
Door delivery 10.6 10.0 15.2
Competitive price 7.4 1.3 3.2
Pleasant flavour 1.0 1.7 1.2
Lack of alternative source 2.9 0.3 1.2
Ranking of Various Factors Influencing Purchase of Milk Products
Like milk, non users of Milma milk were asked to distribute 100 points
over various factors of milk products such as ghee, curd, sambharam, ice-
cream and peda. Various factors already considered in the case of milk were
also given for distribution. In the case of ghee, easy availability, hygiene
factor and pleasant flavour ranked first, second and third respectively.
Competitive price ranked fourth. All other factors got a mean score of less
292
Page 59
than one. In the case of curd, hygiene factor and easy availability ranked first
and second respectively. But dislike of packed products and competitive price
ranked third and fourth. All other factors got a mean score of less than one. In
the case of sambharam, easy availability, door delivery, competitive price and
hygiene factor got an equal score of 0.7. It showed that non users of Milma
milk gave equal importance while buying sambharam. Maintenance of
friendship, dislike of packed products and credit facility scored more or less
0.2. But other factors like lack of alternative source and unreliable service of
Milma scored zero. It showed that sambharam of Milma was available in their
locality. In the case of ice cream hygiene factor ranked first, easy availability,
maintenance of friendship and door delivery ranked second, third and fourth
respectively. But all the other factors got no points. In the case of peda, it got
no points, hence these factors did not influence while buying peda (Appendix
5.13).
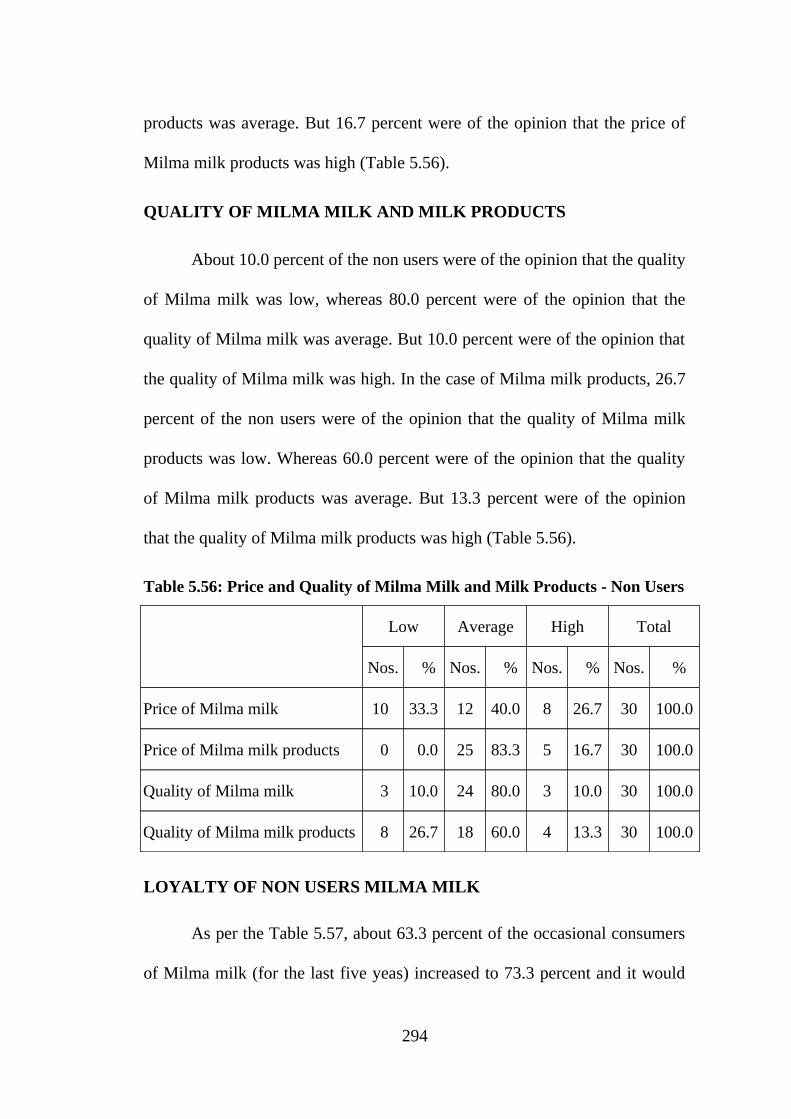
PRICE OF MILMA MILK AND MILK PRODUCTS
About 33.3 percent of the non users were of the opinion that the price
of Milma milk was low, whereas 40.0 percent were of the opinion that the
price of Milma milk was average. But 26.7 were of the opinion that the price
of Milma milk was high. In the case of Milma milk products, no non user was
of the opinion that the price of Milma milk products was low. Whereas 83.3
percent of the non users were of the opinion that the price of Milma milk
293
Page 60
products was average. But 16.7 percent were of the opinion that the price of
Milma milk products was high (Table 5.56).
QUALITY OF MILMA MILK AND MILK PRODUCTS
About 10.0 percent of the non users were of the opinion that the quality
of Milma milk was low, whereas 80.0 percent were of the opinion that the
quality of Milma milk was average. But 10.0 percent were of the opinion that
the quality of Milma milk was high. In the case of Milma milk products, 26.7
percent of the non users were of the opinion that the quality of Milma milk
products was low. Whereas 60.0 percent were of the opinion that the quality
of Milma milk products was average. But 13.3 percent were of the opinion
that the quality of Milma milk products was high (Table 5.56).
Table 5.56: Price and Quality of Milma Milk and Milk Products - Non Users
Low Average High Total
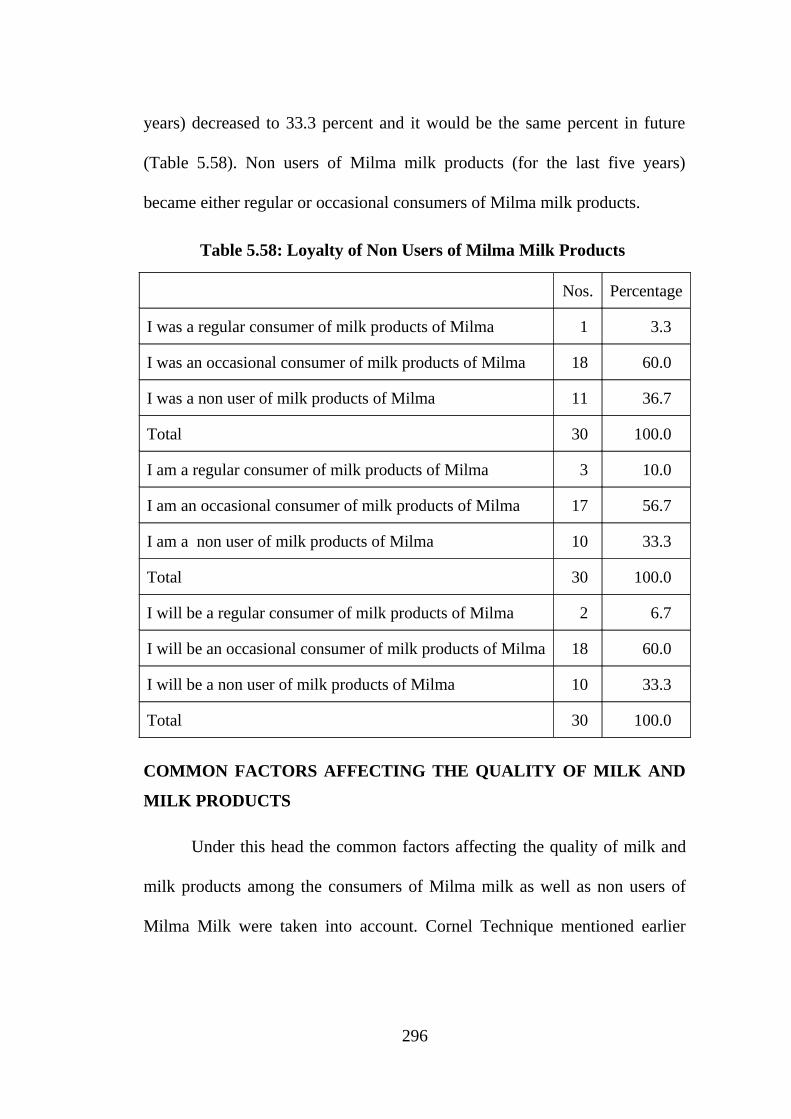
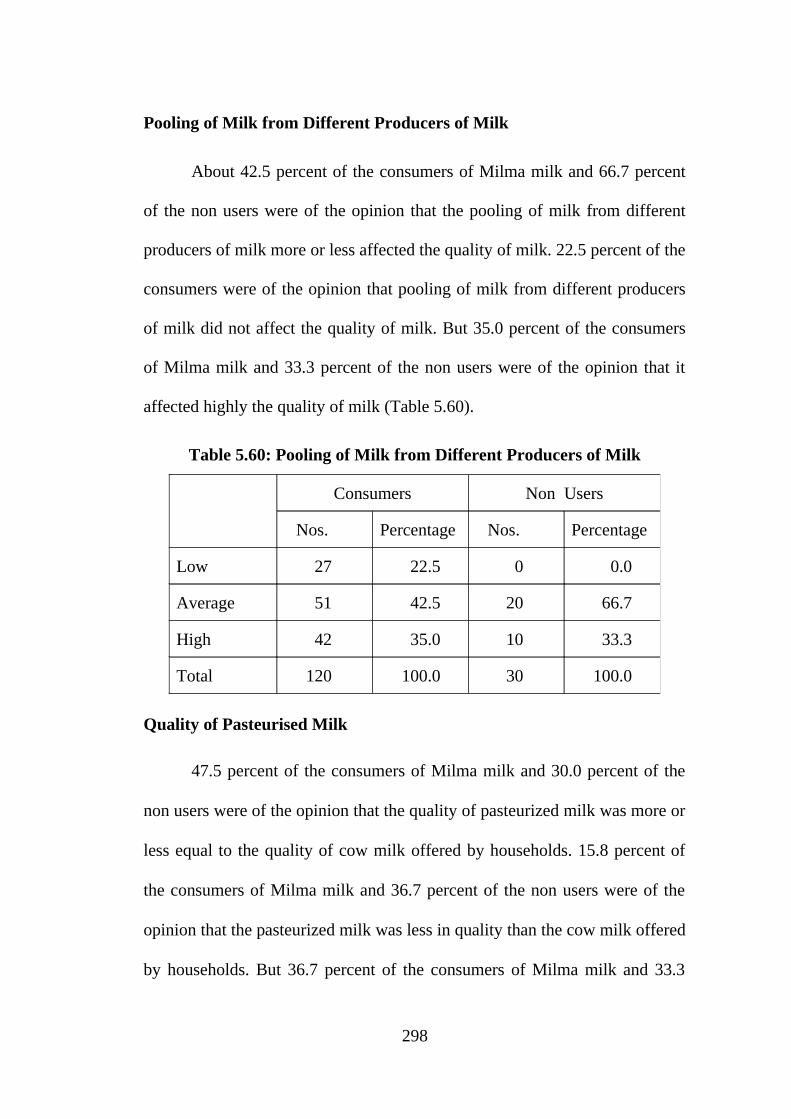
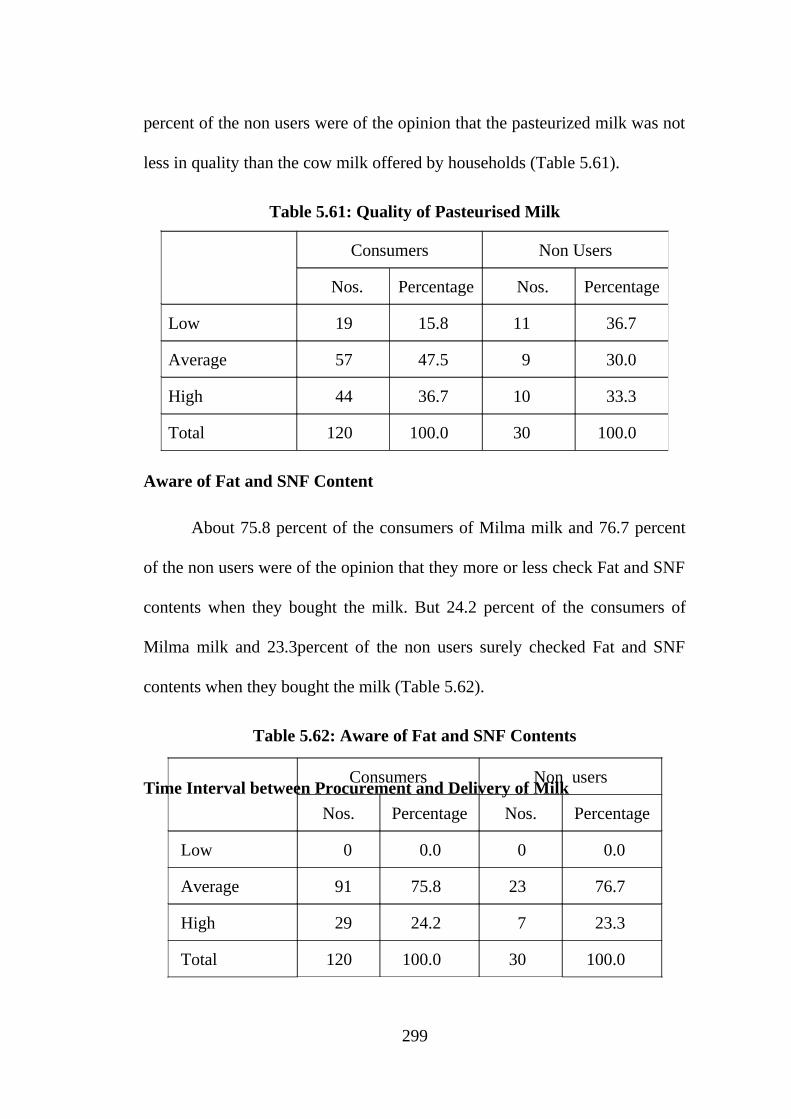
Nos. % Nos. % Nos. % Nos. %
Price of Milma milk 10 33.3 12 40.0 8 26.7 30 100.0
Price of Milma milk products 0 0.0 25 83.3 5 16.7 30 100.0
Quality of Milma milk 3 10.0 24 80.0 3 10.0 30 100.0
Quality of Milma milk products 8 26.7 18 60.0 4 13.3 30 100.0
LOYALTY OF NON USERS MILMA MILK
As per the Table 5.57, about 63.3 percent of the occasional consumers
of Milma milk (for the last five yeas) increased to 73.3 percent and it would
294
Page 61
increase to 76.7 in future. On the contrary, 36.7 percent of the non users
decreased to 26.7 percent and it would decrease to 23.3 in future. MRCMPU
could reduce the number of non users of Milma milk by increasing the
numbers of occasional consumers of Milma milk.
Table 5.57: Loyalty of Non Users of Milma Milk
Nos. Percentage
I was a regular consumer of milk of Milma 0 0.0
I was an occasional consumer of milk of Milma 19 63.3
I was a non user of milk of Milma 11 36.7
Total 30 100.0
I am an occasional consumer of Milma milk 22 73.3
I am a non user of Milma milk 8 26.7
Total 30 100.0
I will be an occasional consumer of milk of Milma 23 76.7
I will be a non user of milk of Milma 7 23.3
Total 30 100.0
Similarly 3.3 percent of the non users of Milma milk products (for the
last five years) were the regular consumers of Milma milk products. This rose
to 10.0, but would fall to 6.7 percent in future. At the same time 60.0 percent
of the occasional consumers of Milma milk products (for the last five years)
decreased to 56.7 percent and it would increase to 60.0 percent in future.
About 36.7 percent of non users of Milma milk products (for the last five
295
Page 62
years) decreased to 33.3 percent and it would be the same percent in future
(Table 5.58). Non users of Milma milk products (for the last five years)
became either regular or occasional consumers of Milma milk products.
Table 5.58: Loyalty of Non Users of Milma Milk Products
Nos. Percentage
I was a regular consumer of milk products of Milma 1 3.3
I was an occasional consumer of milk products of Milma 18 60.0
I was a non user of milk products of Milma 11 36.7
Total 30 100.0
I am a regular consumer of milk products of Milma 3 10.0
I am an occasional consumer of milk products of Milma 17 56.7
I am a non user of milk products of Milma 10 33.3
Total 30 100.0
I will be a regular consumer of milk products of Milma 2 6.7
I will be an occasional consumer of milk products of Milma 18 60.0
I will be a non user of milk products of Milma 10 33.3
Total 30 100.0
COMMON FACTORS AFFECTING THE QUALITY OF MILK AND
MILK PRODUCTS
Under this head the common factors affecting the quality of milk and
milk products among the consumers of Milma milk as well as non users of
Milma Milk were taken into account. Cornel Technique mentioned earlier
296
Page 63
was used to analyse these factors. Common factors affecting the quality of
milk and milk products were:-
1. Aware of the quality of milk.
2. Pooling of milk from different producers of milk.
3. Quality of pasteurized milk.
4. Checking of Fat and SNF content.
5. Time interval between procurement and delivery of milk.
6. Quality of other firms milk and milk products.
Aware of the Quality of Milk
About 84.2 percent of the consumers of Milma milk and 73.3 percent
of the non users were more or less aware of the quality of milk. But 15.8
percent of the consumers of Milma milk and 26.7 percent of the non users
were not aware of the quality of milk. Both the consumers and non users were
not highly aware of the quality of milk (Table 5.59).
Table 5.59: Aware of the Quality of Milk
Consumers Non Users
Nos. Percentage Nos. Percentage
Low 19 15.8 8 26.7
Average 101 84.2 22 73.3
High 0 0.0 0 0.0
Total 120 100.0 30 100.0
297
Page 64
Pooling of Milk from Different Producers of Milk
About 42.5 percent of the consumers of Milma milk and 66.7 percent
of the non users were of the opinion that the pooling of milk from different
producers of milk more or less affected the quality of milk. 22.5 percent of the
consumers were of the opinion that pooling of milk from different producers
of milk did not affect the quality of milk. But 35.0 percent of the consumers
of Milma milk and 33.3 percent of the non users were of the opinion that it
affected highly the quality of milk (Table 5.60).
Table 5.60: Pooling of Milk from Different Producers of Milk
Quality of Pasteurised Milk
47.5 percent of the consumers of Milma milk and 30.0 percent of the
non users were of the opinion that the quality of pasteurized milk was more or
less equal to the quality of cow milk offered by households. 15.8 percent of
the consumers of Milma milk and 36.7 percent of the non users were of the
opinion that the pasteurized milk was less in quality than the cow milk offered
by households. But 36.7 percent of the consumers of Milma milk and 33.3
Consumers Non Users
Nos. Percentage Nos. Percentage
Low 27 22.5 0 0.0
Average 51 42.5 20 66.7
High 42 35.0 10 33.3
Total 120 100.0 30 100.0
298
Page 65
percent of the non users were of the opinion that the pasteurized milk was not
less in quality than the cow milk offered by households (Table 5.61).
Table 5.61: Quality of Pasteurised Milk
Aware of Fat and SNF Content
About 75.8 percent of the consumers of Milma milk and 76.7 percent
of the non users were of the opinion that they more or less check Fat and SNF
contents when they bought the milk. But 24.2 percent of the consumers of
Milma milk and 23.3percent of the non users surely checked Fat and SNF
contents when they bought the milk (Table 5.62).
Table 5.62: Aware of Fat and SNF Contents
Time Interval between Procurement and Delivery of Milk
Consumers Non Users
Nos. Percentage Nos. Percentage
Low 19 15.8 11 36.7
Average 57 47.5 9 30.0
High 44 36.7 10 33.3
Total 120 100.0 30 100.0
Consumers Non users
Nos. Percentage Nos. Percentage
Low 0 0.0 0 0.0
Average 91 75.8 23 76.7
High 29 24.2 7 23.3
Total 120 100.0 30 100.0
299
Page 66
About 46.7 percent of the consumers of Milma milk and 73.3 percent
of the non users were of the opinion that the time interval between
procurement and delivery of milk affected more or less the quality of milk
adversely. 20.0 percent of the consumers of Milma milk were of the opinion
that it surely affected the quality of milk adversely. But 33.3 percent of the
consumers of Milma milk and 26.7 percent of the non users were of the
opinion that it did not affect the quality of milk adversely (Table 5.63).
Table 5.63: Time Interval between Procurement and Delivery of Milk
Quality of Other Firms Milk and Milk Products
About 66.7 percent of the consumers of Milma milk and 53.3 percent
of the non users were of the opinion that the other agencies milk and milk
products were more or less unhygienic. 8.3 percent of the consumers of
Milma milk and 16.7percent of the non users were of the opinion that other
firms milk and milk products were not unhygienic. But 25.0 percent of the
consumers of Milma milk and 30 percent of the non users were of the opinion
Consumers Non Users
Nos. Percentage Nos. Percentage
Low 24 20.0 0 0.0
Average 56 46.7 22 73.3
High 40 33.3 8 26.7
Total 120 100.0 30 100.0
300
Page 67
that the other firms milk and milk products were surely unhygienic (Table
5.64).
Table 5.64: Quality of Other Firms Milk and Milk Products
SUMMARY
In this chapter, residential area, qualification, employment, annual
income, numbers of members in the family etc., of consumers of Milma milk
and milk products and non users of Milma milk were considered. In order to
cover the first part of the third secondary objective, the customer service level
of MRCMPU to maximise the perceived value of the customer was evaluated
next. For this, awareness, availability, purchase, quality, price and packing of
Milma milk and milk products were considered. To evaluate customer
satisfaction, consumer satisfaction score was ascertained next. Finally
purchase of milk and milk products by the non users of Milma milk, their
opinion about price and quality of Milma milk and milk products and the
general matters affecting the quality of milk and milk products were taken
into account. The next chapter discusses various models to enhance the
efficiency of MRCMPU and SWOT Analysis of MRCMPU.
Consumers Non Users
Nos. Percentage Nos. Percentage
Low 10 8.3 5 16.7
Average 80 66.7 16 53.3
High 30 25.0 9 30.0
Total 120 100.0 30 100.0
301