Page 1
VAMVPPHENOMICSCIENCEOVERVIEW&EXAMPLES
October19,2017
MichaelGaziano,MDMPHChrisO'Donnell,MDKellyCho,PhD,MPH
DavidGagnon,MD,MPH,PhDKatherineLiao,MD
JackieHonerlaw,RN,MPHTianxiCai,ScD
Page 2
MillionVeteranProgram(MVP)• EnrolluptoonemillionusersoftheVHA
intoanobservationalmega-cohort
o Collecthealthandlifestyleinformation
o Bloodcollectionforstorageinbiorepository
o Accesstoelectronicmedicalrecord
o Abilitytorecontactparticipants
MillionVeteranProgram
Page 3
NewEnglandConsortiumWhiteRiverJunction,VTNorthampton,MABedford,MAManchester,NHTogus,ME
Portland
Seattle
SaltLakeCity
LosAngeles
LomaLinda
LongBeach
SanDiego
PaloAlto
Phoenix
Tucson
Denver:4,202
Albuquerque
Dallas
Temple
SanAntonio
Houston
Shreveport
LittleRock
Memphis
Leavenworth
St.Louis
Minneapolis
Madison Milwau
keeHines
Indianapolis Cincinna
ti
Cleveland
WashingtonDC
Buffalo
Pittsburgh
Philadelphia
Albany
Manhattan
WestHaven:6,513
Richmond Hampt
onDurham
Columbia
Nashville Salisb
ury
CharlestonAtlanta
Birmingham
GainesvilleOrlando
Miami
TampaBay
Pines
Baltimore:2,858
KansasCity:3,390
SanJuan:193
Tuscaloosa:4,003
=ActivelyRecruiting=ClosedtoRecruitment
Boston:5,517
Openatatotalof60sites• Waverollout• Activefacilities
• 55mainsites• 60satellitefacilities
• 5siteslaunchingin2017
NorthportIowa
City
Louisville
MVP Enrollment Sites
Page 4
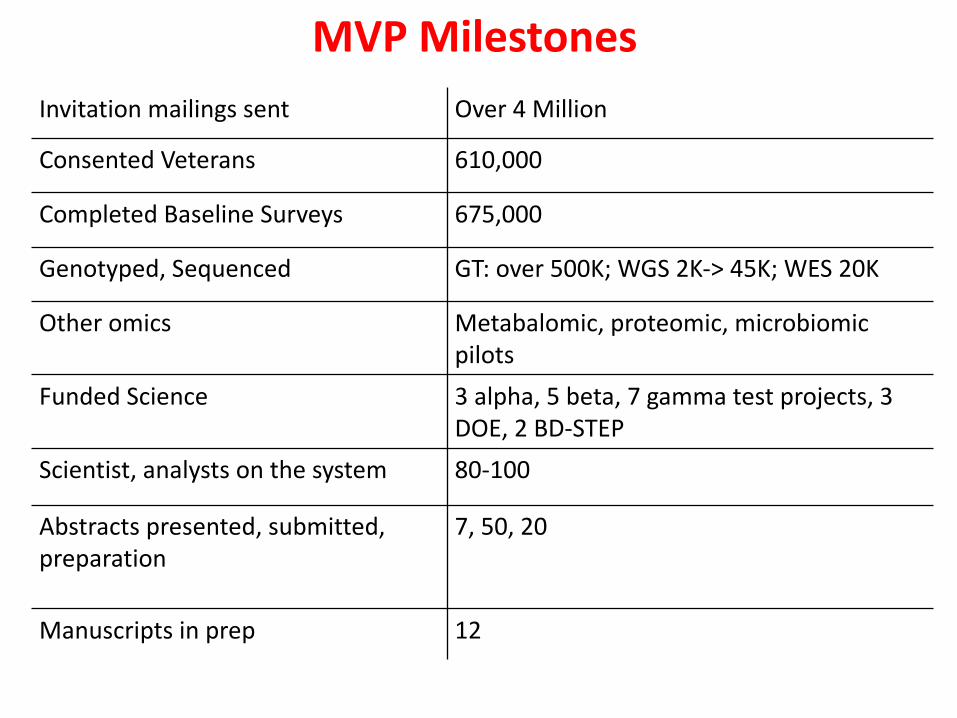
MVPMilestonesInvitationmailingssent Over4Million
ConsentedVeterans 610,000
CompletedBaselineSurveys 675,000
Genotyped,Sequenced GT:over500K;WGS2K->45K;WES20K
Otheromics Metabalomic,proteomic,microbiomicpilots
FundedScience 3alpha,5beta,7gammatestprojects,3DOE,2BD-STEP
Scientist,analystsonthesystem 80-100
Abstractspresented,submitted,preparation
7,50,20
Manuscriptsinprep 12
Page 5
AxiomMVPBiobankArray
11/7/1
75
Page 6
SystemArchitecture
6
AccessAuthorizationbyGovernanceSystem
Vendor
MolecularLab
QueryMart
QueryPortal
AnalysisEnvironm
ent
ConsentManager
Study
Mart
Study
Mart
Study
Mart
DataWarehouse
VA
NonVA
ClinicalData
NDI,CMS
SurveyData
Moleculardata
Researcher
Page 8
VeteransHealthAdministration(VHA)TheLargestIntegratedHealthcareNetworkintheCountry
VHAPointsofCare(1,748)• IntegratedHealthcareNetworks:21• MajorMedicalCenters:152• OutpatientClinics:990• VetCenters:370• Domicillaries:102• CommunityLivingCenters:134
PatientPopulation• Enrollees: 8.8M• ActivePatients:6M• AllTimePatients:22M• FY15OutpatientVisits:84M• FY15InpatientAdmissions:703K
Page 9
REGION1 REGION2 REGION4
VAAnalyticEcosystemCommonData CommonInfrastructure CommonTools CommonSecurity
Enterprise
Vx
Vy
Vn
Vx
Vy
Vn
R1 R1
Vx
Vy
Vn
Vx
Vy
Vn
R2 R2Vx
Vy
Vn
Vx
Vy
Vn
R4 R4
Vx
Vy
Vn
Vx
Vy
Vn
R3 R3
CDWSystemFacts:• Sourcesystem:
• VISTA:130• OtherMajorSystems:7
• Datafacts:• Domainsofinformation: 68• Rows ofdata: 2+Trillion• Columnsofdata:22,000+• Tablesofdata:840+
• ActiveUsers:30,000/Month• Vibrantusercommunity• Activegovernanceprocess• Dataqualityprogram
CDWSampleDataFacts:• UniqueVeterans:22million• Outpatientencounters:2.4billion• Inpatientadmissions:17million• Clinicalorders:4.5billion• Labtests:7.7billion• Pharmacyfills:2.2billion• Radiologyprocedures:202million• Vitalsigns:3.3billion• Textnotes:3.2billion
GovernanceBoard
CDW
GP
BI
ANRD
FR
• Strategy• Policy• Priorities• Requirements
REGION3
CDWAnalyticEnclaves:• GP:GeneralPurpose• BI:BusinessIntelligence• AN:AnalyticsandInformatics• RD:HealthServicesR&D(VINCI)• FR– FieldReportingCDWAnalyticCapabilities:
• Primary/Secondary/DataMartStructures• DataStandardization•MetadataServices• BusinessIntelligenceReporting&DashboardsTools• GeospatialMappingToolsandImages• SAS/GridHighPerformanceComputeGrid• NaturalLanguageProcessingEngines• HadoopCluster
Page 10
DataExamples
ClinicalOrders
4.5BLabResults
7.7BPharmacyFills
2.2BRadiologyProc
202MVitalSigns
3.3B
ClinicalNotes
3.2BHealthFactors
2.2BConsults
315M
Appointments
1.4B
Surgeries
14MOncology
1.3M
Encounters
2.4BAdmissions
17M
Patients:22MImmunizations
71M
Domains:15/68
Page 12
GeneralPhenotypingApproachMoreandmoredataisbecomingavailableforresearch:isitablessingoracurse?• Opportunitiesandchallenges• Arethereappropriatetoolsandresourcestoanalyze,manageand
handlethesedata?• Areweoptimallysynthesizingalltheinformation?• Dowehavealltheinformationandannotation?
• Sometimes, data warehouses resemble landfills more than libraries.
Page 13
Cores MainObjectivesCORE1:Phenomics CoreGroup(PCG)
o TosecuredataacquisitionandcreatePhenomics DataUniverseforMVPscienceo TocoordinateandfacilitatephenotypingresourcesinsupportofMVPsub-studieso Tofacilitatephenotyping needsofDiseaseDomainWorkingGroupso TodevelopandmaintaintheMVPPhenotypeReferenceLibrary
CORE2:DataAnalytics&Management
o Toclean,curateandvalidatetheSurveydataforMVPresearchuseo TomaintainMVPcoredemographicsdatabaseforanalyticsandreportingo TotestandpilotSurveydataelementsasusecasesinphenotypevalidationo TomanageandorganizeMVPphenomics data
CORE3:AppliedBioinformaticsinClinicalResearch
o TodevelopmethodsandapproachestoadvanceEHRdataresearchinMVPo Todemonstratetheapplicationofmethodstorealclinicalquestionso Toinnovateandapplymethodstosolvebigdataphenotyping challenges
13
MVPPHENOMICS– CORETEAMS
Page 14
14
MVPPHENOMICS– CORETablesTable DescriptionMVPRoster ListofMVPenrollees– usedtocreateallotherMVPCoreTablesMVPBaselineSurvey* MVPBaselineSurveyVariablesMVPLifestyleSurvey* MVPLifestyleSurveyVariablesMVPCoreDemographics*
StandardizeddemographicsdatausingCDW,OMOPandMVPBaselineSurveyData
MVPCoreVitals* Standardizedvitalsigns(height,weight)atthetimeofMVPBaselineSurveycompletion(usesbothCDWandMVPBaselineSurveydata)
MVPCoreLifestyle* Standardizedlifestylefactors(smokingstatus,alcoholuse,exercise,nutritionscores)atthetimeofMVPLifestyleSurveycompletion
DiagnosisTable AllICD-9/ICD-10codesfrominpatientandoutpatientencountersLabTable Normalizedlaboratorytablecontainingallavailableadjudicated
laboratorytestsMedicationTable NormalizedmedicationtablecontainingrequestedVAdrugclassesVitalsTable Height,weight,bloodpressure,painscore,pulseHealthFactors HealthfactorsrelatedtosmokingandalcoholuseCPTProcedureTable AllCPTprocedurecodesICD-9ProcedureTable AllICD-9procedurecodesAUDIT-C Responsestoalcoholscreeningsurvey
Page 15
LaboratoryAdjudication – Process
AdjudicationProtocol Rationale
1.Analystcompilesaninitialspreadsheetofpossible“serumalbumin”tests
A textsearchcreatesaninitiallistofpossibleserumalbumintests.
2.Clinicianperformsinitial review Clinicianreviewsthename,specimentype,anddescriptivestatisticsincludingtotalcountoftestsperformedandaveragevaluetodetermineifthisisindeedaserumalbumintest.
3.AnalystaddsrelevantLOINCcodesforcliniciantofurtherreview
Thetextsearch maynothavecapturedallpossibleserumalbumintests,sotestswithrelevantLOINCcodesareadded.(Note:LOINCcodesareconsideredastandardbutwefoundthattheydonotuniquelyidentifylabsintheVA)
4.Secondclinicianperforms review Secondclinicianreviews,thenbothreviewers meettoresolvediscrepancies.
5.Analyst createsfinal curatedlabdataset Thefinaltableofacceptedserumalbumintests isstoredinSQL.
Purpose:Validatelaboratorytesttypeandresults.Example:textsearchfor“albumin”yields4141tests,withonly644thatactuallycorrespondtoserumalbumin– withothersbeing,forexample,urinealbumin,orserumpre-albumin.Furthercurationisneededtoidentifyserumalbumin.
15MVPPhenotypingExamplesVersion6.15.17
Page 16
Laboratorytestname Numberoftestsadjudicated Numberoftestsaccepted
Hemoglobin A1C 527 365Serum albumin 4141 644BloodGlucose 4578 905HDLC 770 377Hemoglobin 2638 331LDLC 1230 602SerumPotassium 2198 720SerumCreatinine 5212 705SerumSodium 2608 757Total Cholesterol 2137 405Triglycerides 1528 390
AcceptLabChemTestSID LabChem TestName Specimen VISN Sta3nUnits n min p1 p5 p10 p25 p50 p75 p90 p99 max
Yes 800000948 ALBUMIN(SEATTLE) Serum 20 648 G/DL 8985 -0.22 3.1 3.7 3.9 4.2 4.4 4.6 4.8 5.2 6
No 800001031 albumin(ep),csfCerebralspinalfluid 20 648 % 22 51 51 54 55 57 61 66 69 71 71
No 800001092 MICROALBUMIN Urine 20 648 MG/DL 70167 0 0.3 0.43 0.7 1.28 2.8 8.28 30.4 228.8 21321
Yes 800001119 ALBUMIN Plasma 20 648 g/dL 712338 0.1 1.9 2.6 3.1 3.8 4.2 4.4 4.6 5 67
Yes 800001119 ALBUMIN Serum 20 648 g/dL 21999 0.2 2.1 2.7 3.2 3.9 4.3 4.5 4.7 5.1 7.6
ExamplesofLaboratoryAdjudicationEffort
SerumAlbuminAdjudication
16
Page 17
MedicationAdjudication
AdjudicationProtocol Rationale
1.Analystcompilesaninitialspreadsheetofpossibleanti-lipemics
Selecting allmedicationsinVAdrugclass“CV350”createsaninitiallistofanti-lipemics.Theanalystparsesouttheroute,dose,unitsanddrugnamesfromasingledfieldintheEMR.
2.Clinicianperformsinitialreview Clinicianreviewsthelistofmedicationsandconfirmsifthepre-populatedcolumnscontainingclass,genericingredientname,dose,unitsandroutearecorrect.
3.Analystreviews Theanalystreviewsthespreadsheettoensurethatstudydrugorplacebodrugshavenotbeenincluded.Mappingstootherstandardnamingconventions(ex:RxNorm)areincorporatedintothetable.
4.Analyst createsfinal curatedlabdataset Thefinaltableofanti-lipemics isstoredinSQL.
Purpose:CuratingVApharmacydatarequireslessclinicianinputthanadjudicatinglaboratorytests,butthereisstillconsiderableworkrequiredtocreateausablemedicationdatasetacrossdatasources.
17
Page 18
MedicationAdjudicationColumn Description ExampleVariablefromCDWLocalDrug SID DrugIDfromCDW 800170761NationalDrugSID DrugIDfromCDW 800423770LocalDrugNameWithDose
DrugnameanddosefromCDW ATORVASTATINCALCIUM40MGTAB
NationalDrugNameWithDose
DrugnameanddosefromCDW ATORVASTATINCALCIUM40MGTAB
VariableCreatedbyAnalystGeneric_Name1 Drugnameatingredientlevel– extractedfrom
LocalDrugNameWithDoseAtorvastatin
Generic_Name2 Drugnameatingredientlevel,populatedforcombinationdrugs– extractedfromLocalDrugNameWithDose
Generic_Type Sub-class– determinedwhenidentifyinggoalofreview.Intheexample,theanalystisinstructedtopopulatethesubclassstatinifgenericnameendsin-statin.
Statin
Class_Name Classnamepre-populatedbyanalyst Anti-lipemicagents
Dose Medicationdose– extractedfromLocalDrugNameWithDose
40
Units Medicationunits– extractedfromLocalDrugNameWithDose
mg
Dose_Form Routeofmedication– obtainedfromtheFDANationalDrugFiledrugtableandsupplementedwithdoseextractedfromlocaldrugnamewithdosewheremissing
Tab
Class Count Class NameCV050 1790 DIGITALISGLYCOSIDESCV100 9832 BETABLOCKERS/RELATEDCV200 9962 CALCIUMCHANNELBLOCKERSCV250 6668 ANTIANGINALSCV300 8483 ANTIARRHYTHMICSCV350 8854 ANTILIPEMICAGENTS
CV400 6057ANTIHYPERTENSIVECOMBINATIONS
CV500 954 PERIPHERALVASODILATORSCV701 2864 THIAZIDES/RELATEDDIURETICSCV702 3468 LOOPDIURETICS
CV703 918CARBONICANHYDRASEINHIBITORDIURETICS
CV704 2431
POTASSIUMSPARING/COMBINATIONSDIURETICS
CV709 456 DIURETICS,OTHERCV800 5499 ACEINHIBITORSCV805 3109 ANGIOTENSINIIINHIBITORCV806 240 DIRECTRENININHIBITOR
CV900 2363CARDIOVASCULARAGENTS,OTHER
18
Page 19
VISN1Outpatient“VirtualBaselineDataAcquisition”andIntervalfromAnchoringDate
19
Page 20
Purpose• Todevelopaprobabilisticalgorithmtodeterminesmokingstatusof
never,former,andcurrentusingCDWstructureddataGoldstandardsmokers• DefinedusingMVPself-reportedsmokingstatusfromthebaselineandlifestylesurvey
– 93,888MVPyear1genotypedparticipants• 26%neversmokers;56%formersmokers;18%currentsmokers
Smoking-related CDW Data(inputs)• 1,568smokinghealthfactorsreducedto11categories:
• Smokingcessationmedications– BupropionHBR,Nicotine,ClonidineHCL,BupropionHCL,Nortriptyline,Varenicline
• ICD-9/ICD-10codesfortobaccodependenceortobaccouse• VHAclinicstopcodesforsmokingcessationclinic
SmokingPhenotype
20
Page 21
Modeling• WeconductedaLeastAbsoluteShrinkageSelectionOperator(LASSO)regressionusing
theMVPsurveyresponseasthegoldstandard• Theregressioncoefficientswereusedtogeneratepredictedprobabilitiesofbeinga
never,former,orcurrentsmoker– Thecategorywiththehighestpredictedprobabilitywasdeterminedtobeperson’s
smokingstatus
Results
SmokingPhenotype
AlgorithmMVPGoldStandard Never Former Current
Never 19,265 4,450 427 24,142
Former 6,442 41,284 4,682 52,408
Current 322 2,163 14,853 17,338
Total 26,029 47,897 19,962 93,888
Never• Sensitivity:74%• Specificity:93%• PPV:80%
Former• Sensitivity:86%• Specificity:76%• PPV: 79%
Current• Sensitivity:74%• Specificity:97%• PPV: 86%
21MVPPhenotypingExamplesVersion6.15.17
Page 22
StrokePhenotype- AlgorithmDevelopment
Excluded:n=34“PossibleStroke”n=3“HemorrhagicStroke”n=3“TIA”
PossibleStrokeRelevantphysiciannotespresent,butmissingprimaryimagingdataandclinicalexamatdiagnosis
PurposeTodevelopandvalidateareliableprotocoltoidentifycasesofacuteischemicstroke(AIS)fromalargenationaldatabase.
Chart Review to determine acute ischemic stroke
(n=260)
Partition 50% of data into training set
(n=130)
Partition 50% of data into validation set
(n=130)
Train neural net
Train random forest
Pick best algorithm (repeated
10-fold CV)
Predict P(stroke),
P(no stroke)(n=130)
Assess accuracy for different probability
thresholds
22MVPPhenotypingExamplesVersion6.15.17
Page 23
StrokePhenotype- Results
Longitudinalcohortalgorithm:patienthasstrokeifpredictedprobability>0.5
Case-controlalgorithm:patienthasstrokeifpredictedprobability≥0.85patientisacontrolifpredictedprobability≤0.1allotherpatientsexcluded
Case-controlalgorithmperformsbestontwofronts:highclassificationmetrics(sensitivity,specificity,PPV)ANDexcludesmostpatientslabeledas“possibleAIS”data(seeboxplotonnextpage)
23
Page 24
StrokePhenotypeCase-controlalgorithmexcludesmostPossible’s
24
Page 25
25
Post-traumaticStressDisorder(PTSD)PhenotypePurpose:TodevelopandvalidateEMR-basedalgorithmforidentifyingPTSDinasampleofVeteransusingaprobabilisticmodelingapproach
ThisvalidationstudywasundertakenasapartofVACooperativeStudy#575B(“GenomicsofPosttraumaticStressDisorderinVeterans),”agenomewide associationstudyofPTSDnestedwithintheMillionVeteranProgram.
Page 26
PerformanceofPTSDAlgorithmSensitivity*(95%CI)
Specificity*(95%CI)
PPV*(95%CI)
NPV*(95%CI)
Tier1Algorithm(VHA)
DropPossiblePTSD
1(0.978-1)
0.995(0.986-1)
0.961(0.896-1)
1(0.997-1)
GroupPossible+Case
0.877(0.785-0.960)
0.971(0.955-0.984)
0.792(0.690-0.881)
0.984(0.971-0.995)
GroupPossible+ Control
0.679(0.586-0.765)
0.979(0.963-0.992)
0.908(0.831-0.961)
0.912(0.883-0.938)
Tier2Algorithm(VHA)
DropPossiblePTSD
0.995(0.987-1)
0.995(0.987-1)
0.995(0.987-1)
0.995(0.987-1)
GroupPossible+Case
0.994(0.984-1)
0.655(0.566-0.746)
0.907(0.878-0.936)
0.969(0.920-1)
GroupPossible+ Control
0.951(0.928-0.969)
0.964(0.898-1)
0.995(0.986-0.995)
0.712(0.612-0.803)
*Statisticsareproportionallyweightedbasedonchartreviewselection
26
Page 27
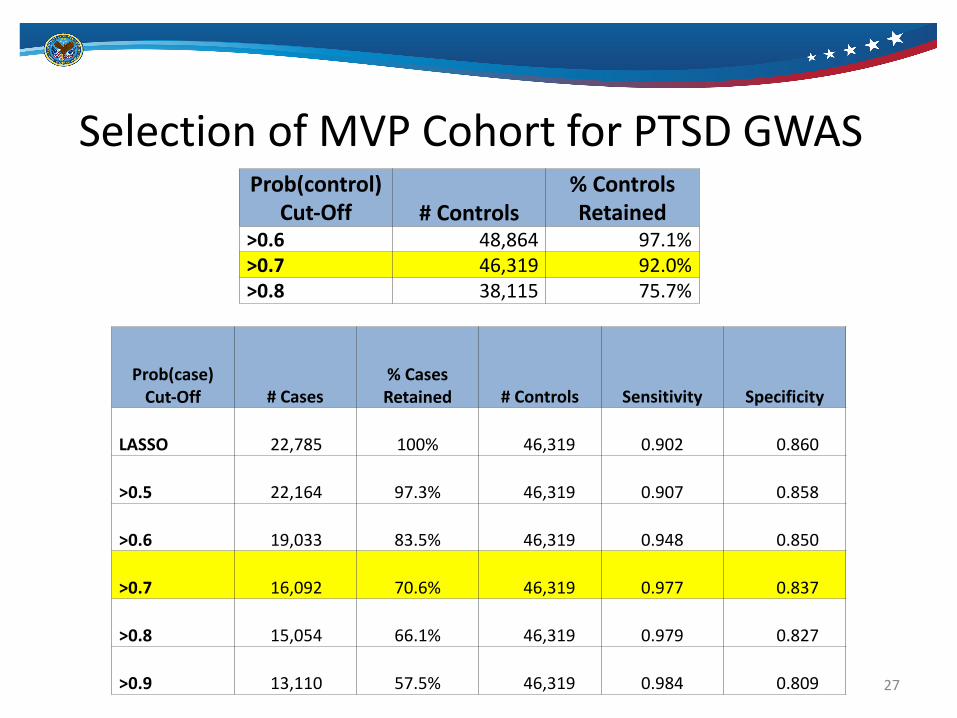
SelectionofMVPCohortforPTSDGWASProb(control)
Cut-Off #Controls%ControlsRetained
>0.6 48,864 97.1%>0.7 46,319 92.0%>0.8 38,115 75.7%
Prob(case)Cut-Off #Cases
%CasesRetained #Controls Sensitivity Specificity
LASSO 22,785 100% 46,319 0.902 0.860
>0.5 22,164 97.3% 46,319 0.907 0.858
>0.6 19,033 83.5% 46,319 0.948 0.850
>0.7 16,092 70.6% 46,319 0.977 0.837
>0.8 15,054 66.1% 46,319 0.979 0.827
>0.9 13,110 57.5% 46,319 0.984 0.809 27
Page 28
Overview:AlgorithmDevelopmentandValidationProcess
1) SelectInitialT1Algorithm(rules-basedalgorithm)– Basedonliteraturereview
2) ChartValidationandEvaluationofT1A3) BuildT2AlgorithmModel(probabilisticapproach)
– Literaturereviewinformedinitialvariableselection– Limitedbyavailabledata
4) Iterativeprocessundertakentofindbestmodelforthedata
5) ChartValidationandEvaluationofT2A6) DetermineFinalAlgorithmforGWAS(T3A)
28
Page 29
NLPasakeycomponent:Featureextraction
NLP
Page 30
AutomatedFeatureExtractionforPhenotyping (AFEP)
Page 31
HighThroughputPhenotyping Pipeline
GeneralFramework
Cai &Liao
Page 32
OurVisionforPhenotypinginMVP:ANewAproach
Manual
Semi-automated
Automated
Semi-automatedphenotypingcombinesfeaturesofmanualand
automatedphenotypedevelopment