VAB REPORT: ”ANY GIVEN MINUTE”: SOLVING THE MULTI-SCREEN MEASUREMENT PARADOX VIDEO TIME BY DEMO YOUNG ADULTS ETHNICITY ETHNICITY BY DEMO COMPUTER TO PHONE MIGRATION APP/WEB REACH APP/WEB USAGE MULTIMEDIA PENETRATION MULTIMEDIA USAGE TIME SUMMARY OVERVIEW YAHOO! / NFL EXAMPLE COMPARABLE METRICS BY PLATFORM / DEVICE TV BRANDS VS. AD-TECH AD-TECH VS. TV CONTENT DISPELLING MYTHS
Transcript
VAB REPORT: ”ANY GIVEN MINUTE”:
SOLVING THE MULTI-SCREEN MEASUREMENT PARADOX
VIDEO TIME BY DEMO YOUNG ADULTS ETHNICITY ETHNICITY BY DEMO COMPUTER TO PHONE MIGRATION APP/WEB REACH APP/WEB USAGE MULTIMEDIA PENETRATION MULTIMEDIA USAGE TIME SUMMARYOVERVIEW
YAHOO! / NFL EXAMPLE COM
PARABLE METRICS BY PLATFORM
/ DEVICE TV BRANDS VS. AD-TECH AD-TECH VS. TV CONTENT DISPELLING MYTHS
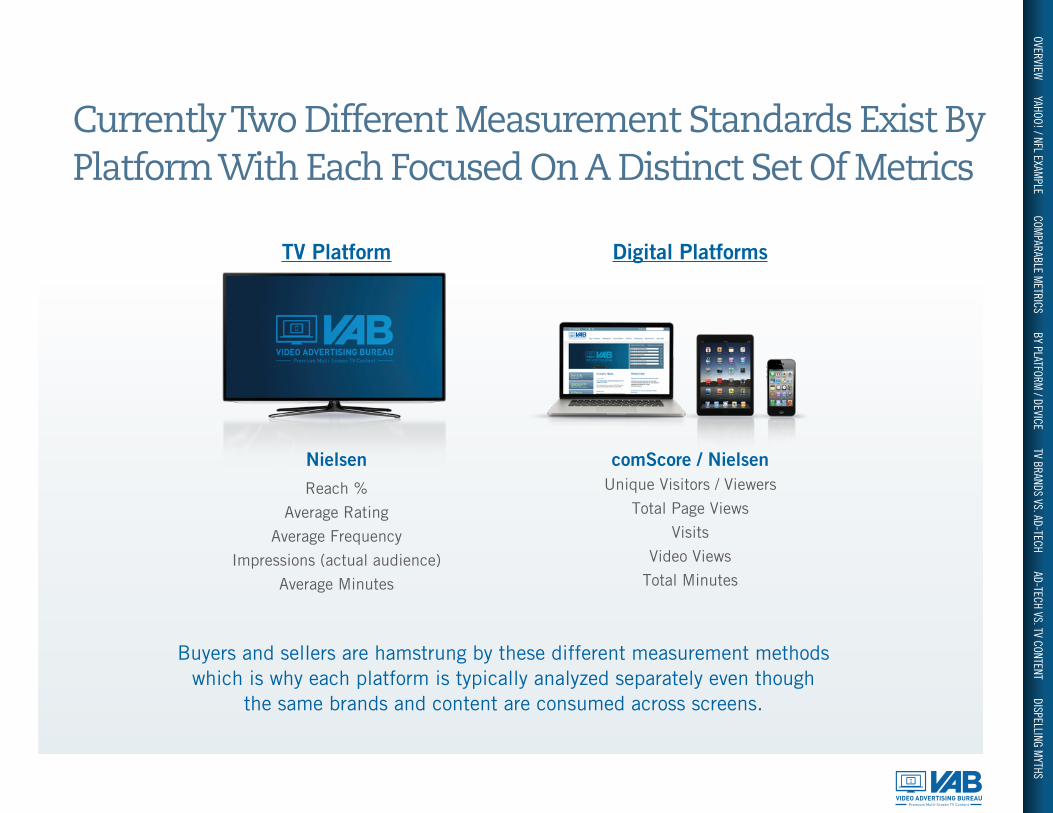
Currently Two Different Measurement Standards Exist By Platform With Each Focused On A Distinct Set Of Metrics
TV Platform Digital Platforms
NielsenReach %
Average Rating
Average Frequency
Impressions (actual audience)
Average Minutes
comScore / NielsenUnique Visitors / Viewers
Total Page Views
Visits
Video Views
Total Minutes
Buyers and sellers are hamstrung by these different measurement methods which is why each platform is typically analyzed separately even though
the same brands and content are consumed across screens.
OVERVIEW YAHOO! / NFL EXAM
PLE COMPARABLE M
ETRICS BY PLATFORM / DEVICE TV BRANDS VS. AD-TECH AD-TECH VS. TV CONTENT DISPELLING M
YTHS
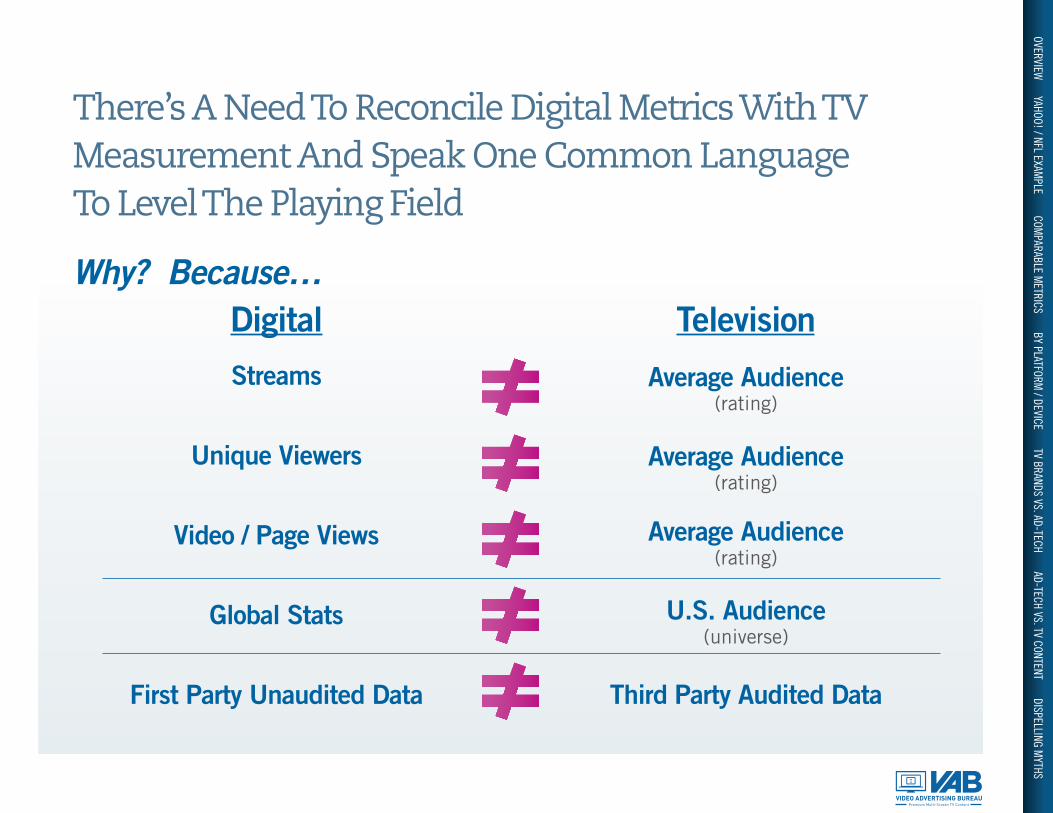
There’s A Need To Reconcile Digital Metrics With TV Measurement And Speak One Common Language To Level The Playing Field
Why? Because…Digital
Streams
Unique Viewers
Video / Page Views
Global Stats
First Party Unaudited Data
Television
Average Audience(rating)
Average Audience(rating)
Average Audience(rating)
U.S. Audience(universe)
Third Party Audited Data
OVERVIEW YAHOO! / NFL EXAM
PLE COMPARABLE M
ETRICS BY PLATFORM / DEVICE TV BRANDS VS. AD-TECH AD-TECH VS. TV CONTENT DISPELLING M
YTHS
There’s Also A Need To Differentiate Between So-Called “Big” Numbers & Actual “Meaningful” Numbers Across Screens
Digital measurement, and making sense of what provides truly needle-moving scale, goes beyond just streams, video starts or page views.
There’s an array of different metrics & terminology that digital properties use to tout their “bigness”:
But just because a number looks big in a vacuum is it actually meaningful, especially when compared to a TV audience?
*Important to note, Global statistics are also typically used when digital metrics are quoted publicly
Views
Pins
Calls
Likes
Swipes
Rides
Posts
Streams
Tweets
Uploads
Snaps
Downloads
OVERVIEW YAHOO! / NFL EXAM
PLE COMPARABLE M
ETRICS BY PLATFORM / DEVICE TV BRANDS VS. AD-TECH AD-TECH VS. TV CONTENT DISPELLING M
YTHS
Case In Point, Yahoo’s Streaming Of An NFL Regular Season Game This Past Season
On October 25th, 2015 at 9:30a ET, Yahoo! made headline news by being the �rst website to ever live stream an NFL game across the world for free when the Buffalo Bills played the Jacksonville Jaguars
OVERVIEW YAHOO! / NFL EXAM
PLE COMPARABLE M
ETRICS BY PLATFORM / DEVICE TV BRANDS VS. AD-TECH AD-TECH VS. TV CONTENT DISPELLING M
YTHS
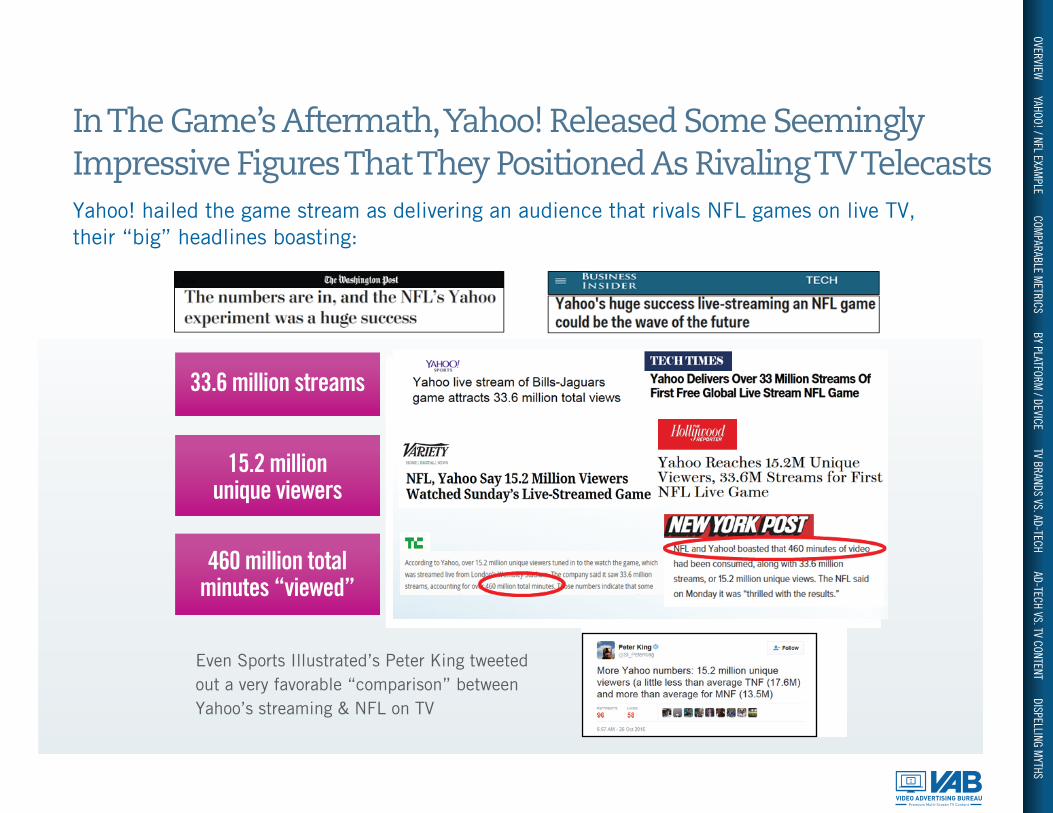
In The Game’s Aftermath, Yahoo! Released Some Seemingly Impressive Figures That They Positioned As Rivaling TV TelecastsYahoo! hailed the game stream as delivering an audience that rivals NFL games on live TV, their “big” headlines boasting:
Even Sports Illustrated’s Peter King tweeted out a very favorable “comparison” between Yahoo’s streaming & NFL on TV
33.6 million streams
15.2 million unique viewers
460 million total minutes “viewed”
OVERVIEW YAHOO! / NFL EXAM
PLE COMPARABLE M
ETRICS BY PLATFORM / DEVICE TV BRANDS VS. AD-TECH AD-TECH VS. TV CONTENT DISPELLING M
YTHS
But A Deeper Dive Into The Numbers Told A Vastly Different Story; A Much Less Impressive One For Yahoo! Many in the press though called Yahoo! for a “false start” quickly after they published their streaming �gures:
Why? Because when looking at key measurements within respective media:
Digital
Streams
Unique Viewers
Global Stats
Television
Average Audience (rating)
Average Audience (rating)
U.S. Audience (rating)
OVERVIEW YAHOO! / NFL EXAM
PLE COMPARABLE M
ETRICS BY PLATFORM / DEVICE TV BRANDS VS. AD-TECH AD-TECH VS. TV CONTENT DISPELLING M
YTHS
This Is The Multi-Screen Measurement Paradox:Digital Metrics Do Not Equate To Television’s Average RatingsLooking at the Yahoo! streaming �gures through a similar lens as the standard TV measurement, average audience, the comparable results are much different:
NFL On Yahoo! Streaming
• Based on the “total minutes viewed” (# of streams is rather irrelevant) and length of the game (195 mins), the average streamer only watched for around 30 minutes which meant there was an average viewership per minute of 2.36 million • Since approximately 33% were outside of the country, this meant there was an: average U.S. audience of approximately 1.64 million
NFL On TV
• In comparison, NFL telecasts on TV (afternoon & night games) have an: average audience of 18.2 million viewers
The Real Truth
• While 460 million total minutes viewed may seem like a “big” number, the Yahoo! streamed game marked the lowest average audience ever for a nationally available NFL game (in fact, average NFL TV telecasts were 11x higher than the Yahoo! stream)
OVERVIEW YAHOO! / NFL EXAM
PLE COMPARABLE M
ETRICS BY PLATFORM / DEVICE TV BRANDS VS. AD-TECH AD-TECH VS. TV CONTENT DISPELLING M
YTHS
“Leveling The Playing Field” With Common Metrics That Are Truly Comparable Across ScreensTo create a singular language for comparison purposes, metrics commonly associated with only one type of content – such as video starts, page views or streams – need be set aside in favor of measurements that are equally applicable across media.
So what are these equally applicable measurements?
• Unique Audience: the number of adults who view a given platform or piece of content during a speci�ed time period (daily, weekly, monthly) • We’d stress audience over reach % since a percentage can vary based on the universe
• Average Time Spent Per Visitor / Viewer: the measure of time spent engaging with each platform or piece of content by person during a speci�ed time period
• Total Minutes Spent: the measure of total time spent engaging with each platform or piece of content by everyone who has engaged with it during a speci�ed time period
• Average Audience: the measure of adults engaging with each platform or piece of content in an average minute during a speci�ed time period
OVERVIEW YAHOO! / NFL EXAM
PLE COMPARABLE M
ETRICS BY PLATFORM / DEVICE TV BRANDS VS. AD-TECH AD-TECH VS. TV CONTENT DISPELLING M
YTHS
“Average Audience” Is A Dynamic Comparable Metric To Utilize When Evaluating Media Across ScreensAverage Audience is a formula that takes into consideration three critical measurements that are applicable across media – unique audience, average minutes viewed and total minutes.
Here’s the formula:
First Step:
In our analyses, “average audience” is factored based on a 24-hour day for digital properties since they’re “always on” and the average during the totality of time that a network or program is on the air.
*“Average Audience” is also a key metric used in the “How Long” section of Nielsen’s Quarterly Comparable Metrics Report
Not only does this metric take into account three interrelated measurements but it also provides a good snapshot of true scale on a platform or piece of content at any given time • “Average audience” is also a very relevant metric from a time perspective since a large majority of video ads run between :15 - :60 long
Unique Audience X Average Minutes Viewed/Per Visitor = Total Minutes Viewed
Second Step:
Total Minutes Viewed / Total Minutes In Measured Time Period = Average Audience(ex. 44,640 in a 31-day month)
OVERVIEW YAHOO! / NFL EXAM
PLE COMPARABLE M
ETRICS BY PLATFORM / DEVICE TV BRANDS VS. AD-TECH AD-TECH VS. TV CONTENT DISPELLING M
YTHS
OVERVIEW YAHOO! / NFL EXAM
PLE COMPARABLE M
ETRICS BY PLATFORM / DEVICE TV BRANDS VS. AD-TECH AD-TECH VS. TV CONTENT DISPELLING M
YTHS
ON ANY DEVICE: Where Is The Audience In Any Given Minute?
Average A18+ Audience Per Minute45,431,944
5,085,910
8,918,616
1,864,998870,881
12,738,259
426,672
3,779,035 3,700,945
265,445 1,086,876
TV TV-ConnectedDevices
PC
PC
PC Video PC SocialNetwork
Smartphone(App+Web)
SmartphoneVideo
Smartphone Social Network
Tablet (App+Web)
TabletVideo
TabletSocial
Network
Smartphone Tablet“How Long”
A18+
Source: Nielsen Comparable Metrics Report Q3 2015; Data based on average week between July 17th – August 30th, 2015. A18+ UE = 240,160,000.Video & Social Network is a subset of each device’s (App+Web)
OVERVIEW YAHOO! / NFL EXAM
PLE COMPARABLE M
ETRICS BY PLATFORM / DEVICE TV BRANDS VS. AD-TECH AD-TECH VS. TV CONTENT DISPELLING M
YTHS
TV’s Average Audience Among Millennials Far Surpasses Any Other Device
Average A18-34 Audience Per Minute7,928,600
2,676,210 2,624,278
709,947
213,551
5,117,978
238,916
1,671,5691,391,725
160,388 386,970
TV TV-ConnectedDevices
PC PC Video PC SocialNetwork
Smartphone(App+Web)
SmartphoneVideo
Smartphone Social Network
Tablet (App+Web)
TabletVideo
TabletSocial
Network
“How Long”A18-34
Source: Nielsen Comparable Metrics Report Q3 2015; Data based on average week between July 17th – August 30th, 2015. A18-34 UE = 72,210,000.Video & Social Network is a subset of each device’s (App+Web)
PC Smartphone Tablet
OVERVIEW YAHOO! / NFL EXAM
PLE COMPARABLE M
ETRICS BY PLATFORM / DEVICE TV BRANDS VS. AD-TECH AD-TECH VS. TV CONTENT DISPELLING M
YTHS
ALL EYES ON VIDEO:Where Are People Watching Video During An Average Minute?
% of A18+ Video Consumption By DeviceBased on Average Audience Per Minute
“How Long” A18+
Source: Nielsen Comparable Metrics Report Q3 2015; Data based on average week between July 17th – August 30th, 2015. A18+ UE = 240,160,000
Smartphone Video1%
Tablet Video0%
PC Video4%
TV95%
OVERVIEW YAHOO! / NFL EXAM
PLE COMPARABLE M
ETRICS BY PLATFORM / DEVICE TV BRANDS VS. AD-TECH AD-TECH VS. TV CONTENT DISPELLING M
YTHS
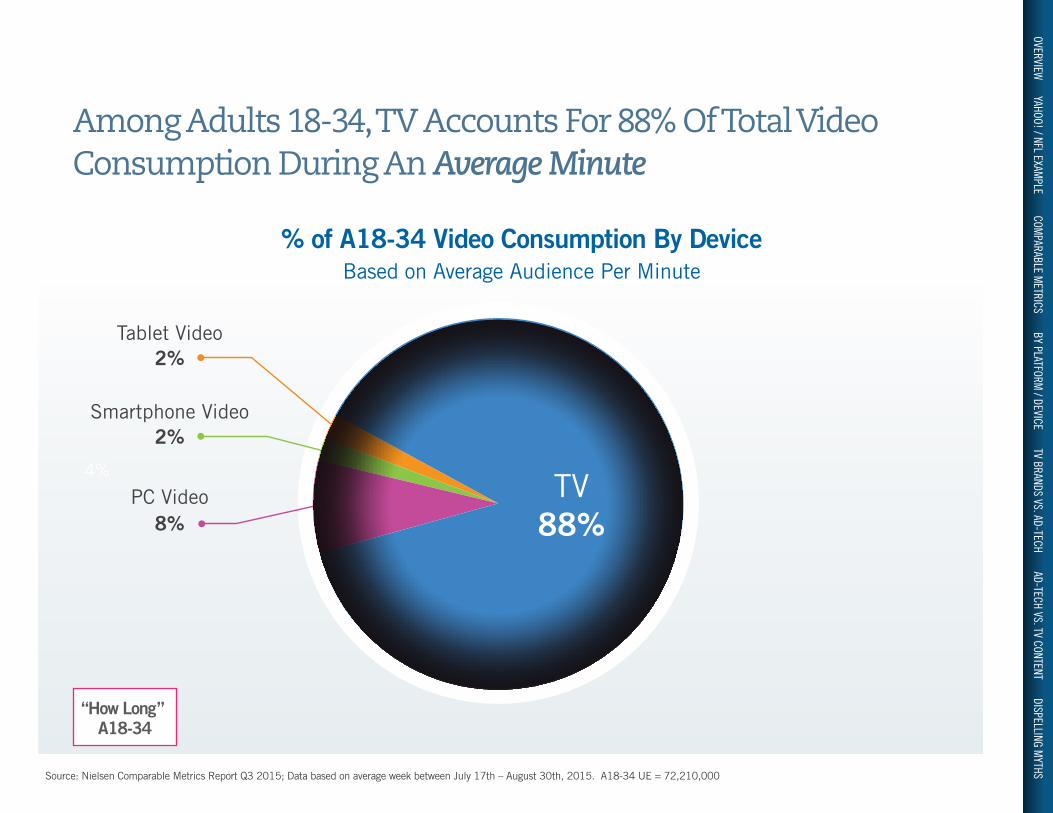
Among Adults 18-34, TV Accounts For 88% Of Total Video Consumption During An Average Minute
% of A18-34 Video Consumption By DeviceBased on Average Audience Per Minute
“How Long” A18-34
Source: Nielsen Comparable Metrics Report Q3 2015; Data based on average week between July 17th – August 30th, 2015. A18-34 UE = 72,210,000
Smartphone Video2%
Tablet Video2%
PC Video8%
4%TV
88%
OVERVIEW YAHOO! / NFL EXAM
PLE COMPARABLE M
ETRICS BY PLATFORM / DEVICE TV BRANDS VS. AD-TECH AD-TECH VS. TV CONTENT DISPELLING M
YTHS
Note: “average audience” for digital properties re�ect any user activity done on their website, not just video consumption, as measured by comScore
OVERVIEW YAHOO! / NFL EXAM
PLE COMPARABLE M
ETRICS BY PLATFORM / DEVICE TV BRANDS VS. AD-TECH AD-TECH VS. TV CONTENT DISPELLING M
YTHS
Multi-Screen TV Brands Deliver A Much Higher Average Audience During Any Given Minute Than 20 Popular Websites Combined
A18+ Average Audience (000) Comparison Ad-Supported TV Brands Vs. Popular Websites
Digital Properties
Source: comScore MediaMetrix Key Measures (multiplatform), December 2015; A18+. Nielsen R&F Program Report, Live + SD, Total Day. December 1-31, 2015; A18+. “Average Audience” is based on the average minute, which is factored across the full month for websites and TV. TV Brands include linear TV and TV-related websites. Digital website measurement includes all visitor activity, not just video consumption.
Facebook 4,409.4 (10%)
Pandora 2,139.6 (5%)
YouTube 2,103.7 (5%)
TV Brands30,943.3 (71%)
Multiscreen (TV + online)
Google.com 930.8 (2%)
Yahoo.com 668.1 (2%)
Instagram 457.4 (1%)
Spotify 444.5 (1%)
Amazon 283.1 (1%)
Snapchat 244.0 (1%)
Pinterest 178.9 (0%)
Twitter 167.3 (0%)
MSN.com 144.4 (0%)
AOL.com 139.9 (0%)
Tumblr 100.0 (0%)
Craiglist 94.3 (0%)
eBay 83.9 (0%)
Twitch 83.5 (0%)
WhatsApp 76.8 (0%)
Vevo 55.2 (0%)
LinkedIn 45.2 (0%)
OVERVIEW YAHOO! / NFL EXAM
PLE COMPARABLE M
ETRICS BY PLATFORM / DEVICE TV BRANDS VS. AD-TECH AD-TECH VS. TV CONTENT DISPELLING M
YTHS
Multi-Screen TV Brands’ Average Audience Is Over Seven Times That Of The Largest Website, Facebook
A18+ Average Audience (000) Comparison Ad-Supported TV Brands Vs. Popular Websites
Source: comScore MediaMetrix Key Measures (multiplatform), December 2015; A18+. Nielsen R&F Program Report, Live + SD, Total Day. December 1-31, 2015; A18+. “Average Audience” is based on the average minute, which is factored across the full month for websites and TV. TV Brands include linear TV and TV-related websites. Digital website measurement includes all visitor activity, not just video consumption.
ETRICS BY PLATFORM / DEVICE TV BRANDS VS. AD-TECH AD-TECH VS. TV CONTENT DISPELLING M
YTHS
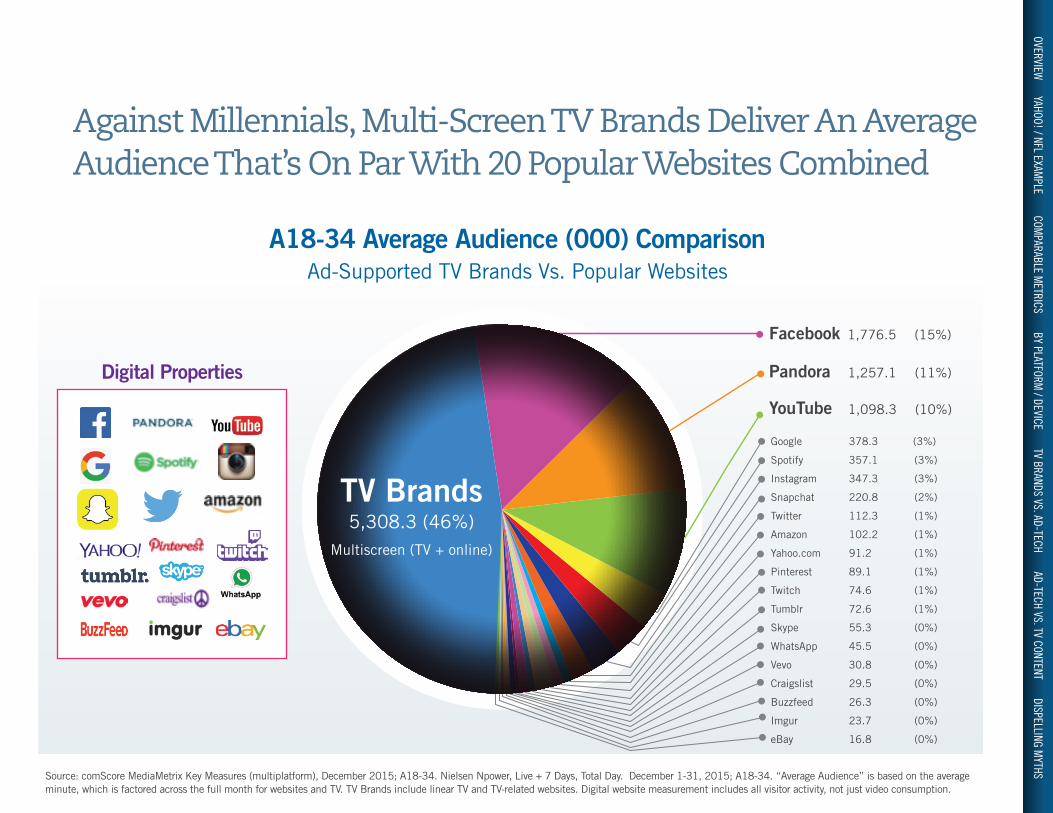
Against Millennials, Multi-Screen TV Brands Deliver An Average Audience That’s On Par With 20 Popular Websites Combined
A18-34 Average Audience (000) Comparison Ad-Supported TV Brands Vs. Popular Websites
Digital Properties
Source: comScore MediaMetrix Key Measures (multiplatform), December 2015; A18-34. Nielsen Npower, Live + 7 Days, Total Day. December 1-31, 2015; A18-34. “Average Audience” is based on the average minute, which is factored across the full month for websites and TV. TV Brands include linear TV and TV-related websites. Digital website measurement includes all visitor activity, not just video consumption.
Facebook 1,776.5 (15%)
Pandora 1,257.1 (11%)
YouTube 1,098.3 (10%)
Google 378.3 (3%)
Spotify 357.1 (3%)
Instagram 347.3 (3%)
Snapchat 220.8 (2%)
Twitter 112.3 (1%)
Amazon 102.2 (1%)
Yahoo.com 91.2 (1%)
Pinterest 89.1 (1%)
Twitch 74.6 (1%)
Tumblr 72.6 (1%)
Skype 55.3 (0%)
WhatsApp 45.5 (0%)
Vevo 30.8 (0%)
Craigslist 29.5 (0%)
Buzzfeed 26.3 (0%)
Imgur 23.7 (0%)
eBay 16.8 (0%)
TV Brands5,308.3 (46%)
Multiscreen (TV + online)
OVERVIEW YAHOO! / NFL EXAM
PLE COMPARABLE M
ETRICS BY PLATFORM / DEVICE TV BRANDS VS. AD-TECH AD-TECH VS. TV CONTENT DISPELLING M
YTHS
THE MILLENNIAL MINUTE:What Platforms Get The Millennial Audience At Any Given Moment?
A18-34 Average Audience (000) Comparison Ad-Supported TV Brands Vs. Popular Websites
Source: comScore MediaMetrix Key Measures (multiplatform), December 2015; A18-34. Nielsen R&F Program Report, Live + SD, Total Day. December 1-31, 2015; A18-34. “Average Audience” is based on the average minute, which is factored across the full month for websites and TV. TV Brands include linear TV and TV-related websites. Digital website measurement includes all visitor activity, not just video consumption.
ETRICS BY PLATFORM / DEVICE TV BRANDS VS. AD-TECH AD-TECH VS. TV CONTENT DISPELLING M
YTHS
OVERVIEW YAHOO! / NFL EXAM
PLE COMPARABLE M
ETRICS BY PLATFORM / DEVICE TV BRANDS VS. AD-TECH AD-TECH VS. TV CONTENT DISPELLING M
YTHS
Facebook 4,409.4 158
Pandora 2,139.6 352
YouTube 2,103.7 354
Google.com 930.8 682
Yahoo.com 668.1 810
Instagram 457.4 1,420
Spotify 444.5 1,517
Amazon 283.1 2,115
Snapchat 244.0 2,331
Pinterest 178.9 2,782
Website RankAvg Audience (000)
Twitter 167.3 2,902
MSN.com 144.4 3,159
AOL.com 139.9 3,216
Tumblr 100.0 3,844
Craiglist 94.3 3,963
eBay 83.9 4,162
Twitch 83.5 4,168
WhatsApp 76.8 4,320
Vevo 55.2 4,872
LinkedIn 45.2 5,172
Website RankAvg Audience (000)
Only One Ad-Tech Website Would Rank Within The Top 200 TV Programs On Average Audience
Where Would Top Websites Rank Among Ad-Supported TV Programs?Based on A18+ Average Audience
Source: comScore MediaMetrix Key Measures (multiplatform), December 2015; A18+. Nielsen Npower, Live + SD, Total Day. December 1-31, 2015; A18+. “Average Audience” is based on the average minute, which is factored across the full month for websites and across program run time for TV. Digital website measurement includes all visitor activity, not just video consumption.
OVERVIEW YAHOO! / NFL EXAM
PLE COMPARABLE M
ETRICS BY PLATFORM / DEVICE TV BRANDS VS. AD-TECH AD-TECH VS. TV CONTENT DISPELLING M
YTHS
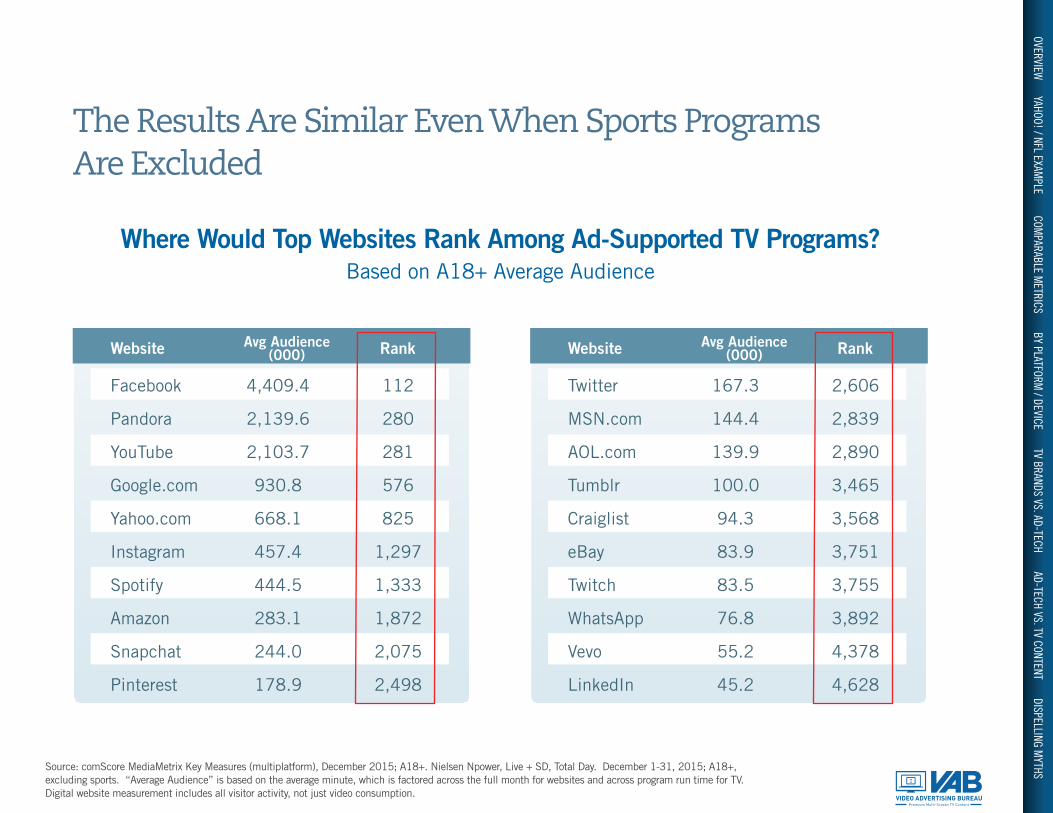
Facebook 4,409.4 112
Pandora 2,139.6 280
YouTube 2,103.7 281
Google.com 930.8 576
Yahoo.com 668.1 825
Instagram 457.4 1,297
Spotify 444.5 1,333
Amazon 283.1 1,872
Snapchat 244.0 2,075
Pinterest 178.9 2,498
Website RankAvg Audience (000)
Twitter 167.3 2,606
MSN.com 144.4 2,839
AOL.com 139.9 2,890
Tumblr 100.0 3,465
Craiglist 94.3 3,568
eBay 83.9 3,751
Twitch 83.5 3,755
WhatsApp 76.8 3,892
Vevo 55.2 4,378
LinkedIn 45.2 4,628
Website RankAvg Audience (000)
The Results Are Similar Even When Sports Programs Are Excluded
Where Would Top Websites Rank Among Ad-Supported TV Programs? Based on A18+ Average Audience
Source: comScore MediaMetrix Key Measures (multiplatform), December 2015; A18+. Nielsen Npower, Live + SD, Total Day. December 1-31, 2015; A18+, excluding sports. “Average Audience” is based on the average minute, which is factored across the full month for websites and across program run time for TV. Digital website measurement includes all visitor activity, not just video consumption.
OVERVIEW YAHOO! / NFL EXAM
PLE COMPARABLE M
ETRICS BY PLATFORM / DEVICE TV BRANDS VS. AD-TECH AD-TECH VS. TV CONTENT DISPELLING M
The Today Show NBC 4,446.6General Hospital ABC 2,729.1The Five Fox News Channel 2,364.8Tiny House Hunters HGTV 942.6The Pioneer Woman Food Network 672.0White Collar USA Network 460.2Charmed TNT 446.7E! News E! 284.7Match Game GSN 244.2Will & Grace WE TV 179.9Gilligan's Island TV Land 167.5Secret Life of Elephants Nat Geo Wild 144.8Rescue Me FX 140.6Mission Asteroid Science 100.1What's My Car Worth? Velocity 94.6House Crashers DIY 84.4Pop Up Video VH-1 83.9My Super Sweet Sixteen MTV 77.4Maya The Bee Sprout 55.9Beverly Hills, 90210 Pop 45.5
TV Program Network Avg Audience (000)
PLATFORMS VS. PROGRAMS:If Ad-Tech Platforms Were TV Programs, Where Would They Rank in Average Audience?
A18+ Average Audience ComparisonPopular Websites Vs. Comparable Ad-Supported TV Programs
<<<<<<<<<<<<<<<<<<<<
Websites TV Programs
Source: comScore MediaMetrix Key Measures (multiplatform), December 2015; A18+. Nielsen Npower, Live + SD, Total Day. December 1-31, 2015; A18+. “Average Audience” is based on the average minute, which is factored across the full month for websites and across program run time for TV. Digital website measurement includes all visitor activity, not just video consumption.
OVERVIEW YAHOO! / NFL EXAM
PLE COMPARABLE M
ETRICS BY PLATFORM / DEVICE TV BRANDS VS. AD-TECH AD-TECH VS. TV CONTENT DISPELLING M
YTHS
Facebook 1,776.5 27
Pandora 1,257.1 45
YouTube 1,098.3 49
Google 378.3 236
Spotify 357.1 268
Instagram 347.3 275
Snapchat 220.8 563
Twitter 112.3 1,216
Amazon 102.2 1,322
Yahoo.com 91.2 1,430
Website RankAvg Audience (000)
Pinterest 89.1 1,454
Twitch 74.6 1,662
Tumblr 72.6 1,698
Skype 55.3 2,071
WhatsApp 45.5 2,348
Vevo 30.8 2,903
Craigslist 29.5 2,972
Buzzfeed 26.3 3,138
Imgur 23.7 3,319
eBay 16.8 3,823
Website RankAvg Audience (000)
Only Three Of The Most Popular Younger-Skewing Websites Would Rank Within TV’s Top 200 Programs Against Millennials
Where Would Top Websites Rank Among Ad-Supported TV Programs? Based on A18-34 Average Audience
Source: comScore MediaMetrix Key Measures (multiplatform), December 2015; A18-34. Nielsen Npower, Live + SD, Total Day. December 1-31, 2015; A18-34. “Average Audience” is based on the average minute, which is factored across the full month for websites and across program run time for TV. Digital website measurement includes all visitor activity, not just video consumption.
OVERVIEW YAHOO! / NFL EXAM
PLE COMPARABLE M
ETRICS BY PLATFORM / DEVICE TV BRANDS VS. AD-TECH AD-TECH VS. TV CONTENT DISPELLING M
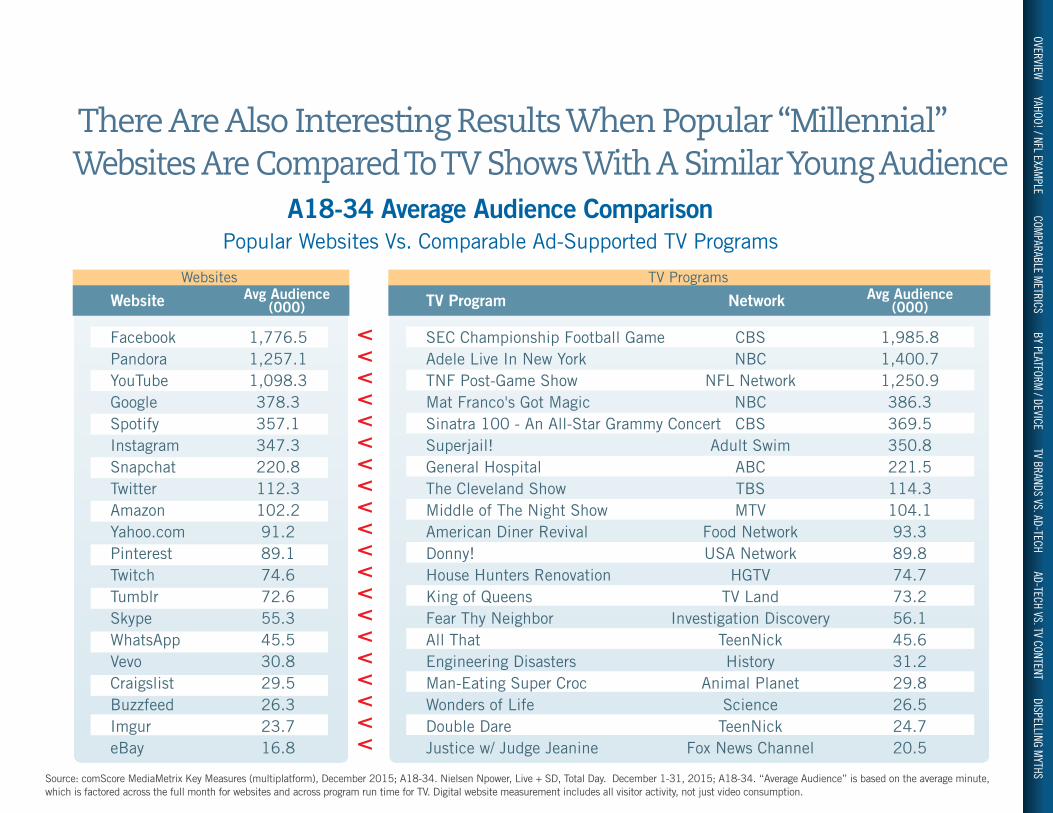
SEC Championship Football Game CBS 1,985.8Adele Live In New York NBC 1,400.7TNF Post-Game Show NFL Network 1,250.9Mat Franco's Got Magic NBC 386.3Sinatra 100 - An All-Star Grammy Concert CBS 369.5Superjail! Adult Swim 350.8General Hospital ABC 221.5The Cleveland Show TBS 114.3Middle of The Night Show MTV 104.1American Diner Revival Food Network 93.3Donny! USA Network 89.8House Hunters Renovation HGTV 74.7King of Queens TV Land 73.2Fear Thy Neighbor Investigation Discovery 56.1All That TeenNick 45.6Engineering Disasters History 31.2Man-Eating Super Croc Animal Planet 29.8Wonders of Life Science 26.5Double Dare TeenNick 24.7Justice w/ Judge Jeanine Fox News Channel 20.5
TV Program Network Avg Audience (000)
There Are Also Interesting Results When Popular “Millennial” Websites Are Compared To TV Shows With A Similar Young Audience
A18-34 Average Audience ComparisonPopular Websites Vs. Comparable Ad-Supported TV Programs
Websites TV Programs
<<<<<<<<<<<<<<<<<<<<
Source: comScore MediaMetrix Key Measures (multiplatform), December 2015; A18-34. Nielsen Npower, Live + SD, Total Day. December 1-31, 2015; A18-34. “Average Audience” is based on the average minute, which is factored across the full month for websites and across program run time for TV. Digital website measurement includes all visitor activity, not just video consumption.
OVERVIEW YAHOO! / NFL EXAM
PLE COMPARABLE M
ETRICS BY PLATFORM / DEVICE TV BRANDS VS. AD-TECH AD-TECH VS. TV CONTENT DISPELLING M
YTHS
OVERVIEW YAHOO! / NFL EXAM
PLE COMPARABLE M
ETRICS BY PLATFORM / DEVICE TV BRANDS VS. AD-TECH AD-TECH VS. TV CONTENT DISPELLING M
YTHS
Using Comparable Metrics Help Dispel Late Night TV Myths And Provide Proper Perspective And Context Myth Example #1: YouTube draws larger audiences to their channels for content from popular late night hosts like Jimmy Fallon or Conan O’Brien than linear TV does
This myth is perpetuated by some people trying to compare YouTube’s unique visitors to TV’s average audience rating, but as we’ve explained: unique visitors average audience / rating
Total Unique Visitors (000) / Cume Audience Reach (000)
Average Minutes / Viewer
Total Minutes Viewed (000)
Average Audience (000)
Metric Avg Audience (000)
YouTube Linear TV
The Tonight Show Starring Jimmy Fallon
6,843 50,452
16.7 68.4
114,252 3,269,398
2.6 3,360.7
YouTube Linear TV
Conan
2,546 21,521
14.9 43.0
37,845 925,953
0.8 477.3
Fact: Far more people are more engaged for far more time with late night content on the Television while YouTube serves as a complementary platform for viral clips
Source: comScore Video Metrix Key Measures (desktop only), YouTube Partners Report, December 2015; A18+ (The Tonight Show Starring Jimmy Fallon @ YouTube / TeamCOCO @ YouTube). Nielsen Npower / R&F Program Report, Live + SD Days, December 1-31, 2015; A18+. “Average Audience” is based on the average minute, which is factored across the full month for YouTube and across program run time for TV.
OVERVIEW YAHOO! / NFL EXAM
PLE COMPARABLE M
ETRICS BY PLATFORM / DEVICE TV BRANDS VS. AD-TECH AD-TECH VS. TV CONTENT DISPELLING M
YTHS
Millennials Still Prefer To Consume Late Night TV Content Through The Television Than OnlineMyth Example #1: YouTube draws much larger millennial audiences to their channels than linear TV for content from popular late night hosts like Jimmy Fallon or Conan O’Brien
This myth is perpetuated when some people try to compare YouTube’s unique visitors to TV’saverage audience rating, but as we’ve explained: unique visitors average rating
Total Unique Visitors (000) / Cume Audience Reach (000)
Average Minutes / Viewer
Total Minutes Viewed (000)
Average Audience (000)
Metric Avg Audience (000)
YouTube Linear TV
The Tonight Show Starring Jimmy Fallon
3,437 7,325
20.0 43.6
68,638 318,959
1.5 381.9
YouTube Linear TV
Conan
1,499 5,212
17.6 52.9
26,319 275,651
0.6 146.8
Fact: Far more millennials are more engaged for far more time with late night content on the Television while YouTube serves as a complementary platform for viral clips
Source: comScore Video Metrix Key Measures (desktop only), YouTube Partners Report, December 2015; A18-34 (The Tonight Show Starring Jimmy Fallon @ YouTube / TeamCOCO @ YouTube). Nielsen Npower / R&F Program Report, Live + SD, December 1-31, 2015; A18-34. “Average Audience” is based on the average minute, which is factored across the full month for YouTube and across program run time for TV.
OVERVIEW YAHOO! / NFL EXAM
PLE COMPARABLE M
ETRICS BY PLATFORM / DEVICE TV BRANDS VS. AD-TECH AD-TECH VS. TV CONTENT DISPELLING M
YTHS
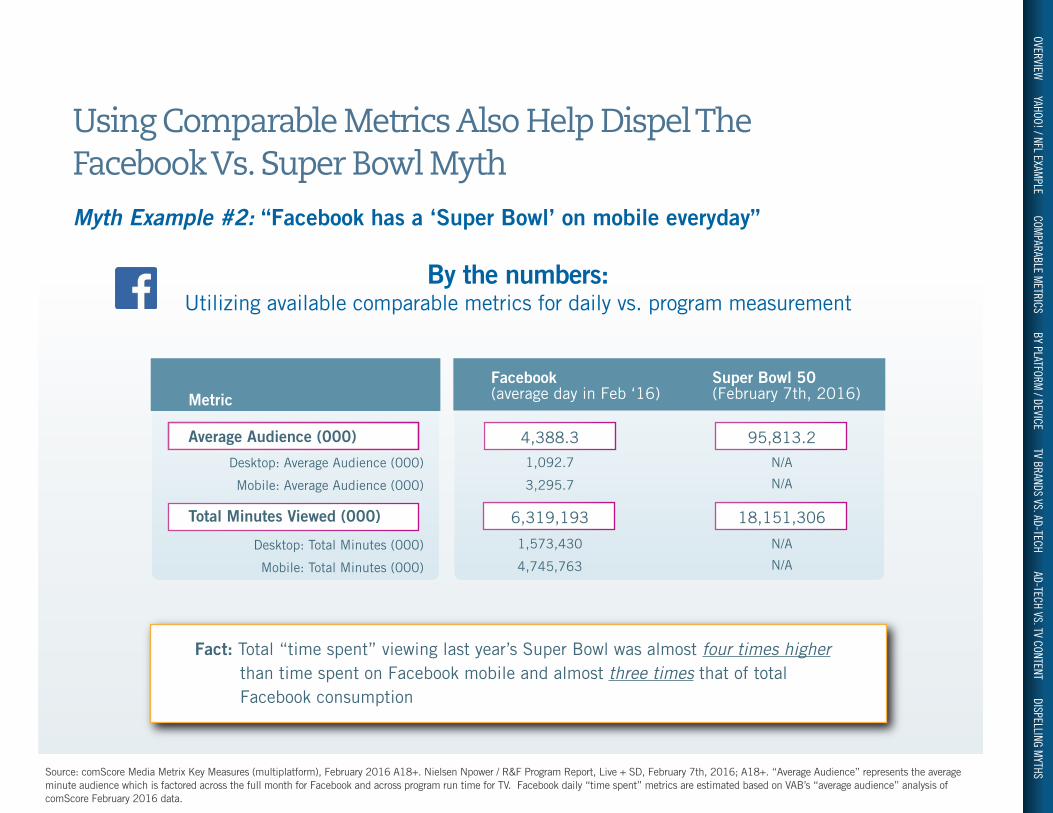
Using Comparable Metrics Also Help Dispel The Facebook Vs. Super Bowl Myth
Myth Example #2: “Facebook has a ‘Super Bowl’ on mobile everyday”
Average Audience (000)
Desktop: Average Audience (000)
Mobile: Average Audience (000)
Total Minutes Viewed (000)
Desktop: Total Minutes (000)
Mobile: Total Minutes (000)
MetricFacebook(average day in Feb ‘16)
Super Bowl 50(February 7th, 2016)
4,388.3
1,092.7
3,295.7
Fact: Total “time spent” viewing last year’s Super Bowl was almost four times higher than time spent on Facebook mobile and almost three times that of total Facebook consumption
Source: comScore Media Metrix Key Measures (multiplatform), February 2016 A18+. Nielsen Npower / R&F Program Report, Live + SD, February 7th, 2016; A18+. “Average Audience” represents the average minute audience which is factored across the full month for Facebook and across program run time for TV. Facebook daily “time spent” metrics are estimated based on VAB’s “average audience” analysis of comScore February 2016 data.
6,319,193
1,573,430
4,745,763
95,813.2
N/A
N/A
18,151,306
N/A
N/A
By the numbers: Utilizing available comparable metrics for daily vs. program measurement
OVERVIEW YAHOO! / NFL EXAM
PLE COMPARABLE M
ETRICS BY PLATFORM / DEVICE TV BRANDS VS. AD-TECH AD-TECH VS. TV CONTENT DISPELLING M
YTHS
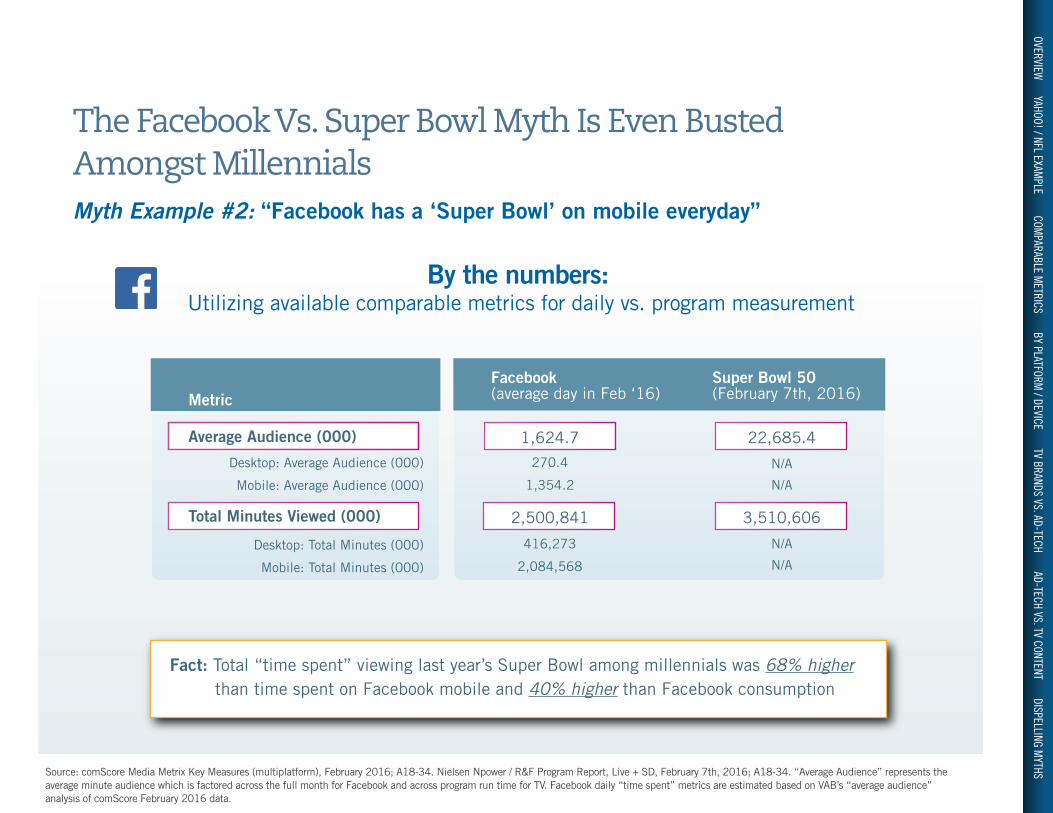
The Facebook Vs. Super Bowl Myth Is Even Busted Amongst MillennialsMyth Example #2: “Facebook has a ‘Super Bowl’ on mobile everyday”
Average Audience (000)
Desktop: Average Audience (000)
Mobile: Average Audience (000)
Total Minutes Viewed (000)
Desktop: Total Minutes (000)
Mobile: Total Minutes (000)
MetricFacebook(average day in Feb ‘16)
Super Bowl 50(February 7th, 2016)
1,624.7
270.4
1,354.2
Fact: Total “time spent” viewing last year’s Super Bowl among millennials was 68% higher than time spent on Facebook mobile and 40% higher than Facebook consumption
Source: comScore Media Metrix Key Measures (multiplatform), February 2016; A18-34. Nielsen Npower / R&F Program Report, Live + SD, February 7th, 2016; A18-34. “Average Audience” represents the average minute audience which is factored across the full month for Facebook and across program run time for TV. Facebook daily “time spent” metrics are estimated based on VAB’s “average audience” analysis of comScore February 2016 data.
2,500,841
416,273
2,084,568
22,685.4
N/A
N/A
3,510,606
N/A
N/A
By the numbers: Utilizing available comparable metrics for daily vs. program measurement
OVERVIEW YAHOO! / NFL EXAM
PLE COMPARABLE M
ETRICS BY PLATFORM / DEVICE TV BRANDS VS. AD-TECH AD-TECH VS. TV CONTENT DISPELLING M
YTHS
Using Comparable Metrics Also Help Dispel BuzzFeed’s Notion That Their Reach Rivals TelevisionMyth Example #3: BuzzFeed’s reach now rivals that of the largest TV networks
Total Unique Visitors (000) / Cume Audience Reach (000)
Average Minutes / Visitor
Total Minutes Viewed (000)
Average Audience (000)
Metric BuzzFeed Rank Vs. TV Networks
Fact: Not only would BuzzFeed not break the top #25 on reach among TV networks but it would also be one of the lowest-ranked properties on average audience and against “time spent” metrics
Source: comScore Media Metrix Key Measures (multiplatform), December 2015; P2+. Nielsen Npower / R&F Program Report, Live + SD, December 1-31, 2015; P2+. “Average Audience” is based on the average minute, which is factored across the full month for Buzzfeed and TV networks. *Last among the 124 Nielsen-measured TV networks
By the numbers:
80,442
20.5
1,651,406
37.0
#26
Last*
#108
#114
OVERVIEW YAHOO! / NFL EXAM
PLE COMPARABLE M
ETRICS BY PLATFORM / DEVICE TV BRANDS VS. AD-TECH AD-TECH VS. TV CONTENT DISPELLING M
YTHS
If you would like additional video advertising information, insights or analysis please visit our website at www.TheVAB.com or feel free to contact us directly: