Batiment Avant Centre 13 Chemin du Levant 01210 Ferney Voltaire France Phone: 33.450.28.00.49 Fax: 33.450.28.04.07 www.path.org www.who.int Vaccine regional distribution center cost assessment December 2011
Transcript
Batiment Avant Centre 13 Chemin du Levant 01210 Ferney Voltaire France
Vaccine regional distribution center cost assessment
December 2011
ii
This report was commissioned by Optimize: Immunization Systems and Technologies for Tomorrow, a World Health Organization (WHO) and PATH collaboration. The report was authored by Kristina Lorenson and Fay Venegas of PATH in collaboration with RTT Medical; Eric Klunder; Paxton International; and ministry of health staff in Botswana, Malawi, Mozambique, Namibia, South Africa, Zambia, and Zimbabwe. Additional contributors to the report included Joanie Robertson, PATH; Dr. Carol Levin, PATH; John Lloyd, PATH; and Dr. Patrick Lydon, WHO.
2201 Westlake Avenue, Suite 200 Seattle, WA 98121 USA www.path.org
Suggested citation:
PATH. Vaccine Regional Distribution Center Cost Assessment. Seattle: PATH; 2011.
This work was funded in whole or in part by a grant from the Bill & Melinda Gates Foundation. The views expressed herein are solely those of the authors and do not necessarily reflect the views of the Foundation.
Appendix 6. Cost comparison of Traditional distribution to RDC distribution ........................... 32
vi
Acronyms and abbreviations
AIDS Acquired Immune Deficiency Syndrome
AVI Accelerated Vaccine Introduction Initiative
EPI Expanded Programme on Immunization
HIV human immunodeficiency virus
HPV human papillomavirus
RDC regional distribution center
MOH ministry of health
PATH Program for Appropriate Technology in Health
PEPFAR US President’s Emergency Plan for AIDS Relief
SCMS Supply Chain Management System (PEPFAR)
UCI Unit for Child Immunization (Zambia)
UNICEF United Nations Children’s Fund
WHO World Health Organization
vii
Executive summary
Countries are facing the challenge of maintaining cost-effective, high-quality supply chains as more temperature-sensitive products that are priced higher and packaged in larger unit volumes are introduced. Given the significant investment that countries may need to make as new vaccines are introduced, alternative options for the timely, cost-effective, safe delivery of vaccines are under evaluation. An assessment was undertaken by project Optimize to understand the cost implications associated with one such supply chain strategy—leveraging a regional distribution center (RDC) for the international transportation of vaccines versus the current method of shipping directly to countries. The report outlines the economic issues that need to be addressed for such a solution to be acceptable to country decision-makers, vaccine manufacturers, and private-sector warehouse and distribution companies.
Typically, an RDC organizes the shipment of vaccine products directly from manufacturers, stores these products in a central warehouse, and distributes them to countries as needed. By servicing multiple countries, the RDC would ideally be able to gain cost savings throughout the supply chain by generating economies of scale with regional consolidation and increased volumes of vaccines. The proximity of vaccine inventories to client countries would enable countries to increase the frequency of vaccine distribution to central or directly to second-level vaccine stores, aiding in inventory management and subsequently minimizing stock-outs and wastage rates. In addition, leveraging an RDC could reduce the cold storage and transport investment requirements of individual countries.
The countries included in this assessment are South Africa, Botswana, Malawi, Mozambique, Namibia, Zambia, and Zimbabwe. This region was selected because it currently leverages an RDC model under the US President’s Emergency Plan for AIDS Relief for distributing HIV commodities and other pharmaceuticals and vaccine products for the private sector. The region also includes a diverse sample of countries with varying population sizes, income levels, and immunization coverage rates. The assessment, conducted via a series of interviews, involved stakeholders representing manufacturers, immunization program managers, other ministry of health personnel, existing RDC managers, and the United Nations Children’s Fund Supply Division.
To assess the potential cost of an RDC, an economic model was developed to test three different vaccine adoption scenarios for each of the seven countries between 2010 and 2020. While it would be ideal to model the potential reduction in wastage, freight damage, and vaccine security, data limitations required the model to compare only distribution costs—shipping and transport costs, handling and management fees, and cold chain infrastructure—between existing distribution and a potential RDC distribution model.
Four of the seven countries in the study were interviewed. Of the four, three had facility and transportation cold chain constraints from the provincial or district level down and one country had constraints at the central level and down. The initial assumption of the assessment model was that the RDC would take the place of a countries’ central warehouse, saving governments from potentially large investments in cold chain equipment. However, several of the central warehouses in countries in the African region had recently been upgraded through funding
viii
provided by the US President’s Emergency Plan for AIDS Relief Supply Chain Management Systems project; thus, the potential savings impact of an RDC in such countries was not as significant.
The economic model shows that an RDC may be attractive to countries distributing large volumes of vaccines and needing to invest in additional cold chain infrastructure to meet future vaccine requirements. However, there are other situations where an RDC may be less attractive. For example, if management and distribution pricing is the same across all participating countries, the RDC may not be economically attractive for smaller countries that distribute smaller volumes of vaccines.
As the volume and value of vaccines increase over the next decade, handling and distribution costs will increase dramatically; those countries that have not already committed to investing in cold chain infrastructure may, therefore, be best positioned to consider leveraging an RDC for vaccine distribution.
Project background
Over the last decade, interest in vaccine development and delivery among nongovernmental organizations, academic institutions, and public and private donors has increased dramatically. As a result, the number of World Health Organization (WHO) prequalified vaccines almost tripled over that time. Given the large investments in research and development by manufacturers, the new vaccines are priced higher and are often requested in single- or two-dose vials in order to minimize vaccine wastage. Countries are therefore facing the challenge of maintaining cost-effective, high-quality supply chains as more temperature-sensitive products that are priced higher and packaged in larger unit volumes are introduced.
For example, based on Accelerated Vaccine Introduction Initiative (AVI) forecasts for vaccine adoption, countries in the southern African region will face projected volume increases in the supply chain of 50% from 2010 to 2015 and increases of an additional 50% from 2015 through 2020. The initial five-year period is estimated to exceed current capacities at central medical stores or central vaccine stores in some countries by more than 50% should distribution from manufacturers continue on a quarterly basis.
Understanding the important role that efficient and effective delivery plays in the ability of low-resource countries to access vaccines, the Bill & Melinda Gates Foundation sponsored project Optimize, a five-year collaboration between WHO and PATH. Project Optimize has been given a unique mandate to think about the future; to put technological and scientific advances to work, helping to define the ideal characteristics and specifications for vaccine products; and to create a supply chain in all developing countries that is flexible and robust enough to handle an increasingly large and costly portfolio of vaccines.
Given the significant investments countries may need to make as new vaccine introduction is considered, alternative mechanisms or options for timely, cost-effective, safe delivery of vaccines are under evaluation. This assessment focuses on a specific supply chain strategy—the feasibility of leveraging a regional distribution center (RDC), or intercountry warehouse, model for vaccine distribution.
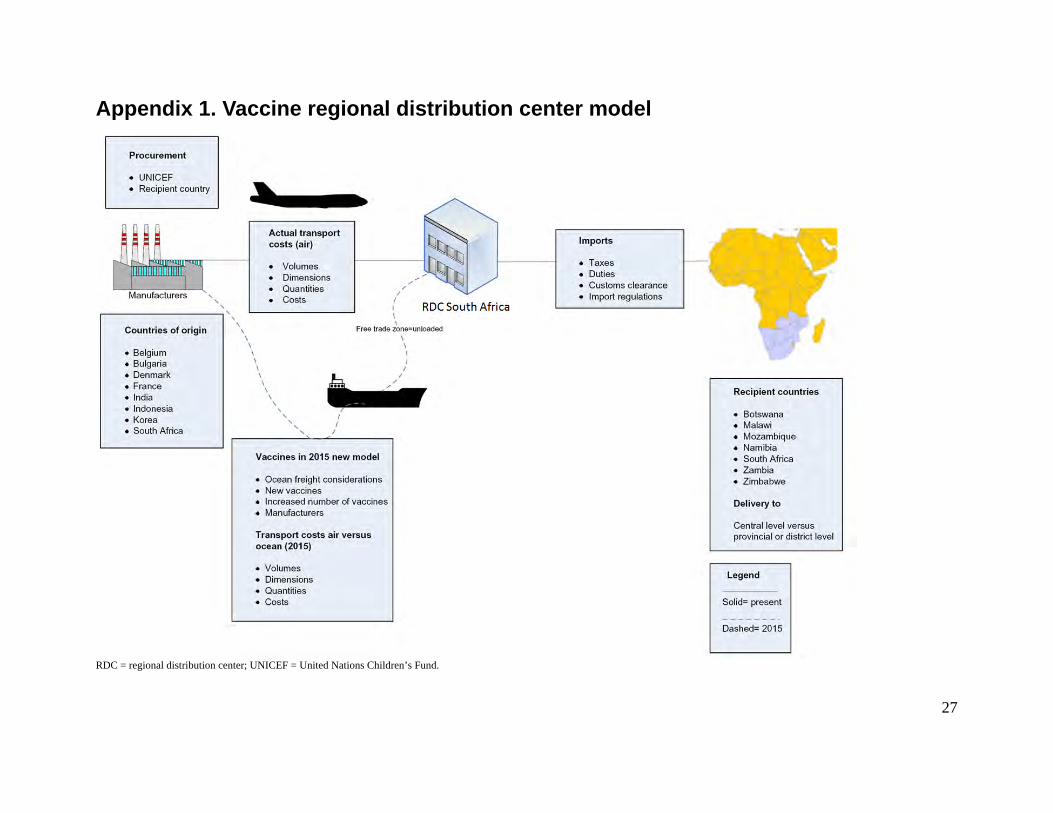
Based on the model illustrated in Appendix 1, an RDC would organize and oversee shipments of vaccine products directly from manufacturers, store these products in a central warehouse, and distribute the products to countries as needed. Procurement of vaccines is assumed to continue per each country’s current and preferred method: through the United Nations Children’s Fund (UNICEF), a procurement agency, or directly from the manufacturer. Regional pooled procurement is not considered in this assessment.
By servicing multiple countries, the RDC would ideally be able to gain cost savings throughout the supply chain by generating economies of scale with regional consolidation and increased volumes of vaccines. The proximity of vaccine inventories to client countries would enable countries to increase the frequency of vaccine distribution to central or directly to second-level vaccine stores, aiding in inventory management and subsequently minimizing stock-outs and
2
wastage rates.1 In addition, leveraging an RDC could reduce the cold storage and transport investment requirements of individual countries.
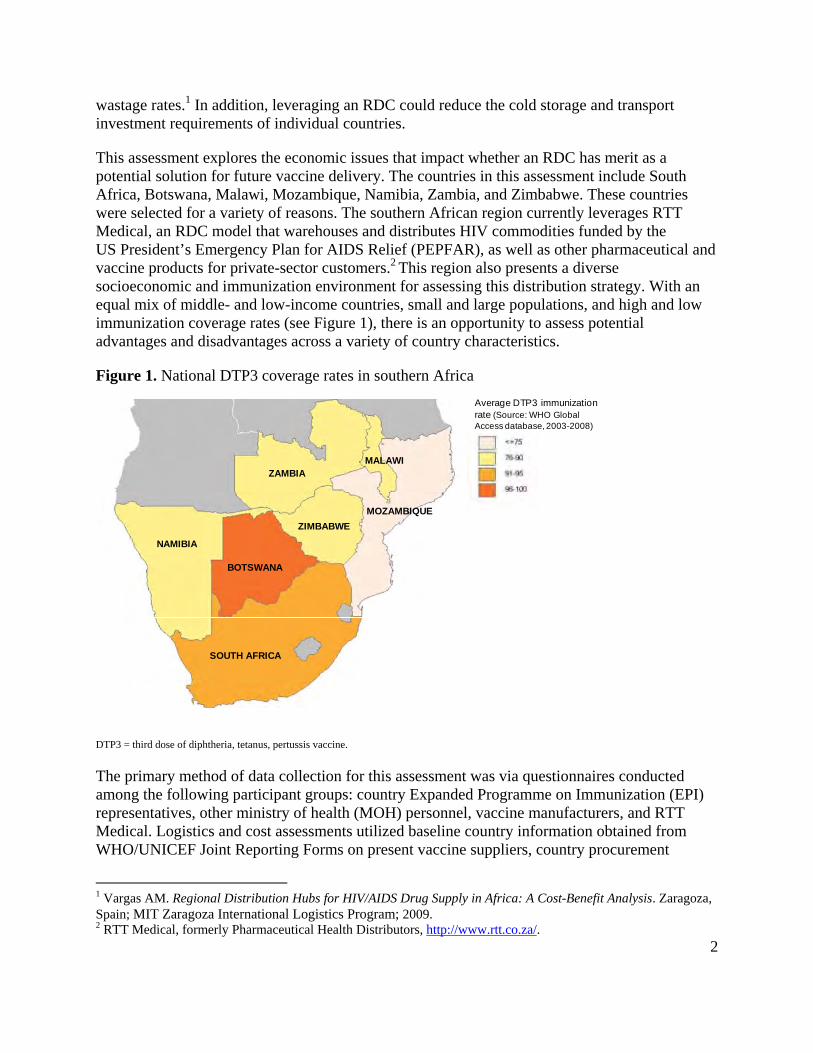
This assessment explores the economic issues that impact whether an RDC has merit as a potential solution for future vaccine delivery. The countries in this assessment include South Africa, Botswana, Malawi, Mozambique, Namibia, Zambia, and Zimbabwe. These countries were selected for a variety of reasons. The southern African region currently leverages RTT Medical, an RDC model that warehouses and distributes HIV commodities funded by the US President’s Emergency Plan for AIDS Relief (PEPFAR), as well as other pharmaceutical and vaccine products for private-sector customers.2 This region also presents a diverse socioeconomic and immunization environment for assessing this distribution strategy. With an equal mix of middle- and low-income countries, small and large populations, and high and low immunization coverage rates (see Figure 1), there is an opportunity to assess potential advantages and disadvantages across a variety of country characteristics.
Figure 1. National DTP3 coverage rates in southern Africa
DTP3 = third dose of diphtheria, tetanus, pertussis vaccine.
The primary method of data collection for this assessment was via questionnaires conducted among the following participant groups: country Expanded Programme on Immunization (EPI) representatives, other ministry of health (MOH) personnel, vaccine manufacturers, and RTT Medical. Logistics and cost assessments utilized baseline country information obtained from WHO/UNICEF Joint Reporting Forms on present vaccine suppliers, country procurement
1 Vargas AM. Regional Distribution Hubs for HIV/AIDS Drug Supply in Africa: A Cost-Benefit Analysis. Zaragoza, Spain; MIT Zaragoza International Logistics Program; 2009. 2 RTT Medical, formerly Pharmaceutical Health Distributors, http://www.rtt.co.za/.
Average DTP3 immunization rate (Source: WHO Global Access database, 2003-2008)
BOTSWANA
NAMIBIA
ZAMBIA
ZIMBABWE
MALAWI
SOUTH AFRICA
MOZAMBIQUE
3
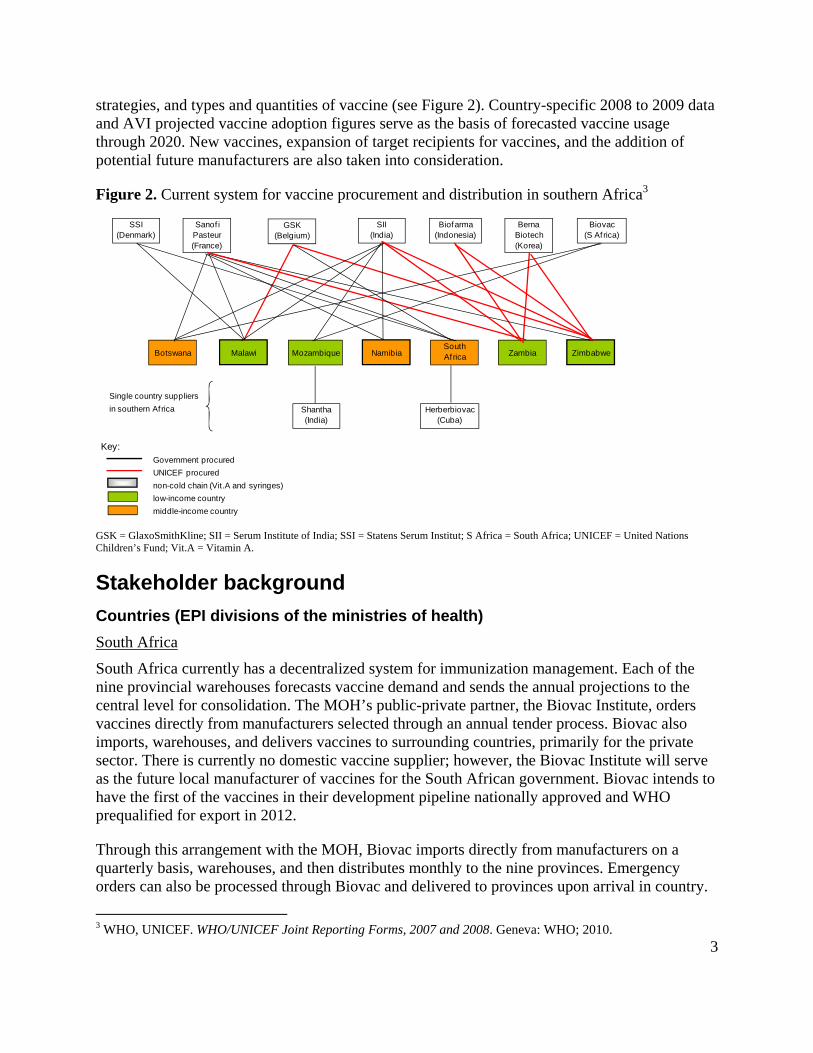
strategies, and types and quantities of vaccine (see Figure 2). Country-specific 2008 to 2009 data and AVI projected vaccine adoption figures serve as the basis of forecasted vaccine usage through 2020. New vaccines, expansion of target recipients for vaccines, and the addition of potential future manufacturers are also taken into consideration.
Figure 2. Current system for vaccine procurement and distribution in southern Africa3
GSK = GlaxoSmithKline; SII = Serum Institute of India; SSI = Statens Serum Institut; S Africa = South Africa; UNICEF = United Nations Children’s Fund; Vit.A = Vitamin A.
Stakeholder background
Countries (EPI divisions of the ministries of health)
South Africa
South Africa currently has a decentralized system for immunization management. Each of the nine provincial warehouses forecasts vaccine demand and sends the annual projections to the central level for consolidation. The MOH’s public-private partner, the Biovac Institute, orders vaccines directly from manufacturers selected through an annual tender process. Biovac also imports, warehouses, and delivers vaccines to surrounding countries, primarily for the private sector. There is currently no domestic vaccine supplier; however, the Biovac Institute will serve as the future local manufacturer of vaccines for the South African government. Biovac intends to have the first of the vaccines in their development pipeline nationally approved and WHO prequalified for export in 2012.
Through this arrangement with the MOH, Biovac imports directly from manufacturers on a quarterly basis, warehouses, and then distributes monthly to the nine provinces. Emergency orders can also be processed through Biovac and delivered to provinces upon arrival in country.
South Africa reported that there is insufficient cold chain infrastructure from the provincial level to the facilities. Other challenges include lack of surveillance information, data sharing, and forecasting. Poor data management leads to inaccurate forecasting, causing the nine provincial depots to suffer from frequent stock-outs. Overstocking and expiry were not noted as problems at the central level, but there is little transparency to the extent of expiry at lower levels. Biovac delivers directly to each health facility in Western Cape Province only and reported this distribution structure is working well.
Botswana
Botswana has a centralized procurement and distribution system. The MOH orders vaccines both directly from the manufacturers and through a procurement agent. Vaccine shipments are typically imported and distributed once a month; however, many districts and health centers tend to order vaccines when needed instead of assessing consumption and demand to estimate supply needs. District warehouses are expected to place orders on a monthly or quarterly basis.
Additional challenges noted by EPI personnel in Botswana included lack of adequate cold chain transport, especially for longer trips that take from four to ten days. Government bureaucracy and subsequent lack of funds may also prevent vaccines from departing from the central or district level to get to their intended destination in a timely manner.
Mozambique
Mozambique currently has a centralized system for procurement and distribution, although the MOH is planning to move to a decentralized system by 2012. Approximately one-third of vaccines ordered are through UNICEF and the remaining two-thirds are ordered directly from manufacturers. Orders are placed annually and are imported quarterly. Vaccines and related immunization supplies are stored at the central vaccine store, and provincial vaccine stores collect vaccines from the central vaccine store on a monthly basis.
Many of the challenges in Mozambique’s vaccine supply chain revolve around shortages of trained logistics personnel. Some districts do not have cold chain managers or a dedicated person to oversee and manage procurement or distribution. Importation of vaccines can also be challenging due to the requirement that all packaging and labeling be in Portuguese. In addition, cargo space is limited on the small airplanes arriving in Maputo and even more so on cargo loads bound for the remote provinces. On occasion, shipments need to be split into two or more trips to accommodate all vaccines and supplies destined for a particular location, increasing the cost to the country and delaying receipt of needed vaccines.
Zambia
Zambia has a centralized procurement and distribution system. All vaccine orders are placed with UNICEF on an annual basis and delivered quarterly to the country. Zambia stores vaccines at the Unit for Child Immunization (UCI) along with safety boxes and immunization syringes. No vaccine-related supplies are stored at the central medical store. The UCI buffer stock is six months even though orders continue to arrive on a quarterly basis and cold rooms at UCI are at full capacity. The second level of stores is at the provincial level.
5
The main challenge reported in Zambia is insufficient cold chain capacity at all levels. The integrity of the vaccines at the lower levels is unknown, even by UNICEF. A distribution structure is in place but is strained by lack of sufficient financial resources and personnel with logistics expertise.
In summary, current supply chain challenges exist in all four of the countries which were profiled in detail in this assessment. Countries such as Zambia report insufficient cold storage space for vaccines at every level of the supply chain. Mozambique and Botswana have benefited from the investment efforts of the Supply Chain Management System (SCMS) through PEPFAR funding to increase cold chain and general warehouse capacities at the central vaccine stores. However, most provincial and district stores are predicted to have insufficient cold storage space for the introduction of new vaccines.
The majority of the countries in this region claim to lack staff with supply chain or logistics expertise. Without dedicated personnel, visibility of cold chain equipment, inventory management, and demand forecasting beyond the district level is challenging.
Advantages of an RDC from a country’s perspective
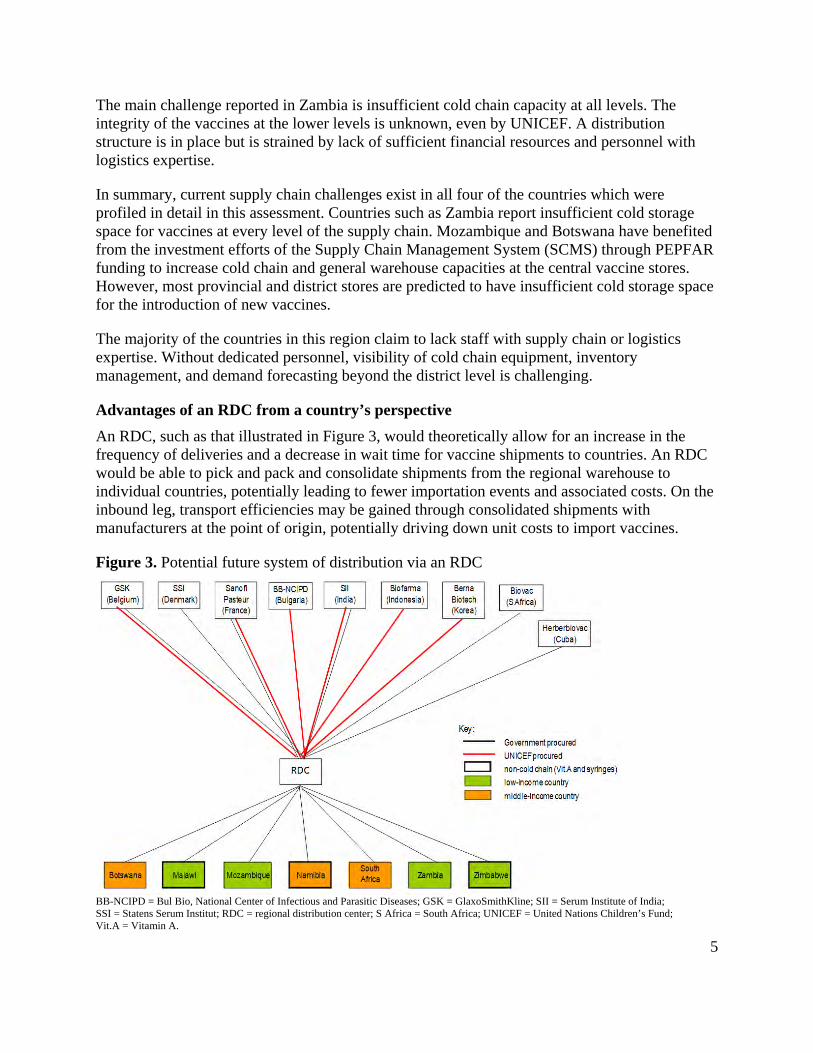
An RDC, such as that illustrated in Figure 3, would theoretically allow for an increase in the frequency of deliveries and a decrease in wait time for vaccine shipments to countries. An RDC would be able to pick and pack and consolidate shipments from the regional warehouse to individual countries, potentially leading to fewer importation events and associated costs. On the inbound leg, transport efficiencies may be gained through consolidated shipments with manufacturers at the point of origin, potentially driving down unit costs to import vaccines.
Figure 3. Potential future system of distribution via an RDC
BB-NCIPD = Bul Bio, National Center of Infectious and Parasitic Diseases; GSK = GlaxoSmithKline; SII = Serum Institute of India; SSI = Statens Serum Institut; RDC = regional distribution center; S Africa = South Africa; UNICEF = United Nations Children’s Fund; Vit.A = Vitamin A.
6
An RDC has the potential to improve the flexibility of the supply chain and easily adapt to changes in vaccine volumes. An RDC for warehousing of vaccines proposes to affect country supply chains by reducing inventory and buffer stock levels, decreasing warehouse costs, and minimizing risk of vaccine spoilage and wastage. Should a country consider utilizing an RDC to distribute directly to the second level of the supply chain, there is potential to reduce the need for the country to invest in additional cold storage equipment at the central level to meet future vaccine capacity demands. The RDC also offers inventory tracking via an information system web to improve transparency and oversight, and potentially forecasting accuracy, for countries. Finally, establishing a central hub in a region for vaccine warehousing and distribution may further encourage the consideration of the future role of pooled procurement.
Disadvantages of an RDC from a country’s perspective
All countries assessed asserted that the national immunization department would like to maintain control over vaccine procurement and distribution instead of outsourcing it to another division under the MOH or to a private entity, including an RDC. An RDC is believed by some to potentially eliminate MOH jobs and cause existing cold chain space available at the central or secondary levels of the supply chain to be abandoned. However, vaccines are a relatively small piece of the supply chain, and while some staff positions might disappear, currently underserved areas of the supply chain could be filled by reallocating personnel.
Introducing an RDC needs to be sufficiently more cost-effective and logistically beneficial to each participant country than the existing vaccine delivery model. The timing of the decision to leverage an RDC versus invest in national cold storage is critical. Currently, the greatest need for assistance with cold chain distribution is from the second level of the supply chain down. In most countries included in this assessment, the RDC would likely need to leverage a national freight forwarder to distribute to the second level of the supply chain, as countries currently do not have adequate in-country transport capacity to meet the demand of future vaccines.
Manufacturers
Three manufacturers were interviewed, as well as one other company that currently distributes vaccines to countries and intends to become a manufacturer in the near future. Two of the manufacturers currently supply all seven countries in the cost model, and the other manufacturer supplies all but Mozambique. Manufacturers receive orders from UNICEF, the local government, and procurement agents.
Manufacturers report that country planning in this region, especially in low-income countries, is often poor. Most low-income countries place vaccine orders annually. Middle-income countries, in contrast, place vaccine orders four to five times per year. Regardless of the frequency that product requests are received, countries’ forecast estimates constantly change throughout the year.
The lead time from when an order is placed with a manufacturer to the time that vaccines leave the facility depends on various factors: type of vaccine, quantity ordered, product specifications, and requirements for special markings. On average, manufacturers require anywhere from 4 to 13 weeks lead time to fill national-scale orders for a vaccine.
7
Orders are also received on short notice when disease outbreaks occur. Recent polio, yellow fever, and measles outbreaks have caused affected countries to order as often as weekly, as new surveillance data become available. These emergency orders can usually be quickly filled; however, small-quantity orders at short notice may be manufactured and shipped at a premium.
Shipping large volumes of vaccine on a quarterly basis via Traditional airfreight can be problematic. Timely delivery to Johannesburg is typically very reliable. However, finding sufficient cargo space on the smaller airplanes that travel to surrounding countries may cause shipments to be delayed or divided into two or more shipments. Warehousing at the Johannesburg airport storage facility is available for products that are held until transport to surrounding countries; however, these costs are generally unplanned and may add up quickly.
Advantages of an RDC from a manufacturer’s perspective
Manufacturers responded positively to the idea of leveraging an RDC for vaccine transport due to its potential to mitigate poor planning and possible shipment delay problems. Ideally, an RDC would have more stock-level transparency and throughput by leveraging client- and RDC-based integrated inventory and tracking information systems. In addition, by warehousing products in a central location within the region, manufacturers may place forward stock for emergency campaigns, or the RDC may borrow from warehoused stock to fulfill another country order, should such agreements exist beforehand. Alternatively, by providing more cold storage space and offering biweekly delivery to central vaccine stores or secondary-level vaccine stores, countries may be inclined to order more vaccines on a quarterly basis in case of an outbreak, should warehousing costs be reasonable. Finally, an RDC would have access to both truck and airplane transport. Therefore, if air traffic to outlying countries is infrequent or congested, road transport can quickly be substituted, saving countries from additional warehouse charges, delayed transport, and potential cold chain breeches (if cargo should be left waiting on the tarmac).
Disadvantages of an RDC from a manufacturer’s perspective
Manufacturers would be the stakeholders least impacted by the introduction of an RDC, given that liability and cost of the cargo would likely transfer to the freight forwarder or RDC upon departure from the manufacturing facility.
Manufacturers, however, expressed resistance to involving an inexperienced, for-profit private company in the vaccine distribution pathway. One manufacturer expressed concern that leveraging an RDC may hinder or dilute the positive relationships established between their company and individual MOHs. Manufacturers were concerned that a single regional warehouse may function monopolistically, making countries vulnerable to price gouging or susceptible to supply chain disruption should a natural disaster or political upheaval impact the RDC.
Manufacturers explained that understanding the appropriate documentation and import requirements for individual countries is quite complex. After years of building strong relationships with MOHs and distributors, the manufacturers themselves have developed flexible and efficient channels for distribution. An RDC would need to learn the documentation and
8
import requirements. It is assumed, however, that this is a typical part of their business, along with building relationships with government officials in client countries.
There is a belief among the manufacturers that the management of batch logistics would be more difficult if an RDC plans to pick and pack for various countries with different requirements. Manufacturers claim to need to track which batch has gone to which country for two important reasons: (1) From a regulatory perspective, product batches are manufactured and delivered to conform with specific country guidelines; and (2) specific products need to be able to be traced to the point of use in order to identify exact product in the case of a recall. Class A product recalls require location identification within 24 hours. From the RDC perspective, however, this may be more easily facilitated with their involvement. Products would be tracked and easily traceable using information systems linked to country warehouses.
An RDC that deals with GAVI Alliance-eligible and non-GAVI Alliance-eligible countries would likely be receiving different presentations of the same vaccines. Thus, distributing from a bulk supply at an RDC may not be feasible, since each country may choose to procure a different brand of the same vaccine. If buffer stock is expected to be held on hand at an RDC, countries would be required to purchase that stock in advance. This assumes that the majority of countries order the same vaccine, order the same presentation, and have the same requirements for import, which is probably not feasible in many regional situations not using pooled procurement. If buffer stock is not available to fulfill emergency orders, lead time to the countries may actually increase with the introduction of an RDC, given the additional stopover in the supply chain.
Regional distribution center
Advantages of an RDC’s involvement in vaccine distribution
Existing RDC enterprises such as RTT Medical would have the ability to gain efficiencies of scale by leveraging the existing storage and distribution infrastructure in place for temperature-sensitive products. These RDCs also have contracts in place with freight forwarders for inbound airfreight and sea freight, as well as outbound airfreight and land transport, which offer significant cost savings due to their volume throughput. An RDC such as RTT Medical offers the supply chain expertise and high technology warehousing, distribution, and tracking equipment that are too expensive for individual country investment. The RDC would accept liability for products from the point they are cleared from customs until they are delivered to the country.
Disadvantages of an RDC’s involvement in vaccine distribution
Political stability and economic agreements that support the facilitation of logistics among a group of countries needs to be in place for an RDC to be adopted and successful. In addition, key in-country stakeholders need to agree with the concept so an RDC is not viewed, for example, as diverting funds and control from the MOH to another entity. Each government must be willing and able to contract, pay, monitor, and manage the relationship with the RDC. Ideally, regional coordination related to standardization of data management would be developed prior to working with an RDC. Finally, long-term contracts with transparent cost structures need to be put in place between the RDC and countries. The RDC could conceivably be in a monopoly position for regional vaccine distribution, requiring clear guidelines to be established among all stakeholders prior to creating a distribution partnership.
9
Financial assessment methodology and assumptions
An analysis was performed to estimate the financial impact of new vaccine introduction and assess the feasibility of leveraging an RDC to minimize this impact on countries. The model uses three vaccine adoption scenarios for each of the seven countries evaluated in the cost model to estimate purchase, storage, and delivery costs of vaccines from 2010 through 2020.
The general premise behind an RDC’s economic feasibility for vaccines is that it may offer countries an opportunity to decrease costs related to vaccine import, reduce wastage from excess inventory, limit freight damage, and improve vaccine security. Multiple products can be combined into customized shipments, providing a mechanism to address the decentralization initiatives around vaccine products and immunization supplies that exist in many countries. In addition, an RDC may be able to reduce the pressure on countries to provide the capital and recurrent investments required to expand and operate cold chain capacity at the first and second levels of the supply chain for the introduction of new and underused vaccines.
Another potential avenue for reducing future cold chain investment requirements is to increase frequency of distribution throughout the supply chain. This assessment demonstrates a country’s ability to reduce cold chain investment by increasing deliveries to central vaccine stores or second-level stores to monthly by using an RDC. The assessment does not look at the impact of increasing the frequency of shipments from manufacturers directly to countries. Given the number of countries and variety of manufacturers servicing this region, obtaining representative shipping rates as the volume of each shipment decreases and frequency of distribution increases would require detailed negotiated shipping rate quotes, which is out of the scope of this theoretical assessment.
This analysis focuses on a cost comparison between existing distribution and potential RDC distribution. The comparison is based on shipping and transport costs and handling and management fees, as well as potential reduction in additional cold chain infrastructure requirements. Operational data on wastage rates due to overstocking, damage or theft, or cost comparisons of centralized versus decentralized supply chains are not included.
Calculation of vaccine volumes and weights
Baseline data for extrapolating vaccine adoption was obtained from WHO/UNICEF Joint Reporting Forms from 2008 and 2009 for each country. Data on the national immunization system portfolio of vaccines by antigen, manufacturer, and presentation is outlined in these forms. Vaccine type and brand of vaccine used in 2007 and 2008 are assumed to continue to be procured annually through 2020. The exception to this rule is if a new vaccine is introduced with the same antigen, replacing the existing vaccine (e.g., introduction of Haemophilus influenzae type b [Hib] with diphtheria, tetanus, pertussis-hepatitis B-Hib [DTP-HepB-Hib] replaces DTP and HepB). Availability dates, presentation, and manufacturer information for vaccines currently in development are based on published PATH/WHO estimates.4
4 PATH, WHO. Trends in Vaccine Availability and Novel Vaccine Delivery Technologies: 2008 to 2025. Seattle: PATH; 2008. Available at: http://www.path.org/publications/files/TS_opt_trends_vac_avail.pdf.
10
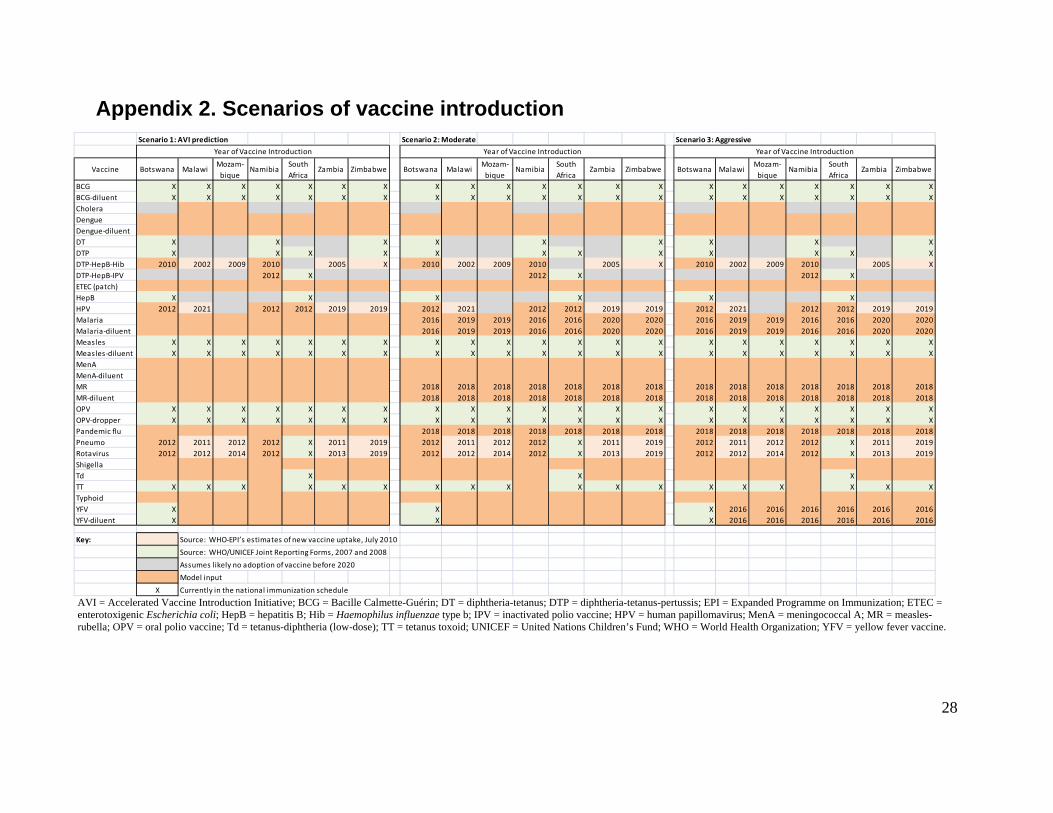
Three vaccine introduction scenarios reflecting predicted, moderate, and aggressive adoption rates are used in this analysis and outlined in Appendix 2. Timing of introduction by country for currently marketed vaccines including pentavalent, rotavirus, human papillomavirus (HPV), and pneumococcal vaccines is based on published estimates from AVI, referred to as the “predicted” scenario.5 The “moderate” scenario adoption estimates assume AVI-predicted adoption plus introduction of malaria and pandemic influenza vaccines between 2015 and 2020. The “aggressive” adoption scenario builds on the moderate scenario with the addition of routine yellow fever vaccine and a switch from measles single-dose to two-dose measles and rubella vaccine. For vaccines still in development, model inputs based on historical adoption trends and disease burden are used.
The volume of vaccines (in cubic meters) and the weight (in kilograms) are inputs into estimating the distribution and storage costs for vaccines procured for 2010, 2015, and 2020. Manufacturing information on primary, secondary, and tertiary packaging dimensions and weights by product was extracted from the consolidated data sheet created by PATH and WHO.6 For vaccines without data or in development, proxy vaccines are used to determine volume and weight. Estimates for vaccine wastage are based on wastage from the WHO/UNICEF Vaccine Volume Calculator.7 It should be noted that to obtain airfreight rates, information on volume and weight transported is required; the rates are based on the larger of the two inputs. In the case of vaccines, volume typically surpasses weight and is therefore used as the basis for the transport cost.
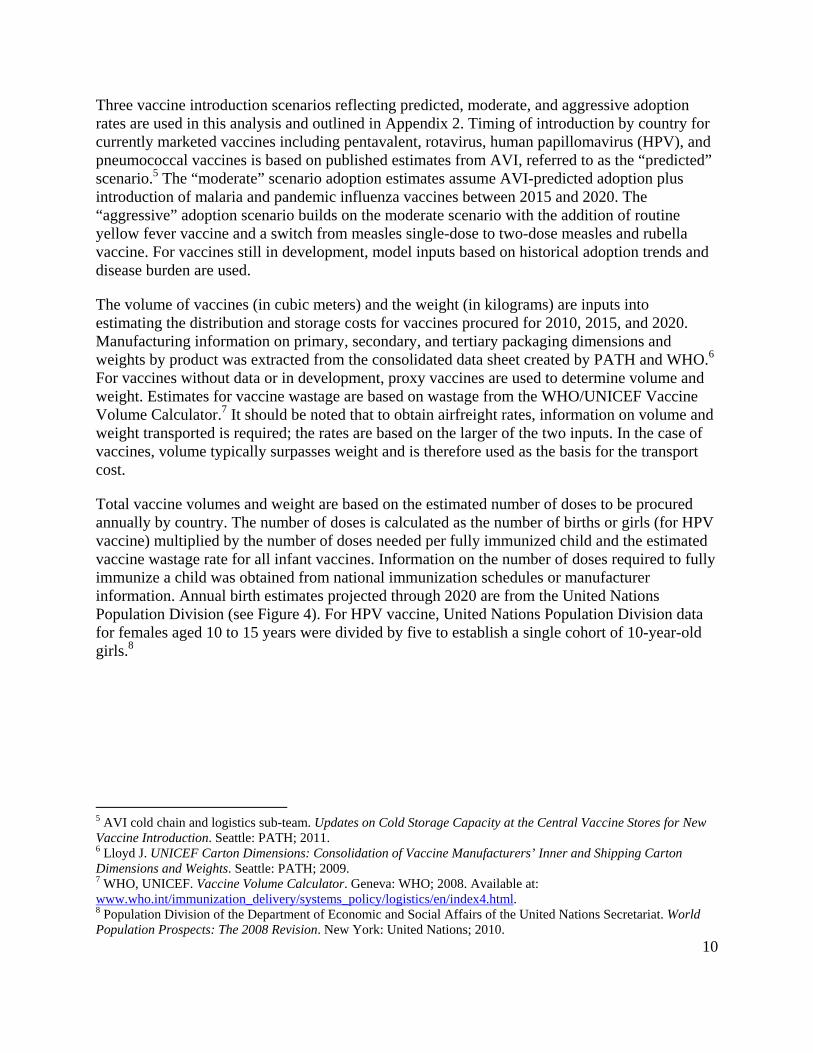
Total vaccine volumes and weight are based on the estimated number of doses to be procured annually by country. The number of doses is calculated as the number of births or girls (for HPV vaccine) multiplied by the number of doses needed per fully immunized child and the estimated vaccine wastage rate for all infant vaccines. Information on the number of doses required to fully immunize a child was obtained from national immunization schedules or manufacturer information. Annual birth estimates projected through 2020 are from the United Nations Population Division (see Figure 4). For HPV vaccine, United Nations Population Division data for females aged 10 to 15 years were divided by five to establish a single cohort of 10-year-old girls.8
5 AVI cold chain and logistics sub-team. Updates on Cold Storage Capacity at the Central Vaccine Stores for New Vaccine Introduction. Seattle: PATH; 2011. 6 Lloyd J. UNICEF Carton Dimensions: Consolidation of Vaccine Manufacturers’ Inner and Shipping Carton Dimensions and Weights. Seattle: PATH; 2009. 7 WHO, UNICEF. Vaccine Volume Calculator. Geneva: WHO; 2008. Available at: www.who.int/immunization_delivery/systems_policy/logistics/en/index4.html. 8 Population Division of the Department of Economic and Social Affairs of the United Nations Secretariat. World Population Prospects: The 2008 Revision. New York: United Nations; 2010.
11
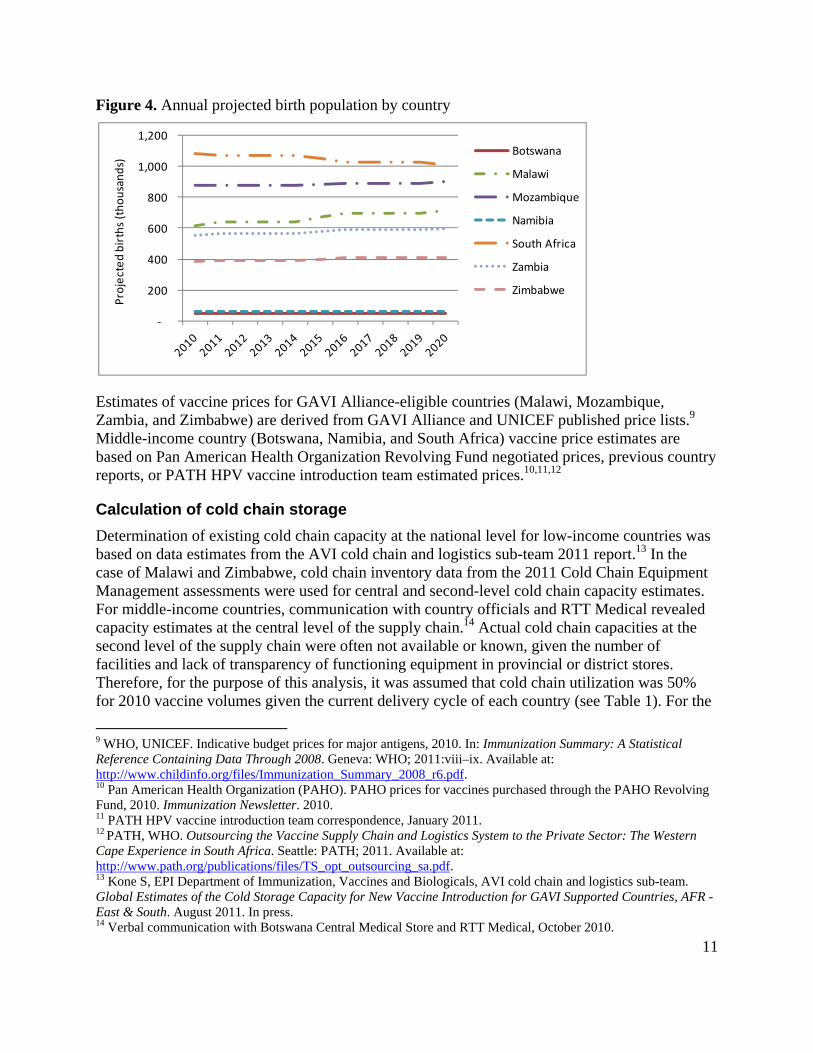
Figure 4. Annual projected birth population by country
Estimates of vaccine prices for GAVI Alliance-eligible countries (Malawi, Mozambique, Zambia, and Zimbabwe) are derived from GAVI Alliance and UNICEF published price lists.9 Middle-income country (Botswana, Namibia, and South Africa) vaccine price estimates are based on Pan American Health Organization Revolving Fund negotiated prices, previous country reports, or PATH HPV vaccine introduction team estimated prices.10,11,12
Calculation of cold chain storage
Determination of existing cold chain capacity at the national level for low-income countries was based on data estimates from the AVI cold chain and logistics sub-team 2011 report.13 In the case of Malawi and Zimbabwe, cold chain inventory data from the 2011 Cold Chain Equipment Management assessments were used for central and second-level cold chain capacity estimates. For middle-income countries, communication with country officials and RTT Medical revealed capacity estimates at the central level of the supply chain.14 Actual cold chain capacities at the second level of the supply chain were often not available or known, given the number of facilities and lack of transparency of functioning equipment in provincial or district stores. Therefore, for the purpose of this analysis, it was assumed that cold chain utilization was 50% for 2010 vaccine volumes given the current delivery cycle of each country (see Table 1). For the
9 WHO, UNICEF. Indicative budget prices for major antigens, 2010. In: Immunization Summary: A Statistical Reference Containing Data Through 2008. Geneva: WHO; 2011:viii–ix. Available at: http://www.childinfo.org/files/Immunization_Summary_2008_r6.pdf. 10 Pan American Health Organization (PAHO). PAHO prices for vaccines purchased through the PAHO Revolving Fund, 2010. Immunization Newsletter. 2010. 11 PATH HPV vaccine introduction team correspondence, January 2011. 12 PATH, WHO. Outsourcing the Vaccine Supply Chain and Logistics System to the Private Sector: The Western Cape Experience in South Africa. Seattle: PATH; 2011. Available at: http://www.path.org/publications/files/TS_opt_outsourcing_sa.pdf. 13 Kone S, EPI Department of Immunization, Vaccines and Biologicals, AVI cold chain and logistics sub-team. Global Estimates of the Cold Storage Capacity for New Vaccine Introduction for GAVI Supported Countries, AFR - East & South. August 2011. In press. 14 Verbal communication with Botswana Central Medical Store and RTT Medical, October 2010.
‐
200
400
600
800
1,000
1,200
Projected births (thousands)
Botswana
Malawi
Mozambique
Namibia
South Africa
Zambia
Zimbabwe
12
purpose of this analysis, the model assumes that number of annual deliveries to the second level is equal to the number of shipments received annually.
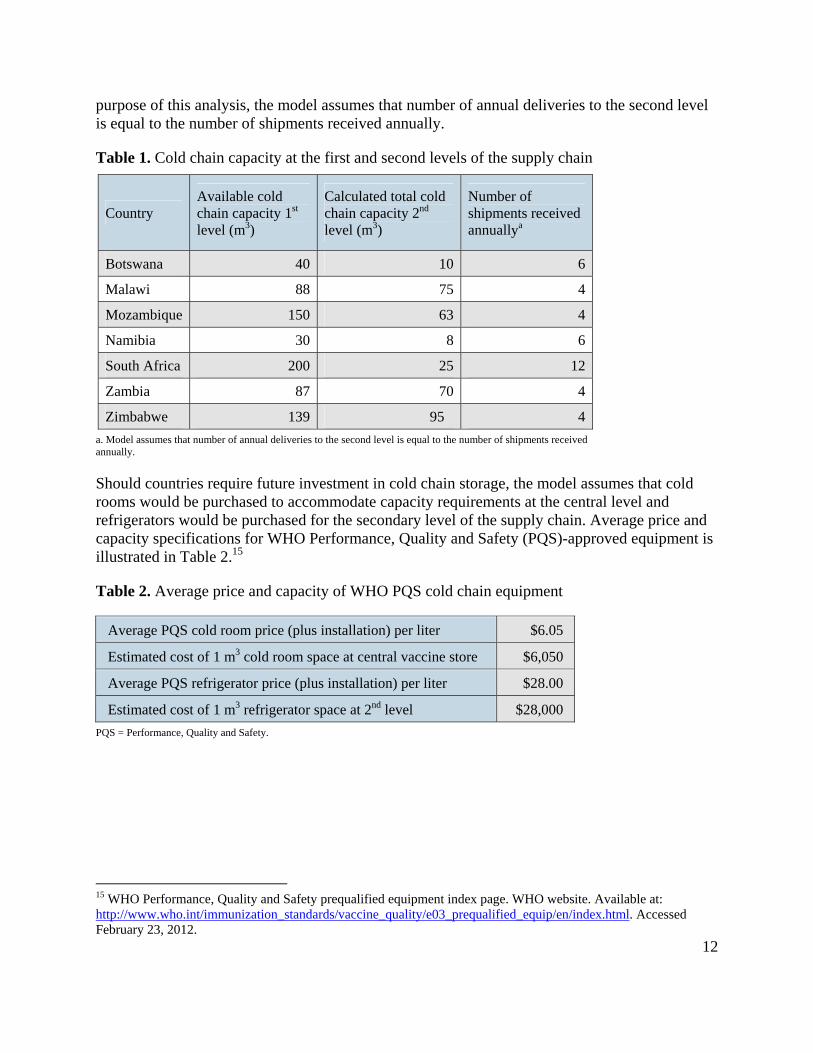
Table 1. Cold chain capacity at the first and second levels of the supply chain
Country Available cold chain capacity 1st level (m3)
Calculated total cold chain capacity 2nd level (m3)
Number of shipments received annuallya
Botswana 40 10 6
Malawi 88 75 4
Mozambique 150 63 4
Namibia 30 8 6
South Africa 200 25 12
Zambia 87 70 4
Zimbabwe 139 95 4
a. Model assumes that number of annual deliveries to the second level is equal to the number of shipments received annually.
Should countries require future investment in cold chain storage, the model assumes that cold rooms would be purchased to accommodate capacity requirements at the central level and refrigerators would be purchased for the secondary level of the supply chain. Average price and capacity specifications for WHO Performance, Quality and Safety (PQS)-approved equipment is illustrated in Table 2.15
Table 2. Average price and capacity of WHO PQS cold chain equipment
Average PQS cold room price (plus installation) per liter $6.05
Estimated cost of 1 m3 cold room space at central vaccine store $6,050
Average PQS refrigerator price (plus installation) per liter $28.00
Estimated cost of 1 m3 refrigerator space at 2nd level $28,000
PQS = Performance, Quality and Safety.
15 WHO Performance, Quality and Safety prequalified equipment index page. WHO website. Available at: http://www.who.int/immunization_standards/vaccine_quality/e03_prequalified_equip/en/index.html. Accessed February 23, 2012.
13
Calculation of distribution costs
Inbound distribution
Two inbound distribution scenarios are calculated for estimated and projected vaccine volumes in 2010, 2015, and 2020. The first scenario is the current model, “Traditional airfreight,” or transport of freight by airplane from manufacturer directly to a country’s central vaccine store or warehouse. The second scenario uses an RDC, “RDC airfreight,” which assumes transport by airfreight from the manufacturer to the RDC.
Market rate air shipment estimates for palletized, cold chain shipments maintained at +2C to +8C were obtained from a local freight forwarding company and DHL International.16 Shipping rates represent the cost to move the defined freight volume, weight, and value, including collection and documentation fees, freight, fuel, security, and total loss insurance ($0.65 per $100 shipment value) from the warehouse in the city of origin to the destination airport. Packing the pallets at the point of origin, customs fees, clearance and handling at the destination airport, and collection services from the destination airport to the national store were not included in the inbound freight cost assessment. In addition, negotiation of shipping fees based on shipping schedule or contract terms was not accounted for in the assessment. Fuel cost increase per year is assumed to be 0.6%, and frequency of inbound shipments per year for all distribution scenarios is assumed to be quarterly.
Inbound shipments are subject to a handling fee based on the value of the merchandise shipped. This fee is imposed by the entity providing oversight and clearance of the freight. UNICEF handling fees are outlined in Table 3. For the purpose of this exercise, should another entity take over the coordination and management of the freight, such as in the case of middle-income countries procuring directly from the manufacturer, handling fees are assumed to be identical to those of UNICEF. If RTT Medical were to take over management of the inbound transport, the UNICEF handling fee of 11% to 13% of the value of the goods shipped would also be applied, as RTT Medical would continue to have UNICEF oversee the inbound shipment. Total handling cost per shipment is calculated by multiplying the value of the vaccine transported by the specific handling fees.
16 Klunder E. Paxton International. October 2011.
14
Table 3. UNICEF handling fee17
Commodity LDCs Non-LDCs
Vaccines EPI 4.0% 4.5%
New vaccines 3.0% 3.5%
Cold chain 8.0% 8.5%
Total 11%–12% 12%–13%
EPI = Expanded Programme on Immunization; LDC = least-developed country.
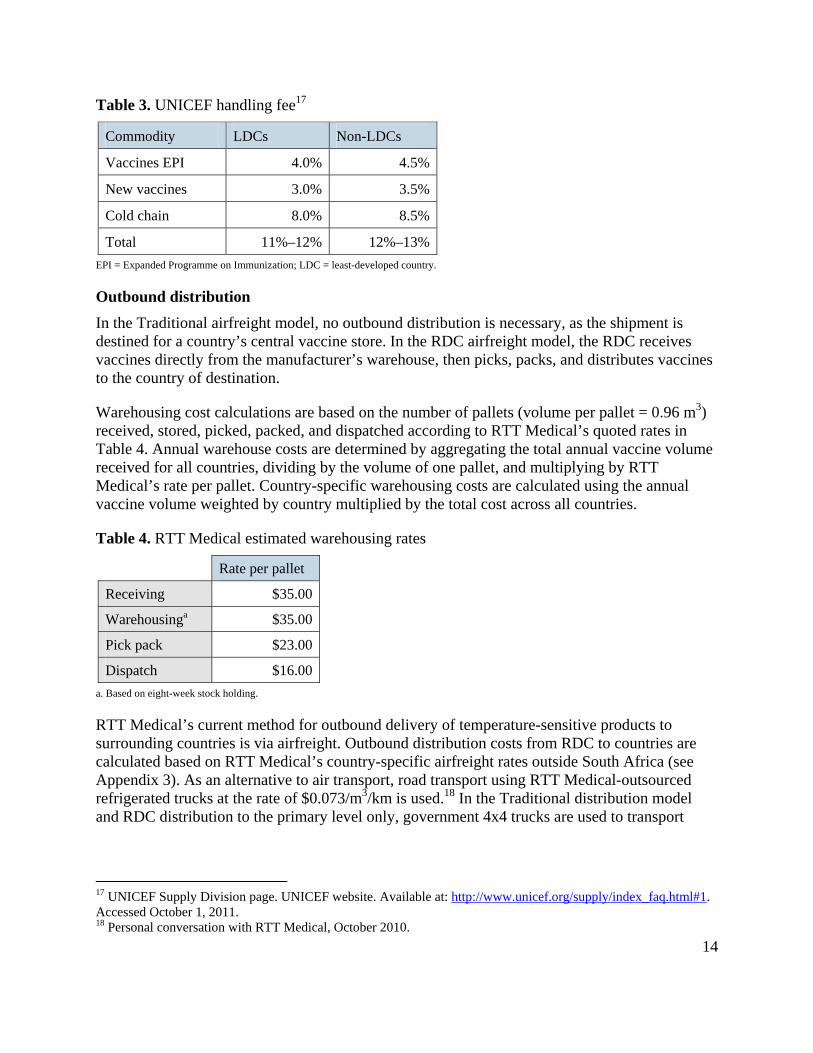
Outbound distribution
In the Traditional airfreight model, no outbound distribution is necessary, as the shipment is destined for a country’s central vaccine store. In the RDC airfreight model, the RDC receives vaccines directly from the manufacturer’s warehouse, then picks, packs, and distributes vaccines to the country of destination.
Warehousing cost calculations are based on the number of pallets (volume per pallet = 0.96 m3) received, stored, picked, packed, and dispatched according to RTT Medical’s quoted rates in Table 4. Annual warehouse costs are determined by aggregating the total annual vaccine volume received for all countries, dividing by the volume of one pallet, and multiplying by RTT Medical’s rate per pallet. Country-specific warehousing costs are calculated using the annual vaccine volume weighted by country multiplied by the total cost across all countries.
Table 4. RTT Medical estimated warehousing rates
Rate per pallet
Receiving $35.00
Warehousinga $35.00
Pick pack $23.00
Dispatch $16.00 a. Based on eight-week stock holding.
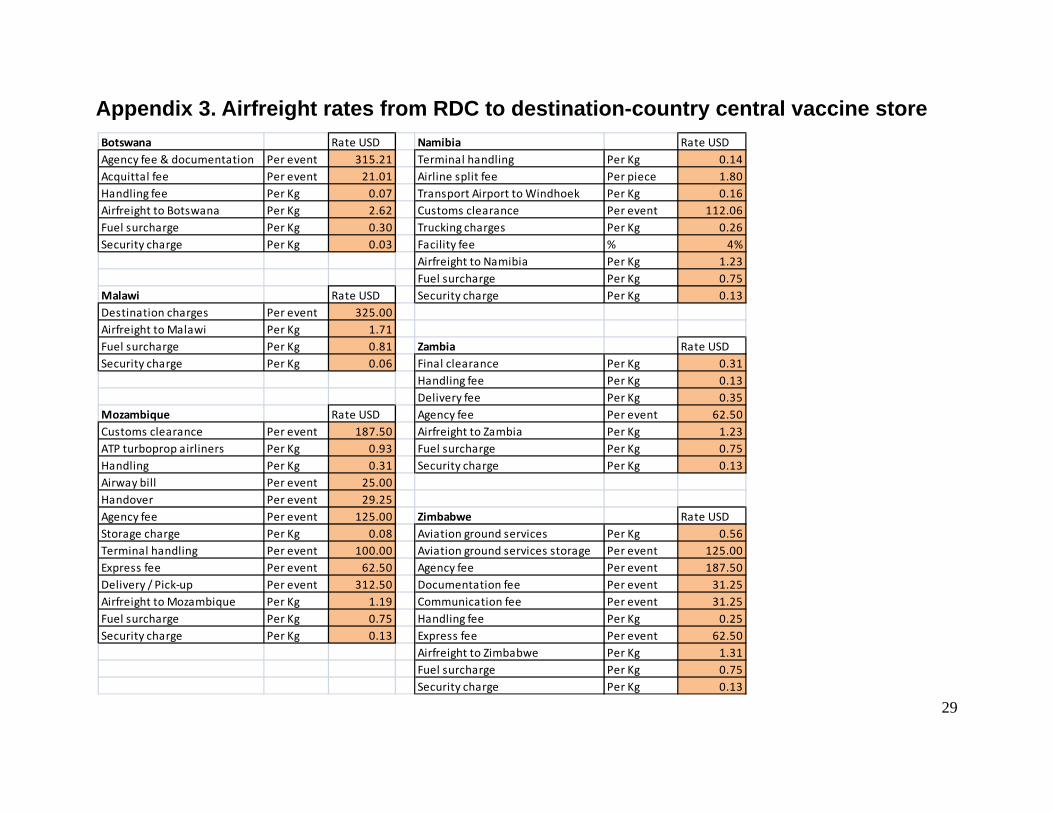
RTT Medical’s current method for outbound delivery of temperature-sensitive products to surrounding countries is via airfreight. Outbound distribution costs from RDC to countries are calculated based on RTT Medical’s country-specific airfreight rates outside South Africa (see Appendix 3). As an alternative to air transport, road transport using RTT Medical-outsourced refrigerated trucks at the rate of $0.073/m3/km is used.18 In the Traditional distribution model and RDC distribution to the primary level only, government 4x4 trucks are used to transport
17 UNICEF Supply Division page. UNICEF website. Available at: http://www.unicef.org/supply/index_faq.html#1. Accessed October 1, 2011. 18 Personal conversation with RTT Medical, October 2010.
15
vaccines in cold boxes to the second level of the supply chain at an estimated rate of $0.085/m3/km.19
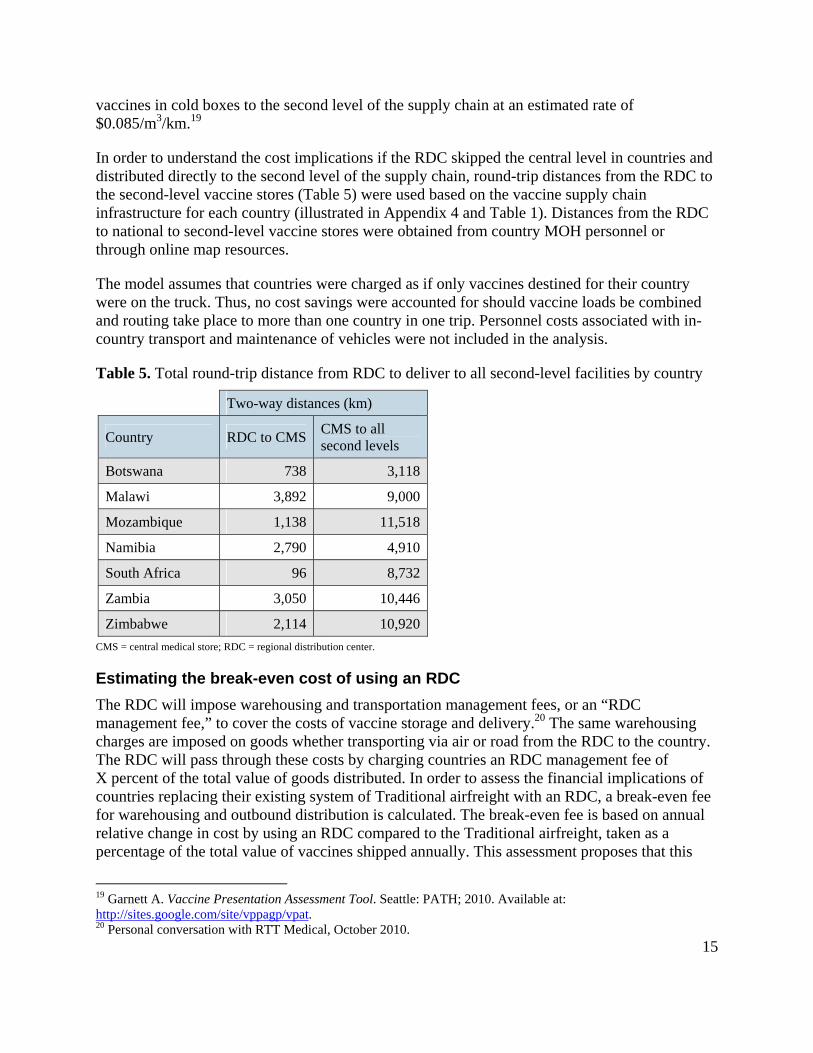
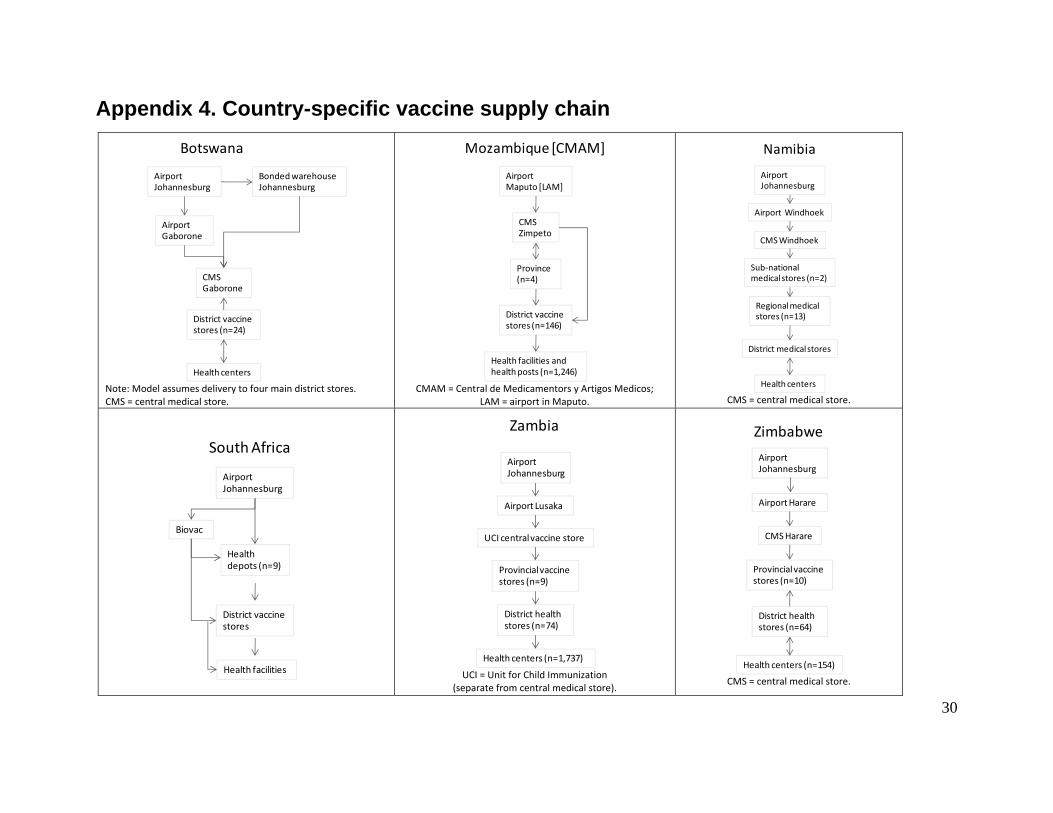
In order to understand the cost implications if the RDC skipped the central level in countries and distributed directly to the second level of the supply chain, round-trip distances from the RDC to the second-level vaccine stores (Table 5) were used based on the vaccine supply chain infrastructure for each country (illustrated in Appendix 4 and Table 1). Distances from the RDC to national to second-level vaccine stores were obtained from country MOH personnel or through online map resources.
The model assumes that countries were charged as if only vaccines destined for their country were on the truck. Thus, no cost savings were accounted for should vaccine loads be combined and routing take place to more than one country in one trip. Personnel costs associated with in-country transport and maintenance of vehicles were not included in the analysis.
Table 5. Total round-trip distance from RDC to deliver to all second-level facilities by country
Two-way distances (km)
Country RDC to CMS CMS to all second levels
Botswana 738 3,118
Malawi 3,892 9,000
Mozambique 1,138 11,518
Namibia 2,790 4,910
South Africa 96 8,732
Zambia 3,050 10,446
Zimbabwe 2,114 10,920
CMS = central medical store; RDC = regional distribution center.
Estimating the break-even cost of using an RDC
The RDC will impose warehousing and transportation management fees, or an “RDC management fee,” to cover the costs of vaccine storage and delivery.20 The same warehousing charges are imposed on goods whether transporting via air or road from the RDC to the country. The RDC will pass through these costs by charging countries an RDC management fee of X percent of the total value of goods distributed. In order to assess the financial implications of countries replacing their existing system of Traditional airfreight with an RDC, a break-even fee for warehousing and outbound distribution is calculated. The break-even fee is based on annual relative change in cost by using an RDC compared to the Traditional airfreight, taken as a percentage of the total value of vaccines shipped annually. This assessment proposes that this
19 Garnett A. Vaccine Presentation Assessment Tool. Seattle: PATH; 2010. Available at: http://sites.google.com/site/vppagp/vpat. 20 Personal conversation with RTT Medical, October 2010.
16
break-even fee is the maximum management fee imposed by an RDC, which is cost neutral to countries using an RDC over the existing distribution system.
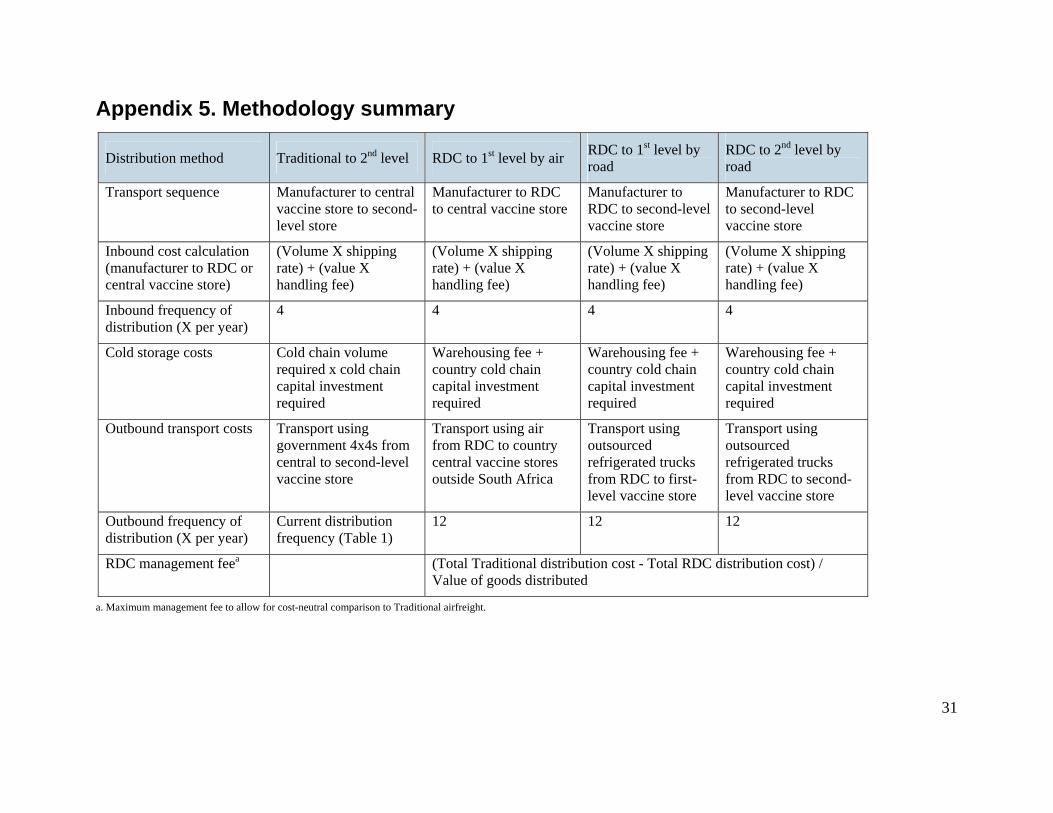
Appendix 5 summarizes the overall methodology used to calculate the comparative costs and break-even RDC warehousing and distribution fee, or RDC management fee.
Financial assessment results
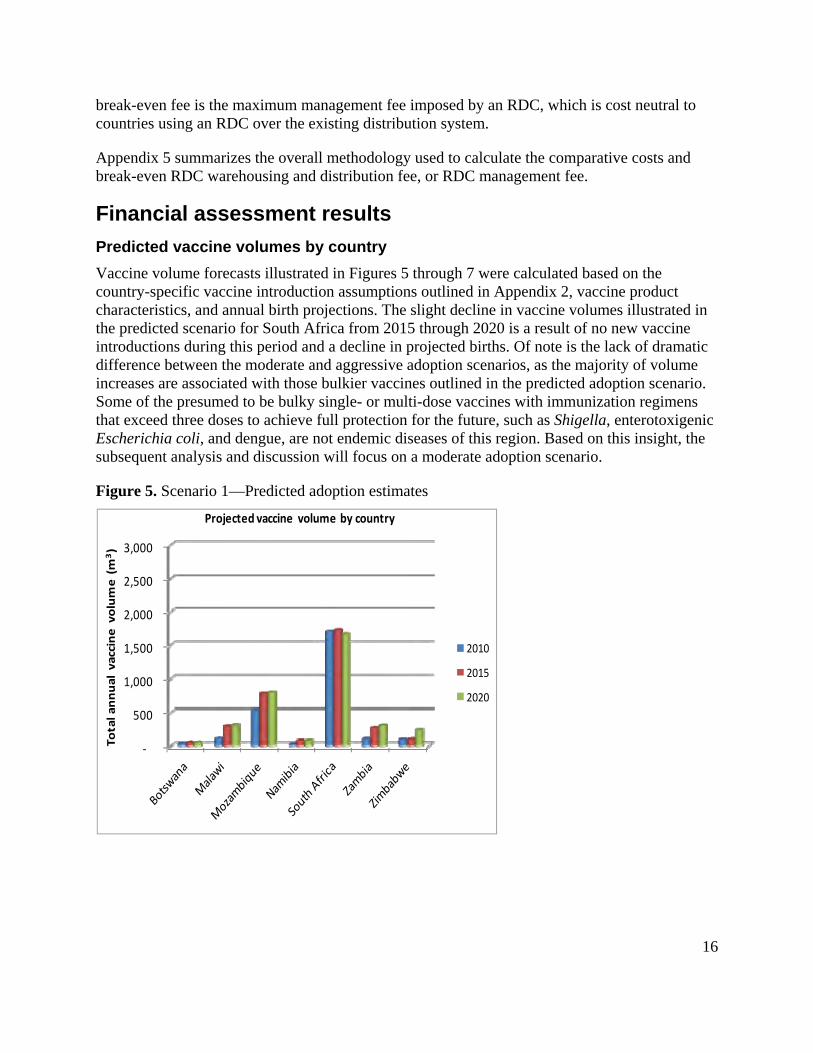
Predicted vaccine volumes by country
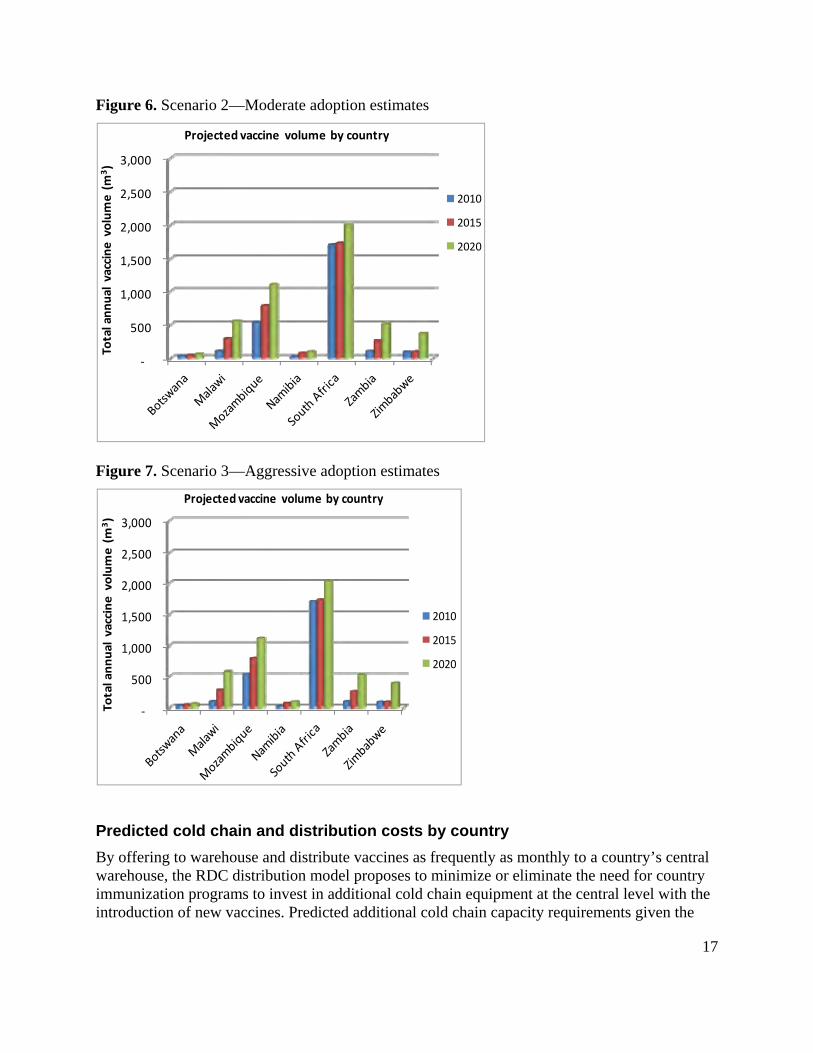
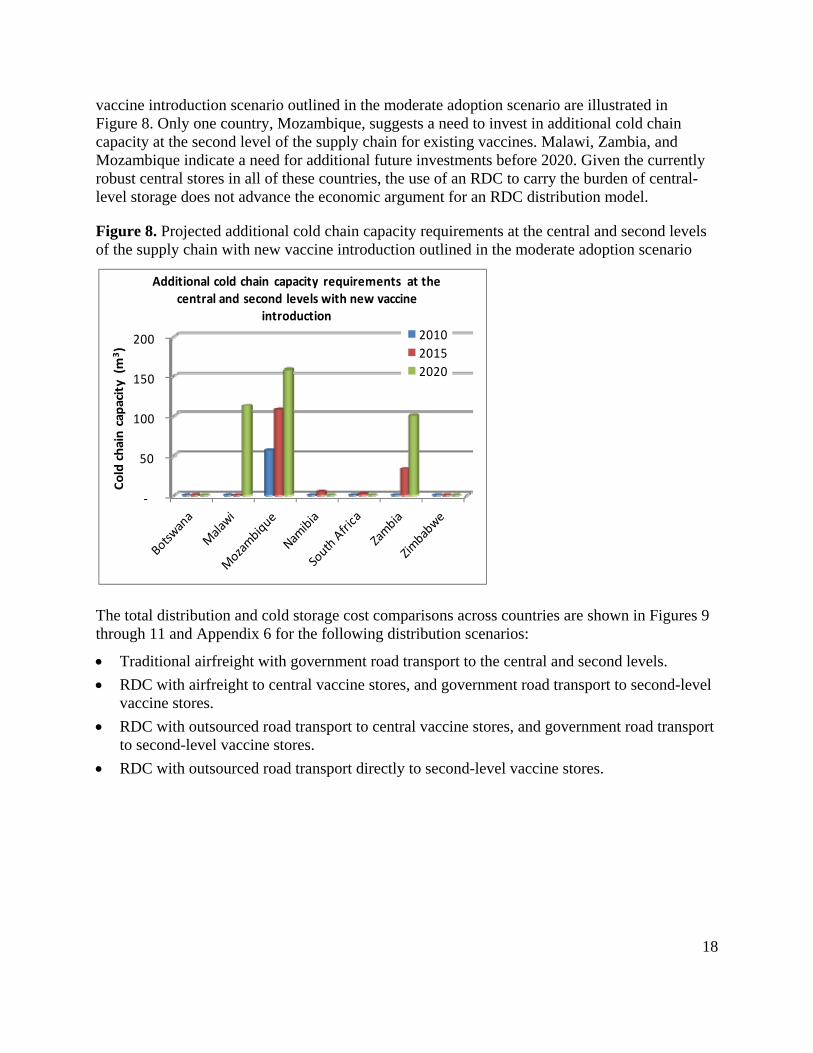
Vaccine volume forecasts illustrated in Figures 5 through 7 were calculated based on the country-specific vaccine introduction assumptions outlined in Appendix 2, vaccine product characteristics, and annual birth projections. The slight decline in vaccine volumes illustrated in the predicted scenario for South Africa from 2015 through 2020 is a result of no new vaccine introductions during this period and a decline in projected births. Of note is the lack of dramatic difference between the moderate and aggressive adoption scenarios, as the majority of volume increases are associated with those bulkier vaccines outlined in the predicted adoption scenario. Some of the presumed to be bulky single- or multi-dose vaccines with immunization regimens that exceed three doses to achieve full protection for the future, such as Shigella, enterotoxigenic Escherichia coli, and dengue, are not endemic diseases of this region. Based on this insight, the subsequent analysis and discussion will focus on a moderate adoption scenario.
Predicted cold chain and distribution costs by country
By offering to warehouse and distribute vaccines as frequently as monthly to a country’s central warehouse, the RDC distribution model proposes to minimize or eliminate the need for country immunization programs to invest in additional cold chain equipment at the central level with the introduction of new vaccines. Predicted additional cold chain capacity requirements given the
‐
500
1,000
1,500
2,000
2,500
3,000
Total annual vaccine volume (m
3)
Projected vaccine volume by country
2010
2015
2020
‐
500
1,000
1,500
2,000
2,500
3,000
Total annual vaccine volume (m
3)
Projected vaccine volume by country
2010
2015
2020
18
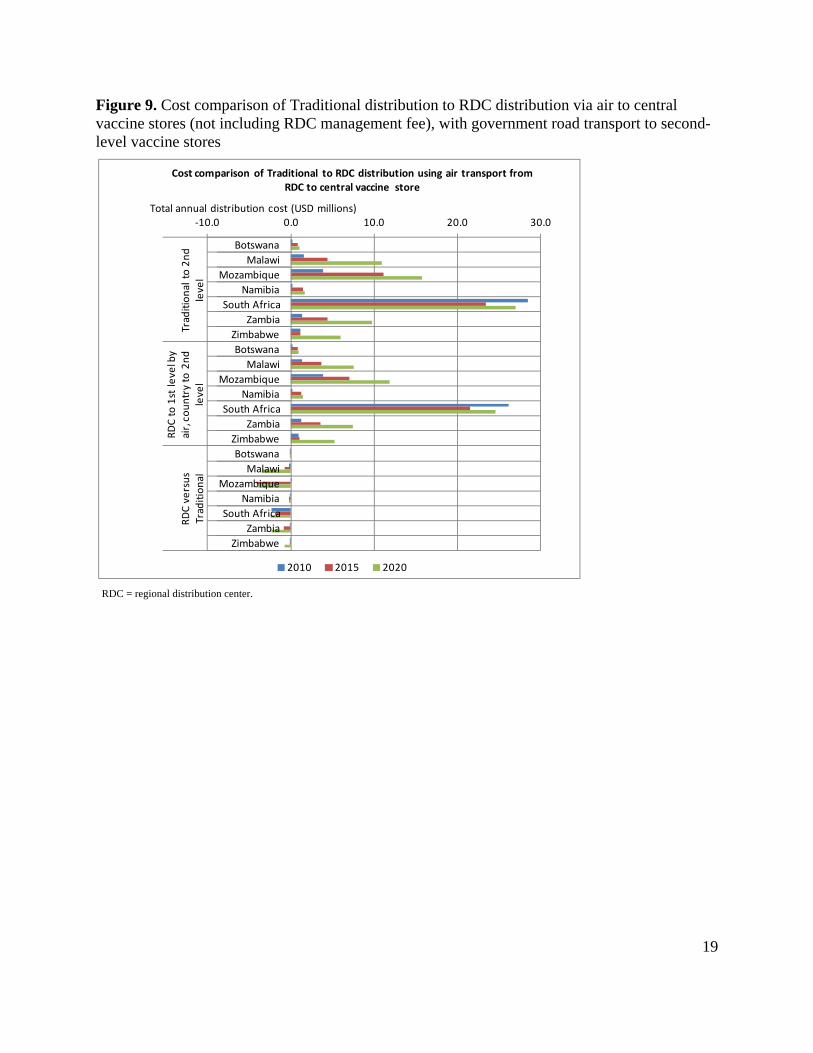
vaccine introduction scenario outlined in the moderate adoption scenario are illustrated in Figure 8. Only one country, Mozambique, suggests a need to invest in additional cold chain capacity at the second level of the supply chain for existing vaccines. Malawi, Zambia, and Mozambique indicate a need for additional future investments before 2020. Given the currently robust central stores in all of these countries, the use of an RDC to carry the burden of central-level storage does not advance the economic argument for an RDC distribution model.
Figure 8. Projected additional cold chain capacity requirements at the central and second levels of the supply chain with new vaccine introduction outlined in the moderate adoption scenario
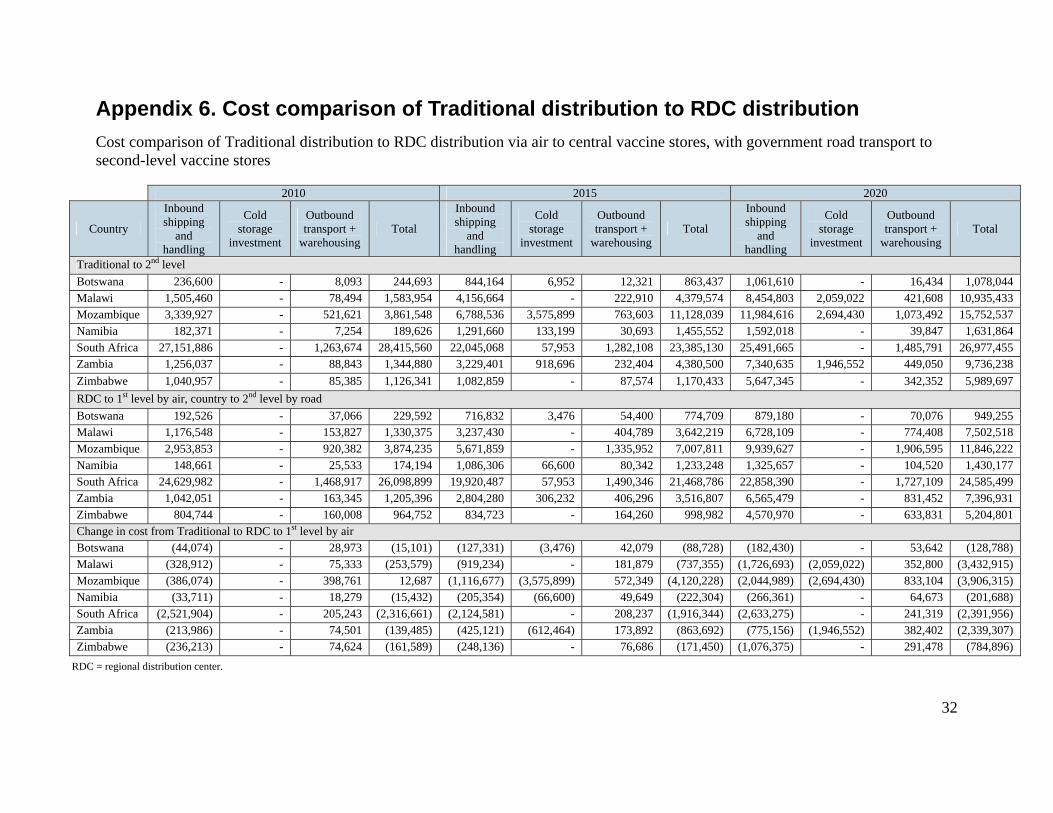
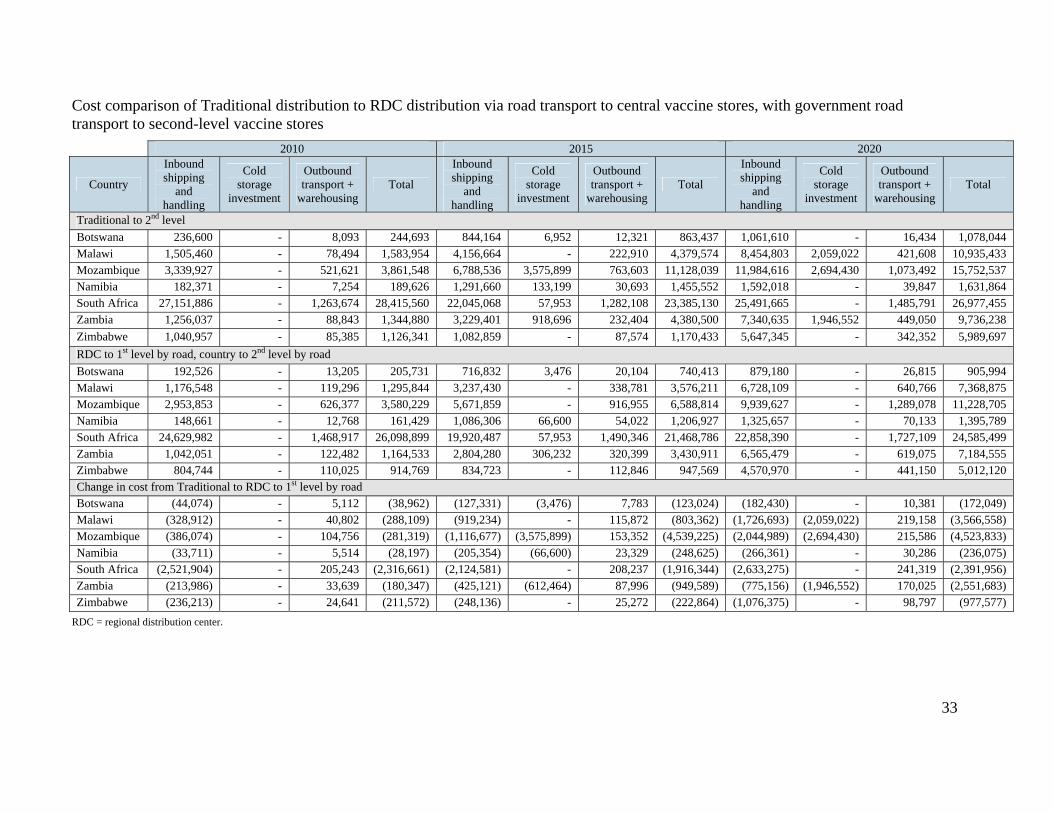
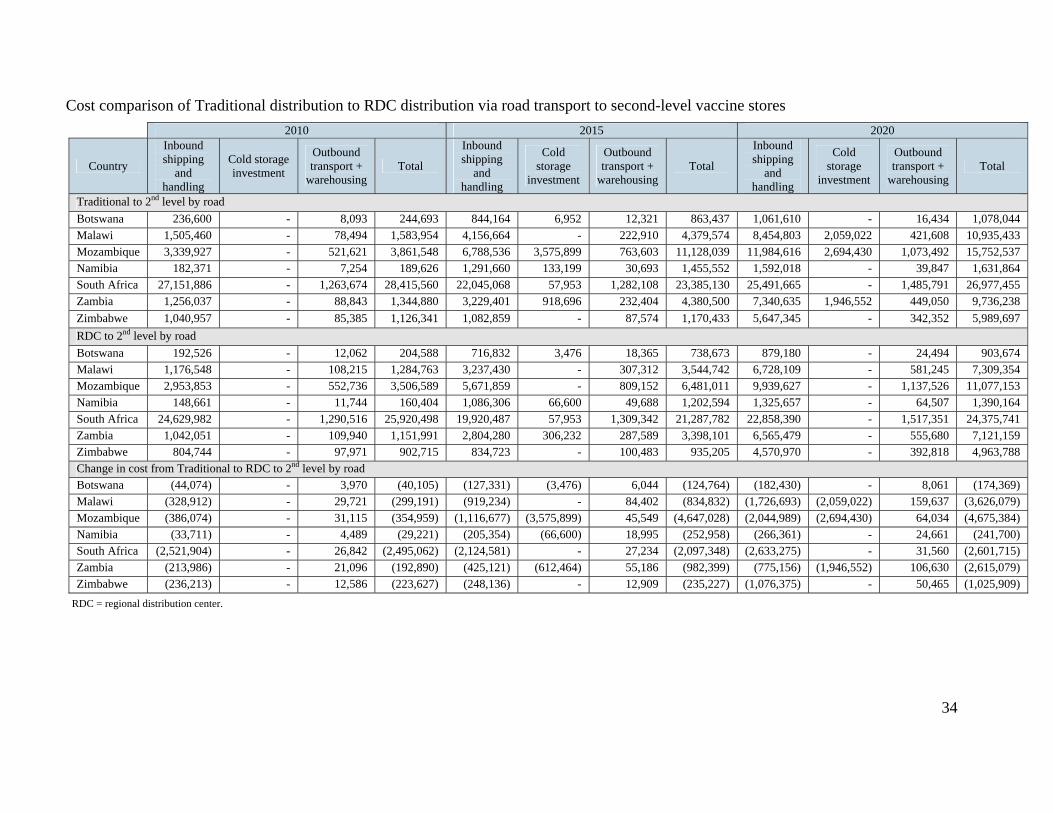
The total distribution and cold storage cost comparisons across countries are shown in Figures 9 through 11 and Appendix 6 for the following distribution scenarios:
Traditional airfreight with government road transport to the central and second levels.
RDC with airfreight to central vaccine stores, and government road transport to second-level vaccine stores.
RDC with outsourced road transport to central vaccine stores, and government road transport to second-level vaccine stores.
RDC with outsourced road transport directly to second-level vaccine stores.
‐
50
100
150
200
Cold chain capacity (m
3)
Additional cold chain capacity requirements at the central and second levels with new vaccine
introduction
2010
2015
2020
19
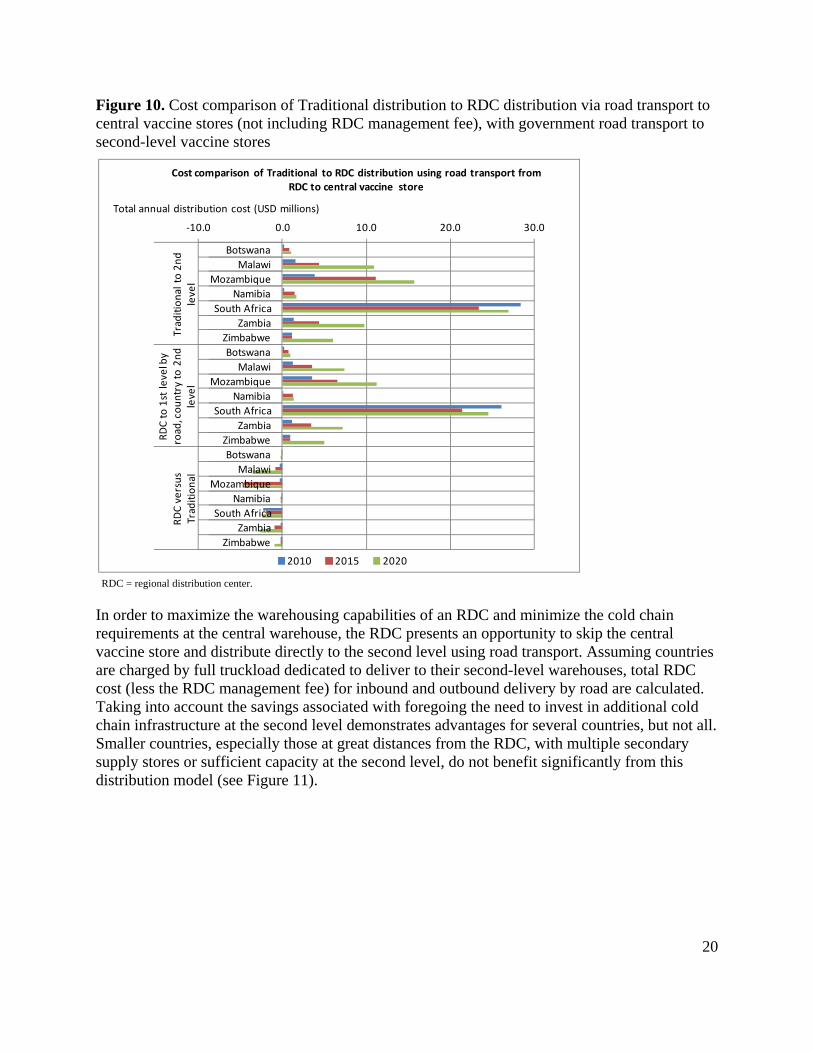
Figure 9. Cost comparison of Traditional distribution to RDC distribution via air to central vaccine stores (not including RDC management fee), with government road transport to second-level vaccine stores
RDC = regional distribution center.
‐10.0 0.0 10.0 20.0 30.0
Botswana
Malawi
Mozambique
Namibia
South Africa
Zambia
Zimbabwe
Botswana
Malawi
Mozambique
Namibia
South Africa
Zambia
Zimbabwe
Botswana
Malawi
Mozambique
Namibia
South Africa
Zambia
Zimbabwe
Traditional to 2nd
level
RDC to 1st level by
air, country to 2nd
level
RDC versus
Traditional
Total annual distribution cost (USD millions)
Cost comparison of Traditional to RDC distribution using air transport from RDC to central vaccine store
2010 2015 2020
20
Figure 10. Cost comparison of Traditional distribution to RDC distribution via road transport to central vaccine stores (not including RDC management fee), with government road transport to second-level vaccine stores
RDC = regional distribution center.
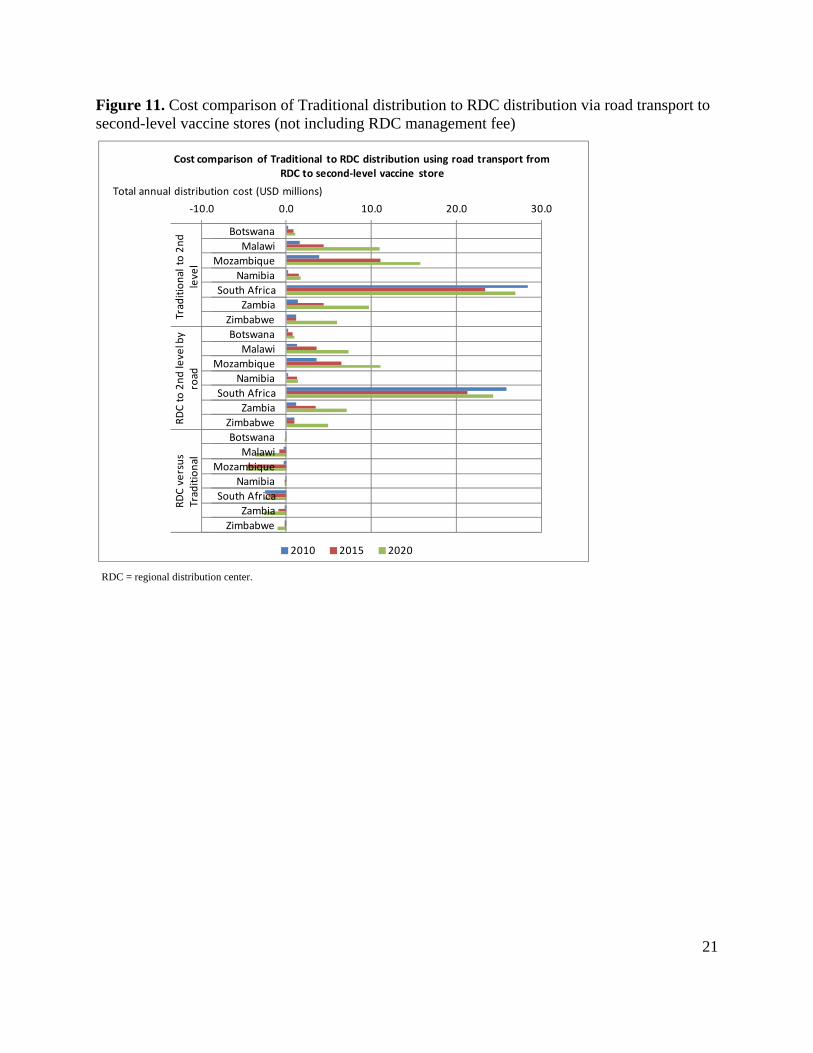
In order to maximize the warehousing capabilities of an RDC and minimize the cold chain requirements at the central warehouse, the RDC presents an opportunity to skip the central vaccine store and distribute directly to the second level using road transport. Assuming countries are charged by full truckload dedicated to deliver to their second-level warehouses, total RDC cost (less the RDC management fee) for inbound and outbound delivery by road are calculated. Taking into account the savings associated with foregoing the need to invest in additional cold chain infrastructure at the second level demonstrates advantages for several countries, but not all. Smaller countries, especially those at great distances from the RDC, with multiple secondary supply stores or sufficient capacity at the second level, do not benefit significantly from this distribution model (see Figure 11).
‐10.0 0.0 10.0 20.0 30.0
Botswana
Malawi
Mozambique
Namibia
South Africa
Zambia
Zimbabwe
Botswana
Malawi
Mozambique
Namibia
South Africa
Zambia
Zimbabwe
Botswana
Malawi
Mozambique
Namibia
South Africa
Zambia
Zimbabwe
Traditional to 2nd
level
RDC to 1st level by
road, country to 2nd
level
RDC versus
Traditional
Total annual distribution cost (USD millions)
Cost comparison of Traditional to RDC distribution using road transport from RDC to central vaccine store
2010 2015 2020
21
Figure 11. Cost comparison of Traditional distribution to RDC distribution via road transport to second-level vaccine stores (not including RDC management fee)
RDC = regional distribution center.
‐10.0 0.0 10.0 20.0 30.0
Botswana
Malawi
Mozambique
Namibia
South Africa
Zambia
Zimbabwe
Botswana
Malawi
Mozambique
Namibia
South Africa
Zambia
Zimbabwe
Botswana
Malawi
Mozambique
Namibia
South Africa
Zambia
Zimbabwe
Traditional to 2nd
level
RDC to 2nd level by
road
RDC versus
Traditional
Total annual distribution cost (USD millions)
Cost comparison of Traditional to RDC distribution using road transport from RDC to second‐level vaccine store
2010 2015 2020
22
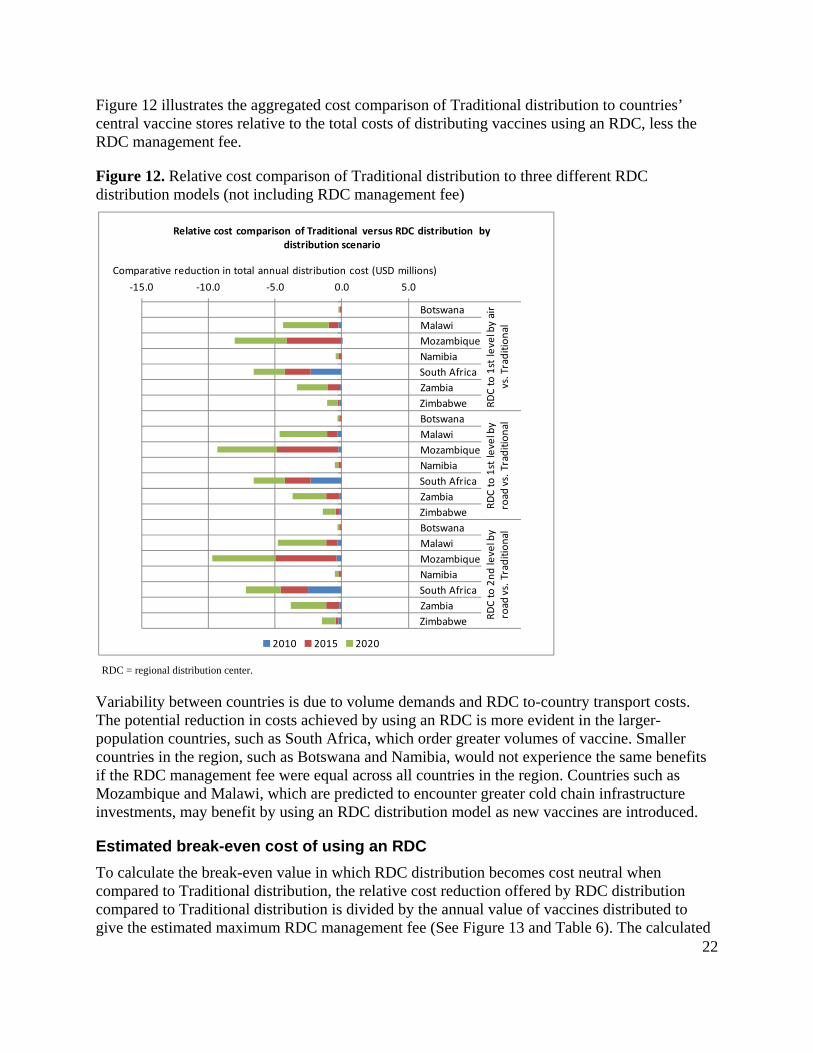
Figure 12 illustrates the aggregated cost comparison of Traditional distribution to countries’ central vaccine stores relative to the total costs of distributing vaccines using an RDC, less the RDC management fee.
Figure 12. Relative cost comparison of Traditional distribution to three different RDC distribution models (not including RDC management fee)
RDC = regional distribution center.
Variability between countries is due to volume demands and RDC to-country transport costs. The potential reduction in costs achieved by using an RDC is more evident in the larger-population countries, such as South Africa, which order greater volumes of vaccine. Smaller countries in the region, such as Botswana and Namibia, would not experience the same benefits if the RDC management fee were equal across all countries in the region. Countries such as Mozambique and Malawi, which are predicted to encounter greater cold chain infrastructure investments, may benefit by using an RDC distribution model as new vaccines are introduced.
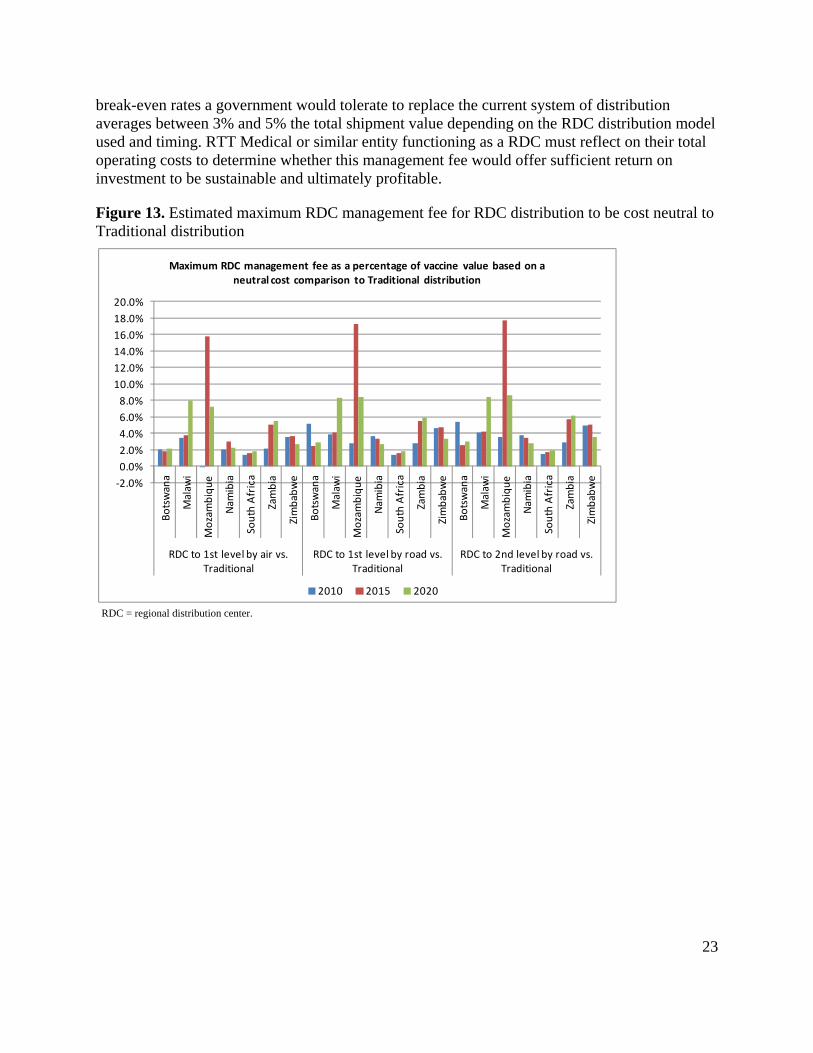
Estimated break-even cost of using an RDC
To calculate the break-even value in which RDC distribution becomes cost neutral when compared to Traditional distribution, the relative cost reduction offered by RDC distribution compared to Traditional distribution is divided by the annual value of vaccines distributed to give the estimated maximum RDC management fee (See Figure 13 and Table 6). The calculated
‐15.0 ‐10.0 ‐5.0 0.0 5.0
Botswana
Malawi
Mozambique
Namibia
South Africa
Zambia
Zimbabwe
Botswana
Malawi
Mozambique
Namibia
South Africa
Zambia
Zimbabwe
Botswana
Malawi
Mozambique
Namibia
South Africa
Zambia
Zimbabwe
RDC to 1st level by air
vs. Traditional
RDC to 1st level by
road
vs. Traditional
RDC to 2nd level by
road
vs. Traditional
Comparative reduction in total annual distribution cost (USD millions)
Relative cost comparison of Traditional versus RDC distribution by distribution scenario
2010 2015 2020
23
break-even rates a government would tolerate to replace the current system of distribution averages between 3% and 5% the total shipment value depending on the RDC distribution model used and timing. RTT Medical or similar entity functioning as a RDC must reflect on their total operating costs to determine whether this management fee would offer sufficient return on investment to be sustainable and ultimately profitable.
Figure 13. Estimated maximum RDC management fee for RDC distribution to be cost neutral to Traditional distribution
RDC = regional distribution center.
‐2.0%
0.0%
2.0%
4.0%
6.0%
8.0%
10.0%
12.0%
14.0%
16.0%
18.0%
20.0%
Botswana
Malaw
i
Mozambique
Nam
ibia
South Africa
Zambia
Zimbabwe
Botswana
Malaw
i
Mozambique
Nam
ibia
South Africa
Zambia
Zimbabwe
Botswana
Malaw
i
Mozambique
Nam
ibia
South Africa
Zambia
Zimbabwe
RDC to 1st level by air vs. Traditional
RDC to 1st level by road vs. Traditional
RDC to 2nd level by road vs. Traditional
Maximum RDC management fee as a percentage of vaccine value based on a neutral cost comparison to Traditional distribution
2010 2015 2020
24
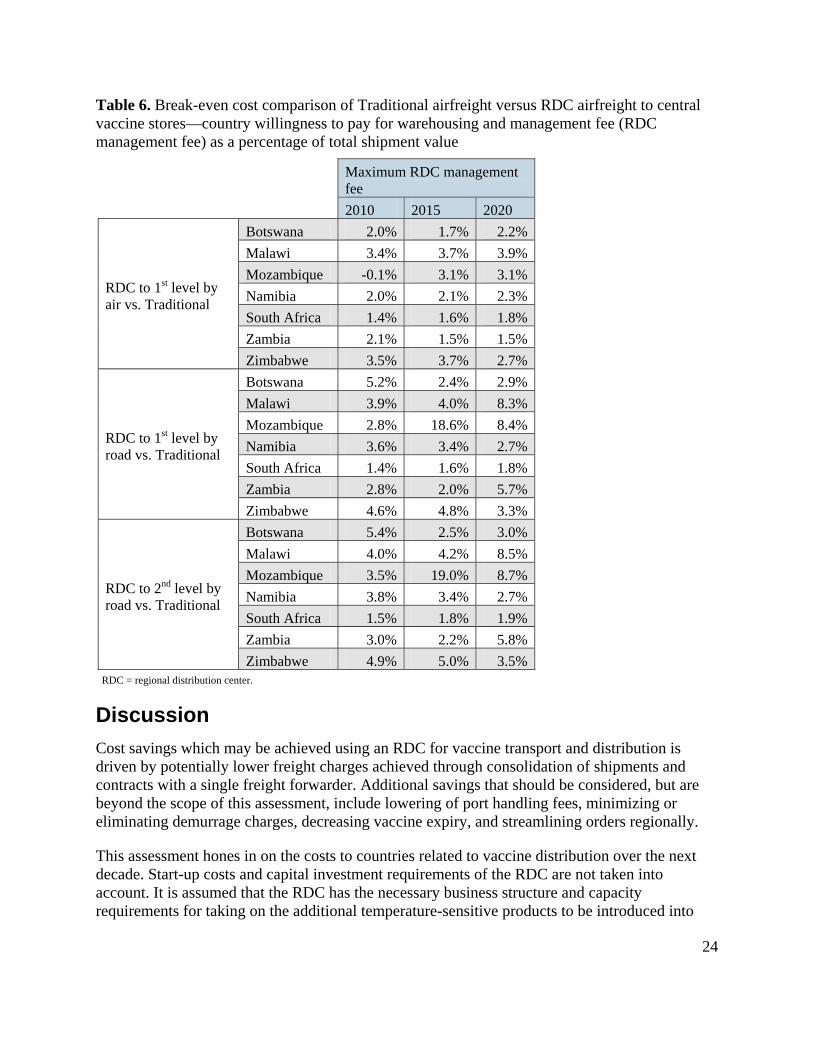
Table 6. Break-even cost comparison of Traditional airfreight versus RDC airfreight to central vaccine stores—country willingness to pay for warehousing and management fee (RDC management fee) as a percentage of total shipment value
Maximum RDC management fee
2010 2015 2020
RDC to 1st level by air vs. Traditional
Botswana 2.0% 1.7% 2.2%
Malawi 3.4% 3.7% 3.9%
Mozambique -0.1% 3.1% 3.1%
Namibia 2.0% 2.1% 2.3%
South Africa 1.4% 1.6% 1.8%
Zambia 2.1% 1.5% 1.5%
Zimbabwe 3.5% 3.7% 2.7%
RDC to 1st level by road vs. Traditional
Botswana 5.2% 2.4% 2.9%
Malawi 3.9% 4.0% 8.3%
Mozambique 2.8% 18.6% 8.4%
Namibia 3.6% 3.4% 2.7%
South Africa 1.4% 1.6% 1.8%
Zambia 2.8% 2.0% 5.7%
Zimbabwe 4.6% 4.8% 3.3%
RDC to 2nd level by road vs. Traditional
Botswana 5.4% 2.5% 3.0%
Malawi 4.0% 4.2% 8.5%
Mozambique 3.5% 19.0% 8.7%
Namibia 3.8% 3.4% 2.7%
South Africa 1.5% 1.8% 1.9%
Zambia 3.0% 2.2% 5.8%
Zimbabwe 4.9% 5.0% 3.5%RDC = regional distribution center.
Discussion
Cost savings which may be achieved using an RDC for vaccine transport and distribution is driven by potentially lower freight charges achieved through consolidation of shipments and contracts with a single freight forwarder. Additional savings that should be considered, but are beyond the scope of this assessment, include lowering of port handling fees, minimizing or eliminating demurrage charges, decreasing vaccine expiry, and streamlining orders regionally.
This assessment hones in on the costs to countries related to vaccine distribution over the next decade. Start-up costs and capital investment requirements of the RDC are not taken into account. It is assumed that the RDC has the necessary business structure and capacity requirements for taking on the additional temperature-sensitive products to be introduced into
25
countries. Variable costs incurred by the RDC are accounted for in the calculation of a break-even RDC management fee. This analysis assumes that given an existing profitable business serves as the RDC, a minimum number of countries need not subscribe to this RDC distribution system for it to be considered viable.
The analysis suggests that the cost savings achieved through consolidated shipments with an RDC averages between 3% and 5% of the total value of the vaccines shipped. The acting RDC would need to assess whether a comparable management fee would provide sufficient return on investment to warrant a profitable business. If the RDC were to take ownership of the vaccine stock upon leaving the manufacturer and potentially lower the handling fees, the value to countries may improve; however, the shipping cost savings alone are not sufficient.
Furthermore, through the advent of PEPFAR funds and the work of SCMS, a number of the central vaccine stores in the region have received additional cold room storage for temperature-sensitive antiretrovirals. In planning and installing new cold rooms, increased capacity needs for vaccines were considered. Additionally, new vaccine introduction in countries such as Zambia and Malawi have spurred donor investments in cold chain equipment. Therefore, leveraging an RDC to distribute more frequently to the central level or to distribute directly to second-level stores does not offer the financial savings hypothesized, as the investment in cold chain equipment is a sunk cost.
Under any adoption scenario, the potential RDC management fee would need to remain at less than the break-even value on a country-by-country basis to be considered feasible. The RDC may choose to adopt a weighted fee structure in order to cover costs for the region; however, the savings are not significant enough in any number of countries to warrant that strategy. Identification of alternative means for cost savings, such as through consolidation of medical supplies and pharmaceutical shipments with vaccines, may alter the cost savings to a country and a corresponding break-even RDC management fee.
Conclusions and recommendations
Leveraging an RDC is beneficial for countries distributing large volumes of vaccines and needing to invest in additional cold chain infrastructure to meet future capacity requirements. Fortunately, ramping up central vaccine store cold chain capacities is already underway in this region. Those countries that have not already committed to investing in cold chain infrastructure may be best positioned to consider leveraging an RDC for vaccine distribution.
As volumes and value of products increase over the next decade, the handling and distribution costs will increase dramatically. Consideration of a distribution fee based on a price per volume of goods instead of a percentage of the value of the goods may be more equitable.
Proposed next steps should include discussion of these findings with key vaccine supply stakeholders to reveal issues that may not have been considered under this initial assessment. Given the cursory nature of the assessment, a detailed analysis of interested countries’ supply chain needs and available funds should be undertaken. Confirmation of vaccine introduction assumptions and all costs associated with vaccine management at the central vaccine stores and
26
secondary vaccine stores should be collected. For example, human resources costs, vehicle costs, and warehouse operating costs need to be accounted for in order to understand the true impact of choosing to leverage an RDC versus building capacity internally. Additionally, defining the actual rates for international freight charged to the UNICEF Supply Division or a country would offer a more accurate representation of inbound costs versus the nonnegotiated market rates used in this assessment.
Finally, alternative RDC strategies which should be explored to potentially further reduce costs to countries but were beyond the scope of this assessment include: use of sea freight for inbound shipping, leveraging regional pooled procurement strategies transition to a handling and distribution fee structure based on a price per volume of goods instead of a percentage of the value of the goods, and consideration of government-organized RDCs.
27
Appendix 1. Vaccine regional distribution center model
RDC = regional distribution center; UNICEF = United Nations Children’s Fund.
28
Appendix 2. Scenarios of vaccine introduction
AVI = Accelerated Vaccine Introduction Initiative; BCG = Bacille Calmette-Guérin; DT = diphtheria-tetanus; DTP = diphtheria-tetanus-pertussis; EPI = Expanded Programme on Immunization; ETEC = enterotoxigenic Escherichia coli; HepB = hepatitis B; Hib = Haemophilus influenzae type b; IPV = inactivated polio vaccine; HPV = human papillomavirus; MenA = meningococcal A; MR = measles-rubella; OPV = oral polio vaccine; Td = tetanus-diphtheria (low-dose); TT = tetanus toxoid; UNICEF = United Nations Children’s Fund; WHO = World Health Organization; YFV = yellow fever vaccine.
Scenario 1: AVI prediction Scenario 2: Moderate Scenario 3: Aggressive
Vaccine Botswana MalawiMozam‐
biqueNamibia
South
AfricaZambia Zimbabwe Botswana Malawi
Mozam‐
biqueNamibia
South
AfricaZambia Zimbabwe Botswana Malawi
Mozam‐
biqueNamibia
South
AfricaZambia Zimbabwe
BCG X X X X X X X X X X X X X X X X X X X X X
BCG‐diluent X X X X X X X X X X X X X X X X X X X X X
Cholera
Dengue
Dengue‐diluent
DT X X X X X X X X X
DTP X X X X X X X X X X X X
DTP‐HepB‐Hib 2010 2002 2009 2010 2005 X 2010 2002 2009 2010 2005 X 2010 2002 2009 2010 2005 X
Pneumo 2012 2011 2012 2012 X 2011 2019 2012 2011 2012 2012 X 2011 2019 2012 2011 2012 2012 X 2011 2019
Rotavirus 2012 2012 2014 2012 X 2013 2019 2012 2012 2014 2012 X 2013 2019 2012 2012 2014 2012 X 2013 2019
Shigella
Td X X X
TT X X X X X X X X X X X X X X X X X X
Typhoid
YFV X X X 2016 2016 2016 2016 2016 2016
YFV‐diluent X X X 2016 2016 2016 2016 2016 2016
Key: Source: WHO‐EPI’s estimates of new vaccine uptake, July 2010
Source: WHO/UNICEF Joint Reporting Forms, 2007 and 2008
Assumes likely no adoption of vaccine before 2020
Model input
X Currently in the national immunization schedule
Year of Vaccine Introduction Year of Vaccine Introduction Year of Vaccine Introduction
29
Appendix 3. Airfreight rates from RDC to destination-country central vaccine store
Botswana Rate USD Namibia Rate USD
Agency fee & documentation Per event 315.21 Terminal handling Per Kg 0.14
Acquittal fee Per event 21.01 Airline split fee Per piece 1.80
Handling fee Per Kg 0.07 Transport Airport to Windhoek Per Kg 0.16
Airfreight to Botswana Per Kg 2.62 Customs clearance Per event 112.06
Fuel surcharge Per Kg 0.30 Trucking charges Per Kg 0.26
Security charge Per Kg 0.03 Facility fee % 4%
Airfreight to Namibia Per Kg 1.23
Fuel surcharge Per Kg 0.75
Malawi Rate USD Security charge Per Kg 0.13
Destination charges Per event 325.00
Airfreight to Malawi Per Kg 1.71
Fuel surcharge Per Kg 0.81 Zambia Rate USD
Security charge Per Kg 0.06 Final clearance Per Kg 0.31
Handling fee Per Kg 0.13
Delivery fee Per Kg 0.35
Mozambique Rate USD Agency fee Per event 62.50
Customs clearance Per event 187.50 Airfreight to Zambia Per Kg 1.23
ATP turboprop airliners Per Kg 0.93 Fuel surcharge Per Kg 0.75
Handling Per Kg 0.31 Security charge Per Kg 0.13
Airway bill Per event 25.00
Handover Per event 29.25
Agency fee Per event 125.00 Zimbabwe Rate USD
Storage charge Per Kg 0.08 Aviation ground services Per Kg 0.56
Terminal handling Per event 100.00 Aviation ground services storage Per event 125.00
Express fee Per event 62.50 Agency fee Per event 187.50
Delivery / Pick‐up Per event 312.50 Documentation fee Per event 31.25
Airfreight to Mozambique Per Kg 1.19 Communication fee Per event 31.25
Fuel surcharge Per Kg 0.75 Handling fee Per Kg 0.25
Security charge Per Kg 0.13 Express fee Per event 62.50
Airfreight to Zimbabwe Per Kg 1.31
Fuel surcharge Per Kg 0.75
Security charge Per Kg 0.13
30
Appendix 4. Country-specific vaccine supply chain
Note: Model assumes delivery to four main district stores. CMS = central medical store.
CMAM = Central de Medicamentors y Artigos Medicos;
LAM = airport in Maputo.
CMS = central medical store.
UCI = Unit for Child Immunization
(separate from central medical store).
CMS = central medical store.
Botswana
Airport Johannesburg
Airport Gaborone
CMS Gaborone
Bonded warehouse Johannesburg
District vaccine stores (n=24)
Health centers
Mozambique [CMAM]
Airport Maputo [LAM]
CMS Zimpeto
Province (n=4)
District vaccine stores (n=146)
Health facilities and health posts (n=1,246)
Namibia
Airport Johannesburg
Airport Windhoek
CMS Windhoek
Sub‐national medical stores (n=2)
Regional medical stores (n=13)
District medical stores
Health centers
Zambia
Airport Lusaka
UCI central vaccine store
Provincial vaccine stores (n=9)
District health stores (n=74)
Health centers (n=1,737)
Airport Johannesburg
Zimbabwe
Airport Harare
CMS Harare
Provincial vaccine stores (n=10)
District health stores (n=64)
Health centers (n=154)
Airport Johannesburg
South Africa
Airport Johannesburg
Biovac
Health depots (n=9)
District vaccine stores
Health facilities
31
Appendix 5. Methodology summary
Distribution method Traditional to 2nd level RDC to 1st level by air RDC to 1st level by road
RDC to 2nd level by road
Transport sequence Manufacturer to central vaccine store to second-level store
Manufacturer to RDC to central vaccine store
Manufacturer to RDC to second-level vaccine store
Manufacturer to RDC to second-level vaccine store
Inbound cost calculation (manufacturer to RDC or central vaccine store)
(Volume X shipping rate) + (value X handling fee)
(Volume X shipping rate) + (value X handling fee)
(Volume X shipping rate) + (value X handling fee)
(Volume X shipping rate) + (value X handling fee)
Inbound frequency of distribution (X per year)
4 4 4 4
Cold storage costs Cold chain volume required x cold chain capital investment required
Warehousing fee + country cold chain capital investment required
Warehousing fee + country cold chain capital investment required
Warehousing fee + country cold chain capital investment required
Outbound transport costs Transport using government 4x4s from central to second-level vaccine store
Transport using air from RDC to country central vaccine stores outside South Africa
Transport using outsourced refrigerated trucks from RDC to first-level vaccine store
Transport using outsourced refrigerated trucks from RDC to second-level vaccine store
Outbound frequency of distribution (X per year)
Current distribution frequency (Table 1)
12 12 12
RDC management feea (Total Traditional distribution cost - Total RDC distribution cost) / Value of goods distributed
a. Maximum management fee to allow for cost-neutral comparison to Traditional airfreight.
32
Appendix 6. Cost comparison of Traditional distribution to RDC distribution
Cost comparison of Traditional distribution to RDC distribution via air to central vaccine stores, with government road transport to second-level vaccine stores
Cost comparison of Traditional distribution to RDC distribution via road transport to central vaccine stores, with government road transport to second-level vaccine stores