Vaccines for Adults and the Elderly: Antinomy and Apologia Gregory A. Poland, MD, MACP Mary Lowell Leary Emeritus Professor of Medicine Distinguished Mayo Investigator Director, Mayo Vaccine Research Group Editor-in-Chief, VACCINE Mayo Clinic, Rochester, MN
Transcript
Vaccines for Adults and the Elderly: Antinomy and
Apologia Gregory A. Poland, MD, MACP
Mary Lowell Leary Emeritus Professor of Medicine Distinguished Mayo Investigator
Director, Mayo Vaccine Research Group Editor-in-Chief, VACCINE
Mayo Clinic, Rochester, MN
The Charge •Review specific childhood vaccines that
•Preventing disease in adults (US) • Single lifetime dose of TdaP • A dose of TdaP with every pregnancy
•Clinical trial studies performed in Germany, Sweden, and Italy revealed wP VE ranging from 60% - 83% for 3 doses and up to 94% after 4 doses – similar ranges for aP studies over the short-term
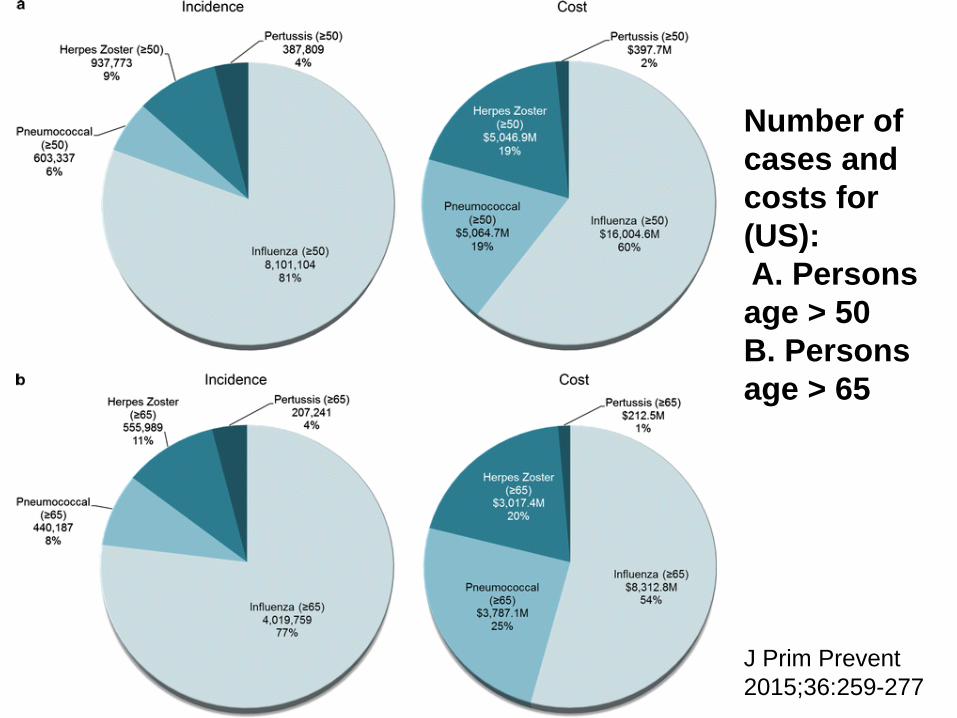
Number of cases and costs for (US): A. Persons age > 50 B. Persons age > 65
J Prim Prevent 2015;36:259-277
Burden of Disease
•Pertussis is endemic worldwide •WHO 2015 global modeling estimates
• 56,700 deaths in children < 5 y/o •50% of these deaths in Africa
• Overall, despite significant circulating disease in LMIC’s, no significant burden of severe disease/death in infants identified • Implication: maternal immunity levels
high
•Caveat – inadequate epi systems, lab dx, clinical dx and reporting, etc.
Clin Infect Dis 2016;63:S123-S133
aP Vaccine •In US, move from wP to aP in 1996 •California epidemic of 2010
• VE 41% (age 2-10 yrs) • VE 24% (age 8-12 yrs) • Odds of acquiring pertussis increased 42%
for every year following the 5th dose of DTaP • Children who got 4 doses of DTwP were 6x
less likely to get pertussis
•Reason • Waning immunity • ? B. pertussis adaptation under selective
•OIG study: “76% of pertussis-containing vaccines were stored improperly resulting in freezing or heating of vaccine”
•Either freezing or heating of the vaccine diminishes immunogenicity and therefore vaccine effectiveness and efficacy
U.S. Department of Health and Human Service Office of the Inspector General (OIG) report on Vaccines for Children (VFC) Program: Vulnerabilities in Vaccine management. June 2012.
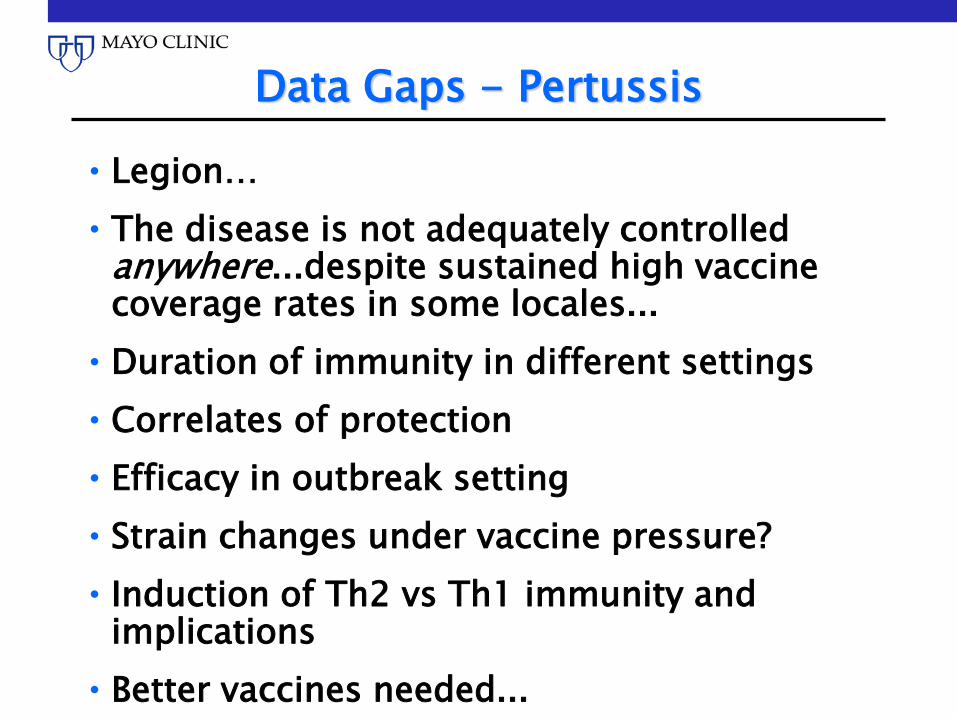
Data Gaps - Pertussis
•Legion… •The disease is not adequately controlled
anywhere...despite sustained high vaccine coverage rates in some locales...
•Duration of immunity in different settings •Correlates of protection •Efficacy in outbreak setting •Strain changes under vaccine pressure? • Induction of Th2 vs Th1 immunity and
implications •Better vaccines needed...
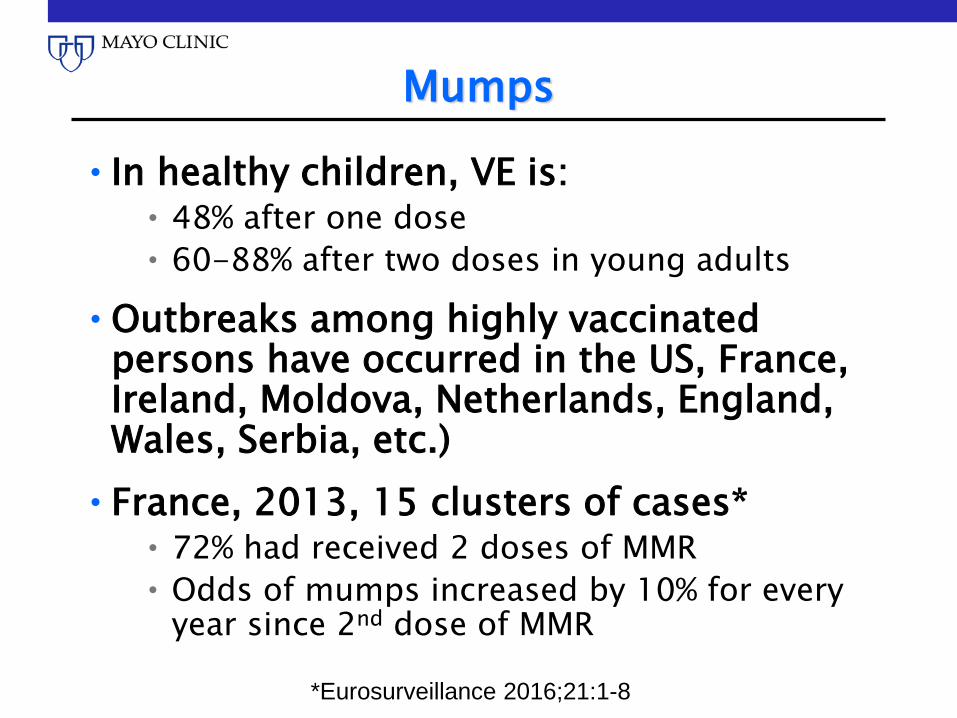
MMR: 1 Vaccine – 3 Diseases
•Vaccine licensure: • Live attenuated measles vaccine – 1963 • Live attenuated mumps vaccine – 1967 • Live attenuated rubella vaccine – 1969 • MMR 1971 • MMR-II - 1979
•MR, MMR •Preventing disease in adults (US)
• 2 dose series
MMR Issues
•Requires cold chain •Contraindications (live virus) •Interference by maternal antibody •Variable efficacy by antigen
• Primary failure • Secondary failure (waning)
MMR
•Vaccine available and inexpensive •Increased M&M as age increases from
childhood to adulthood – but large-scale data – esp. in LMIC’s missing
•Because of widespread disease in persons born prior to 1950’s, no longitudinal studies of long-term efficacy in “immunized-only” persons living in highly immunized settings where no wild virus boosting occurs
•Developing countries - disease generally worse, with CFR as high as 25% (vitamin A deficiency, malnutrition, immunosuppression, etc.)
•Primary and secondary vaccine failure
MMR – Primary Failure Rates
•Estimated among young healthy children at 3+% after 2 doses – some studies as high as 10%
•Inadequate data in LMIC settings and in patients with various immunocompromising diseases (malnutrition, HCV, chronic infectious disease burden, etc.)
MMR – Secondary Failure Rates
•Harder to estimate – insufficient data •Only 90-95% or less of healthy children
age-appropriately immunized have detectable MV antibody 10-15 years later
•The majority of subjects do not have markers of MV-CMI 15 years after a second dose, nor are these boosted by a 3rd dose
•M&M less than with primary failure
Measles - FSM • 393 cases of measles Feb-Aug 2014 • 2/3’s of cases among adults • Of those adults with vaccination records:
• 96% had documentation of at least one dose of MMR • 70% had documentation of at least 2 doses of MMR
• 124 subjects hospitalized - 1 death • Genotype B3 • Vaccine cold chain generally good • Vaccine failure played a major role
MMWR, Oct 2, 2015;64:1088-1091
Measles - FSM •VE study of MV (household study) •VE:
• 1 dose: 23.1% • 2 dose: 63.4% • 3 doses: 95.9%
•VE for doses prior to 2010 = 51-57% •VE for second doses received after 2010
• 90% of cases had received 1 dose of MMR • 68% had received ≥ 2 doses • 36% of cases in those ≥ 15 y/0
•VE for 1 dose: 92% •VE for 2 doses: 95%
Clin Infect Dis 2006;42:315-319
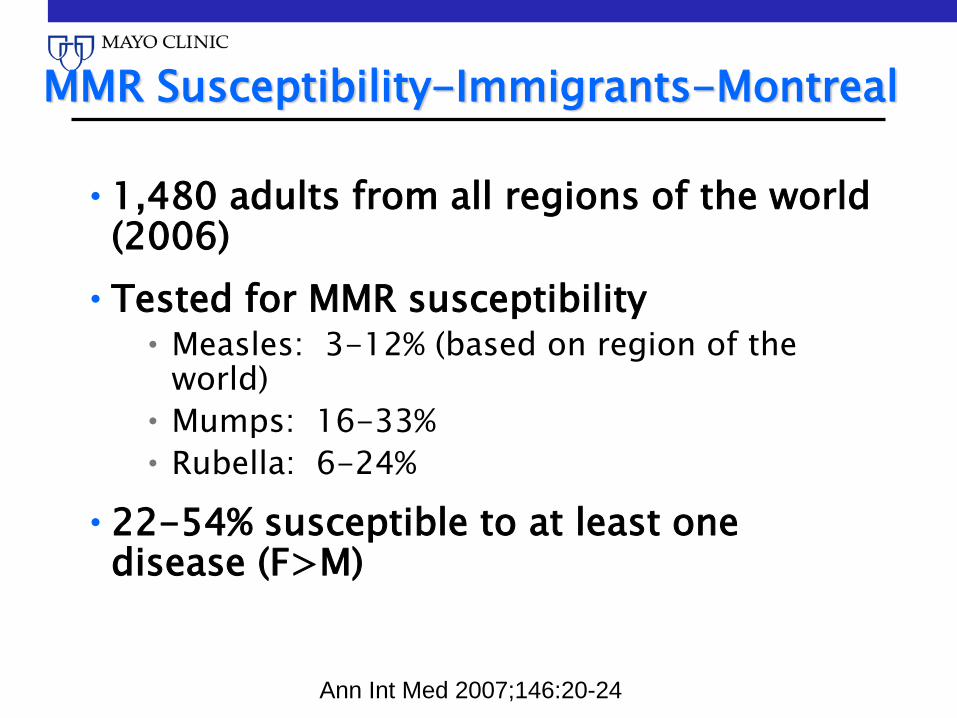
MMR Susceptibility-Immigrants-Montreal
•1,480 adults from all regions of the world (2006)
•Tested for MMR susceptibility • Measles: 3-12% (based on region of the
world) • Mumps: 16-33% • Rubella: 6-24%
•22-54% susceptible to at least one disease (F>M)
Ann Int Med 2007;146:20-24
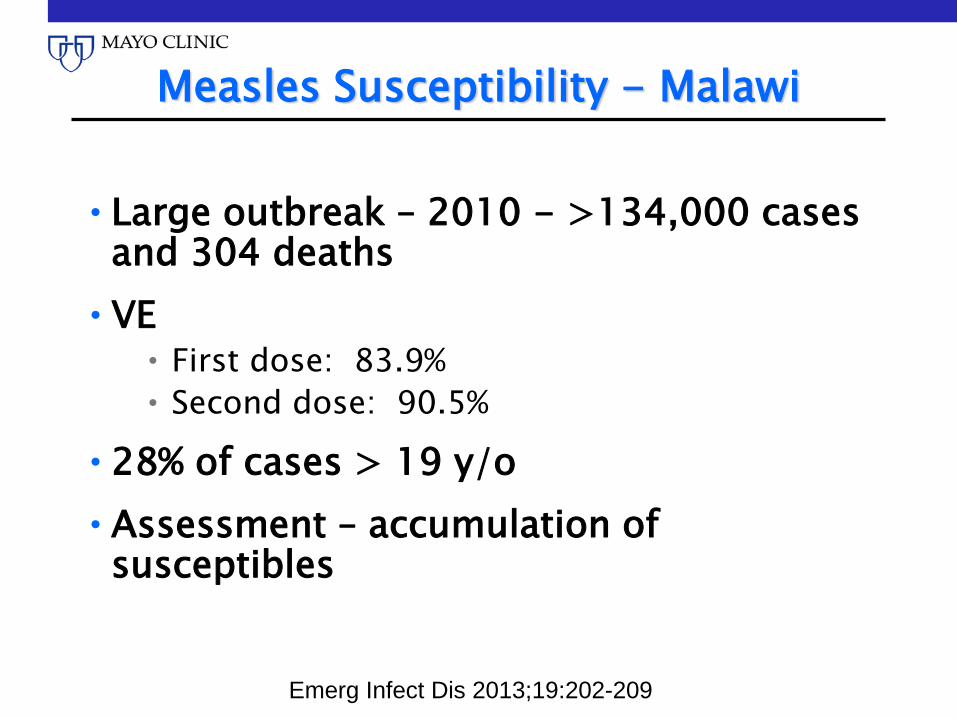
Measles Susceptibility - Malawi
•Large outbreak – 2010 - >134,000 cases and 304 deaths
•VE • First dose: 83.9% • Second dose: 90.5%
•28% of cases > 19 y/o •Assessment – accumulation of
susceptibles
Emerg Infect Dis 2013;19:202-209
Measles – China - HCWs
•2015 outbreak: 50/60 measles patients age 20-40 yrs, all HCWs (hospital-based)
•Cases: • One dose of vaccine: 44/60 (73.3%) • Two doses of vaccine: 1/60 (1.67%)
Canadian J Inf Dis and Med Micro 2016
Measles Vaccine Coverage, Vaccine Efficacy, and Cases in a Hypothetical Cohort of High School Children Exposed to a Measles Outbreak*
No. (%) of Students Immunized of 2,000
No. of Students Immune Because of Vaccine†
No. of Students Susceptible Who Get Disease When Exposed (% of Students)‡
% of All Measles Cases That Will Occur in Immunized Students◊
0 (0) 0 2,000 (100) 0
500(25) 475 1,525 (76) 1.6
1,000 (50) 950 1,050 (53) 5
1,500 (75) 1,425 575 (29) 13
1,800 (90) 1,710 290 (15) 31
1,900 (95) 1,805 195 (10) 49
1,960 (98) 1,862 138 (7) 71
1,980 (99) 1,892 108 (5.4) 94
2,000 (100) 1,900 100 (5) 100
*Assumes a school size of 2,000 students and an overall vaccine efficacy of 95%. † Number of students immunized times 0.95. ‡ Number of students not immunized plus number of vaccine failures. ◊ [(No. of vaccine failures)/(No. of students susceptible)]x 100. This assumes that all susceptible students develop measles when exposed.
Poland et. al. Arch Int Med 1994;154:1815-20
School Outbreaks of Measles in Highly Immunized Populations Source, year No. of
•Results: • 6 years later, gE-specific CD4 cells 3.8x
higher than baseline
Vaccine 2016;34:863-868
Data Gaps – Zoster Vaccines
•CMI correlate of protection •Define rates and mechanisms of primary
and secondary vaccine failure •How many life-time doses? •Sequencing of vaccine type for optimal
efficacy? Need vaccines without need for cold chain or with contraindications (immunocompromised, etc.)
•CE studies in LMICs •Others
Other Issues – Varicella/Zoster Vaccines
•Implementation and use in LMIC’s will be difficult:
• Cost of goods • Cold chain requirement • Need for 1-2 or more doses • Low cost-effectiveness ratios (> $100,000
for 2nd dose in the US) [for varicella vaccine] • Higher priority of other diseases with higher
M&M
Apologia Latin; defense,
answers
UN Sustainable Development Goal
“Ensure healthy lives and promote well-being
for all ages”
and what age they are…
Global Health 2035: Mission Grand Convergence
•Global Burden of Disease 2010 • 6,800,000 deaths due to infectious diseases • 91% of these deaths occur in LMIC’s • 60% of infectious disease deaths is from
diseases for which there are no vaccines
Vaccine 2017;35:A16-A19
“Every system is perfectly designed to achieve exactly the
results it gets."
Don Berwick, MD
Adult Immunization:
The Architecture of
Success
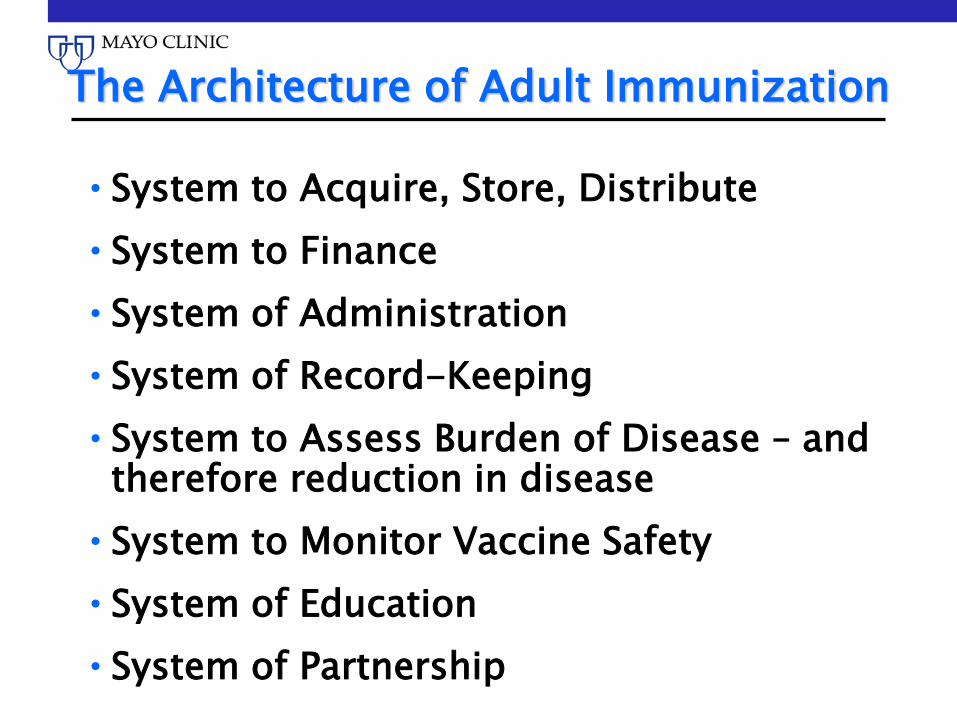
The Architecture of Adult Immunization
•System to Acquire, Store, Distribute •System to Finance •System of Administration •System of Record-Keeping •System to Assess Burden of Disease – and
therefore reduction in disease •System to Monitor Vaccine Safety •System of Education •System of Partnership
Make It Easy
•For LMIC’s the single most efficient change that could occur is to utilize existing systems and platforms to broaden immunization programs from a singular focus on children, to a “whole-life” program