C-1 significant restructuring efforts before and resulting from the merger, an important question is whether the changes will yield the benefits promised to shareholders and enable the firm to compete more effectively. The answers to these questions and oth- ers appearing in this case will influence Valeant’s future success. History Valeant Pharmaceuticals was founded in 1960 by Milan Panic, a Yugoslavian defector. The com- pany started in California and was originally called International Chemical & Nuclear Corp. (ICN). Panic ran the company for 43 years. 5 Initially, the company’s primary business involved chemical and drug sales, but it grew through acquisitions of small drug companies. In 1963, the company launched its IPO. 6 In 1970, ICN scientists discovered ribavirin and in 1985, gained U.S. Food and Drug Administration (FDA) approval for this drug to treat lung infections in children. As a blockbuster drug, ribavirin powered ICN’s growth and reputation for decades. 7 In later years, Panic directed ICN to promote ribavirin as a treatment for AIDS and for hepatitis C. 8 During the 1970s, ribavirin failed to qualify for FDA approval as a stand-alone hepatitis C drug. However, in the 1990s, ribavirin did receive FDA approval to be used in combination with Schering-Plough’s interferon drug to treat hepatitis C. The licensing of ribavirin’s patent to Schering-Plough was lucrative and led to a similar interferon/ribavirin royalty-generating agree- ment with Roche Pharmaceuticals. 9 The year 2002 was a watershed one in the his- tory of ICN. That year, Panic was paid $63.5 mil- lion, which included $33 million in bonuses, and Valeant Pharmaceuticals International, Inc. Introduction Valeant Pharmaceuticals International, Inc. pro- motes itself as a multinational specialty pharma- ceutical company with a diverse product portfolio focusing on branded pharmaceuticals, branded and unbranded generics, and over-the-counter (OTC) products specializing in neurology and der- matology. 1 Product sales focus on North America, Central Europe, Mexico, Brazil, and Australia, with manufacturing sites in Canada, Brazil, Poland, and Mexico. 2 In his 2006 message to shareholders, Timothy C. Tyson, then president and chief executive officer, reflected, “In many ways, 2006 was a life-changing year for Valeant Pharmaceuticals. It was a challeng- ing year—one that certainly stretched us and tested our resolve.” 3 That was the year that Valeant lost its chairman Robert W. O’Leary to cancer. Valeant would face a new set of challenges in the fall of 2010, when it merged with Canada’s Biovail Corporation. Although Valeant eventually recovered from the loss of chairman Robert W. O’Leary, would it be able to overcome the challenges of the merger and stra- tegically position itself to capture a significant por- tion of the global pharmaceutical market, which was expected to reach $1.1 trillion in 2014? 4 Although we give a brief history of Valeant here, this case focuses on the merger with Biovail and on Valeant’s neurology division. This division manu- factures and markets products to treat Parkinson’s disease (PD), epilepsy, migraines, depression, chronic pain, Huntington’s disease, and myasthenia gravis. A central question is whether Valeant will be able to capitalize on a growing demand for its new epilepsy drug retigabine and its other products as the result of an aging population. Also, due to Jason Arnold, Kari Froehlich, Mat McBride, Stanley Parker, Ann Utterback, Robin Chapman, Gail Christian / Arizona State University The authors thank Professors Robert E. White and Robert E. Hoskisson for their support and under whose direction the case was developed. The authors do not intend to illustrate either effective or ineffective handling of a managerial situation. The case solely provides material for class discussion. Reprinted by permission.
Transcript
C-1
significant restructuring efforts before and resulting from the merger, an important question is whether the changes will yield the benefits promised to shareholders and enable the firm to compete more effectively. The answers to these questions and oth-ers appearing in this case will influence Valeant’s future success.
History
Valeant Pharmaceuticals was founded in 1960 by Milan Panic, a Yugoslavian defector. The com-pany started in California and was originally called International Chemical & Nuclear Corp. (ICN). Panic ran the company for 43 years.5 Initially, the company’s primary business involved chemical and drug sales, but it grew through acquisitions of small drug companies. In 1963, the company launched its IPO.6
In 1970, ICN scientists discovered ribavirin and in 1985, gained U.S. Food and Drug Administration (FDA) approval for this drug to treat lung infections in children. As a blockbuster drug, ribavirin powered ICN’s growth and reputation for decades.7 In later years, Panic directed ICN to promote ribavirin as a treatment for AIDS and for hepatitis C.8 During the 1970s, ribavirin failed to qualify for FDA approval as a stand-alone hepatitis C drug. However, in the 1990s, ribavirin did receive FDA approval to be used in combination with Schering-Plough’s interferon drug to treat hepatitis C. The licensing of ribavirin’s patent to Schering-Plough was lucrative and led to a similar interferon/ribavirin royalty-generating agree-ment with Roche Pharmaceuticals.9
The year 2002 was a watershed one in the his-tory of ICN. That year, Panic was paid $63.5 mil-lion, which included $33 million in bonuses, and
Valeant Pharmaceuticals International, Inc.
Introduction
Valeant Pharmaceuticals International, Inc. pro-motes itself as a multinational specialty pharma-ceutical company with a diverse product portfolio focusing on branded pharmaceuticals, branded and unbranded generics, and over-the-counter (OTC) products specializing in neurology and der-matology.1 Product sales focus on North America, Central Europe, Mexico, Brazil, and Australia, with manufacturing sites in Canada, Brazil, Poland, and Mexico.2
In his 2006 message to shareholders, Timothy C. Tyson, then president and chief executive officer, reflected, “In many ways, 2006 was a life-changing year for Valeant Pharmaceuticals. It was a challeng-ing year—one that certainly stretched us and tested our resolve.”3 That was the year that Valeant lost its chairman Robert W. O’Leary to cancer. Valeant would face a new set of challenges in the fall of 2010, when it merged with Canada’s Biovail Corporation. Although Valeant eventually recovered from the loss of chairman Robert W. O’Leary, would it be able to overcome the challenges of the merger and stra-tegically position itself to capture a significant por-tion of the global pharmaceutical market, which was expected to reach $1.1 trillion in 2014?4
Although we give a brief history of Valeant here, this case focuses on the merger with Biovail and on Valeant’s neurology division. This division manu-factures and markets products to treat Parkinson’s disease (PD), epilepsy, migraines, depression, chronic pain, Huntington’s disease, and myasthenia gravis. A central question is whether Valeant will be able to capitalize on a growing demand for its new epilepsy drug retigabine and its other products as the result of an aging population. Also, due to
Jason Arnold, Kari Froehlich, Mat McBride, Stanley Parker, Ann Utterback,
Robin Chapman, Gail Christian / Arizona State University
The authors thank Professors Robert E. White and Robert E. Hoskisson for their support and under whose direction the case was developed. The authors do not intend to illustrate either effective or ineffective handling of a managerial situation. The case solely provides material for class discussion. Reprinted by permission.
other senior executives received bonuses of $15 million.10 A shareholder proxy fight over excessive executive compensation resulted in the replacement of Panic, the entire board of directors, and most of senior management.11 In the summer of 2006, Panic reached a settlement with the company to return $20 million of his 2002 annual bonus.12
In 2003, ICN changed its name to Valeant Pharmaceuticals International and relisted its stock symbol on the New York Stock Exchange as VRX. The name change signified Valeant’s new strategic focus and emphasized its core principles and values. This change was made in conjunction with restruc-turing. Valeant’s restructuring efforts focused on the following activities: centralization of global purchas-ing activities serving to leverage buying power on a global basis;13 rationalization of Valeant’s manu-facturing network; and restructuring of debt, result-ing in a longer maturity structure and decreasing the effective interest rate.14 These activities allowed Valeant to raise cash for its 2004 and 2005 acqui-sitions.15 Valeant expanded its specialty neurology platform by acquiring Amarin Pharmaceuticals, Inc., Xcel Pharmaceuticals, and Tasmar (a neurol-ogy drug).16
In 2004, Valeant improved its financial outlook by purchasing and redeeming its 6.5 percent con-vertible subordinated notes.17 However, it experi-enced a financial reversal when the FDA approved a generic version of ribavirin. At its peak, ribavirin royalties comprised a quarter of all sales; but after the generic version appeared on the market, they only accounted for 6 percent of revenues in 2009 (see Exhibit 1). This revenue stream would diminish further when generic drug competition entered the Japanese and European markets in 2010.18
In 2006, Valeant announced another strategic restructuring program intended to reduce costs,
grow earnings, and focus research and development (R&D) resources on late-stage pipeline drugs. To accomplish these goals, Valeant reduced headcount19 and sold its manufacturing facility in Poland, its dis-covery and preclinical assets, and its cancer and HIV drug development programs.20 These actions pro-duced cost savings of $30 million during 2006, and an estimated $50 million annually thereafter.
Also in 2006, Valeant obtained FDA permis-sion to market and launch two drugs in the United States; the cannabinoid drug Cesamet® (used to treat nausea and vomiting associated with cancer chemo-therapy) and Zelapar® to treat PD. It also acquired the hepatitis C drug Infergen® from Intermune.
In the beginning of 2007, Valeant sold its man-ufacturing plants in Switzerland and Puerto Rico. Then in late 2007, it sold Infergen® because it had not met growth and profitability expectations.21 Also in 2007 Valeant initiated a study of retigabine for pain associated with postherpetic neuralgia, and a Phase 2b clinical study of taribavirin, for treat-ment of chronic hepatitis C.22
In 2008, the company experienced some sig-nificant changes in structure and strategic direction as it went through another change in leadership; J. Michael Pearson became the new chairman and CEO. In March 2008, Valeant announced a company-wide restructuring plan to reduce the company’s focus to two therapeutic classes (der-matology and neurology) and five geographic areas (the United States, Canada, Australia/New Zealand, Mexico/Brazil, and Central Europe). The business infrastructure was adjusted to support this strat-egy. Nonstrategic products and regional operations that did not meet growth and profitability expec-tations were divested or discontinued. Infergen® rights; Asian assets (including subsidiaries, branch offices, and commercial rights in Singapore, the
Philippines, Thailand, Indonesia, Vietnam, Taiwan, Korea, China, Hong Kong, Malaysia, and Macau), product rights in Japan; subsidiaries in Argentina and Uruguay; and business operations located in Western and Eastern Europe, the Middle East, and Africa (known as the “WEEMEA” business) were sold.23 Under Pearson, Valeant’s growth strategy focused on “small buys and diversified drugs, avoid-ing too much reliance on a single drug.”24 Valeant continued its strategy of growth through acquisitions with Coria Laboratories, Ltd. (a privately held U.S. specialty pharmaceutical company focused on derma-tology products), DermaTech Pty Ltd (an Australian specialty pharmaceutical company focused on dermatology products marketed in Australia), and Dow Pharmaceutical Sciences, Inc. (a privately held dermatology company that specialized in the devel-opment of topical products).25 According to Pearson, “Dermatology, we think, is a very attractive area for us to continue to grow as a smaller company. Skin drugs carry less development risks and don’t require a big sales force in order for Valeant to compete with larger players.”26 In addition, it suc-cessfully completed the retigabine Phase III epilepsy program and announced a worldwide license and collaboration agreement with GlaxoSmithKline (GSK) for the development and commercialization of retigabine.27
As part of the 2008 restructuring plan, Valeant also cut its R&D budget by half. Such a move is generally considered unwise in the pharmaceutical industry, as profitability depends heavily on the development of new drugs.28 Valeant decided to use the funds resulting from the budget cut for acqui-sitions and stock buybacks, in addition to paying off debt. Research was considered so risky it was best left to small biotechnology companies, which Valeant could later buy if they were successful.29 Robert Ingram, Valeant’s lead director (now chair-man of the board) and vice chairman of pharmaceu-ticals at GSK, believed that R&D “is a high-risk bet, and the fact is we fail more often than we succeed. Rather than invest in a high-risk bet, we will be smart through acquisition and licensing.”30 The strategy appeared to pay off as Valeant shares increased 60 percent on the New York Stock Exchange during 2008.31
More acquisitions followed in 2009, including EMO-FARM sp. z o.o. (a privately held Polish com-pany specializing in gel-based OTC and cosmetic products), Tecnofarma S.A. de C.V. (a Mexican generic company), Private Formula Holdings Inter-
national Pty Limited (a privately held company in Australia engaged in product development and sales and marketing of premium skincare products mostly in Australia), and Laboratoire Dr. Renaud (a privately held cosmeceutical company located in Canada). The year 2009 was also the year that the FDA accepted the New Drug Application (NDA) filing for retigabine.32 As external R&D expenses for taribavirin were $2.3 million in 2009 and $8.5 mil-lion in 2008, Valeant chose to stop further indepen-dent development of taribavirin and seek potential partners for the program.33
In 2010 Valeant acquired three Brazilian com-panies (Instituto Terapeutico Delta Ltda, Bunker Industria Farmaceutica Ltda, and a branded gener-ics/OTC company), along with Vital Science Corp. in Canada and Aton Pharma, Inc., located in Lawrenceville, New Jersey. Aton, a specialty phar-maceutical company, focused on ophthalmology and “orphan drugs” that are used to treat rare medical conditions.34 The Aton acquisition was considered to be a significant enhancement to Valeant’s neurology and other products as it had both an in-line business and a development pipeline that mainly consisted of orphan drugs.35 In addition, Valeant entered collaboration with Spear Pharmaceuticals. In June 2010, Valeant announced plans to merge with the Canadian pharmaceutical company Biovail. Then, on September 28, 2010, Valeant Pharmaceuticals International and Biovail Corporation completed the merger to form one company.36
The M erger
Although the merger was officially announced in June 2010, Valeant and Biovail Corporation, one of Canada’s largest pharmaceutical companies, had been independently considering a business combina-tion or transaction with the other for several years. Management of each company was generally famil-iar with the other’s businesses, and in early 2008, when Valeant implemented its new strategy focused on shifting investment from R&D to acquiring small in-line undervalued products and companies, it also considered a transformational business combination to apply the new strategy to a larger asset base, with the goal of increasing shareholder value. It identified Biovail as a future potential transaction partner. In August 2009, Pearson contacted William M. Wells, CEO of Biovail, to discuss a transaction involving a Valeant neurological product, based on Biovail’s
primary focus on specialty neurology. Discussion continued throughout 2009 and in January 2010 shifted to a potential merger. In June 2010, the board of directors of each company approved the finalized agreement, and on June 21 Valeant and Biovail issued a joint press release announcing the merger37 (see Exhibit 2 for information on Valeant’s overall approach to the timing of the merger).
The deal, a reverse merger worth approximately $3.2 billion, would allow Biovail to acquire Valeant. Biovail shareholders would own 50.5 percent of the combined company and Valeant shareholders would own 49.5 percent.38 The combined company would be listed on both the Toronto Stock Exchange and the New York Stock Exchange. Just prior to the merger, Valeant shareholders would receive a one-time special dividend of $16.77 per share, and would receive 1.7809 shares of Biovail common stock in exchange for each share of Valeant stock owned. Biovail shareholders would continue to own their existing common shares. The transaction was intended to qualify as a tax-exempt reorganization for Valeant shareholders.39 After the merger, in November 2010 Valeant declared a special one-time dividend of $1.00 per common share, as outlined in the merger agreement. The company stated that
it did not anticipate paying dividends in the future. The board also established a Special Dividend Reinvestment Plan in which shareholders could elect to reinvest the special dividend in additional com-mon shares. This plan would automatically termi-nate after payment of the dividend.40
Under terms of the merger, the name of the com-bined company would be Valeant Pharmaceuticals International, Inc., and it would be headquartered in Mississauga, Ontario, Canada, where corpo-rate income taxes were 18 percent federal and 14 percent provincial, as opposed to a location in the United States where the corporate tax rate was 35–40 percent with a state tax rate of approximately 8 percent.41 Pearson would become CEO and Wells would serve as nonexecutive chairman of the board of directors.42 The initial composition of the board of directors would be 11 directors including five representatives from Valeant, five representatives from Biovail, and one additional resident Canadian director who would be selected through a search process, chosen by Valeant subject to the approval of Biovail.43 Biovail’s corporate structure would be retained.
The merge was considered a positive move by both companies. Biovail CEO William Wells said
Exhibit 2 Valeant Pharmaceuticals International Merger Plan
Source: Valeant Pharmaceuticals International, Inc. Third Quarter Earnings Call, November 4, 2010.
that Biovail had always planned to add a second therapeutic area, along with international markets, once it had established a position in specialty neu-rology, and it had been acquiring products in vari-ous stages of development in that area for the past few years. According to Wells, “With this deal, we have accomplished that in one fell swoop. We’ve achieved with this deal what I only hoped we’d be able to do in ten years.”44 Additional benefits of the merger include:45
• a larger, more globally diversified company would be created, with a broader and better diversified range of products, a deeper drug development pipeline and an expanded presence in North America and internationally;
• the combination of two well-known and respected specialty pharmaceutical companies could create a superior combined specialty phar-maceutical company;
• the expected market capitalization, strong bal-ance sheet, free cash flow, liquidity, and capital structure of the combined company;
• the belief that the combined company could achieve approximately $175 million in annual operational cost savings (synergy benefits) by the second year of operations, coming from reduc-tions in general and administrative expenses, R&D consolidation and sales and marketing;
• Valeant’s and Biovail’s product lines and geo-graphic markets were complementary and did not present significant areas of overlap;
• additional revenue growth opportunities pre-sented by the expanded product offerings and stable cash flows from legacy products antici-pated to support future growth with limited patent exposure with respect to the existing port-folio of products;
• the combination of two strong senior manage-ment teams;
• the combined company would be able to operate under Biovail’s existing corporate structure.
Valeant and Biovail would have to obtain gov-ernmental and regulatory approvals prior to closing the merger. Notifications were required by the FTC and the Antitrust Division of the Department of Justice, and a mandatory premerger waiting period would need to be observed. The merger was not notifiable under the Competition Act in Canada. A premerger notification was required in Poland under the Competition and Consumer Protection Act, and in Mexico under the Federal Economic Competition
Law.46 All approvals were obtained successfully, and on September 27, 2010, the shareholders of Valeant Pharmaceuticals International and Biovail Corporation voted in favor of combining the two companies.47
After the merger, Pearson began a new restruc-turing plan for the combined company. Valeant targeted 1,100 jobs (approximately 25 percent of the combined workforce) that were considered “redundant” for elimination. By January 2011 approximately 500 employees received notifica-tion48 (see Exhibit 3 for information on Valeant’s planned workforce reductions). Valeant also elimi-nated eight or nine R&D programs to focus on its strategy of growth through acquisitions of small companies rather than creating new products itself. “What we try to do is find these things, most of these companies no one’s ever heard of and we like that,” said Pearson. “We try to buy them inexpen-sively. Our average price since I’ve been here is 1.8 times sales.” Pearson also said that the com-pany would like to make at least five acquisitions in 2011.49
On February 1, 2011, Valeant and PharmaSwiss S.A. announced an agreement for Valeant to acquire PharmaSwiss, a privately owned pharmaceuti-cal company based in Zug, Switzerland specializ-ing in branded generics and OTC pharmaceuticals. Valeant agreed to pay approximately 350 million euros. PharmaSwiss has a product portfolio in seven therapeutic areas and operations in 19 countries throughout Central and Eastern Europe includ-ing Poland, Hungary, the Czech Republic, and Serbia. It also has operations in Greece and Israel.50 On February 3, 2011, Valeant launched an offer-ing of $650 million aggregate principal amount of 6.750 percent senior unsecured notes due 2021. Proceeds from the offering would be used to finance the PharmaSwiss acquisition and also the acquisi-tion of all U.S. and Canadian rights to nonophthal-mic topical formulations of Zovirax (an antiviral drug) from GSK, along with associated fees and expenses, and for general corporate purposes.51 The acquisition of PharmaSwiss was expected to close in the first or second quarter of 2011. According to Pearson, “This acquisition of PharmaSwiss solidi-fies our position as a leading pharmaceutical com-pany in Central and Eastern Europe. PharmaSwiss has an attractive partnering strategy as well as a complementary branded generics and OTC product portfolio that will strengthen our presence in the region.”52
CEO Pearson, formerly with McKinsey & Company, had the leadership skills and abilities required to lead Valeant through the merger process and into its next phase of development efficiently and effectively.
Leadership
In 2002, because of shareholder disgruntlement, Robert W. O’Leary replaced Panic as the new CEO and chairman of the board. O’Leary was well-respected in the health care industry, having served as CEO of six different companies in 28 years prior to joining Valeant. He specialized in managing dif-ficult restructuring circumstances. His job was to undertake a complete strategic restructuring of Valeant. The goal was to create a leaner company that emphasized the specialty pharmaceutical busi-ness. In pursuit of this goal, noncore businesses not fitting with future strategic growth plans were divested. The divestiture process began by eliminat-ing all operations in Russia and Eastern Europe and the raw materials businesses in Central Europe. The biomedical division, the North American photon-ics business, personal radiation dosimetry division, and the Circe unit were also immediately divested.
The company’s real estate holdings in Costa Mesa, California were sold in 2006 and the headquar-ters moved to a new, leased campus in Aliso Viejo, California.53
O’Leary formed a new management team, with the majority of his senior personnel recruits remain-ing in place for many years. The change in the compo-sition of the board of directors was dramatic. Nearly all of the new board members were not employed by the company and had no previous consulting or other business relationship with Valeant. A pri-mary goal of the new board was to institute new corporate governance initiatives to make the board independent and transparent.54 O’Leary remained with the company until his death from cancer in 2006.55
In January 2005, Timothy C. Tyson took over as Valeant’s CEO when O’Leary became too sick to manage the firm on a daily basis. Tyson had been hired as the president and chief operating officer. Before coming to Valeant, Tyson was president of global manufacturing and supply for GSK, the third-largest pharmaceutical company in the United States at that time. The connection to GSK is note-worthy because, at the time, many members of senior management were alumni of that company.
Exhibit 3 Valeant Pharmaceuticals International, Inc. U.S. and Canada Personnel Reductions
Source: Valeant Pharmaceuticals International, Inc., Third Quarter Earnings Call, November 4, 2010.
This influx of GSK alumni in management helped to accelerate needed culture changes, many derived from GSK.
In February 2008, Tyson resigned as CEO and J. Michael Pearson was selected as the successor. Pearson was head of McKinsey & Company’s global pharmaceutical practice and head of its mid-Atlantic region. Pearson held various positions at McKinsey during his 23-year career, including membership on McKinsey’s board of directors.56 At McKinsey, Pearson worked with leading CEOs to develop and implement major turnarounds, acquisitions and cor-porate strategy. Pearson was already providing advice and guidance to Valeant prior to Tyson’s departure.
Pearson’s pay package, a sharp contrast to Panic’s, was developed by G. Mason Morfit, chair-man of Valeant’s board compensation committee. Morfit was also a partner of Value-Act Capital, an “activist hedge fund” with a 22 percent stake in Valeant, which made it Valeant’s largest stock-holder.57 The pay package focused on giving Pearson incentives to increase long-term value for investors and was considered unusual for a public company. Morfit explained to Pearson and the other finalists for the CEO position that he preferred the private equity model for executive compensation “because it aligns management’s incentives with those of the investor.” He later recalled that “Nobody was scared off.”58 This drew national attention and praise from compensation critics.59 Pearson was awarded $18.1 million in equity but was also required to buy at least $3 million in stock and would not receive rou-tine annual equity grants. He would not be allowed to sell most restricted shares or exercise stock options for two years after they vested and would only get to keep certain restricted shares if Valeant’s share price increased by at least 15 percent per year through February 2011. Pearson actually purchased $5 million in Valeant shares.60 Pearson and the board of directors then adopted the same approach for new senior executives. They were required to buy large amounts of company stock, which limited candidates to “affluent risk takers.” According to Pearson, already successful people were willing to take less guaranteed pay up front.61
Although this pay plan model was not a guaran-tee of success, by May 2010 Valeant’s shares were up 40 percent since the end of the 2009 fiscal year, with a market value of approximately $3.5 billion and a first-quarter adjusted profit of $52.8 million (up 39 percent from the previous year). Valeant had also posted a 40 percent gain in 2009.62 According
to analyst David Amsellem of Piper Jaffray & Co., “It is time for us to concede that the run in the stock is no fluke and that investors are likely to view this management team with increasing confidence given its execution over the past one to two years.”63
After the merger Pearson became the CEO of the combined company, Valeant Pharmaceuticals International, Inc. He agreed to waive the acceler-ated vesting of the equity awards he would have been entitled to in association with the merger. A significant portion of his future compensation would be in the form of equity in the company and would be contingent on the performance of the com-pany’s common shares.64
Although Pearson has continued in his role as CEO of the combined company, William Wells re-signed from his position as nonexecutive chairman in December 2010. One week after Wells’ resigna-tion CFO Peggy Mulligan also resigned. Although the reasons for both resignations were stated as “to pursue other interests,” analysts said that old Valeant personnel had dominated the combined company, and the changes were viewed as part of the new direction and strategy of the new company.65 Philip W. Loberg, Valeant’s former senior vice president and corporate controller, was appointed Interim CFO replacing Mulligan,66 and Valeant’s Lead Independent Director Robert A. Ingram was appointed as Chairman of the Board of Directors.67 Exhibit 4 shows listing of Valeant’s current manage-ment team members, which includes executives from both legacy Valeant and legacy Biovail. Pearson and Valeant’s management team continue to work together to help Valeant reach its potential in pro-viding products that would offer relief to customers and generate revenue.
Produc t Overview
As noted in the introduction, this case focuses on the neurology division—a division that develops products to treat PD, epilepsy, migraines, and other central nervous system disorders.
Parkins on’s Disease
PD, a disorder characterized by slow movement, rigidity, and tremor, affects more than one million Americans.68 Most people are diagnosed with PD in the later years of life. It is estimated that four to six million people around the world currently have PD, including one million people in the United States.
Approximately 50,000–60,000 new cases are diag-nosed each year.69 As the U.S. population ages and lives longer, PD is expected to “rise astronomically in the coming decades.”70 Valeant’s PD drugs include Zelapar® and Tasmar®. Both products are approved for use as an adjunctive treatment with levadopa/carbidopa (l-dopa), a product every patient with PD eventually takes.
Valeant gained Zelapar® through the acquisition of Xcel Pharmaceuticals. Zelapar® offers patients
the ease of once-daily dosing, as compared to other medications used to treat PD, which are dosed mul-tiple times per day.71 Two other products that com-pete in the same market are Teva’s Azilect® and the generic drug selegiline.
Tasmar® is a COMT-inhibitor.72 It is used as a last resort option in the pharmaceutical treatment algorithm, since it has a “black box” warning that requires patients to monitor their liver functions on a biweekly basis. Tasmar® was initially launched in
Exhibit 4 Valeant Pharmaceuticals International, Inc. Leadership
Board of Directors
Robert A. IngramChairmanGeneral Partner, Hatteras Venture PartnersFormerly Lead Director of the Valeant board of directors
J. Michael PearsonChief Executive Offi cer, Valeant Pharmaceuticals International, Inc.Formerly Chairman of the Valeant board of directors and Chief Executive Offi cer of Valeant
Kate StevensonCorporate Director
Lloyd SegalEquity Partner, Persistence Capital PartnersFormerly a member of the Biovail board of directors
Norma A. ProvencioPresident and Owner, Provencio Advisory Services Inc.Formerly a member of the Valeant board of directors
Robert N. PowerCorporate DirectorFormerly a member of the Biovail board of directors
G. Mason Morfi tPartner, ValueAct CapitalFormerly a member of the Valeant board of directors
Dr. Laurence PaulFounding Principal, Laurel Crown Capital LLCFormerly a member of the Biovail board of directors
Michael R. Van EveryRetired Partner of Price Waterhouse Coopers LLPFormerly Chairman of the Audit Committee of the Biovail board of directors
Theo Melas-KyriaziChief Financial Offi cer, Levitronix LLCFormerly a member of the Valeant board of directors
Senior Management
J. Michael PearsonChief Executive Offi cer, Valeant Pharmaceuticals International, Inc.Formerly Chairman of the Valeant board of directors and Chief Executive Offi cer of Valeant
Philip W. Loberg Executive Vice President and Chief Financial Offi cerFormerly Senior Vice President, Group Financial Controller for Valeant
Robert Chai-OnnExecutive Vice President, General Counsel and Corporate SecretaryFormerly Vice President, Assistant General Counsel, of Valeant
Mark DurhamSenior Vice President, Human ResourcesFormerly Senior Vice President, Human Resources of Biovail Corp.
Rajiv De SilvaPresident, Valeant Pharmaceuticals International, Inc. and Chief Operating Offi cer, Specialty PharmaceuticalsFormerly Chief Operating Offi cer of Specialty Pharmaceuticals for Valeant
Richard K. MastersonPresident of Biovail Laboratories International in Barbados, a wholly-owned subsidiary of Valeant Pharmaceuticals, International.
1997 by Roche Pharmaceuticals, but due to three patient deaths in 1998, it stopped promoting it. Valeant acquired the product in May 2004 in an effort to expand its presence in the neurology mar-ket.73 The only other COMT-inhibitor on the mar-ket is Novartis’s Comtan®.
Epilepsy
Approx imately 3 million Americans are living with epilepsy, a disorder caused by the hyperactivity of electrical charges in the brain, and “approxi-mately 200,000 new cases of seizures and epilepsy occur each year.”74 However, an estimated 30 per-cent of patients with epilepsy do not find suffi-cient relief with current drugs. Analysts forecast that the annual sales of medicines to treat epilepsy would range from $200 million to $800 million in 2011.75
Valeant’s Diastat® Acudial™ is the only FDA-approved medication approved for at-home acute seizure control; as such, it does not have any direct competitors. However, the delivery system is unat-tractive to patients,76 and Valeant is developing a new delivery system where the drug would be administered intranasally.
Retigabine, referred to as ezogabine in the United States, is a neuronal potassium channel blocker that is a possible treatment for adult partial-onset sei-zures in combination with other antiepileptic prod-ucts. It is also used for postherpetic neuralgia pain.77 In December 2010, retigabine received preliminary approval from the Swiss Agency for Therapeutic Products, Swissmedic, and on January 21, 2011, Valeant and GSK announced that the European Medicines Agency’s Committee for Medicinal Products for Human Use (CHMP) recommended marketing authorization for retigabine.78 In the United States, retigabine’s NDA is under review by the FDA. Until the NDA has been approved by the FDA, retigabine cannot be commercialized in the United States.79
Migraines
Migraines affect 28 million Americans, and are characterized by severe headaches, with side effects including nausea, vomiting, and sensitivity to light or sound. Migranal® is Valeant’s migraine medica-tion and the only product available in its medication class. Migranal® is administered intranasally, which is an advantage for patients who experience nausea
or vomiting. Valeant gained the rights to Migranal® through the acquisition of Xcel.
Myasthenia Gravis
Myas thenia gravis is a rare disease that only affects 13,600 Americans. It is a neuromuscular disorder that affects the body’s voluntary muscles. It is often characterized by a drooping eyelid or loss of facial movements. Unfortunately, the low incidence of myasthenia gravis provides little financial incen-tive for pharmaceutical companies to invest in drug development. Mestinon® is Valeant’s approved, but not promoted, drug for myasthenia gravis.
As a result of the merge, Valeant added the following key neurology products to its portfo-lio: Wellbutrin® XL for depression, Ultram® ER for chronic pain management, Xenazine® for the reduction of involuntary movements caused by Huntington’s disease, and Ativan® for the treatment of anxiety disorders.80
Valeant also has products in its development pipeline. These products include retigabine (for treat-ing epilepsy and pain), taribavirin (for chronic hepa-titis C), and several dermatology drugs for treating rosacea, acne, and dermatological fungus. Valeant plans to expand its pipeline with the addition of new compounds and product extensions through com-pany and product acquisitions81 (see Exhibit 5 for information on the products in Valeant’s product development pipeline).
In order to remain competitive and to achieve its vision of becoming the “leading specialty pharma-ceutical company in the world,”82 Valeant needs to be aware of its competitors and their products.
Competitive Environment
In the United States, approximately 1,500 compa-nies compete in a market worth $200 billion annu-ally. Revenue market share is highly consolidated, where 80 percent of the market is driven by the top 50 companies. Global pharmaceutical market growth is predicted to reach $880 billion in 2011.83 Market consolidation is further highlighted by the recent acquisition trends, whereby drug manufac-turers gain R&D capability by acquiring smaller firms.84 Valeant’s neurology division competitors can be narrowed to a few key companies: Teva Pharmaceutical Industries Ltd., UCB S.A., and H. Lundbeck (see Exhibit 6 for comparative infor-mation on Valeant and its competitors.)
Teva employs a low-cost strategy, as it endeavors to introduce generic versions of branded products as early as possible following patent expiration. To support this strategy, Teva actively reviews current patents for opportunities to legitimately challenge patent duration. It also enters into alli-ances to share product development costs and liti-gation costs, maintaining the lowest R&D invest-ment rates in the central nervous system product category. Teva’s Azilect® (offered through a col-laborative agreement with H. Lundbeck) competes with Valeant’s Zelapar® product for the treatment of PD. In 2009 Teva had $13.9 billion in annual sales.86
UCB87
UCB’s vision is to develop a leadership position in severe disease categories to deliver superior, long-run returns to shareholders. It aspires to connect with patients to understand their pain points, and to connect sciences, specifically “biology and chem-istry in a unique way to target proteins which are currently undruggable.”
UCB has nine products in the R&D pipeline to address epilepsy, migraine prophylaxis, mul-tiple sclerosis, fibromyalgia, restless legs syndrome (RLS), and PD.88 Sales of central nervous system (CNS) products accounted for 41 percent of its net sales amount of 2.7 billion euros in 2009.89 Consistent with its strategy, UCB maintains more
Exhibit 5 Valeant Pharmaceuticals International, Inc. Product Development Pipeline
Source: Valeant Pharmaceuticals International, Inc. website, www.valeant.com, January 2011.
Development Pipeline
In Development Discovery Pre-Clinical Phase 1 Phase 2 NDA/MAA ANDASubmitted
than 30 partnerships to gain access to specific R&D expertise within the value chain. For example, it has alliances with Sanofi-Aventis and Amgen.
H. Lundbeck A/S
H. Lundbeck foc uses primarily on developing medi-cine for the treatment of CNS diseases. Main products include Cipralex® (marketed as Lexapro® in the United States) for depression and anxiety disorders, Ebixa® for Alzheimer’s disease, and Azilect® for the treatment of PD (offered through a collaborative agreement with Teva). Approximately 20 percent of its annual revenue ($2.6 billion in 2009) is spent on R&D.90
As previously discussed, Valeant follows a strat-egy of limited R&D spending and focuses instead on growth through acquisitions to maintain its com-petitive position.
Company and Product Acquisitions
Val eant uses its acquisition strategy as a resource allocation methodology as well as to manage the competitive environment. These acquisitions also establish future products in the pipeline, such as retigabine. The acquisitions have allowed Valeant to overcome barriers to market entry and to quickly provide new products; it has also potentially reduced the number of competitors.
In addition to its acquisition strategy, Valeant seeks opportunities to outsource some of the secondary operations so that it can focus on its key operations.
Outsourcing
In an effort to capitali ze on core competencies, pharmaceutical companies are moving toward
Source: Hoover’s Company Reports 2011, Valeant Pharmaceuticals International, Inc.
specializing in one area, specifically in R&D, manu-facturing, or sales and marketing. In turn, they out-source other functions.
Valeant and other companies rely heavily on their outsourcing partners for a number of reasons, including to reduce the time it takes to bring a drug to market through enhanced R&D or manufacturing processes; to increase patient enrollment in clinical trials; to optimize the drug’s promotion; and to capi-talize on human labor, whether it involves scientists, marketing, or sales personnel. The FDA enforces stringent regulations on quality manufacturing and ethical promotional activities; therefore, pharmaceu-tical companies must consider quality, compliance, and reputation ahead of contract flexibility and price when selecting outsourcing partners that will help them meet the demands of key customers.91
Key Customers
Companies in the pharm aceutical industry typically focus on four customer groups: physicians, phar-macy benefit managers (PBMs), patients, and phar-macies.
Physicians
Valeant specifically targ ets neurologists and pri-mary care providers. According to an interview with Dr. Joseph Sirven, a neurologist at the Mayo Clinic in Scottsdale, Arizona, physicians utilize several methods to gain knowledge about a product and its use in clinical practice. They study product-specific articles published in peer-reviewed journals, pay-ing close attention to the efficacy and safety out-comes, the number of subjects enrolled, the journal in which the study was published and the physicians who conducted the trial. The volume of clinical tri-als available and the long-term safety data reported on a particular product also carry significant weight. Sales and marketing efforts, a product’s cost, the drug’s insurance coverage, and physician habit influ-ence a physician’s decision-making process.92
Pharmacy Benefit Managers
PBMs are c ompanies that manage the prescrip-tion pharmaceutical benefits for managed care companies, employers, and government programs. Approximately 95 percent of all drug formularies (lists of medications that are usually covered under a particular healthcare plan) are managed by a PBM.93 The role of a PBM is to determine which drugs will
be placed on a formulary, and the tier status, restric-tions, and copays. They also make suggestions to physicians and patients regarding disease-state man-agement.
Pharmaceutical companies negotiate contracts with PBMs to get their products on formularies, offering discounts to get preferred status. A drug with preferred status is easier for physicians to pre-scribe and more affordable for patients. Some for-mularies place “prior authorizations” on certain products, requiring physicians to justify why they requested the medication. Products without prior authorization requirements have a better chance of being prescribed because they avoid the associated extra paperwork and patient wait-time.94
Patients
Many patients take an activ e role in their health care. These proactive patients search the Internet to find product- and disease-specific Web sites, and often ask their physicians about the products they see advertised on television and in magazines. They also attend support groups and seek out local foun-dations to gain further education about available therapies, costs, symptomatic benefits, and physi-cians’ recommendations regarding the prescriptions they take.
Pharmacists
Pharmaceutical companies must work with dis-tributors to ensure pharmacies have ample stock to provide prescriptions. Companies must also provide pharmacists with educational tools regard-ing the drugs and their indications, as they influ-ence patients’ medication regimens. If pharmacists are not educated on the products and the role they play in disease management, they may provide information that negatively influences the patients’ desires to fill the prescription or perhaps harms the patient.
Customer needs and desires are significantly affected by the general environment. Therefore, Valeant must analyze the trends that are taking place and adjust its strategies accordingly.
Trends Influencing Pharmaceutical Co mpanies
Technological advancements, demographic changes, cultural tendencies, and various governmental poli-cies all create added pressures.
Technology is a key to in creasing the speed and efficiency in which pharmaceutical companies can get a product to market. Companies are mov-ing toward electronic collaboration software such as the EMC Documentum enterprise compliance platform to reduce costs, provide faster solution delivery times, and improve the ability to quickly retrieve information.95 Because information changes quickly, books such as encyclopedias are considered outdated even as they are printed. With information being constantly updated, scientists and pharmaceu-tical companies are finding it hard to keep up.96
According to the World Health Organization (WHO), “chronic conditions are projected to be the leading cause of disability throughout the world by the year 2020; if not successfully prevented and man-aged, they will become the most expensive problems faced by our health care systems.”97 Technological advances in equipment are aiding in early detection and will help keep rising health costs in check.
Aging Population and Life Style
Life expectancy in the United States is increasing due to advances in medicine and technology as well as improved access to health care. Life expectancy at birth and at 65 years has steadily increased for both genders. “The U.S. population age 65 and over is expected to double in size within the next 25 years.”98 According to the WHO, “Neurological disorders ranging from migraines to epilepsy and dementia affect up to one billion people worldwide and the toll will rise as populations age.”99 These factors will increase the need for drugs. Moreover, because a study conducted by the U.S. Government Accountability Office found that the cost of pre-scription medications increased by almost 25 per-cent from 1997 to 2002,100 with the trend only worsening, the entire health care industry needs a better way to manage its rising costs.
Many adults try alternative treatments rather than pharmaceuticals as an answer to health-related issues. Complementary and alternative medicine (CAM) encompasses a variety of techniques includ-ing prayer, massage therapy, yoga, herbal remedies, breathing techniques, meditation, and altering one’s diet. Another option is surgery, especially for many neurological conditions, with a goal of offering patients improved symptomatic benefits.101 However, this alternative is not without risk; deep
brain stimulation is associated with potential side effects such as panic attacks, brain hemorrhaging, infection, mood changes, delirium, movement dis-orders, lightheadedness, insomnia, speech problems, and suicide.102
On the other hand, for the part of society that is not pursuing alternative cures, prescription drug use is increasing. Many patients believe that pills can cure just about anything. From diet pills to ADHD pills, the majority of Americans are becoming more medicated. Greg Critser, author of “Generation RX: How Prescription Drugs Are Altering American Lives, Minds and Bodies” discusses how “the aver-age number of prescriptions per person in 1993 was seven, but that had risen to 11 by 2000, and 12 in 2004.”103
Prescription drug abuse is on the rise, particu-larly among teens. In the United States, for example, “Abuse of prescription pain killers now ranks sec-ond—only behind marijuana—as the nation’s most prevalent illegal drug problem.”104 The President’s National Drug Control Strategy 2010 outlines the extent of prescription drug abuse in the United States and federal programs designed to address the problem.105
Regulation
The U.S. Govern ment’s role in the pharmaceutical industry is highlighted by the FDA and the associ-ated hurdles that companies must clear to safely take a drug to market. These hurdles represent an expen-sive, time-consuming process that increases the cost of drugs. The problem is that many consumers view the high cost for prescriptions as greed money col-lected by pharmaceutical companies.
Statistics show that “R&D costs in the drug industry are among the highest with only three out of ten marketed drugs producing revenues that match or exceed average R&D costs.”106 These factors, in addition to other government restrictions such as “stem cell research limitations and U.S. visa policies,”107 are a leading cause in the trend to off-shore pharmaceutical R&D processes.108
The Health Insurance Portability and Account-ability Act of 1996 (HIPAA) has significantly affected the pharmaceutical industry’s marketing strategies. Patient Health Information (PHI) must be removed from all records before pharmaceuti-cal companies can use it to gather marketing data. This restriction directly affects mail advertising campaigns. Additionally, it limits the number of
individuals who qualify for clinical studies as phar-maceutical companies must now work with covered providers to obtain patient authorization of medical records.109
The Prescription Drug Marketing Act (PDMA) was created by the FDA to monitor prescription drugs. PDMA requires pharmaceutical companies to perform annual audits of drug samples in addition to monitoring the storage of the drug sample. The goal is to “assure that the drug samples are free of con-tamination, deterioration, and adulteration.”110
The FDA also has a Division of Drug Marketing, Advertising, and Communications (DDMAC). It ensures that “information contained in prescrip-tion drug promotional materials is not false or misleading.”111 The DDMAC has a list of firm guidelines that pharmaceutical companies must fol-low when publishing all communications, including commercials. If the DDMAC decides to ban this mode of advertising, pharmaceutical companies will need to find other effective means of advertising their products. The DDMAC also administers the FDA’s educational outreach program, the “Bad Ad” program, designed to educate healthcare providers on ways they can assist the FDA to ensure that pre-scription drug advertising and promotion is truth-ful and straighforward. It also provides them with an easy way to report misleading prescription drug promotion.112
Medicare Part D, a program to assist Medicare beneficiaries in paying for their prescription drugs, has resulted in more U.S. consumers choosing generic drugs. Medicare Part D has a gap (known as the “Donut Hole”) such that Medicare beneficiaries must pay for drugs out-of-pocket when they reach a certain benefit limit and do not qualify for the next tier in the prescription drug structure. The increased out-of-pocket expenses cause more patients to shift their use from branded products to the cheaper generic products.113 However, the 2011 Donut Hole represents the beginning of an effort to close the Donut Hole. People who reach the Donut Hole in 2011 will receive a 50 percent discount on brand name formulary drugs and a 7 percent discount on all generic formulary medications.114
Retail pharmacies such as Walmart are offering $4 generic prescription options.115 Because of its size, Walmart and similar large retail pharmacies further contribute to the increased generic drug awareness and usage.116 Therefore, to keep its products in the preferred category, Valeant works hard to employ effective and creative marketing strategies.
Marketing
Valeant sells its products through its direct sales forces in Canada and the United States and through marketing partnerships.117 Valeant develops market-ing materials for the salesforce to use in interactions with key customers. They, however, must ensure that the marketing pieces are medically accurate and compliant with the DDMAC. They also pro-vide prescription samples. Samples allow physicians to gauge whether a medication is well-tolerated and efficacious before patients purchase a prescription. Valeant also generates press releases and special interest stories, and develops advertising for medical journals, Web sites, e-mail opt-ins, pharmacy fax blasts, and physician and patient direct mailings.
Related to its direct marketing efforts, Valeant provides funding and educational materials for peer-to-peer and pharmacy educational programs. These programs are divided into two segments: (1) medical education, continuing medical edu-cation, grand rounds, unrestricted educational grants (Valeant provides funding for these pro-grams, but in no way influences the content); and (2) promotional programs, including peer-to-peer programs, roundtable discussions, and pharmacy educational events. Valeant drives the content, which is approved through the regulatory and legal departments.
Additionally, Valeant supports national founda-tions including the Epilepsy Foundation, Michael J. Fox Foundation, National PD Foundation, and American PD Foundation. Valeant provides these foundations with educational resources and finan-cial support to promote research in different thera-peutic areas.
Valeant employees also attend professional soci-ety meetings and trade shows to display product information and to gain information on the chang-ing pharmaceutical environment.118
Patients who are financially disadvantaged can apply for free medicine through the Valeant Patient Assistance Program. It is available to legal residents of the United States who do not have medical insur-ance that covers prescription drug costs and do not have funding from government or private programs for medicine.119
Financial Results
With the two companies expected to be fully inte-grated by the middle of 2011 and a $250 million
savings resulting from the merger anticipated the same year, Valeant gave strong forecasts for fourth quarter 2010 and fiscal year 2011:120
Fourth Quarter 201044–48 cents profit per share$510–520 million in revenue
Fiscal Year 2011$2.25–2.50 profit per share$2.1–$2.3 billion in total revenue$850–950 million in sales of neurologic drugs and other products$480–515 million in U.S. sales of dermatology products$285–305 million in revenue from Canada and Australia
$225–245 million in sales of branded generic drugs in Central Europe$260–285 million in sales of branded generic drugs in Latin America
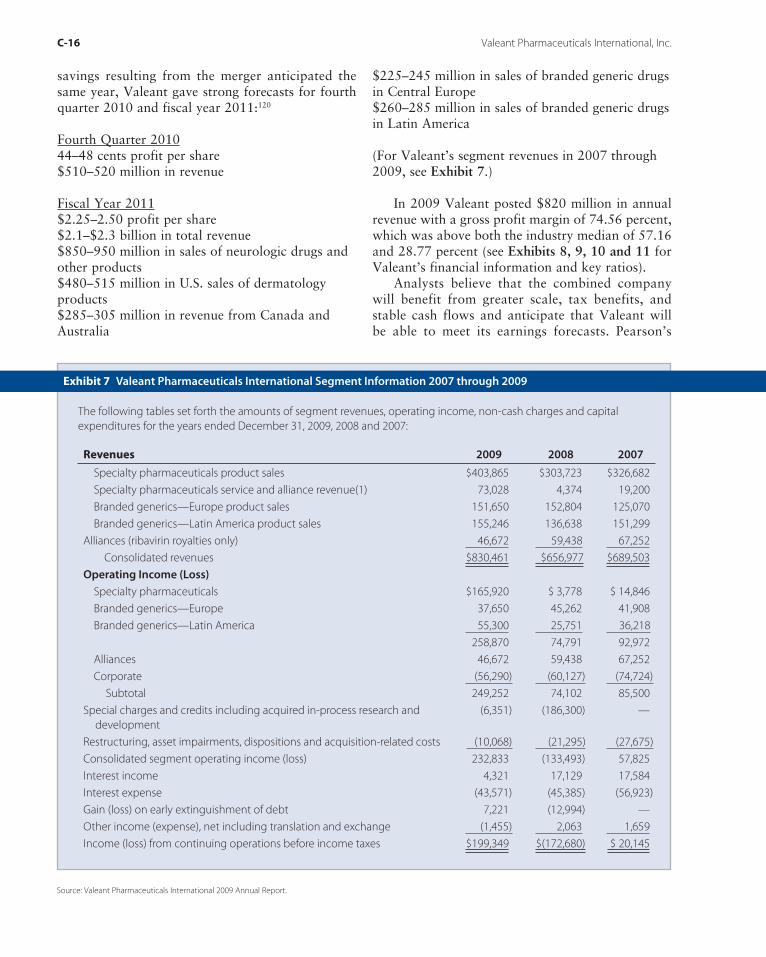
(For Valeant’s segment revenues in 2007 through 2009, see Exhibit 7.)
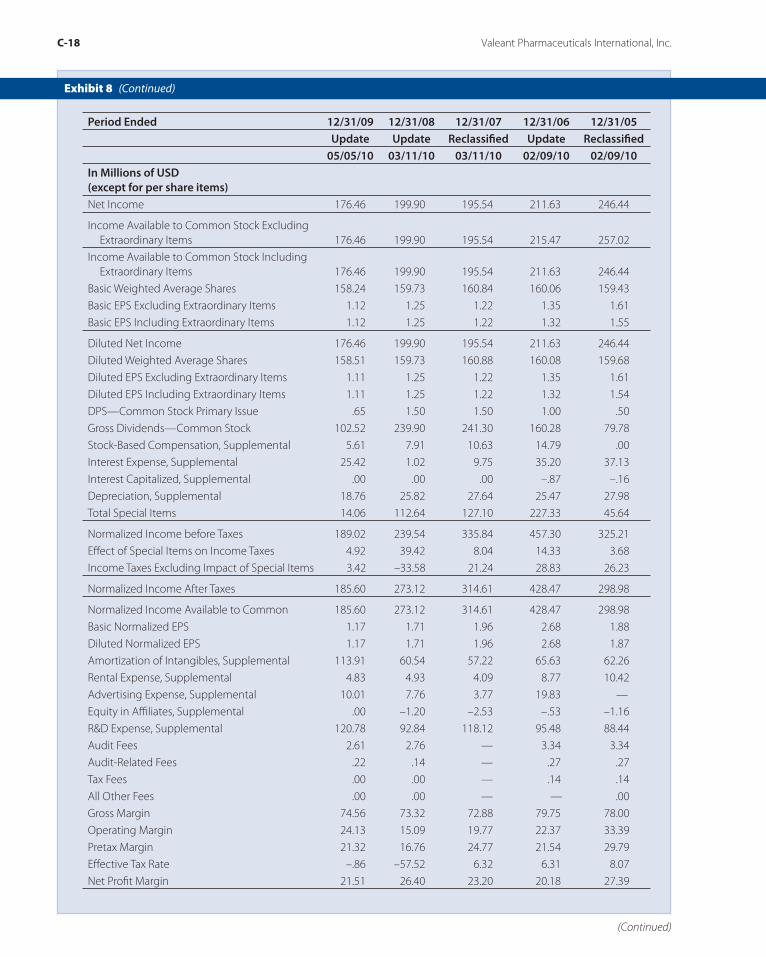
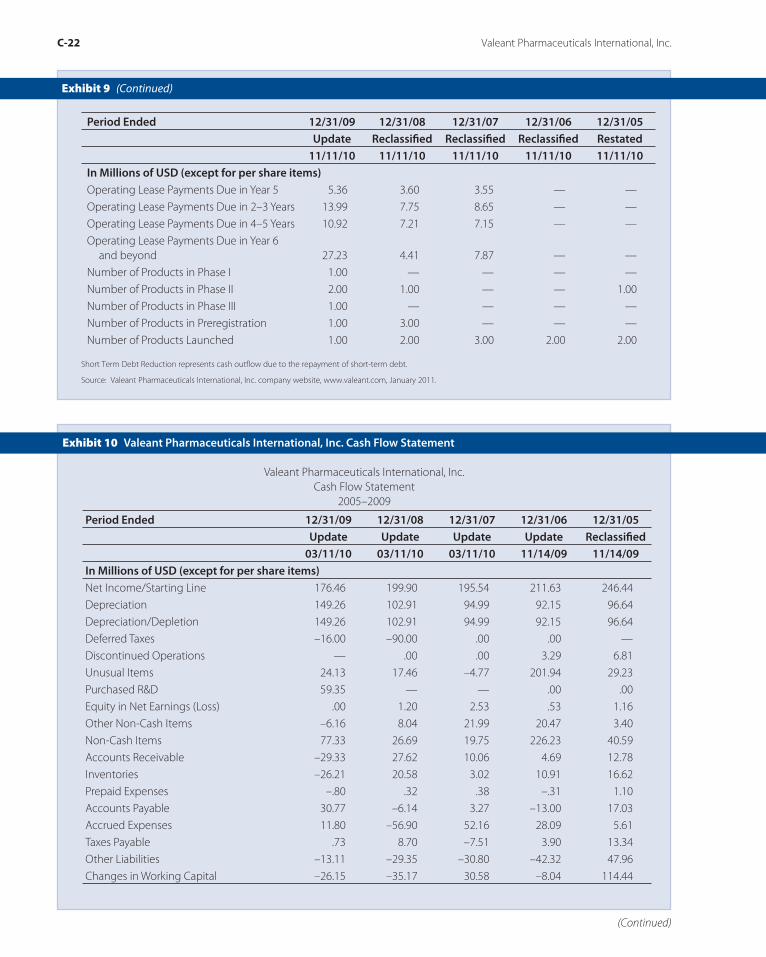
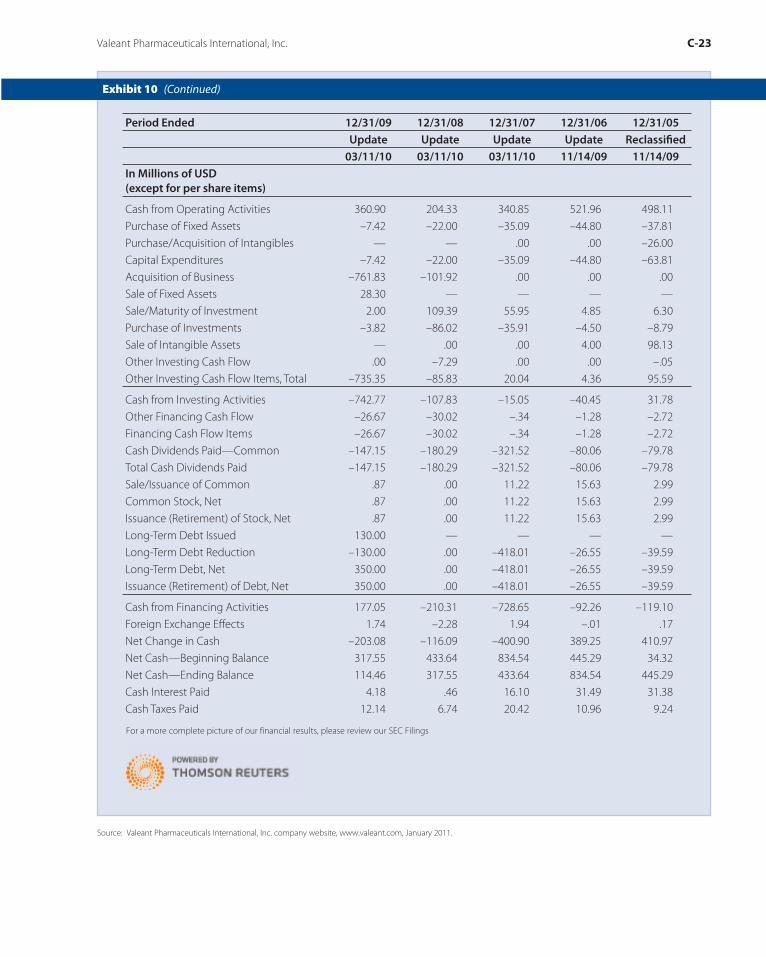
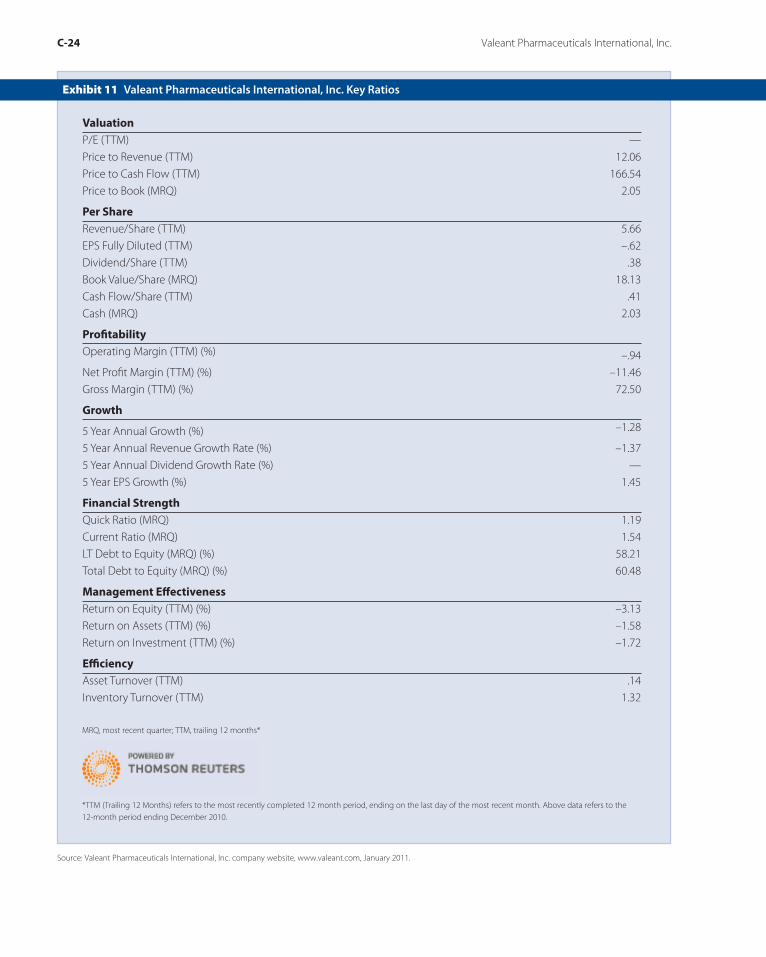
In 2009 Valeant posted $820 million in annual revenue with a gross profit margin of 74.56 percent, which was above both the industry median of 57.16 and 28.77 percent (see Exhibits 8, 9, 10 and 11 for Valeant’s financial information and key ratios).
Analysts believe that the combined company will benefit from greater scale, tax benefits, and stable cash flows and anticipate that Valeant will be able to meet its earnings forecasts. Pearson’s
Exhibit 7 Valeant Pharmaceuticals International Segment Information 2007 through 2009
The following tables set forth the amounts of segment revenues, operating income, non-cash charges and capital expenditures for the years ended December 31, 2009, 2008 and 2007:
For a more complete picture of our financial results, please review our SEC Filings
Short Term Debt Reduction represents cash outflow due to the repayment of short-term debt.
Valeant Pharmaceuticals International Inc.
Balance Sheet
2005–2009
Period Ended 12/31/09 12/31/08 12/31/07 12/31/06 12/31/05 Update Reclassifi ed Reclassifi ed Reclassifi ed Restated 11/11/10 11/11/10 11/11/10 11/11/10 11/11/10In Millions of USD (except for per share items)Cash & Equivalents 114.46 317.55 433.64 834.54 445.29
Short Term Investments 9.57 1.00 3.90 .00 .51
Cash and Short Term Investments 124.03 318.54 437.54 834.54 445.79
Period Ended 12/31/09 12/31/08 12/31/07 12/31/06 12/31/05 Update Reclassifi ed Reclassifi ed Reclassifi ed Restated 11/11/10 11/11/10 11/11/10 11/11/10 11/11/10In Millions of USD (except for per share items)Prepaid Expenses 15.38 14.58 14.68 15.06 14.92
Period Ended 12/31/09 12/31/08 12/31/07 12/31/06 12/31/05 Update Reclassifi ed Reclassifi ed Reclassifi ed Restated 11/11/10 11/11/10 11/11/10 11/11/10 11/11/10In Millions of USD (except for per share items)
Total Liabilities 712.67 421.97 484.30 890.19 808.46
Common Stock 1,465.00 1,463.87 1,489.81 1,476.93 1,461.08
Common Stock, Total 1,465.00 1,463.87 1,489.81 1,476.93 1,461.08
Additional Paid-in Capital 91.77 31.97 23.93 14.95 .38
Period Ended 12/31/09 12/31/08 12/31/07 12/31/06 12/31/05 Update Reclassifi ed Reclassifi ed Reclassifi ed Restated 11/11/10 11/11/10 11/11/10 11/11/10 11/11/10In Millions of USD (except for per share items)Operating Lease Payments Due in Year 5 5.36 3.60 3.55 — —
Operating Lease Payments Due in 2–3 Years 13.99 7.75 8.65 — —
Operating Lease Payments Due in 4–5 Years 10.92 7.21 7.15 — —
Operating Lease Payments Due in Year 6 and beyond 27.23 4.41 7.87 — —
Number of Products in Phase I 1.00 — — — —
Number of Products in Phase II 2.00 1.00 — — 1.00
Number of Products in Phase III 1.00 — — — —
Number of Products in Preregistration 1.00 3.00 — — —
Number of Products Launched 1.00 2.00 3.00 2.00 2.00
Period Ended 12/31/09 12/31/08 12/31/07 12/31/06 12/31/05 Update Update Update Update Reclassifi ed 03/11/10 03/11/10 03/11/10 11/14/09 11/14/09In Millions of USD (except for per share items)Net Income/Starting Line 176.46 199.90 195.54 211.63 246.44
Period Ended 12/31/09 12/31/08 12/31/07 12/31/06 12/31/05 Update Update Update Update Reclassifi ed 03/11/10 03/11/10 03/11/10 11/14/09 11/14/09In Millions of USD(except for per share items)
Cash from Operating Activities 360.90 204.33 340.85 521.96 498.11
Purchase of Fixed Assets –7.42 –22.00 –35.09 –44.80 –37.81
Purchase/Acquisition of Intangibles — — .00 .00 –26.00
Capital Expenditures –7.42 –22.00 –35.09 –44.80 –63.81
Acquisition of Business –761.83 –101.92 .00 .00 .00
Sale of Fixed Assets 28.30 — — — —
Sale/Maturity of Investment 2.00 109.39 55.95 4.85 6.30
Purchase of Investments –3.82 –86.02 –35.91 –4.50 –8.79
Sale of Intangible Assets — .00 .00 4.00 98.13
Other Investing Cash Flow .00 –7.29 .00 .00 –.05
Other Investing Cash Flow Items, Total –735.35 –85.83 20.04 4.36 95.59
Cash from Investing Activities –742.77 –107.83 –15.05 –40.45 31.78
Other Financing Cash Flow –26.67 –30.02 –.34 –1.28 –2.72
Management Eff ectivenessReturn on Equity (TTM) (%) –3.13
Return on Assets (TTM) (%) –1.58
Return on Investment (TTM) (%) –1.72
Effi ciencyAsset Turnover (TTM) .14
Inventory Turnover (TTM) 1.32
Exhibit 11 Valeant Pharmaceuticals International, Inc. Key Ratios
Source: Valeant Pharmaceuticals International, Inc. company website, www.valeant.com, January 2011.
MRQ, most recent quarter; TTM, trailing 12 months*
*TTM (Trailing 12 Months) refers to the most recently completed 12 month period, ending on the last day of the most recent month. Above data refers to the 12-month period ending December 2010.
recommendation that the executive management team should not receive bonuses if Valeant fails to meet its targeted earnings per share also gained ana-lysts’ approval, and they liked that he waived the accelerated vesting of his equity awards because of the merger.121 Analysts support Valeant’s acquisition strategy and subsequent savings on R&D expenses and expect that Valeant will be able to generate com-pound annual growth of 17 percent until 2019.122
Strategic Direction
Before resigning, Tyson outlined to shareholders his strategy as follows: “Our strategic focus will be to aggressively acquire, develop and commercial-ize new products. Through strategic acquisitions, growth in our promoted brands, and continued management of expenses, we expect to make fur-ther progress toward our goal of creating long-term value for our stockholders.… We have talented and experienced professionals, good products and a sound business strategy. The management team continues to be committed to delivering on its promises.”123
Tyson’s successor, J. Michael Pearson, appears successful in the application and further development of Tyson’s acquisition strategy. However, there are many challenges and opportunities ahead. For example, pharmaceutical sales in emerging mar-kets are anticipated to increase by 14 to 17 percent through 2014, led by China and Brazil, compared with a three to six percent growth rate in developed markets, according to IMS Health.124 Some west-ern companies such as Eli Lilly and Novartis have already made long-term investments in manufactur-ing facilities and partnerships with local Chinese firms. Pfizer has announced plans to attain a six per-cent market share in China within three years.125 Although Brazil is one of Valeant’s target markets and it has a manufacturing facility there, was the March 2008 sale of Valeant’s Asian assets to Invida Pharmaceutical Holdings Pte. Ltd.126 a decision that Pearson will eventually regret? Is the February 2011 purchase of PharmaSwiss an indication that Pearson is considering further expansion of Valeant’s geo-graphic scope?
Will the strategy outlined in the case combined with the current restructuring efforts resulting from the merge be substantiated in the marketplace or will the strategy need to be further refined? Where
Mr. Pearson invests the combined company’s financial, intellectual, and other resources will be critical to the firm’s success in delivering long-term value to shareholders.
NOTES
1. 2011, Valeant Pharmaceuticals International, Inc., www.valeant.com.2. Ibid.3. 2007, Valeant, www.valeant.com.4. 2010, B. Berkrot, Global drug sales to top $1 trillion in 2014-IMS, Reuters, April
co-factsheet.xhtml.7. 2001, Valeant Pharmaceuticals, ICN to maximize shareholder value, SEC
Online, www.secinfo.com/dRY7g.45z.htm, April 6.8. 1985, Ribavirin vs. AIDS, Fortune, January 21, 11.9. 2007, Valeant, Research & Markets, www.researchandmarkets.com/reportinfo.
asp?report_id=222850.10. M. Cecil, 2000, ICN is frozen with panic against heartland, Mergers &
Acquisitions, July 31, 42.11. 2002, Where is ICN Pharmaceuticals Incorporated? Labor productivity
and financial competitiveness benchmarks published, Market Wire, http://findarticles.com/p/ articles/mi_pwwi/is_200204/ai_mark09040884, April.
free-co-factsheet.xhtml.19. K. McCormack, 1999, Foolish love, ICN, Smartmoney.Com, www.smartmoney.
com/stockscreen/index.cfm?story=19990922intro, September 22.20. 2006, Valeant sells development programs, FierceBiotech.com, www.
fiercebiotech.com/tags/valeant-pharmaceuticals, December 21.21. 2007, Valeant Pharma hits new low on downgrade, BusinessWeek, www.
businessweek.com/ap/financialnews/D8SNT41G0.htm, November 5.22. Ibid.23. 2009, Valeant Pharmaceuticals International, Annual Report.24. 2010, V. Reed, Valeant’s Cost Cutting, Small Buys Find Favor with Wall Street,
Orange County Business Journal, May 23.25. 2009, Valeant Pharmaceuticals International, Annual Report.26. 2010, V. Reed, Valeant’s Cost Cutting, Small Buys Find Favor with Wall Street,
Orange County Business Journal, May 23.27. 2010, Retigabine NDA Accepted for Filing, PRNewswire-First Call, December
30, http://www.drugs.com/nda/retigabine_091230.html.28. 2009, J. Rockoff, Drug Firm Leaves R&D to others – Valeant Pharmaceuticals
Prefers to Forgo the Risk, Grow Through Acquisitions, The Wall Street Journal, March 2, B6.
29. Ibid.30. Ibid.31. Ibid.32. 2011, Valeant Pharmaceuticals, www.valeant.com.33. 2009, Valeant Pharmaceuticals International, Annual Report.34. 2010, V. Reed, Valeant’s Cost Cutting, Small Buys Find Favor with Wall Street,
Orange County Business Journal, May 23.35. 2010, Aton Pharma, Inc., http://www.atonrx.com/press/18/pdf.
36. Ibid.37. 2010, Biovail Corporation S-4/A Registration of Securities Issued in Business
Combination Transactions, August 18.38. 2010, S. Stovall, Valeant, Biovail Agree to Merge, The Wall Street Journal, New
York, N.Y., June 21.39. Ibid.40. 2010, Valeant Pharmaceuticals International, Inc. Declares Special Dividend
and Plans to Create a Special Dividend Reinvestment Plan, Reuters, November 4, http://www.reuters.com/finance/stocks/keyDevelopments?symbol=VRX&pn=2.
41. 2010, P. Sacha, Why Canada’s corporate tax policy is paying off in spades, Divestor, Canadian Finance, Economics and Securities Analysis, June 21, http://divestor.com/2010/06/21/why-canadas-corporate-tax-policy-is-paying-off-in-spades.
42. 2010, Biovail Corporation S-4/A Registration of Securities Issued in Business Combination Transactions, August 18.
43. Ibid.44. 2010, A. Georgiades, Biovail Says Valeant Deal Rockets Company Into the
Future, The Wall Street Journal (online), June 21, http://onlinewsj.com/article/SB10001424052748704895204575320350568757726.html.
45. 2010, Biovail Corporation S-4/A Registration of Securities Issued in Business Combination Transactions, August 18.
46. Ibid.47. 2011, Valeant Pharmaceuticals, www.valeant.com.48. 2011, S. Freeman, Valeant Pharmaceuticals lays off 500 employees in merger
with Biovail, The Canadian Press, January 12.49. Ibid.50. 2011, Valeant Pharmaceuticals to Acquire PharmaSwiss S.A., PR Newswire
Association LLC, February 1, http://corporate.lexisnexis.com/news/marketing.branding/cat300001_doc1351234472.html.
51. 2011, Valeant Pharmaceuticals International, Inc. Announces Pricing of Senior Notes, February 3, Reuters, http://www.reuters.com/finance/stocks/keyDevelopments?symbol=VRX.
52. 2011, Valeant Pharmaceuticals to Acquire PharmaSwiss S.A., PR Newswire Association LLC, February 1.
53. M. Herper, 2002, ICN shareholders win. Now what? Forbes.com, www.forbes.com/2002/05/30/0530icn.html, May 30.
54. 2004, Valeant annual report 2003, Valeant.com, www.valeant.com.55. 2003, ICN, International Directory of Company Histories, www.
56. 2010, J. Michael Pearson Executive Profile, Forbes, http://people.forbes.com/profile/j-michael-pearson/83598.
57. 2009, J. Lublin, Valeant CEO’s Pay Package Draws Praise as a Model, The Wall Street Journal, August 24, B4.
58. Ibid.59. Ibid.60. Ibid.61. Ibid.62. 2010, V. Reed, Valeant’s Cost Cutting, Small Buys Find Favor with Wall Street,
Orange County Business Journal, May 23.63. Ibid.64. 2010, Biovail Corporation S-4/A Registration of Securities Issued in Business
Combination Transactions, August 18.65. 2010, Update1 – Valeant searches for new CFO, shares slide, Reuters,
December 20.66. Ibid.67. 2010, Valeant Pharmaceuticals International, Inc. Announces Appointment
of Robert A. Ingram as Chairman, December 13, Reuters, http://www.reuters.com/finance/stocks/keyDevelopments?symbol=VRX.
68. 2006, Ten frequently asked questions about Parkinson’s Disease, Parkinson’s Disease Foundation, www.pdf.org/Publications/factsheets/PDF_Fact_Sheet_1.0_Final.pdf, November 25.
69. 2011, Parkinson’s Disease (PD) Overview, National Parkinson Foundation, http://www.parkinson.org/parkinson-s-disease.aspx.
70. 2006, Statistics on Parkinson’s Disease, www.medopedia.com/parkinsons/statistics, November 26.
71. 2007, www.valeant.com/products/neurology/index.jsp, November 27.
72. Catechol-O-methyltransferase (COMT) inhibitors are a new class of drugs that provide an alternate therapeutic option to patients with Parkinson’s disease. They are most useful for “wearing-off” (end-of-dose deterioration) motor fluctuations and are used in conjunction with levodopa. C. Waters & A. Constantino, 2001, The use of COMTInhibitors in older patients, Geriatric Times 2, no. 2 (March/April).
73. 2004, Valeant Pharmaceuticals acquires rights to Tasmar®, www.valeant.com/mediaCenter/newsArticle/newsArticle.jspf?objectId=393, November 26.
74. 2011, Epilepsy and Seizure Statistics, About Epilepsy & Seizures, Epilepsy Foundation, http://www.epilepsyfoundation.org/about/statistics.cfm.
75. 2010, FDA declines to OK Glaxo epilepsy drug for now, Reuters, December 1, http://www.reuters.com/article/idUSTRE6B06HI20101201.
76. Diastat® Acudial™ is a gel that is administered through the rectum.77. Postherpetic neuralgia (post-her-PET-ic noo-RAL-jah) is a complication of
shingles. It is a painful condition affecting the nerve fibers and skin such that patients feel sharp jabbing, burning, or deep aching pain, itching, and numbness, headaches, or extreme sensitivity to touch and temperature. 2008, Mayo Clinic, www.mayoclinic.com/health/postherpetic-neuralgia/); 2007, Valeant R&D Portfolio, www.valeant.com/researchAndDevelopment/pipeline/retigabine.jspf, November 26.
78. 2011, Regulatory Update – GSK and Valeant Receive Positive Opinion in Europe From the CHMP for Trobalt (Retigabine), PRNewswire, January 21.
79. 2010, Retigabine NDA Accepted for Filing, PRNewswire-First Call, December 30, http://www.drugs.com/nda/retigabine_091230.html.
80. 2011, Valeant Pharmaceuticals, www.valeant.com.81. Ibid.82. Ibid.83. 2010, G. Gatyas, IMS Health Forecasts Global Pharmaceutical Market Growth
of 5-7 Percent in 2011, Reaching $880 Billion, October 6, http://www.imshealth.com.
financials/index.asp.88. 2011, UCB Company Website, http://www.ucb.com/about-ucb/facts/sales.89. Ibid.90. 2011, Hoover’s Company Reports, H. Lundbeck A/S.91. K. Richards, 2004, Outsourcing: The pharmaceutical industry’s strategy of
choice for managing risk and rapid change, www.touchbriefings.com/pdf/890/PT04_richards.pdf, November 22.
92. Dr. J. Sirven, 2007, personal interview, November 21.93. AIS, A Guide to Drug Cost Management Strategies, 2002; PCMA, 2001.94. J. Richardson, 2003, PBMs: The basics and an industry overview, www.ftc.
gov/ogc/healthcarehearings/docs/030626richardson.pdf, November 25.95. C. Sprague, 2007, Speeding time to market and ensuring regulatory
compliance with business process and content management integration, www.ngpharma.com/pastissue/article.asp?art=270061&issue=201, November 26.
96. J. Carroll, 2006, 10 major health care/pharmaceutical trends, www.jimcarroll.com/weblog/archives/000757.html, November 26.
97. 2002, Integrating prevention into health care, www.who.int/mediacentre/factsheets/fs172/en/index.html, November 25.
98. 2007, U.S. Census Bureau, www.census.gov/Press-Release/www/releases/archives/aging_population/006544.html, November 27.
99. S. Nebehay, 2007, Neurological disorders affect one billion people—WHO, Reuters, www.reuters.com/article/latestCrisis/idUSL27230278, November 25.
100. 2005, Prescription drugs: Price trends for frequently used brand and generic drugs from 2000 through 2004, United States Government Accountability Office, www.gao.gov/new.items/d05779.pdf, November 23.
101. 2004, Questions and answers about Activa Parkinson’s control therapy, Medtronic, www.medtronic.com/neuro/parkinsons/activa_qa2.html#9, November 23.
102. Mayo Clinic Staff, 2006, Deep brain stimulation: An experimental depression treatment, Mayo Clinic, www.mayoclinic.com/health/deep-brain-stimulation/ MH00114, November 25.
103. M. Kakutani, 2005, Generation RX: How prescription drugs are altering American lives, minds and bodies, www.iht.com/articles/2005/10/02/features/booklun.php, November 26.
104. M. Lombardi, 2007, Raising awareness of “Generation Rx,” www.cbsnews.com/blogs/2007/11/29/couricandco/entry3553088.shtml, November 29.
105. 2010, National Drug Control Strategy, Office of National Drug Control Policy, http://www.whitehousedrugpolicy.gov/policy/ndcs.html.
106. 2004, Offshore outsourcing of pharmaceutical R&D.107. Visa policies are an issue for pharmaceutical companies because they are
not able to hire and retain knowledge from foreign human capital.108. J. Carroll, 2006, 10 major health care/pharmaceutical trends.109. Dr. S. Salam, 2002, HIPAA: Impact on the pharmaceutical industry, www.
pharmabiz.com/article/detnews.asp?articleid=11394§ionid=46, November 23.
110. 2006, Inventories and audits for Prescription Drug Marketing Act (PDMA) Compliance, Global Compliance, www.globalcompliance.com/prescription-drug-marketing-actpdma.html, November 27.
111. 2007, Division of Drug Marketing, Advertising, and Communications, U.S. Food and Drug Administration, www.fda.gov/cder/ddmac/, November 22.
112. 2011, Truthful Prescription Drug Advertising and Promotion (Bad Ad Program), U.S. Food and Drug Administration, http://www.fad/gov/Drugs/GuidanceComplainceRegulatoryInformation/Surveillance?DrugMarketingAdvertisingandCommunications/ucm209384/htm.
113. S. Saul, 2007, Patient money: Strategies to avoid Medicare’s big hole, The New York Times, www.nytimes.com/2007/11/24/health/policy/24donut.html?ref=todayspaper, November 26.
114. 2011, How does this Donut Hole really work?, Q1Medicare.com, http://www.q1medicare.com/PartD-MoreOnTheDonutHolesOrCoverageGap.php.
115. 2007, Considerations for generic drug use in the elderly, Pharmacy Times, www.pharmacytimes.com/issues/articles/2007-01_4286.asp, November 27.
116. J. Frederick, 2007, Medicare Part D driving up generic dispensing, BET Research Center, http://findarticles.com/p/articles/mi_m3374/is_3_29/ai_n19020244, November 23.
117. 2011, Hoover’s Company Reports, Valeant Pharmaceuticals International, Inc.
118. C. North, personal interview.119. 2011, Valeant Pharmaceuticals, www.valeant.com.120. 2011, Valeant Pharma soars on 4Q and 2011 forecasts, Bloomberg
Businessweek, January 6, http://www.businessweek.com/ap/financialnews/D9KJ2B001.htm.
121. 2011, M. Venu, Valeant Pharmaceuticals International, Inc. Analyst Report, Morningstar Investment Research Center, http://library.morningstar.com.ezproxy1.lib.asu.edu/stocknet/MorningstarAnalysis.aspx?Country=USA&Symbol=VRX&Custid-&CLogin=&CType=&CName=.
122. Ibid.123. 2007, Valeant, www.valeant.com.124. 2010, B. Berkrot, Global drug sales to top $1 trillion in 2014 – IMS, Reuters,
April 20, http://www.reuters.com.125. 2010, M. Kimes, Big Pharma’s Challenge: Figuring out China, Fortune,
September 23, http://money.cnn.com/2010/09/23/news/international/big_pharma_china.fortune/index.htm.
126. 2009, Valeant Pharmaceuticals International Annual Report.