67
Vale’s performance in 3Q16 Nacala Coal Port, Mozambique

Vale’s performance in 3Q16
Nacala Coal Port, Mozambique

www.vale.com
App Vale Investors & Media
iOS: https://itunes.apple.com/us/app/vale-investor-media-portugues/id1087134066?ls=1&mt=8
Android: https://play.google.com/store/apps/details?id=com.theirapp.valeport
Tel.: (55 21) 3485-3900
Investor Relations Department
André Figueiredo
Carla Albano Miller
Fernando Mascarenhas
Andrea Gutman
Bruno Siqueira
Claudia Rodrigues
Denise Caruncho
Mariano Szachtman
Renata Capanema
BM&F BOVESPA: VALE3, VALE5
NYSE: VALE, VALE.P
EURONEXT PARIS: VALE3, VALE5
LATIBEX: XVALO, XVALP
Except where otherwise indicated the operational and financial information in this release is based on the consolidated figures
in accordance with IFRS and, with the exception of information on investments and behavior of markets, quarterly financial
statements are reviewed by the company’s independent auditors. The main subsidiaries that are consolidat ed are the following:
Compañia Minera Miski Mayo S.A.C., Mineração Corumbaense Reunida S.A., PT Vale Indonesia Tbk (formerly International
Nickel Indonesia Tbk), Salobo Metais S.A, Vale Australia Pty Ltd., Vale International Holdings GMBH, Vale Canada Limi ted
(formely Vale Inco Limited), Vale Fertilizantes S.A., Vale International S.A., Vale Manganês S.A., Vale Moçambique S.A., Vale
Nouvelle-Calédonie SAS, Vale Oman Pelletizing Company LLC and Vale Shipping Holding PTE Ltd.
3
Contents
Vale’s performance in 3Q16 ...................................................................................................... 4
Operating revenues ................................................................................................................... 8
Costs and expenses ................................................................................................................ 10
Adjusted earnings before interest, taxes, depreciation and amortization................................ 12
Net income ............................................................................................................................... 13
The impact of bunker oil hedging on Vale’s financial performance ......................................... 15
Effects of currency price volatility on Vale’s financial performance ......................................... 17
Investments ............................................................................................................................. 18
Free cash flow ......................................................................................................................... 24
Debt indicators ......................................................................................................................... 25
Performance of the business segments .................................................................................. 27
Ferrous minerals ...................................................................................................................... 28
Base Metals ............................................................................................................................. 41
Coal ......................................................................................................................................... 51
Fertilizer nutrients .................................................................................................................... 59

4
Vale’s performance in 3Q16
Rio de Janeiro, October 27th, 2016 – Vale S.A. (Vale) posted another quarter of sound operational
performance, with several production records in 3Q16, namely: (i) iron ore production1 of 92.1 Mt;
(ii) Carajás iron ore production of 38.7 Mt; (iii) Tubarão 3, Tubarão 8 and Vargem Grande pellet
plants production of 1.2 Mt, 1.8 Mt and 1.8 Mt, respectively; (iv) contained gold as a by-product
in the copper and nickel concentrates of 118,000 oz and (v) Moatize coal production of 1.8 Mt.
Net revenues totaled US$ 7.324 billion in 3Q16, increasing by US$ 698 million vs. 2Q16 as a
result of higher sales prices for iron ore fines and pellets (US$ 275 million), nickel and copper
(US$ 95 million), and coal (US$ 25 million), along with higher sales volumes of fertilizers (US$
142 million) and for our ferrous business segment (US$ 127 million).
Costs and expenses decreased by US$ 2.180 billion in 9M16 vs. 9M15, mainly due to cost
reduction initiatives (US$ 1.740 billion) and exchange rate variations (US$ 924 million), being
partially offset by higher sales volumes (US$ 1.190 billion).
Adjusted EBITDA was US$ 3.023 billion2 in 3Q16, 26.9% higher than in 2Q16, mainly driven
by EBITDA improvements in Ferrous Minerals (US$ 357 million), Base Metals (US$ 224 million)
and Coal (US$ 103 million). Adjusted EBITDA margin increased by 5 percentage points,
reaching 41.3% in 3Q16.
Capital expenditures totaled US$ 1.257 billion in 3Q16, decreasing by US$ 111 million vs.
2Q16. Investments in project execution totaled US$ 741 million in 3Q16, with expenditures
associated with the S11D project accounting for US$ 530 million. Sustaining capex totaled US$
516 million in 3Q16, 11.4% higher than in 2Q16 as a result of the concentration of investment
in the second half of the year.
There is now one main project under development, the S11D project, which reached an
important milestone, successfully initiating its hot commissioning in 3Q16. S11D’s start-up is
expected for 4Q16 with the first commercial ore sale planned for 1Q17.
Net income totaled US$ 575 million in 3Q16 vs. US$ 1.106 billion in 2Q16, decreasing by US$
531 million mostly as a result of foreign exchange rate variations (US$ 2.237 billion), which
were partially offset by the Samarco provision recorded in 2Q16 (US$ 1.038 billion) and the
higher EBITDA in 3Q16 (US$ 640 million). Underlying earnings (earnings after adjusting for
one-off effects) were US$ 954 million in 3Q16, mainly after the adjustments for foreign
exchange variation (US$ 330 million).
1 Including third party purchases.
2 Including US$ 150 million from the goldstream transaction.

5
Net debt decreased by US$ 1.543 billion to US$ 25.965 billion with a cash position of US$
5.484 billion. Gross debt reduced by US$ 365 million to US$ 31.449 billion in 3Q16, with the
leverage ratio3 improving to 3.6x, the same level as in 3Q15.
The main highlights of Vale’s performance by business segment were:
EBITDA from the Ferrous Minerals business segment increased 17% in 3Q16 vs. 2Q16,
mainly driven by higher realized prices and by lower costs and expenses
Adjusted EBITDA for Ferrous Minerals was US$ 2.493 billion in 3Q16, US$ 357 million
higher than the US$ 2.136 billion achieved in 2Q16, mainly as a result of higher realized
sales prices (US$ 291 million) and lower costs and expenses4 (US$ 213 million), which
were partially offset by exchange rate variations (US$ 117 million).
Cash flow generation, simplified by measuring adjusted EBITDA less sustaining and
growth capex, was US$ 1.698 billion in 3Q16, increasing US$ 331 million (24%) from
the US$ 1.367 billion recorded in 2Q16.
C1 cash cost FOB port per metric ton of iron ore fines in BRL reduced by 10% to R$
42.2/t in 3Q16 vs. R$ 46.9/t in 3Q15, despite inflationary pressures of 8.5%5, mainly
due to improvements in operational performance and ongoing cost-cutting initiatives.
Iron ore fines and pellets EBITDA break-even, measured by unit cash costs and
expenses on a landed-in-China basis6, decreased US$ 0.2/dmt7 to US$ 28.3/dmt in
3Q16 when compared to 2Q16, despite the negative impacts of the exchange rate
(US$ 1.0/wmt8) and bunker oil prices (US$ 0.7/wmt).
EBITDA from the Base Metals business segment increased 60%9 in 3Q16 vs. 2Q16 as a
result of the goldstream transaction and higher prices
Adjusted EBITDA for Base Metals was US$ 600 million in 3Q16, US$ 224 million higher
than in 2Q16, positively impacted by the goldstream transaction (US$ 150 million) and
higher prices (US$ 114 million).
3 Leverage ratio measured by gross debt to LTM (Last Twelve Months) adjusted EBITDA . 4 Cost and expenses after adjusting the effects of higher volumes, exchange rate variation and lower bunker oil prices. 5 IPCA last twelve months until September 2016.
6 Adjusted for quality, pellets margins differential and moisture, excluding ROM .
7 Dry metric ton. 8 Wet metric ton. 9 Including US$ 150 million from the goldstream transaction.
6
Salobo’s EBITDA totaled US$ 131 million in 3Q16, or US$ 281 million including the
impact of the goldstream transaction, increasing US$ 9 million vs. 2Q16, despite the
negative impact of an exchange rate variation of US$ 12 million.
Salobo achieved a quarterly production record of 44,300 t in 3Q16 and a monthly
production record of 17,000 t in September 2016, running at nominal capacity on a
monthly basis.
Adjusted EBITDA for VNC totaled negative US$ 39 million in 3Q16 improving by US$
11 million when compared to 2Q16 despite a planned maintenance shutdown in 3Q16.
VNC’s unit cost net of by-product credits reached US$ 12,425/t in 3Q16, reflecting an
US$ 11 million maintenance expenditures associated with the shutdown.
EBITDA from Coal almost reached break-even, being positively impacted by lower costs
in Mozambique with the ramp-up of the Nacala Logistics Corridor and the start-up of the
Moatize II beneficiation plant
Adjusted EBITDA for Coal improved significantly from negative US$ 110 million in
2Q16 to negative US$ 7 million in 3Q16, despite not fully capturing the recent hike in
index prices.
Metallurgical coal realized price in 3Q16 did not yet reflect the recent sharp increase in
coal index prices due to the impact of Vale’s lagged pricing systems, with Vale’s
realized price (US$ 91.0/t) still significantly lower than the index price average10 of US$
135.6/t. Vale’s realized price is expected to improve considerably in 4Q16 alongside
the improvement in benchmark prices.
Adjusted EBITDA at the Nacala port improved by 71% to negative US$ 7 million, while
EBITDA at the Beira Port (-US$ 28 million) was offset by EBITDA from the Australian
operations (US$ 28 million).
Production cost per ton at the Nacala port continued to improve at US$ 87/t in 3Q16,
16% lower than 2Q16, with further improvement expected for the coming quarters.
EBITDA from the Fertilizers business segment increased 84% in 3Q16 vs. 2Q16, mainly
driven by lower costs and higher volumes, despite lower prices and exchange rate
variation
10 Platts Premium Low Vol Hard Coking Coal FOB Australia Index used as reference.
7
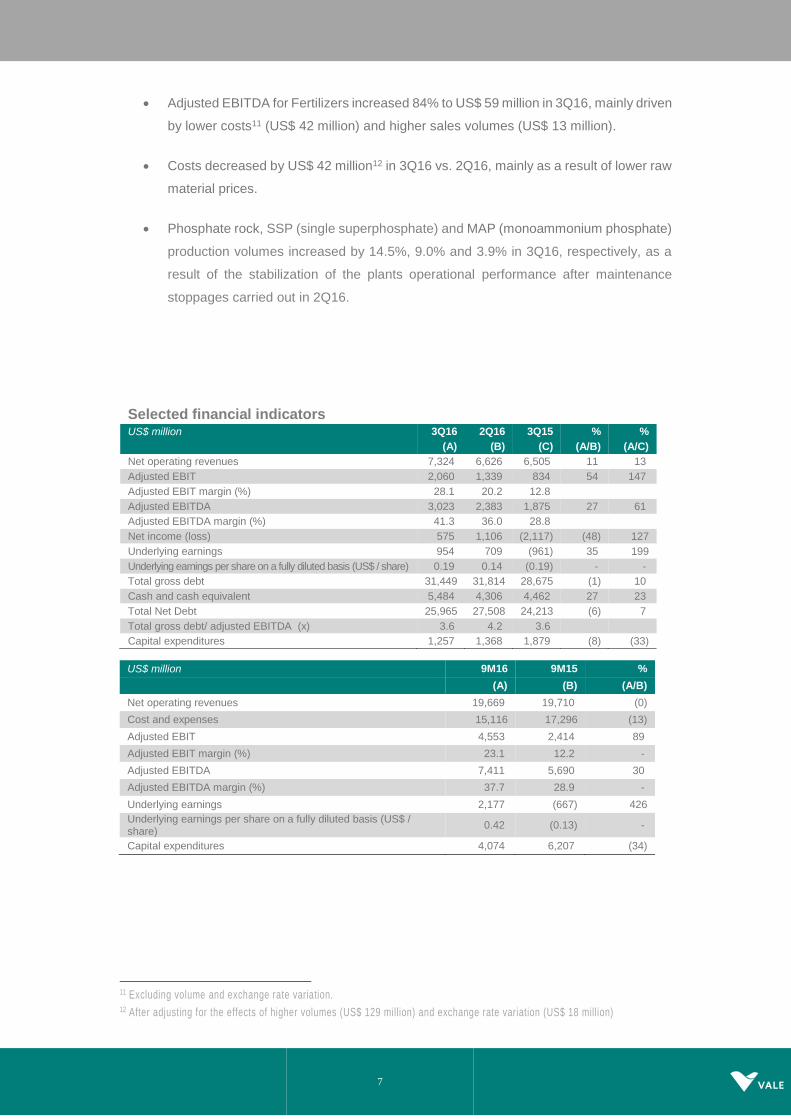
Adjusted EBITDA for Fertilizers increased 84% to US$ 59 million in 3Q16, mainly driven
by lower costs11 (US$ 42 million) and higher sales volumes (US$ 13 million).
Costs decreased by US$ 42 million12 in 3Q16 vs. 2Q16, mainly as a result of lower raw
material prices.
Phosphate rock, SSP (single superphosphate) and MAP (monoammonium phosphate)
production volumes increased by 14.5%, 9.0% and 3.9% in 3Q16, respectively, as a
result of the stabilization of the plants operational performance after maintenance
stoppages carried out in 2Q16.
11 Excluding volume and exchange rate variation. 12 After adjusting for the effects of higher volumes (US$ 129 million) and exchange rate variation (US$ 18 million)
Selected financial indicators
US$ million 3Q16 2Q16 3Q15 % %
(A) (B) (C) (A/B) (A/C)
Net operating revenues 7,324 6,626 6,505 11 13
Adjusted EBIT 2,060 1,339 834 54 147
Adjusted EBIT margin (%) 28.1 20.2 12.8
Adjusted EBITDA 3,023 2,383 1,875 27 61
Adjusted EBITDA margin (%) 41.3 36.0 28.8
Net income (loss) 575 1,106 (2,117) (48) 127
Underlying earnings 954 709 (961) 35 199
Underlying earnings per share on a fully diluted basis (US$ / share) 0.19 0.14 (0.19) - -
Total gross debt 31,449 31,814 28,675 (1) 10
Cash and cash equivalent 5,484 4,306 4,462 27 23
Total Net Debt 25,965 27,508 24,213 (6) 7
Total gross debt/ adjusted EBITDA (x) 3.6 4.2 3.6
Capital expenditures 1,257 1,368 1,879 (8) (33)
US$ million 9M16 9M15 %
(A) (B) (A/B)
Net operating revenues 19,669 19,710 (0)
Cost and expenses 15,116 17,296 (13)
Adjusted EBIT 4,553 2,414 89
Adjusted EBIT margin (%) 23.1 12.2 -
Adjusted EBITDA 7,411 5,690 30
Adjusted EBITDA margin (%) 37.7 28.9 -
Underlying earnings 2,177 (667) 426
Underlying earnings per share on a fully diluted basis (US$ / share)
0.42 (0.13) -
Capital expenditures 4,074 6,207 (34)
8
Operating revenues
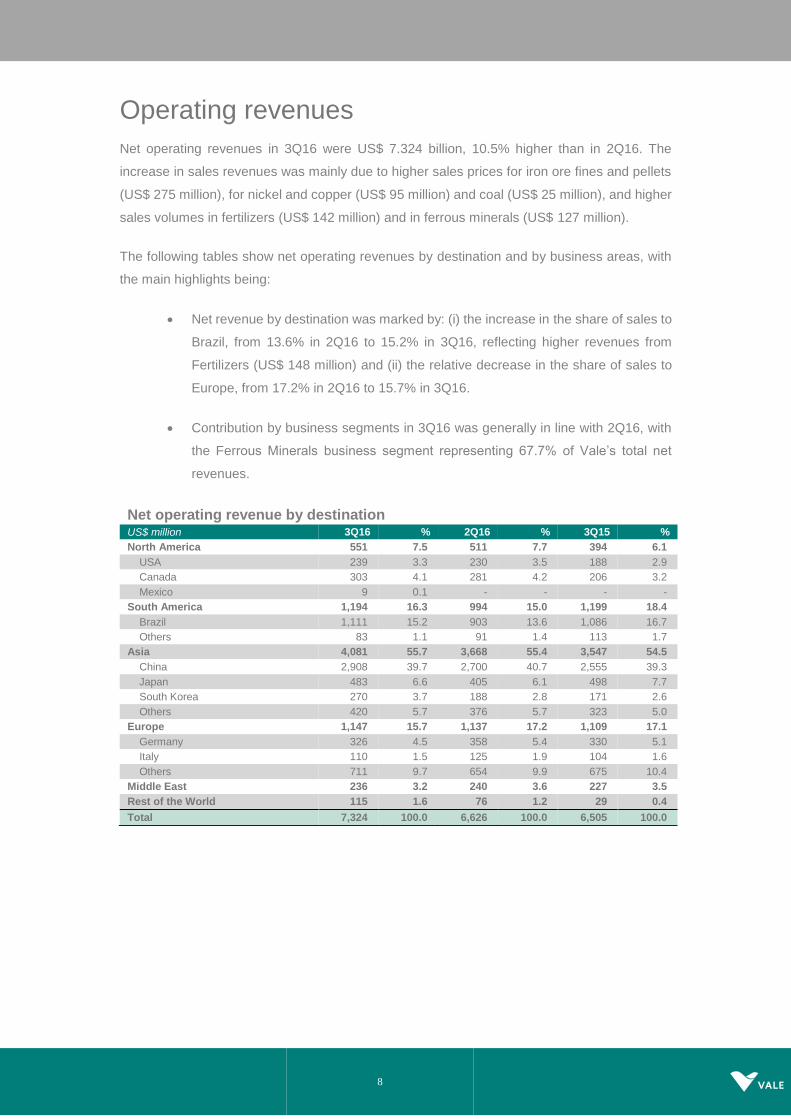
Net operating revenues in 3Q16 were US$ 7.324 billion, 10.5% higher than in 2Q16. The
increase in sales revenues was mainly due to higher sales prices for iron ore fines and pellets
(US$ 275 million), for nickel and copper (US$ 95 million) and coal (US$ 25 million), and higher
sales volumes in fertilizers (US$ 142 million) and in ferrous minerals (US$ 127 million).
The following tables show net operating revenues by destination and by business areas, with
the main highlights being:
Net revenue by destination was marked by: (i) the increase in the share of sales to
Brazil, from 13.6% in 2Q16 to 15.2% in 3Q16, reflecting higher revenues from
Fertilizers (US$ 148 million) and (ii) the relative decrease in the share of sales to
Europe, from 17.2% in 2Q16 to 15.7% in 3Q16.
Contribution by business segments in 3Q16 was generally in line with 2Q16, with
the Ferrous Minerals business segment representing 67.7% of Vale’s total net
revenues.
Net operating revenue by destination
US$ million 3Q16 % 2Q16 % 3Q15 %
North America 551 7.5 511 7.7 394 6.1
USA 239 3.3 230 3.5 188 2.9
Canada 303 4.1 281 4.2 206 3.2
Mexico 9 0.1 - - - -
South America 1,194 16.3 994 15.0 1,199 18.4
Brazil 1,111 15.2 903 13.6 1,086 16.7
Others 83 1.1 91 1.4 113 1.7
Asia 4,081 55.7 3,668 55.4 3,547 54.5
China 2,908 39.7 2,700 40.7 2,555 39.3
Japan 483 6.6 405 6.1 498 7.7
South Korea 270 3.7 188 2.8 171 2.6
Others 420 5.7 376 5.7 323 5.0
Europe 1,147 15.7 1,137 17.2 1,109 17.1
Germany 326 4.5 358 5.4 330 5.1
Italy 110 1.5 125 1.9 104 1.6
Others 711 9.7 654 9.9 675 10.4
Middle East 236 3.2 240 3.6 227 3.5
Rest of the World 115 1.6 76 1.2 29 0.4
Total 7,324 100.0 6,626 100.0 6,505 100.0

9
Net operating revenues by destination
Net operating revenue by business area
US$ million 3Q16 % 2Q16 % 3Q15 %
Ferrous minerals 4,959 67.7 4,541 68.5 4,312 66.3
Iron ore fines 3,782 51.6 3,508 52.9 3,278 50.4
ROM 4 0.1 5 0.1 24 0.4
Pellets 991 13.5 868 13.1 883 13.6
Manganese ore 51 0.7 36 0.5 23 0.4
Ferroalloys 25 0.3 25 0.4 3 -
Others 106 1.4 99 1.5 101 1.6
Coal 163 2.2 145 2.2 127 2.0
Metallurgical coal 105 1.4 77 1.2 115 1.8
Thermal coal 58 0.8 68 1.0 12 0.2
Base metals 1,579 21.6 1,447 21.8 1,347 20.7
Nickel 797 10.9 710 10.7 785 12.1
Copper 452 6.2 443 6.7 360 5.5
PGMs 104 1.4 99 1.5 58 0.9
Gold as by-product 179 2.4 154 2.3 115 1.8
Silver as by-product 9 0.1 10 0.2 7 0.1
Others 38 0.5 31 0.5 22 0.3
Fertilizer nutrients 598 8.2 464 7.0 698 10.7
Potash 34 0.5 22 0.3 41 0.6
Phosphates 470 6.4 363 5.5 560 8.6
Nitrogen 69 0.9 60 0.9 80 1.2
Others 25 0,3 19 0.3 17 0.3
Others 25 0.3 29 0.4 21 0.3
Total 7,324 100.0 6,626 100.0 6,505 100.0
10
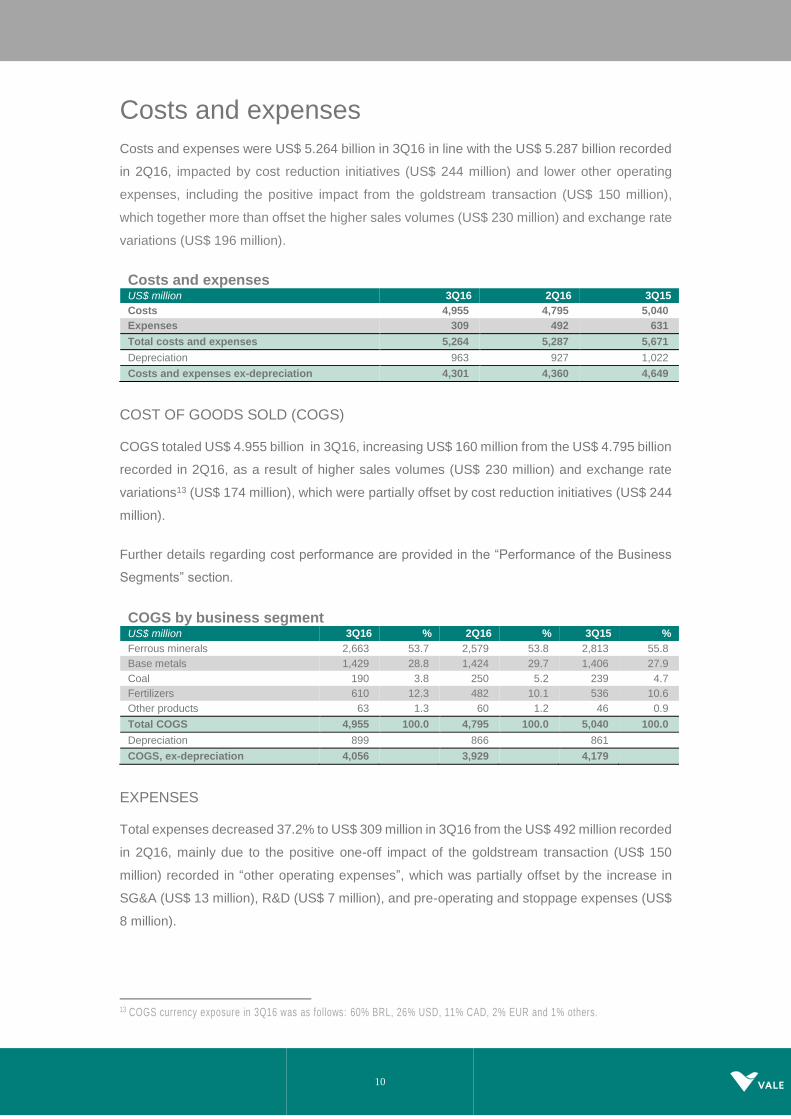
Costs and expenses
Costs and expenses were US$ 5.264 billion in 3Q16 in line with the US$ 5.287 billion recorded
in 2Q16, impacted by cost reduction initiatives (US$ 244 million) and lower other operating
expenses, including the positive impact from the goldstream transaction (US$ 150 million),
which together more than offset the higher sales volumes (US$ 230 million) and exchange rate
variations (US$ 196 million).
Costs and expenses US$ million 3Q16 2Q16 3Q15
Costs 4,955 4,795 5,040
Expenses 309 492 631
Total costs and expenses 5,264 5,287 5,671
Depreciation 963 927 1,022
Costs and expenses ex-depreciation 4,301 4,360 4,649
COST OF GOODS SOLD (COGS)
COGS totaled US$ 4.955 billion in 3Q16, increasing US$ 160 million from the US$ 4.795 billion
recorded in 2Q16, as a result of higher sales volumes (US$ 230 million) and exchange rate
variations13 (US$ 174 million), which were partially offset by cost reduction initiatives (US$ 244
million).
Further details regarding cost performance are provided in the “Performance of the Business
Segments” section.
COGS by business segment US$ million 3Q16 % 2Q16 % 3Q15 %
Ferrous minerals 2,663 53.7 2,579 53.8 2,813 55.8
Base metals 1,429 28.8 1,424 29.7 1,406 27.9
Coal 190 3.8 250 5.2 239 4.7
Fertilizers 610 12.3 482 10.1 536 10.6
Other products 63 1.3 60 1.2 46 0.9
Total COGS 4,955 100.0 4,795 100.0 5,040 100.0
Depreciation 899 866 861
COGS, ex-depreciation 4,056 3,929 4,179
EXPENSES
Total expenses decreased 37.2% to US$ 309 million in 3Q16 from the US$ 492 million recorded
in 2Q16, mainly due to the positive one-off impact of the goldstream transaction (US$ 150
million) recorded in “other operating expenses”, which was partially offset by the increase in
SG&A (US$ 13 million), R&D (US$ 7 million), and pre-operating and stoppage expenses (US$
8 million).
13 COGS currency exposure in 3Q16 was as follows: 60% BRL, 26% USD, 11% CAD, 2% EUR and 1% others.

11
SG&A totaled US$ 153 million in 3Q16, representing a 9.3% increase from the US$ 140 million
recorded in 2Q16, and a 16.8% increase from the US$ 131 million recorded in 3Q15. SG&A,
net of depreciation, increased by US$ 9 million in 3Q16 vs. 2Q16, mainly as a result of the
impact of exchange rate variations (US$ 7 million) and higher selling expenses (US$ 3 million).
R&D expenses totaled US$ 85 million in 3Q16, representing an 8.9% increase from the US$
78 million recorded in 2Q16, following the usual seasonality, and a 29.7% decrease from the
US$ 121 million recorded in 3Q15. R&D expenses relate mostly to iron ore and pellets (US$
29 million) and nickel (US$ 21 million).
Pre-operating and stoppage expenses totaled US$ 122 million in 3Q16, representing a 7.0%
increase from the US$ 114 million recorded in 2Q16, mainly driven by higher S11D project
expenses (US$ 9 million).
Other operating expenses recorded a positive amount of US$ 51 million in 3Q16, improving by
US$ 211 million when compared to the US$ 160 million expenses in 2Q16, mainly due to: (i)
the positive one-off impact of the goldstream transaction (US$ 150 million); (ii) lower
contingencies (US$ 28 million); and (iii) lower disposals and write-off of assets (US$ 21 million).
Expenses
US$ million 3Q16 % 2Q16 % 3Q15 %
SG&A ex-depreciation 116 - 107 - 100 -
SG&A 153 50 140 28 131 21
Administrative 136 44 126 26 132 21
Personnel 61 20 58 12 56 9
Services 19 6 18 4 26 4
Depreciation 37 12 33 7 31 5
Others 19 6 17 3 19 3
Selling 17 6 14 3 (1) (0)
R&D 85 28 78 16 121 19
Pre-operating and stoppage expenses¹
122 39 114 23 266 42
VNC - - - - 97 15
Long Harbour 39 13 45 9 65 10
S11D 28 9 19 4 11 2
Moatize 1 - 9 2 25 4
Others 54 18 41 8 68 11
Other operating expenses (51) (17) 160 33 113 18
Total Expenses 309 100 492 100 631 100
Depreciation 64 - 61 - 161 -
Expenses ex-depreciation 245 - 431 - 470 -
¹ Includes US$ 27 mi ll ion of depreciation charges in 3Q16, US$ 29 mill ion in 2Q16 and US$ 83 mill ion in 3Q15
12
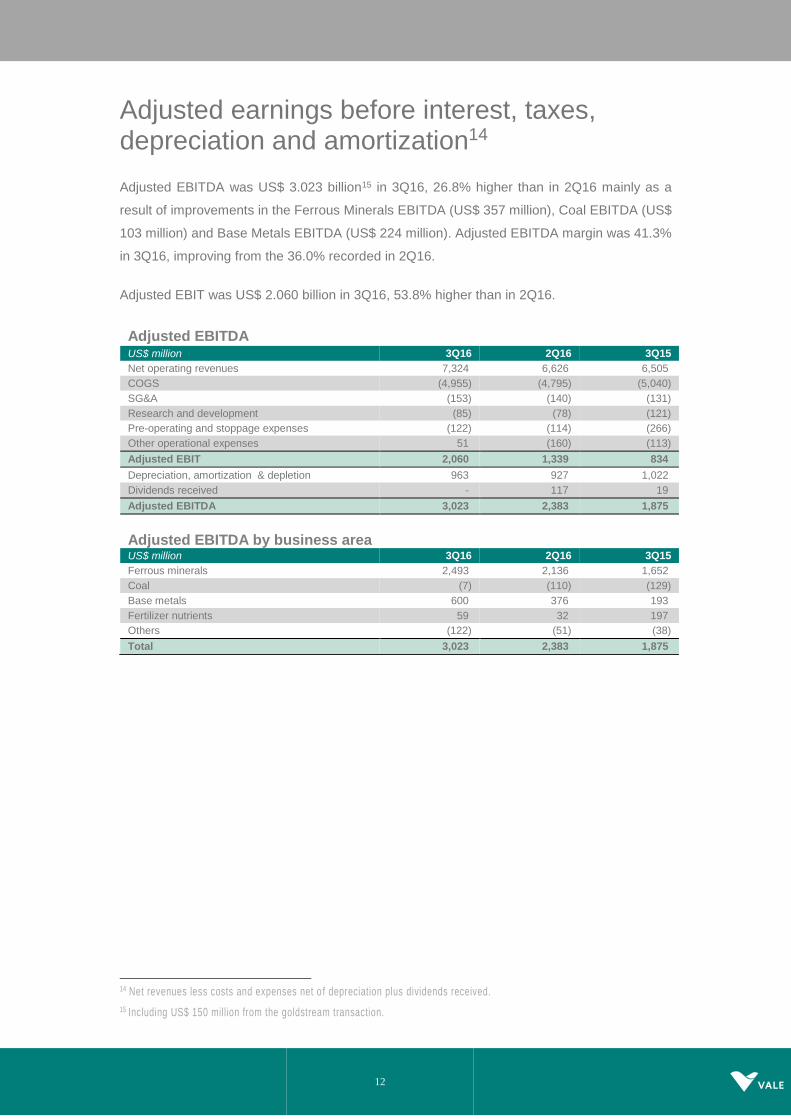
Adjusted earnings before interest, taxes, depreciation and amortization14
Adjusted EBITDA was US$ 3.023 billion15 in 3Q16, 26.8% higher than in 2Q16 mainly as a
result of improvements in the Ferrous Minerals EBITDA (US$ 357 million), Coal EBITDA (US$
103 million) and Base Metals EBITDA (US$ 224 million). Adjusted EBITDA margin was 41.3%
in 3Q16, improving from the 36.0% recorded in 2Q16.
Adjusted EBIT was US$ 2.060 billion in 3Q16, 53.8% higher than in 2Q16.
Adjusted EBITDA
US$ million 3Q16 2Q16 3Q15
Net operating revenues 7,324 6,626 6,505
COGS (4,955) (4,795) (5,040)
SG&A (153) (140) (131)
Research and development (85) (78) (121)
Pre-operating and stoppage expenses (122) (114) (266)
Other operational expenses 51 (160) (113)
Adjusted EBIT 2,060 1,339 834
Depreciation, amortization & depletion 963 927 1,022
Dividends received - 117 19
Adjusted EBITDA 3,023 2,383 1,875
Adjusted EBITDA by business area US$ million 3Q16 2Q16 3Q15
Ferrous minerals 2,493 2,136 1,652
Coal (7) (110) (129)
Base metals 600 376 193
Fertilizer nutrients 59 32 197
Others (122) (51) (38)
Total 3,023 2,383 1,875
14 Net revenues less costs and expenses net o f depreciation plus dividends received.
15 Including US$ 150 million from the goldstream transaction.
13
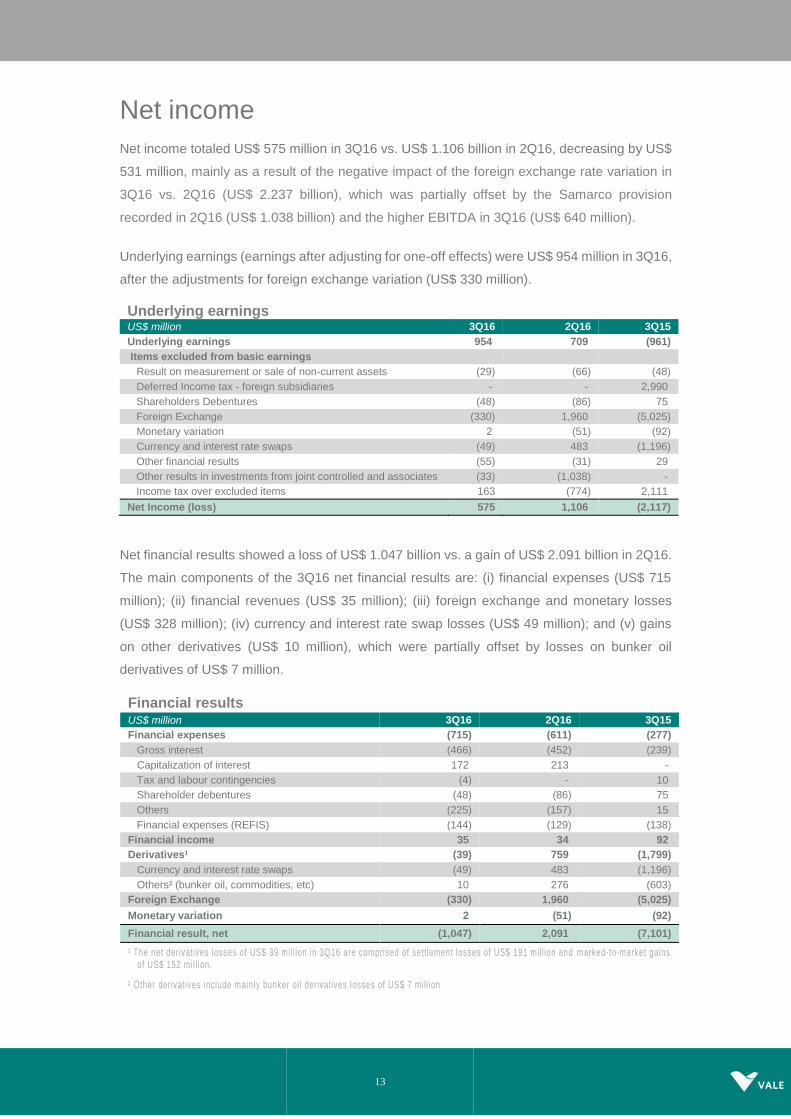
Net income
Net income totaled US$ 575 million in 3Q16 vs. US$ 1.106 billion in 2Q16, decreasing by US$
531 million, mainly as a result of the negative impact of the foreign exchange rate variation in
3Q16 vs. 2Q16 (US$ 2.237 billion), which was partially offset by the Samarco provision
recorded in 2Q16 (US$ 1.038 billion) and the higher EBITDA in 3Q16 (US$ 640 million).
Underlying earnings (earnings after adjusting for one-off effects) were US$ 954 million in 3Q16,
after the adjustments for foreign exchange variation (US$ 330 million).
Underlying earnings US$ million 3Q16 2Q16 3Q15
Underlying earnings 954 709 (961)
Items excluded from basic earnings
Result on measurement or sale of non-current assets (29) (66) (48)
Deferred Income tax - foreign subsidiaries - - 2,990
Shareholders Debentures (48) (86) 75
Foreign Exchange (330) 1,960 (5,025)
Monetary variation 2 (51) (92)
Currency and interest rate swaps (49) 483 (1,196)
Other financial results (55) (31) 29
Other results in investments from joint controlled and associates (33) (1,038) -
Income tax over excluded items 163 (774) 2,111
Net Income (loss) 575 1,106 (2,117)
Net financial results showed a loss of US$ 1.047 billion vs. a gain of US$ 2.091 billion in 2Q16.
The main components of the 3Q16 net financial results are: (i) financial expenses (US$ 715
million); (ii) financial revenues (US$ 35 million); (iii) foreign exchange and monetary losses
(US$ 328 million); (iv) currency and interest rate swap losses (US$ 49 million); and (v) gains
on other derivatives (US$ 10 million), which were partially offset by losses on bunker oil
derivatives of US$ 7 million.
Financial results
US$ million 3Q16 2Q16 3Q15
Financial expenses (715) (611) (277)
Gross interest (466) (452) (239)
Capitalization of interest 172 213 -
Tax and labour contingencies (4) - 10
Shareholder debentures (48) (86) 75
Others (225) (157) 15
Financial expenses (REFIS) (144) (129) (138)
Financial income 35 34 92
Derivatives¹ (39) 759 (1,799)
Currency and interest rate swaps (49) 483 (1,196)
Others² (bunker oil, commodities, etc) 10 276 (603)
Foreign Exchange (330) 1,960 (5,025)
Monetary variation 2 (51) (92)
Financial result, net (1,047) 2,091 (7,101)
¹ The net derivatives losses of US$ 39 mi ll ion in 3Q16 are comprised of settlement losses of US$ 191 mill ion and marked-to-market gains of US$ 152 mil l ion.
² Other derivatives include mainly bunker oil derivatives losses of US$ 7 mill ion
14
Equity income from affiliated companies
Equity income from affiliated companies was US$ 46 million in 3Q16 vs. US$ 190 million in
2Q16. The main contributors to equity income were MRS (US$ 17 million), CSI (US$ 17 million)
and VLI (US$ 16 million).

15
The impact of bunker oil hedging on Vale’s financial performance
Vale’s financial performance has been impacted by the bunker oil hedge previously contracted.
The outstanding bunker oil hedge position is marked-to-market and recorded as financial results,
as a proxy for future cash flow. The outstanding hedge position as of September 30th, 2016 will be
completely settled by the end of 201616.
The impact on the financial statements can be summarized as follows:
(i) In 3Q16: a negative impact of US$ 7 million recognized in 3Q16 as financial results
due to the net position of: (i) the positive impact of the mark-to-market of the open
positions on September 30th, 2016; and (ii) the negative impact of the realized loss
on the settlements which occurred in the quarter.
(ii) In 4Q16: financial results will only be impacted by the gains or losses related to the
settlements recorded in the quarter, as all current open positions will be settled until
December 31st, 2016.
16 Costs are no longer impacted in 2016, since all outstanding bunker oil hedge positions recorded under the hedge
accounting program were settled up to 4Q15.

16
Impact of bunker oil hedging on Vale’s financial performance
Concept Current impact
Drivers of future impact
Freight contract type
Hedge accounting
Impact of derivative position in P/L statement
Impact incurred in 3Q16 P/L statement
Type of Instrument
Bunker oil derivative outstanding position
(,000 tons)
Average strike price (US$/t)
FOB No Impact on financial
results
US$ 7 million decrease in
financial results
Forward 352 511
Zero Cost Collar
540 300 - 380
17
Effects of currency price volatility on Vale’s financial performance In 3Q16, from end to end, the Brazilian Real (BRL) depreciated 1.1% against the US Dollar
(USD) from BRL 3.21/ USD as of June 30th, 2016 to BRL 3.25/ USD as of September 30th,
2016. On a quarterly average, the BRL appreciated 7.5%, from an average BRL 3.51/ USD
in 2Q16 to an average BRL 3.25/ USD in 3Q16.
The end-to-end depreciation of the BRL against the USD and other currencies caused mainly
non-cash losses of US$ 379 million on our earnings before taxes in 3Q16, driven by its impact
on:
(i) The net position of the USD and other currency denominated liabilities and the USD
and other currency denominated assets (accounts receivable and others) – which
amounted to a loss of US$ 330 million in 3Q16, recorded in the financial statements
as "Foreign exchange".
(ii) The changes in fair value and the settlements of the currency swaps from the BRL
and other currencies to the USD, which caused one-off losses of US$ 49 million.
The BRL appreciation on a quarterly average brought negative impacts to Vale’s cash flows.
In 3Q16 most of our revenues were denominated in USD, while our COGS were 60%
denominated in BRL, 26% in USD and 11% in Canadian dollars (CAD) and about 70% of our
capital expenditures were denominated in BRL. The appreciation of the BRL and of other
currencies in 3Q16 increased our costs and expenses by US$ 196 million.
18
Investments
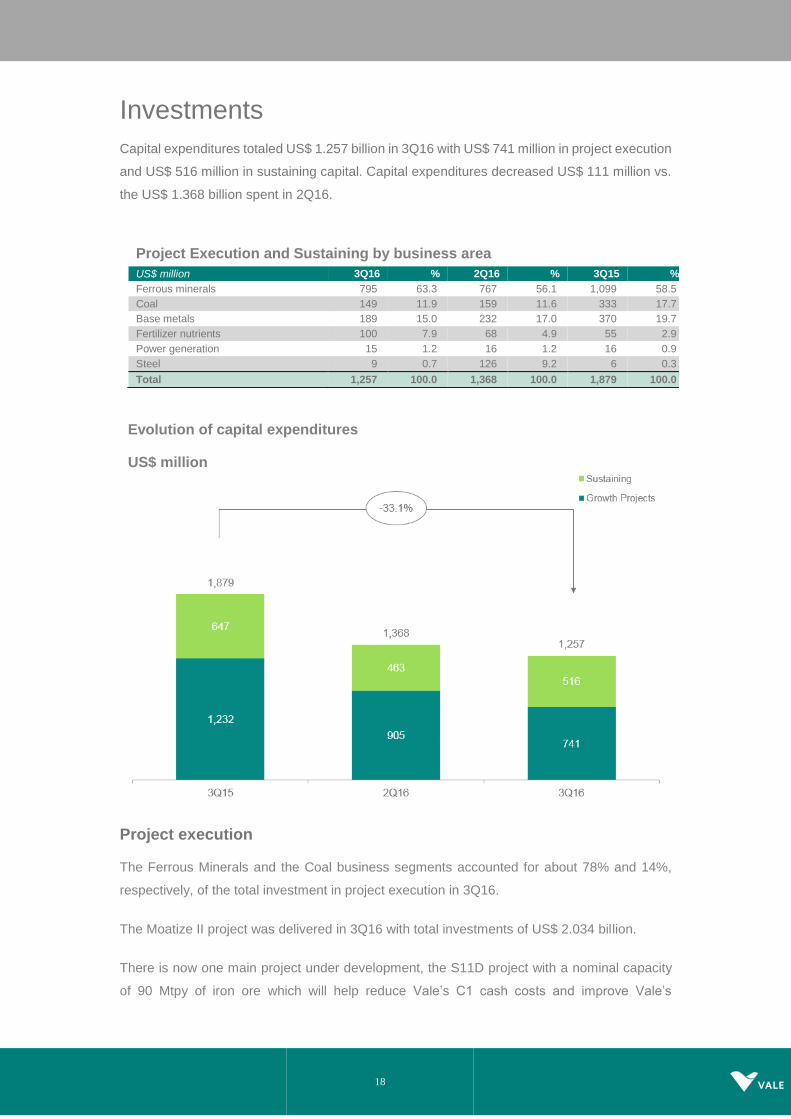
Capital expenditures totaled US$ 1.257 billion in 3Q16 with US$ 741 million in project execution
and US$ 516 million in sustaining capital. Capital expenditures decreased US$ 111 million vs.
the US$ 1.368 billion spent in 2Q16.
Project Execution and Sustaining by business area
US$ million 3Q16 % 2Q16 % 3Q15 %
Ferrous minerals 795 63.3 767 56.1 1,099 58.5
Coal 149 11.9 159 11.6 333 17.7
Base metals 189 15.0 232 17.0 370 19.7
Fertilizer nutrients 100 7.9 68 4.9 55 2.9
Power generation 15 1.2 16 1.2 16 0.9
Steel 9 0.7 126 9.2 6 0.3
Total 1,257 100.0 1,368 100.0 1,879 100.0
Evolution of capital expenditures
US$ million
Project execution
The Ferrous Minerals and the Coal business segments accounted for about 78% and 14%,
respectively, of the total investment in project execution in 3Q16.
The Moatize II project was delivered in 3Q16 with total investments of US$ 2.034 billion.
There is now one main project under development, the S11D project with a nominal capacity
of 90 Mtpy of iron ore which will help reduce Vale’s C1 cash costs and improve Vale’s
19
operational flexibility with the CLN S11D logistics expansion which will increase the capacity in
the Northern System to 230 Mtpy by 2020.
Project execution by business area
US$ million 3Q16 % 2Q16 % 3Q15 %
Ferrous minerals 579 78.2 608 67.1 878 71.3
Coal 106 14.3 140 15.5 311 25.2
Base metals 2 0.3 1 0.1 10 0.8
Fertilizer nutrients 30 4.1 14 1.6 11 0.9
Power generation 14 1.9 16 1.7 16 1.3
Steel 9 1.2 126 13.9 6 0.5
Total 741 100.0 905 100.0 1,232 100.0
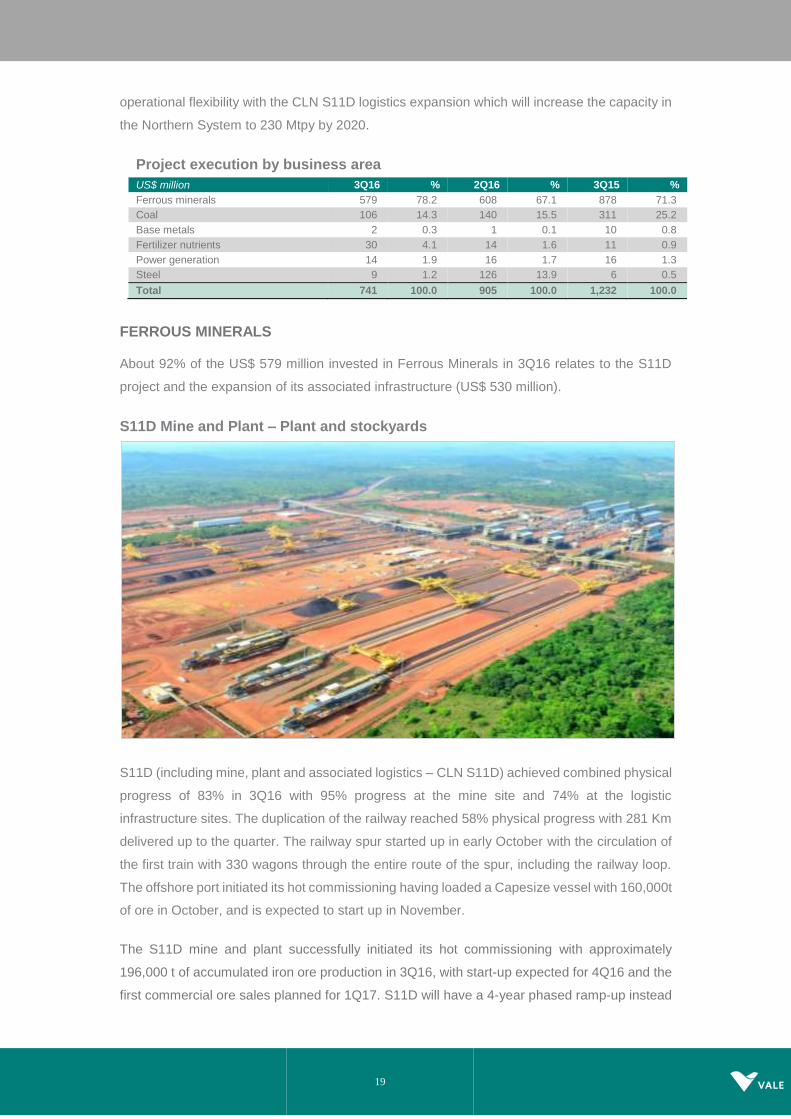
FERROUS MINERALS
About 92% of the US$ 579 million invested in Ferrous Minerals in 3Q16 relates to the S11D
project and the expansion of its associated infrastructure (US$ 530 million).
S11D Mine and Plant – Plant and stockyards
S11D (including mine, plant and associated logistics – CLN S11D) achieved combined physical
progress of 83% in 3Q16 with 95% progress at the mine site and 74% at the logistic
infrastructure sites. The duplication of the railway reached 58% physical progress with 281 Km
delivered up to the quarter. The railway spur started up in early October with the circulation of
the first train with 330 wagons through the entire route of the spur, including the railway loop.
The offshore port initiated its hot commissioning having loaded a Capesize vessel with 160,000t
of ore in October, and is expected to start up in November.
The S11D mine and plant successfully initiated its hot commissioning with approximately
196,000 t of accumulated iron ore production in 3Q16, with start-up expected for 4Q16 and the
first commercial ore sales planned for 1Q17. S11D will have a 4-year phased ramp-up instead

20
of the 2-year ramp-up originally planned in order to maximize margins. The S11D (Southern
range) full production of 90 Mtpy will be reached by 2020, adding a net output of 75 Mtpy from
the entire Northern System (Northern and Southern ranges), which is expected to supply
around 155 Mt from the Northern range only in 2016 and 230 Mtpy from both ranges by 2020.
S11D Logistics – Railway loop
COAL
The Moatize II coal handling and processing plant (CHPP) with net additional capacity of 11
Mtpy started up in 3Q16. Ramp-up is progressing well, having reached production of 129,000
t in August and 169,000 t in September. The project was delivered with total investments of
US$ 2.034 billion.
Moatize Expansion – Stockyard
21
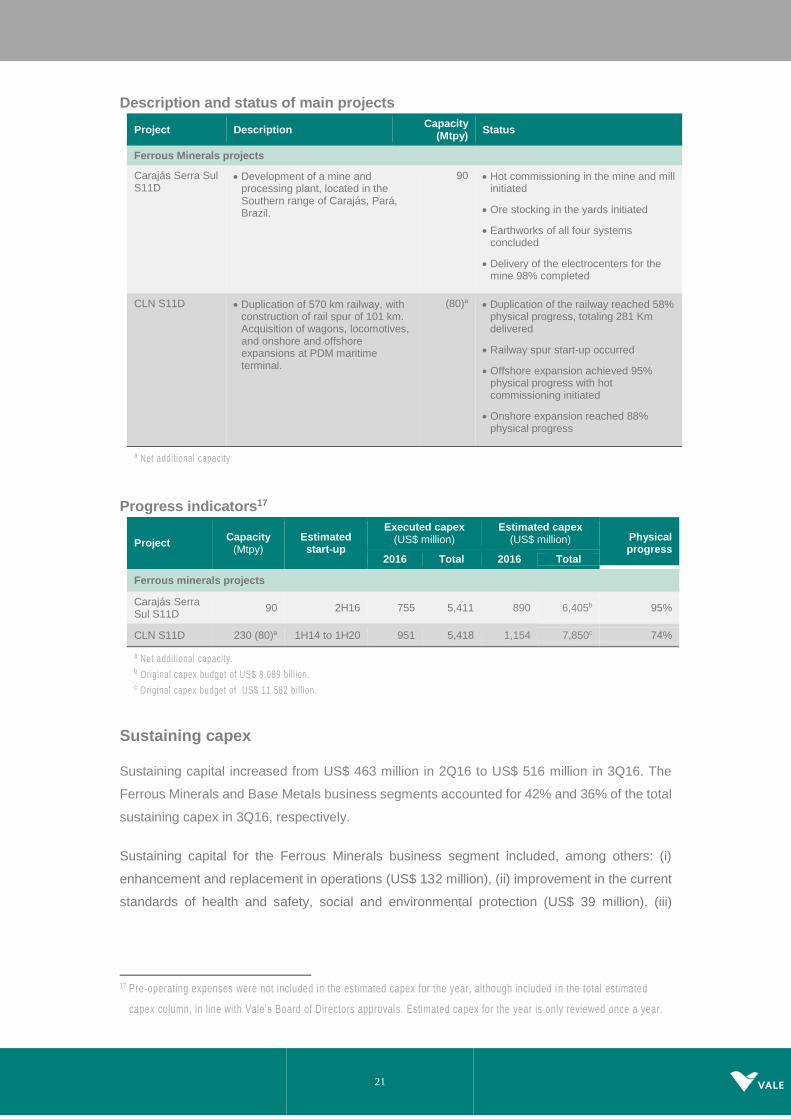
Description and status of main projects
Progress indicators17
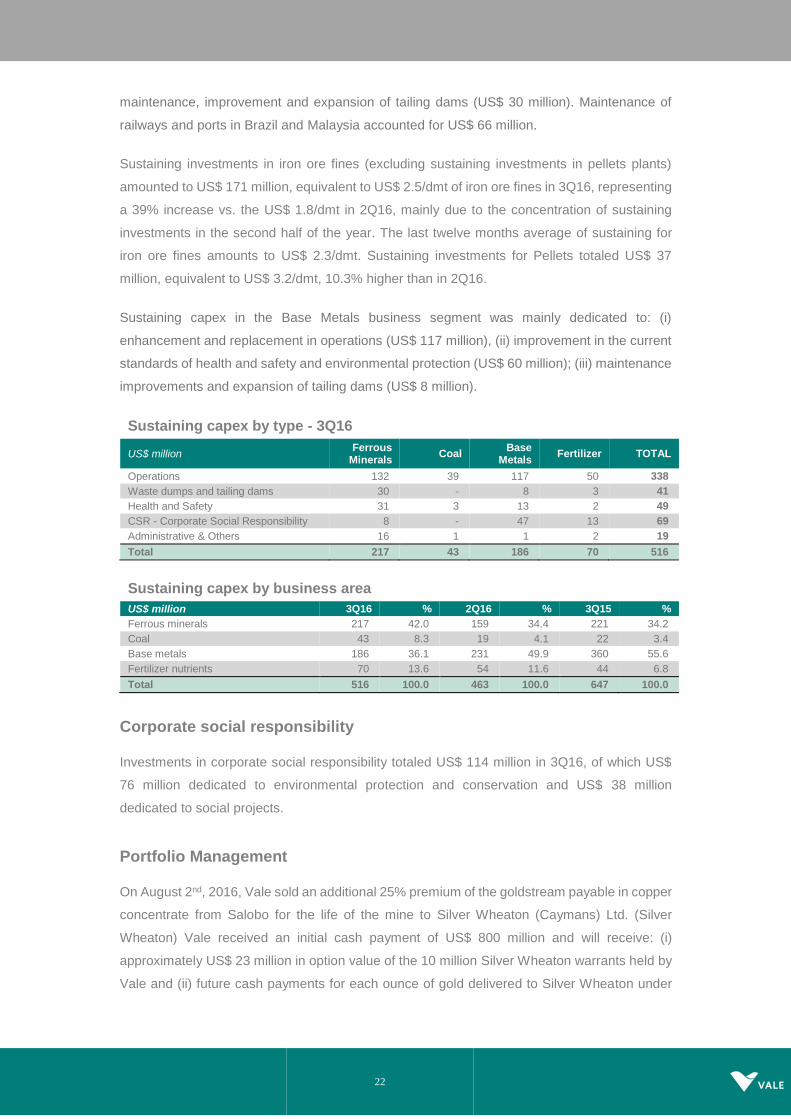
Sustaining capex
Sustaining capital increased from US$ 463 million in 2Q16 to US$ 516 million in 3Q16. The
Ferrous Minerals and Base Metals business segments accounted for 42% and 36% of the total
sustaining capex in 3Q16, respectively.
Sustaining capital for the Ferrous Minerals business segment included, among others: (i)
enhancement and replacement in operations (US$ 132 million), (ii) improvement in the current
standards of health and safety, social and environmental protection (US$ 39 million), (iii)
17 Pre-operating expenses were not included in the estimated capex for the year, although included in the total estimated
capex column, in line with Vale’s Board of Directors approvals. Estimated capex for the year is only reviewed once a year.
Project Description Capacity
(Mtpy) Status
Ferrous Minerals projects
Carajás Serra Sul S11D
Development of a mine and processing plant, located in the Southern range of Carajás, Pará, Brazil.
90 Hot commissioning in the mine and mill initiated
Ore stocking in the yards initiated
Earthworks of all four systems concluded
Delivery of the electrocenters for the mine 98% completed
CLN S11D Duplication of 570 km railway, with construction of rail spur of 101 km. Acquisition of wagons, locomotives, and onshore and offshore expansions at PDM maritime terminal.
(80)a Duplication of the railway reached 58% physical progress, totaling 281 Km delivered
Railway spur start-up occurred
Offshore expansion achieved 95% physical progress with hot commissioning initiated
Onshore expansion reached 88% physical progress
a Net additional capacity
Project Capacity
(Mtpy) Estimated start-up
Executed capex (US$ million)
Estimated capex (US$ million) Physical
progress 2016 Total 2016 Total
Ferrous minerals projects
Carajás Serra Sul S11D
90 2H16 755 5,411 890 6,405b 95%
CLN S11D 230 (80)a 1H14 to 1H20 951 5,418 1,154 7,850c 74%
a Net additional capacity. b Original capex budget of US$ 8.089 bill ion. c Original capex budget of US$ 11.582 bill ion.
22
maintenance, improvement and expansion of tailing dams (US$ 30 million). Maintenance of
railways and ports in Brazil and Malaysia accounted for US$ 66 million.
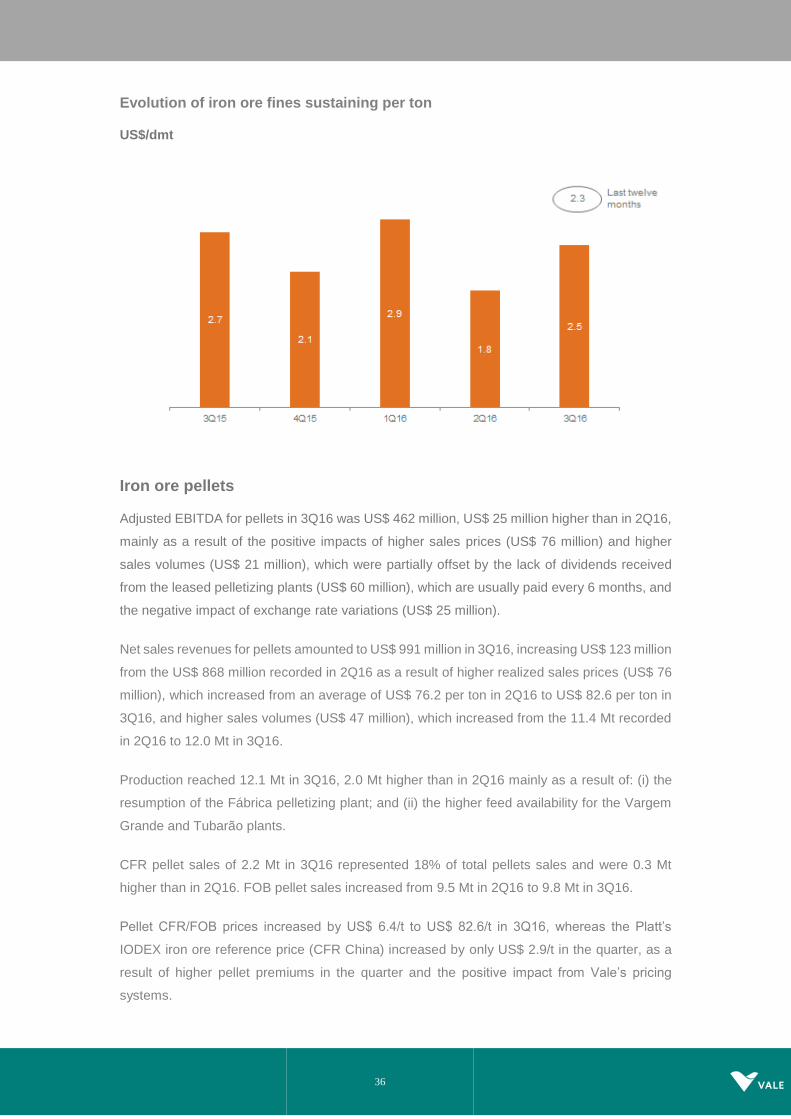
Sustaining investments in iron ore fines (excluding sustaining investments in pellets plants)
amounted to US$ 171 million, equivalent to US$ 2.5/dmt of iron ore fines in 3Q16, representing
a 39% increase vs. the US$ 1.8/dmt in 2Q16, mainly due to the concentration of sustaining
investments in the second half of the year. The last twelve months average of sustaining for
iron ore fines amounts to US$ 2.3/dmt. Sustaining investments for Pellets totaled US$ 37
million, equivalent to US$ 3.2/dmt, 10.3% higher than in 2Q16.
Sustaining capex in the Base Metals business segment was mainly dedicated to: (i)
enhancement and replacement in operations (US$ 117 million), (ii) improvement in the current
standards of health and safety and environmental protection (US$ 60 million); (iii) maintenance
improvements and expansion of tailing dams (US$ 8 million).
Sustaining capex by type - 3Q16
US$ million Ferrous Minerals
Coal Base
Metals Fertilizer TOTAL
Operations 132 39 117 50 338
Waste dumps and tailing dams 30 - 8 3 41
Health and Safety 31 3 13 2 49
CSR - Corporate Social Responsibility 8 - 47 13 69
Administrative & Others 16 1 1 2 19
Total 217 43 186 70 516
Sustaining capex by business area
US$ million 3Q16 % 2Q16 % 3Q15 %
Ferrous minerals 217 42.0 159 34.4 221 34.2
Coal 43 8.3 19 4.1 22 3.4
Base metals 186 36.1 231 49.9 360 55.6
Fertilizer nutrients 70 13.6 54 11.6 44 6.8
Total 516 100.0 463 100.0 647 100.0
Corporate social responsibility
Investments in corporate social responsibility totaled US$ 114 million in 3Q16, of which US$
76 million dedicated to environmental protection and conservation and US$ 38 million
dedicated to social projects.
Portfolio Management
On August 2nd, 2016, Vale sold an additional 25% premium of the goldstream payable in copper
concentrate from Salobo for the life of the mine to Silver Wheaton (Caymans) Ltd. (Silver
Wheaton) Vale received an initial cash payment of US$ 800 million and will receive: (i)
approximately US$ 23 million in option value of the 10 million Silver Wheaton warrants held by
Vale and (ii) future cash payments for each ounce of gold delivered to Silver Wheaton under

23
the agreement, equal to the lesser of US$ 400 per oz (plus a 1% annual adjustment from 2019
onwards) and the prevailing market price.
On September 29th, 2016, Vale reached an important milestone in the Mozambique coal
transaction by approving new terms with Mitsui. Mitsui agreed to contribute up to US$ 450
million, being: (i) an aggregate of US$ 255 million for a 15% of Vale’s stake in the Moatize coal
mine; and (ii) an additional contribution of up to US$ 195 million based on meeting certain
conditions, including mine performance. Mitsui will also contribute US$ 348 million for a 50%
stake in the equity and quasi-equity instruments of the Nacala Logistics Corridor (NCL) and
extend a long-term facility of US$ 165 million to the NCL. Vale expects to receive US$ 768
million after the completion of the equity transaction with Mitsui and up to US$ 2.7 billion upon
closing the Project Financing.

24
Free cash flow
Free cash flow was US$ 1.622 billion in 3Q16.
Cash generated from operations was US$ 3.227 billion in 3Q16, with non-operational uses of
cash stemming mainly from: (i) interest on loans (US$ 423 million); (ii) income taxes and REFIS
installments (US$ 204 million); (iii) settlement of derivatives (US$ 191 million), of which US$
166 million related to bunker oil; and (iv) investments (US$ 1.249 billion)18.
The goldstream transaction generated a cash inflow of US$ 800 million in 3Q16. For accounting
purposes, the cash inflow was classified into two components. The first component was
recorded as sale of mining rights for US$ 276 million (included in the net disposal/acquisition
of assets and investments), of which US$ 126 million was deducted from the book value of the
mining rights and US$ 150 million reduced “other operational expenses” representing the gain
on the sale of mining rights. The other component was recorded as deferred revenue of US$
524 million (improving Vale’s working capital), which will be recognized in our income statement
as the actual gold is delivered.
Net additions and repayments of loans were negative US$ 414 million, with debt repayments
exceeding debt additions in 3Q16.
Free Cash Flow
US$ million
18 The investments figure reported in the cash flow statement may differ from the one s reported in the Investments section of
this report due to the fact that some actual figures are converted into U.S. dollars at the exchange rate on the date of each
cash disbursement, while figures reported in our cash flow statements are converted into U.S. dollars based on avera ge
exchange rates.
25
Debt indicators
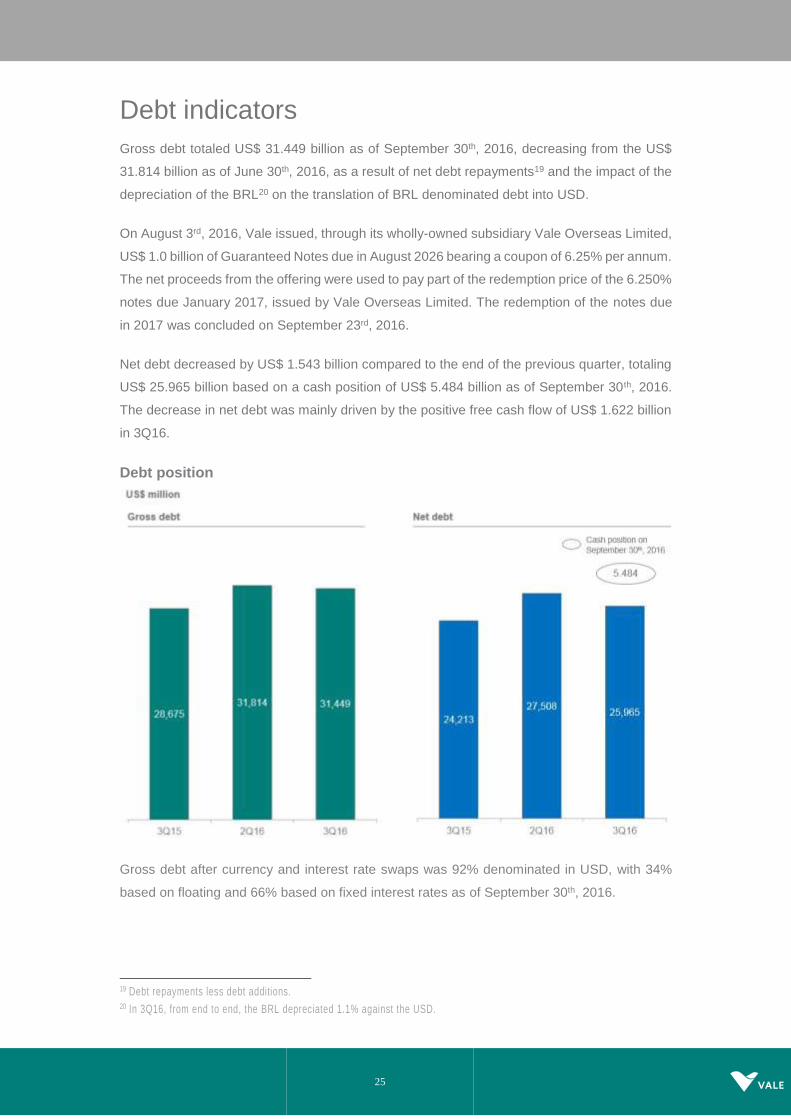
Gross debt totaled US$ 31.449 billion as of September 30th, 2016, decreasing from the US$
31.814 billion as of June 30th, 2016, as a result of net debt repayments19 and the impact of the
depreciation of the BRL20 on the translation of BRL denominated debt into USD.
On August 3rd, 2016, Vale issued, through its wholly-owned subsidiary Vale Overseas Limited,
US$ 1.0 billion of Guaranteed Notes due in August 2026 bearing a coupon of 6.25% per annum.
The net proceeds from the offering were used to pay part of the redemption price of the 6.250%
notes due January 2017, issued by Vale Overseas Limited. The redemption of the notes due
in 2017 was concluded on September 23rd, 2016.
Net debt decreased by US$ 1.543 billion compared to the end of the previous quarter, totaling
US$ 25.965 billion based on a cash position of US$ 5.484 billion as of September 30th, 2016.
The decrease in net debt was mainly driven by the positive free cash flow of US$ 1.622 billion
in 3Q16.
Debt position
Gross debt after currency and interest rate swaps was 92% denominated in USD, with 34%
based on floating and 66% based on fixed interest rates as of September 30th, 2016.
19 Debt repayments less debt additions. 20 In 3Q16, from end to end, the BRL depreciated 1.1% against the USD.

26
Average debt maturity increased slightly to 7.7 years on September 30th, 2016, against 7.6
years on June 30th, 2016. Average cost of debt, after the above-mentioned currency and
interest rate swaps, increased slightly, to 4.34% per annum on September 30th, 2016, against
4.23% per annum on June 30th, 2016.
Interest coverage, measured by the ratio of the LTM21 adjusted EBITDA to LTM gross interest,
improved to 5.0x in 3Q16 vs. 4.5x in 2Q16.
Gross debt to LTM adjusted EBITDA decreased to 3.6x as of September 30th, 2016 from 4.2x
as of June 30th, 2016.
Debt indicators
US$ million 3Q16 2Q16 3Q15
Total debt 31,449 31,814 28,675
Net debt 25,965 27,508 24,213
Total debt / adjusted LTM EBITDA (x) 3.6 4.2 3.6
Adjusted LTM EBITDA / LTM gross interest (x) 5.0 4.5 4.8
21 Last twelve months.

27
Performance of the business segments
The Ferrous Minerals business segment accounted for 82.5% of Vale’s adjusted EBITDA in
3Q16, followed by 19.8% from the Base Metals business segment, 2.0% from the Fertilizers
business segment, -0.2% from the Coal business segment and -4.0% from Others.
Segment information ― 3Q16, as per footnote of financial statements
Expenses
US$ million Net
Revenues Cost¹
SG&A and
others¹ R&D¹
Pre operating & stoppage¹
Dividends Adjusted EBITDA²
Ferrous minerals 4,959 (2,293) (95) (29) (49) - 2,493
Iron ore fines 3,782 (1,648) (80) (25) (40) - 1,989
ROM 4 - - - - - 4
Pellets 991 (512) (8) (4) (5) - 462
Others ferrous 106 (70) (1) - (1) - 34
Mn & Alloys 76 (63) (6) - (3) - 4
Coal 163 (157) 3 (3) (13) - (7)
Base metals 1,579 (1,046) 116 (23) (26) - 600
Nickel3 1,159 (792) (31) (21) (26) - 289
Copper4, 5 420 (254) 147 (2) - - 311
Fertilizer nutrients 598 (501) (29) (5) (4) - 59
Others 25 (59) (63) (25) - - (122)
Total 7,324 (4,056) (68) (85) (92) - 3,023
¹ Excluding depreciation and amortization
² Excluding non-recurring effects 3 Including copper and by-products from our nickel operations 4 Including by-products from our copper operations 5 Including US$ 150 mill ion from the goldstream transaction

28
Ferrous minerals
Adjusted EBITDA of the Ferrous Minerals business segment was US$ 2.493 billion in 3Q16,
US$ 841 million higher than in 3Q15, despite the negative impact of exchange rates (US$ 121
million), which were offset by higher sales prices (US$ 392 million), lower bunker oil prices (US$
63 million) and real gains in competitiveness (US$ 508 million).
Gains in competitiveness were based mainly on: (i) marketing and commercial initiatives (US$
77 million); (ii) higher sales volumes (US$ 56 million); and (iii) ongoing cost reduction
initiatives22 (US$ 201 million).
Year-on-year EBITDA variation 3Q16 vs. 3Q15 – Ferrous Minerals business segment
Iron ore
EBITDA
Adjusted EBITDA of iron ore fines was US$ 1.989 billion in 3Q16, 20.1% higher than in 2Q16,
as a result of higher realized sales prices (US$ 199 million), lower costs23 and expenses24 (US$
180 million) and higher sales volumes (US$ 38 million), which were partially offset by the
negative impacts of the appreciation of the BRL against the USD on a quarterly average (US$
84 million).
22 Including the positive impact of renegotiations of chartering freight contracts.
23 After adjusting for the effects of higher volumes and exchange rate variation.
24 After adjusting for the effect of exchange rate variation .

29
SALES REVENUES AND VOLUME
Net sales revenues of iron ore fines, excluding pellets and Run of Mine (ROM), amounted to
US$ 3.782 billion in 3Q16 vs. US$ 3.508 billion in 2Q16, as a result of higher iron ore fines
sales prices (US$ 199 million) and higher sales volumes (US$ 75 million) in 3Q16 vs. 2Q16.
Production, including third party purchases, was 92.1 Mt in 3Q16, 5.3 Mt higher than in 2Q16
and 1.4 Mt higher than in 3Q15, mainly due to: (i) better operational performance at the mines
and plants of the Northern System; (ii) the start-up of a new crushing facility at the Fazendão
mine; and (iii) greater productivity in the Southern and Southeastern systems.
Sales volumes of iron ore fines reached 74.2 Mt in 3Q16 vs. 72.7 Mt in 2Q16, 2.1% higher than
in 2Q16, respectively, with iron ore inventory increasing by 3.0 Mt as a result of: (i) production
and acquisition of ore from third parties of 92.1 Mt; (ii) deduction of 13.2 Mt of iron ore fines
used for the production of pellets; (iii) adjustment of iron ore inventories25 of 1.4 Mt; (iv) sales
of iron ore fines of 74.2 Mt; and (v) deduction of 0.4 Mt of ROM sales.
CFR sales of iron ore fines totaled 47.8 Mt in 3Q16, practically in line with the 48.2 Mt in 2Q16.
CFR sales represented 64% of all iron ore fines sales volumes in 3Q16, slightly below the share
of CFR sales in 2Q16 (66%).
ROM sales totaled 0.4 Mt in 3Q16, remaining in line with the 0.4 Mt recorded in 2Q16.
Net operating revenue by product US$ million 3Q16 2Q16 3Q15
Iron ore fines 3,782 3,508 3,278
ROM 4 5 24
Pellets 991 868 883
Manganese & Ferroalloys 76 61 26
Others 106 99 101
Total 4,959 4,541 4,312
Volume sold ‘000 metric tons 3Q16 2Q16 3Q15
Iron ore fines 74,231 72,678 70,530
ROM 351 405 3,546
Pellets 12,001 11,388 11,961
Manganese ore 448 354 448
Ferroalloys 31 36 3
REALIZED PRICES
Iron ore sales in 3Q16 were distributed across three pricing systems: (i) 61% based on the
current quarter, month and daily spot prices, including provisional price sales that were settled
25 Iron ore inventories are periodically adjusted downwards due to moisture and handling during its processing phases.
30
within the quarter; (ii) 28% based on provisional prices with settlement price based on the
market price defined on the delivery date, in which case prices had not yet been settled at the
end of the quarter; and (iii) 11% linked to past prices (quarter-lagged).
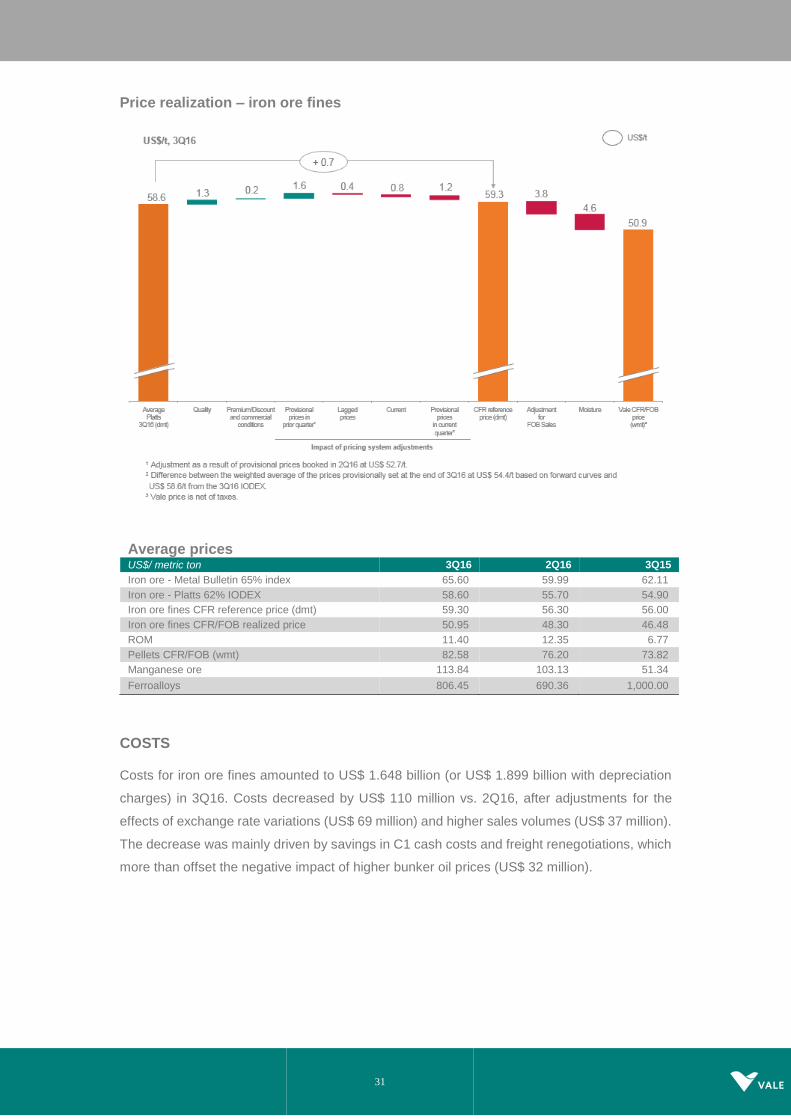
Vale’s CFR dmt reference price for iron ore fines (ex-ROM) increased by US$ 3.0/t from US$
56.3/t in 2Q16 to US$ 59.3/t in 3Q16, equivalent to a price realization of 101% of the average
Platts IODEX 62% of US$ 58.6/t in 3Q16.
Vale’s CFR/FOB wmt price for iron ore fines (ex-ROM) increased 5.4% (US$ 2.6/t) from US$
48.3/t in 2Q16 to US$ 50.9/t in 3Q16, after adjusting for moisture and the effect of FOB sales,
which accounted for 36% of the total sales volumes in 3Q16, while average Platts IODEX 62%
increased 5.2% in 3Q16 vs. 2Q16.
Price realization in 3Q16 was impacted by:
Provisional prices set at the end of 2Q16 at US$ 52.7/t, which were later adjusted based
on the price of delivery in 3Q16, which positively impacted prices in 3Q16 by US$ 1.6/t
compared to US$ 2.0/t in 2Q16, as a result of the higher realized prices in 3Q16.
Provisional prices set at the end of 3Q16 at US$ 54.4/t vs. the IODEX average of US$
58.6/t in 3Q16 which negatively impacted prices in 3Q16 by US$ 1.2/t compared to a
negative impact of US$ 1.0/t in 2Q16.
Quarter-lagged contracts, priced at US$ 56.9/t based on the average prices for Mar-
Apr-May which negatively impacted prices in 3Q16 by US$ 0.4/t compared to a
negative impact of US$ 1.2/t in 2Q16.
Iron ore sales of 21.0 Mt, or 28% of Vale’s sales mix, were recorded under the provisional
pricing system, which was set at the end of 3Q16 at US$ 54.4/t. The final prices of these sales
and the required adjustment to sales revenues will be determined and recorded in 4Q16.
31
Price realization – iron ore fines
Average prices US$/ metric ton 3Q16 2Q16 3Q15
Iron ore - Metal Bulletin 65% index 65.60 59.99 62.11
Iron ore - Platts 62% IODEX 58.60 55.70 54.90
Iron ore fines CFR reference price (dmt) 59.30 56.30 56.00
Iron ore fines CFR/FOB realized price 50.95 48.30 46.48
ROM 11.40 12.35 6.77
Pellets CFR/FOB (wmt) 82.58 76.20 73.82
Manganese ore 113.84 103.13 51.34
Ferroalloys 806.45 690.36 1,000.00
COSTS
Costs for iron ore fines amounted to US$ 1.648 billion (or US$ 1.899 billion with depreciation
charges) in 3Q16. Costs decreased by US$ 110 million vs. 2Q16, after adjustments for the
effects of exchange rate variations (US$ 69 million) and higher sales volumes (US$ 37 million).
The decrease was mainly driven by savings in C1 cash costs and freight renegotiations, which
more than offset the negative impact of higher bunker oil prices (US$ 32 million).

32
IRON ORE COGS - 2Q16 x 3Q16
Variance drivers
US$ million 2Q16 Volume Exchange
Rate Others
Total Variation 2Q16 x 3Q16
3Q16
Total costs before depreciation and amortization
1,652 37 69 (110) (4) 1,648
Depreciation 250 6 18 (23) 1 251
Total 1,902 43 87 (133) (3) 1,899
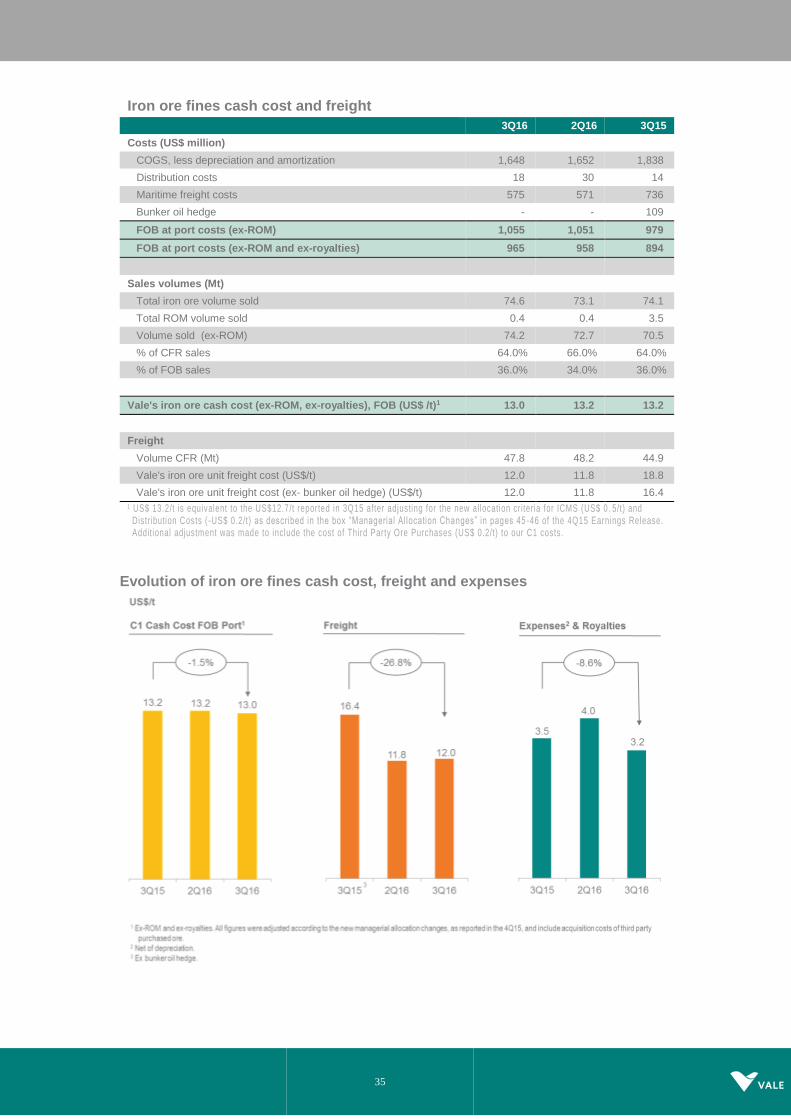
Maritime freight costs, which are fully accrued as cost of goods sold, totaled US$ 575 million in
3Q16, having increased US$ 9 million vs. 2Q16 after adjustments for lower CFR volumes (US$
5 million).
Unit maritime freight cost per iron ore metric ton was US$ 12.0/t in 3Q16, remaining practically
in line with the average spot freight index of US$ 11.7/t recorded in September 2016 and Vale’s
freight cost of US$ 11.8/t recorded in 2Q16, mainly as a result of short term freight contracts
fixed at lower rates than current spot freight levels, which partially offset the negative impact of
higher bunker oil prices (US$ 0.7/t). Vale’s average bunker oil price increased from US$ 197.0/t
in 2Q16 to US$ 232.2/t in 3Q16.
Additional negative impact on Vale’s unit maritime freight cost is expected in 4Q16 given the
recent increase in bunker oil prices and in the spot freight market, however, such impact will be
partially offset by the abovementioned chartering contracts.
C1 CASH COST
Total iron ore fines C1 cash cost at the port (mine, plant, railroad and port, ex-royalties) was
US$ 965 million after deducting depreciation of US$ 251 million, iron ore maritime freight costs
of US$ 575 million and distribution costs of US$ 18 million.
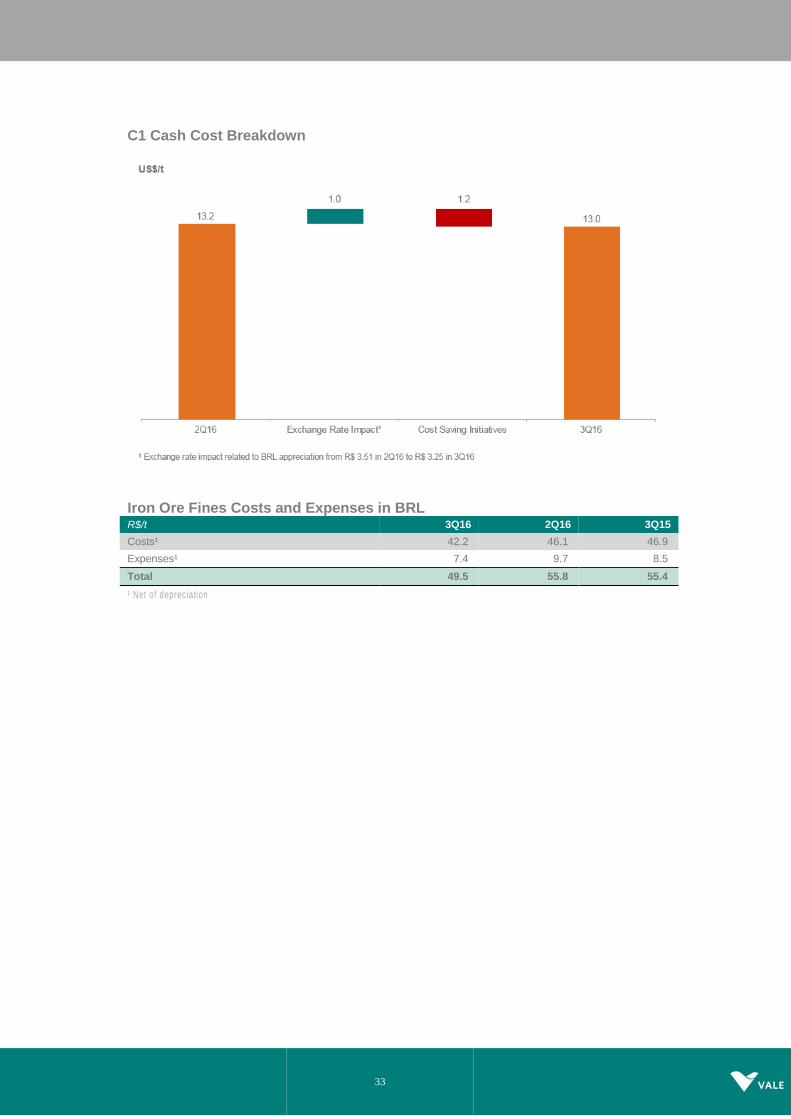
C1 cash cost FOB port per metric ton for iron ore fines ex-royalties decreased US$0.2/t, from
the US$ 13.2/t recorded in 2Q16 to US$ 13.0/t in 3Q16, as a result of the strong cost savings
in BRL, which more than offset the negative impact of the BRL appreciation against the USD
on a quarterly average (US$ 1.0/t).
C1 cash cost FOB port per metric ton of iron ore fines in BRL was R$ 42.2/t in 3Q16, R$ 3.9/t
lower than the R$ 46.1/t recorded in 2Q16, despite the inflationary pressures in Brazil. The
reduction in costs was mainly due to improvements in operational productivity, cost-cutting
initiatives and the increased fixed-costs dilution on seasonally higher production volumes.
33
C1 Cash Cost Breakdown
Iron Ore Fines Costs and Expenses in BRL
R$/t 3Q16 2Q16 3Q15
Costs¹ 42.2 46.1 46.9
Expenses¹ 7.4 9.7 8.5
Total 49.5 55.8 55.4
¹ Net of depreciation

34
Evolution of C1 Cash Cost¹ per ton in BRL
EXPENSES
Iron ore expenses, net of depreciation, amounted to US$ 145 million in 3Q16, 27.5% lower than
the US$ 200 million recorded in 2Q16. SG&A and other expenses totaled US$ 80 million in
3Q16, 47% lower than the US$ 150 million recorded in 2Q16, mainly as a result of the adoption
of new managerial criteria for allocating, in “Other Business Segment”, the Simandou and
Samarco legal, remediation and other expenses incurred by Vale in 2016, amounting to US$
19 million and US$ 41 million, respectively. R&D amounted to US$ 25 million, increasing US$
9 million vs. 2Q16, following the regular seasonality of expenditures. Pre-operating and
stoppage expenses, net of depreciation, amounted to US$ 40 million, 18% higher than the US$
34 million recorded in 2Q16, mainly as a result of the increase in S11D pre-operating expenses
(US$ 9 million).
35
Iron ore fines cash cost and freight
3Q16 2Q16 3Q15
Costs (US$ million)
COGS, less depreciation and amortization 1,648 1,652 1,838
Distribution costs 18 30 14
Maritime freight costs 575 571 736
Bunker oil hedge - - 109
FOB at port costs (ex-ROM) 1,055 1,051 979
FOB at port costs (ex-ROM and ex-royalties) 965 958 894
Sales volumes (Mt)
Total iron ore volume sold 74.6 73.1 74.1
Total ROM volume sold 0.4 0.4 3.5
Volume sold (ex-ROM) 74.2 72.7 70.5
% of CFR sales 64.0% 66.0% 64.0%
% of FOB sales 36.0% 34.0% 36.0%
Vale's iron ore cash cost (ex-ROM, ex-royalties), FOB (US$ /t)1 13.0 13.2 13.2
Freight
Volume CFR (Mt) 47.8 48.2 44.9
Vale's iron ore unit freight cost (US$/t) 12.0 11.8 18.8
Vale's iron ore unit freight cost (ex- bunker oil hedge) (US$/t) 12.0 11.8 16.4
¹ US$ 13.2/t is equivalent to the US$12.7/t reported in 3Q15 after adjusting for the new allocation cr iteria for ICMS (US$ 0. 5/t) and Distribution Costs ( -US$ 0.2/t) as described in the box “Managerial Al location Changes” in pages 45 -46 of the 4Q15 Earnings Release. Addit ional adjustment was made to include the cost of Third Party Ore Purchases (US$ 0.2/t) to our C1 costs.
Evolution of iron ore fines cash cost, freight and expenses
36
Evolution of iron ore fines sustaining per ton
US$/dmt
Iron ore pellets
Adjusted EBITDA for pellets in 3Q16 was US$ 462 million, US$ 25 million higher than in 2Q16,
mainly as a result of the positive impacts of higher sales prices (US$ 76 million) and higher
sales volumes (US$ 21 million), which were partially offset by the lack of dividends received
from the leased pelletizing plants (US$ 60 million), which are usually paid every 6 months, and
the negative impact of exchange rate variations (US$ 25 million).
Net sales revenues for pellets amounted to US$ 991 million in 3Q16, increasing US$ 123 million
from the US$ 868 million recorded in 2Q16 as a result of higher realized sales prices (US$ 76
million), which increased from an average of US$ 76.2 per ton in 2Q16 to US$ 82.6 per ton in
3Q16, and higher sales volumes (US$ 47 million), which increased from the 11.4 Mt recorded
in 2Q16 to 12.0 Mt in 3Q16.
Production reached 12.1 Mt in 3Q16, 2.0 Mt higher than in 2Q16 mainly as a result of: (i) the
resumption of the Fábrica pelletizing plant; and (ii) the higher feed availability for the Vargem
Grande and Tubarão plants.
CFR pellet sales of 2.2 Mt in 3Q16 represented 18% of total pellets sales and were 0.3 Mt
higher than in 2Q16. FOB pellet sales increased from 9.5 Mt in 2Q16 to 9.8 Mt in 3Q16.
Pellet CFR/FOB prices increased by US$ 6.4/t to US$ 82.6/t in 3Q16, whereas the Platt’s
IODEX iron ore reference price (CFR China) increased by only US$ 2.9/t in the quarter, as a
result of higher pellet premiums in the quarter and the positive impact from Vale’s pricing
systems.
37
Pellet costs totaled US$ 512 million (or US$ 599 million with depreciation charges) in 3Q16.
Costs decreased by US$ 4 million vs. 2Q16 after adjusting for the effects of higher volumes
(US$ 26 million) and exchange rate variations (US$ 23 million).
Pre-operating and stoppage expenses for pellets were US$ 4 million in 3Q16, US$ 5 million
lower than in 2Q16 mainly due to the resumption of the Fábrica pellet plant. SG&A and others
expenses decreased US$ 11 million in 3Q16 vs 2Q16.
EBITDA unit margin for pellets was US$ 38.5/t in 3Q16, in line with 2Q16.
Pellets - EBITDA ex-Samarco 3Q16 2Q16
US$ million US$/wmt US$ million US$/wmt
Net Revenues / Realized Price 991 82.6 868 76.2
Dividends Received (Leased pelletizing plants) ex-Samarco - - 60 5.3
Cash Costs (Iron ore, leasing, freight, overhead, energy and other) (512) -42.7 (459) -40.3
Expenses (SG&A, R&D and other) (17) -1.4 (32) -2.8
EBITDA ex-Samarco 462 38.5 437 38.4
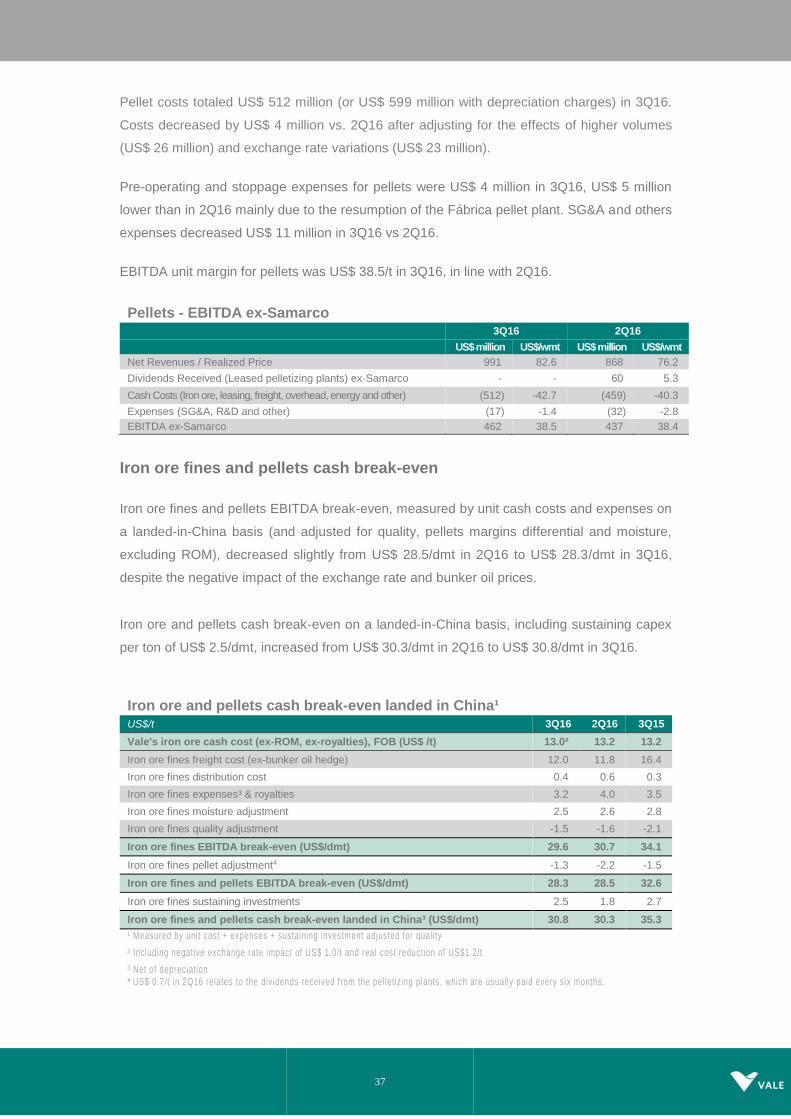
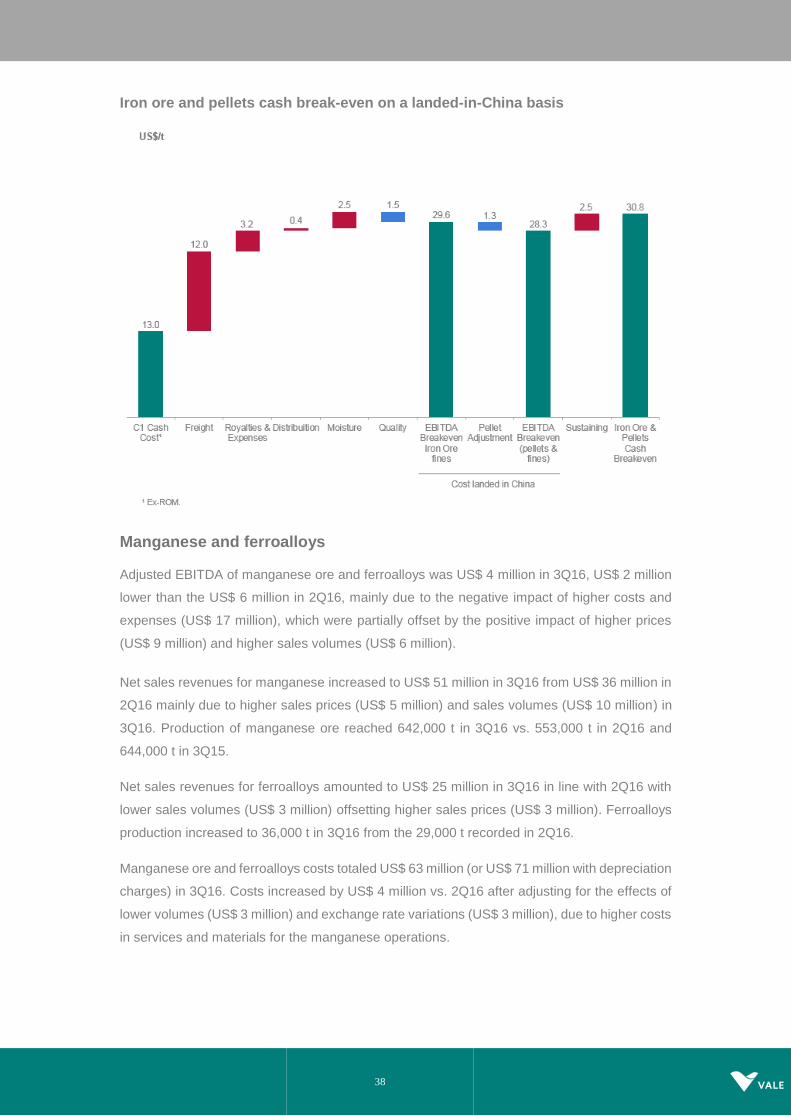
Iron ore fines and pellets cash break-even
Iron ore fines and pellets EBITDA break-even, measured by unit cash costs and expenses on
a landed-in-China basis (and adjusted for quality, pellets margins differential and moisture,
excluding ROM), decreased slightly from US$ 28.5/dmt in 2Q16 to US$ 28.3/dmt in 3Q16,
despite the negative impact of the exchange rate and bunker oil prices.
Iron ore and pellets cash break-even on a landed-in-China basis, including sustaining capex
per ton of US$ 2.5/dmt, increased from US$ 30.3/dmt in 2Q16 to US$ 30.8/dmt in 3Q16.
Iron ore and pellets cash break-even landed in China¹
US$/t 3Q16 2Q16 3Q15
Vale's iron ore cash cost (ex-ROM, ex-royalties), FOB (US$ /t) 13.0² 13.2 13.2
Iron ore fines freight cost (ex-bunker oil hedge) 12.0 11.8 16.4
Iron ore fines distribution cost 0.4 0.6 0.3
Iron ore fines expenses³ & royalties 3.2 4.0 3.5
Iron ore fines moisture adjustment 2.5 2.6 2.8
Iron ore fines quality adjustment -1.5 -1.6 -2.1
Iron ore fines EBITDA break-even (US$/dmt) 29.6 30.7 34.1
Iron ore fines pellet adjustment4 -1.3 -2.2 -1.5
Iron ore fines and pellets EBITDA break-even (US$/dmt) 28.3 28.5 32.6
Iron ore fines sustaining investments 2.5 1.8 2.7
Iron ore fines and pellets cash break-even landed in China³ (US$/dmt) 30.8 30.3 35.3
¹ Measured by uni t cost + expenses + sustaining investment adjusted for quali ty
² Including negative exchange rate impact of US$ 1.0/t and real cost reduction of US$1.2/t
³ Net of depreciation
4 US$ 0.7/t in 2Q16 relates to the dividends received from the pel letizing plants, which are usually paid every six months.
38
Iron ore and pellets cash break-even on a landed-in-China basis
Manganese and ferroalloys
Adjusted EBITDA of manganese ore and ferroalloys was US$ 4 million in 3Q16, US$ 2 million
lower than the US$ 6 million in 2Q16, mainly due to the negative impact of higher costs and
expenses (US$ 17 million), which were partially offset by the positive impact of higher prices
(US$ 9 million) and higher sales volumes (US$ 6 million).
Net sales revenues for manganese increased to US$ 51 million in 3Q16 from US$ 36 million in
2Q16 mainly due to higher sales prices (US$ 5 million) and sales volumes (US$ 10 million) in
3Q16. Production of manganese ore reached 642,000 t in 3Q16 vs. 553,000 t in 2Q16 and
644,000 t in 3Q15.
Net sales revenues for ferroalloys amounted to US$ 25 million in 3Q16 in line with 2Q16 with
lower sales volumes (US$ 3 million) offsetting higher sales prices (US$ 3 million). Ferroalloys
production increased to 36,000 t in 3Q16 from the 29,000 t recorded in 2Q16.
Manganese ore and ferroalloys costs totaled US$ 63 million (or US$ 71 million with depreciation
charges) in 3Q16. Costs increased by US$ 4 million vs. 2Q16 after adjusting for the effects of
lower volumes (US$ 3 million) and exchange rate variations (US$ 3 million), due to higher costs
in services and materials for the manganese operations.

39
Market outlook – iron ore
Iron ore Platts IODEX 62% averaged US$ 58.60/dmt in 3Q16, increasing 6.7% year-on-year
and 5.4% quarter-on-quarter. Prices improved on the back of a continuous growth in fixed asset
investments in China and a more positive sentiment towards the Chinese real estate market.
The loosening of the monetary policy in China since the second half of 2015 together with fiscal
and credit support in 3Q16 kept the economy growing at healthier levels. Property sales grew
25% year-on-year in 3Q16, supporting investments in new and ongoing constructions and
keeping steel demand steady.
Production of steel in China continued strong reaching 603.8 Mt in 9M16, reversing the yearly
drop and increasing 0.4% in the period, despite production cuts during events such as the G20
meeting in Hangzhou and the Horticultural Exposition in Tangshan. Demand for imported iron
ore surged to 92.9 Mt in September, the highest reading this year, taking the 9M16 iron ore
imports to 763 Mt, a 9.1% year-on-year increase compared to 9M15. Also, demand for high
grade iron ore was encouraged after the spike in coking coal prices in 3Q16, as the higher the
Fe grade the lower the need for coking coal in the steelmaking process. Throughout the quarter,
most of the Chinese steel mills continued profitable as steel prices remained at the high levels
reached in 2Q16.
Going forward, we expect the market for iron ore to remain stable, as the current credit
availability in China should provide support for the economy. However, steel demand and
production are expected to ease towards the end of the year due to seasonality.
Volume sold by destination – Iron ore and pellets
‘000 metric tons 3Q16 % 2Q16 % 3Q15 %
Americas 9,275 10.7 8,054 9.5 10,760 12.5
Brazil 7,384 8.5 6,291 7.4 9,363 10.9
Others 1,891 2.2 1,763 2.1 1,397 1.6
Asia 61,353 70.9 60,568 71.7 59,597 69.3
China 49,061 56.7 48,176 57.0 46,512 54.1
Japan 7,512 8.7 7,778 9.2 8,548 9.9
Others 4,780 5.5 4,614 5.5 4,537 5.3
Europe 12,421 14.3 12,893 15.3 13,014 15.1
Germany 4,753 5.5 5,160 6.1 5,219 6.1
France 1,549 1.8 1,799 2.1 1,497 1.7
Others 6,119 7.1 5,934 7.0 6,298 7.3
Middle East 2,274 2.6 2,231 2.6 2,401 2.8
Rest of the World 1,260 1.5 725 0.9 265 0.3
Total 86,583 100.0 84,471 100.0 86,037 100.0

40
Selected financial indicators – Ferrous Minerals
US$ million 3Q16 2Q16 3Q15
Net Revenues 4,959 4.541 4.312
Costs¹ (2,293) (2.228) (2.447)
Expenses¹ (95) (171) (153)
Pre-operating and stoppage expenses¹ (49) (46) (32)
R&D expenses (29) (20) (28)
Dividends received - 60 -
Adjusted EBITDA 2,493 2.136 1.652
Depreciation and amortization (399) (381) (402)
Adjusted EBIT 2,094 1.695 1.250
Adjusted EBIT margin (%) 42.2 37.3 29.0
¹ Net of depreciation and amortization
Selected financial indicators – Iron ore fines
3Q16 2Q16 3Q15
Adjusted EBITDA (US$ million) 1,989 1,656 1,236
Volume Sold (Mt) 74.231 72.678 70.530
Adjusted EBITDA (US$/t) 26.79 22.79 17.52
Selected financial indicators – Pellets (excluding Samarco)
3Q16 2Q16 3Q15
Adjusted EBITDA (US$ million) 462 437 382
Volume Sold (Mt) 12.001 11.388 11.961
Adjusted EBITDA (US$/t) 38.50 38.37 31.94
Selected financial indicators – Iron ore fines and Pellets
3Q16 2Q16 3Q15
Adjusted EBITDA (US$ million) 2.451 2.093 1.618
Volume Sold (Mt) 86.232 84.066 82.491
Adjusted EBITDA (US$/t) 28.42 24.90 19.61
41
Base Metals
Adjusted EBITDA was US$ 600 million in 3Q16, increasing US$ 224 million vs. 2Q16 mainly
as a result of the one-off positive effect of the goldstream transaction (US$ 150 million) and
higher prices (US$ 114 million), which more than offset the negative impact of higher costs26
(US$ 19 million) and exchange rate variation (US$ 16 million).
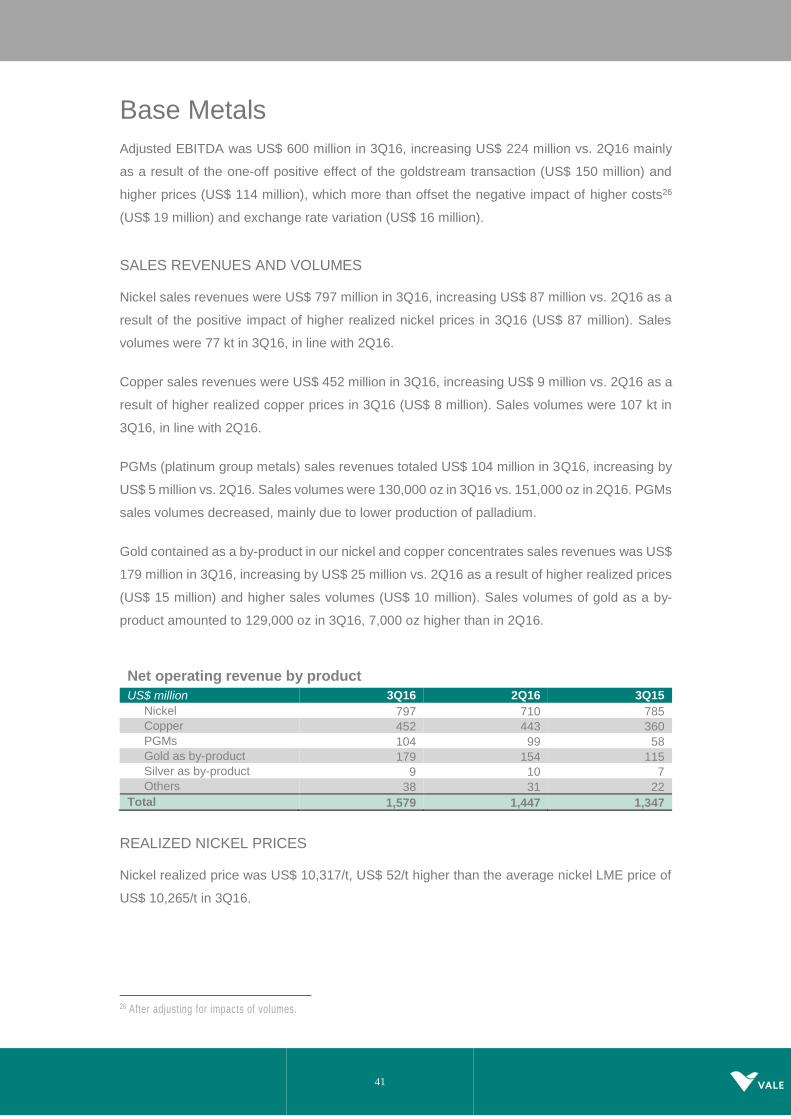
SALES REVENUES AND VOLUMES
Nickel sales revenues were US$ 797 million in 3Q16, increasing US$ 87 million vs. 2Q16 as a
result of the positive impact of higher realized nickel prices in 3Q16 (US$ 87 million). Sales
volumes were 77 kt in 3Q16, in line with 2Q16.
Copper sales revenues were US$ 452 million in 3Q16, increasing US$ 9 million vs. 2Q16 as a
result of higher realized copper prices in 3Q16 (US$ 8 million). Sales volumes were 107 kt in
3Q16, in line with 2Q16.
PGMs (platinum group metals) sales revenues totaled US$ 104 million in 3Q16, increasing by
US$ 5 million vs. 2Q16. Sales volumes were 130,000 oz in 3Q16 vs. 151,000 oz in 2Q16. PGMs
sales volumes decreased, mainly due to lower production of palladium.
Gold contained as a by-product in our nickel and copper concentrates sales revenues was US$
179 million in 3Q16, increasing by US$ 25 million vs. 2Q16 as a result of higher realized prices
(US$ 15 million) and higher sales volumes (US$ 10 million). Sales volumes of gold as a by-
product amounted to 129,000 oz in 3Q16, 7,000 oz higher than in 2Q16.
Net operating revenue by product US$ million 3Q16 2Q16 3Q15
Nickel 797 710 785
Copper 452 443 360
PGMs 104 99 58
Gold as by-product 179 154 115
Silver as by-product 9 10 7
Others 38 31 22
Total 1,579 1,447 1,347
REALIZED NICKEL PRICES
Nickel realized price was US$ 10,317/t, US$ 52/t higher than the average nickel LME price of
US$ 10,265/t in 3Q16.
26 After adjusting for impacts of volumes.

42
Vale’s nickel products are divided into two categories, refined nickel (pellets, powder, cathode,
FeNi, Utility Nickel™ and Tonimet™) and intermediates (concentrates, matte, NiO and NHC).
Refined nickel products have higher nickel content, typically commanding a premium over the
average LME nickel price, whereas nickel intermediates are less pure as they are only partially
processed. Due to this difference, intermediate products are sold at a discount. The amount
of the discount will vary depending on the amount of processing still required, product forms
and level of impurities. The sales product mix is an important driver of nickel price realization.
Refined nickel sales accounted for 88% of total nickel sales in 3Q16, in line with 2Q16. Sales
of intermediate products accounted for the balance.
The realized nickel price differed from the average LME price in 3Q16 due to the following
impacts:
(i) Premium for refined finished nickel products averaged US$ 319/t, with an impact on
the aggregate realized nickel price of US$ 281/t;
(ii) Discount for intermediate nickel products averaged US$ 1,944/t, with an impact on the
aggregate realized nickel price of -US$ 229/t.
Price realization – nickel
REALIZED COPPER PRICES
Realized copper price was US$ 4,218/t, US$ 554/t lower than the average copper LME price
of US$ 4,772/t in 3Q16. Vale’s copper products are mostly intermediate forms of copper,
predominately in the form of concentrate, which is sold at a discount to the LME. These products

43
are sold on a provisional pricing basis during the quarter with final prices determined at a future
period, generally one to four months forward27.
The realized copper price differed from the average LME price in 3Q16 due to the following
impacts:
Current period price adjustments: mark-to-market of invoices still open in the quarter
based on the copper price forward curve28 at the end of the quarter (-US$ 105/t).
Prior period price adjustment: variance between the price used in final invoices (and in
the mark-to-market of invoices from previous quarters still open at the end of the
quarter) and the provisional prices used for sales in previous quarters (-US$ 101/t).
TC/RCs, penalties, premiums and discounts for intermediate products (-US$ 348/t).
Excluding the effects of prior period price adjustments and the discounts for copper
intermediate products, including TC/RCs, the gross realized copper price29 was US$ 4,667/t in
3Q16.
Price realization – copper
Realized copper prices increased 1.8% in 3Q16 vs. 2Q16, while LME copper prices increased
1% in the same period, mainly due to lower discounts associated with copper intermediate
products that decreased the TC/RCs, penalties, premiums and discounts in 3Q16 (US$ 16
27 On September 30 th, 2016, Vale had provisionally priced copper sales totaling 106,496 tons valued at a LME forward price of
US$ 4,859/t, subject to final pricing over the next several months.
28 Includes a small amount of final invo ices that were provisionally priced and settled within the quarter.
29 Price to be used when comparing with other copper producers’ realized price.

44
million), which more than offset the higher impact of the provisional pricing system on sales
revenues that was a negative US$ 22 million in 3Q16 vs. a negative US$ 9 million in 2Q16.
Average prices
US$/ metric ton 3Q16 2Q16 3Q15
Nickel - LME 10,265 8,823 10,561
Copper - LME 4,772 4,729 5,259
Nickel 10,317 9,180 10,865
Copper 4,218 4,144 3,892
Platinum (US$/oz) 1,060 909 1,005
Gold (US$/oz) 1,383 1,266 1,095
Silver (US$/oz) 15.15 16.66 13.49
Cobalt (US$/lb) 11.83 10.41 14.54
SALES VOLUME PERFORMANCE
Sales volumes of nickel achieved a record for a third quarter of 77 kt in 3Q16, in line with the
previous quarter and 5 kt higher than in 3Q15.
Sales volumes of copper achieved a record for a third quarter of 107 kt in 3Q16, in line with
2Q16, and 13 kt higher than in 3Q15, due to higher sales of copper from our North Atlantic
nickel operations and Salobo as it continues its ramp-up.
Sales volumes of gold as a by-product achieved a record 129,000 oz in 3Q16, 7,000 oz higher
than in 2Q16 and 24,000 oz higher than in 3Q15, as a result of the ongoing ramp-up of Salobo.
Volume sold ‘000 metric tons 3Q16 2Q16 3Q15
Nickel operations & by-products
Nickel 77 77 72
Copper 42 41 32
Gold as by-product ('000 oz) 24 23 15
Silver as by-product ('000 oz) 388 480 374
PGMs ('000 oz) 130 151 83
Cobalt (metric ton) 1,069 1,000 468
Copper operations & by-products
Copper 65 66 62
Gold as by-product ('000 oz) 105 99 90
Silver as by-product ('000 oz) 221 139 154
Costs and expenses
Costs and expenses, net of the one-off effect of the goldstream transaction (US$ 150 million)
in 3Q16 and the US$ 30 million insurance payment in 2Q16, increased US$ 28 million in 3Q16,
mainly due to higher costs (US$ 19 million) and the negative impact of the exchange rate
variation (US$ 16 million), partially offset by lower expenses (US$ 6 million).

45
COSTS OF GOODS SOLD (COGS)
Costs totaled US$ 1.047 billion in 3Q16 (or US$ 1.429 billion including depreciation). After
adjusting for the effects of exchange rate variations (US$ 19 million) and lower sales volumes
(-US$ 4 million), costs increased by US$ 19 million vs. 2Q16, mainly due to scheduled
maintenance costs (US$ 35 million) at our Canadian operations and VNC.
BASE METALS COGS - 2Q16 x 3Q16
Variance drivers
US$ million 2Q16 Volume Exchange
Rate Others
Total Variation 2Q16 x 3Q16
3Q16
Total costs before depreciation and amortization
1,013 (4) 19 19 34 1,047
Depreciation 411 - 3 (32) (29) 382
Total 1,424 (4) 22 (13) 5 1,429
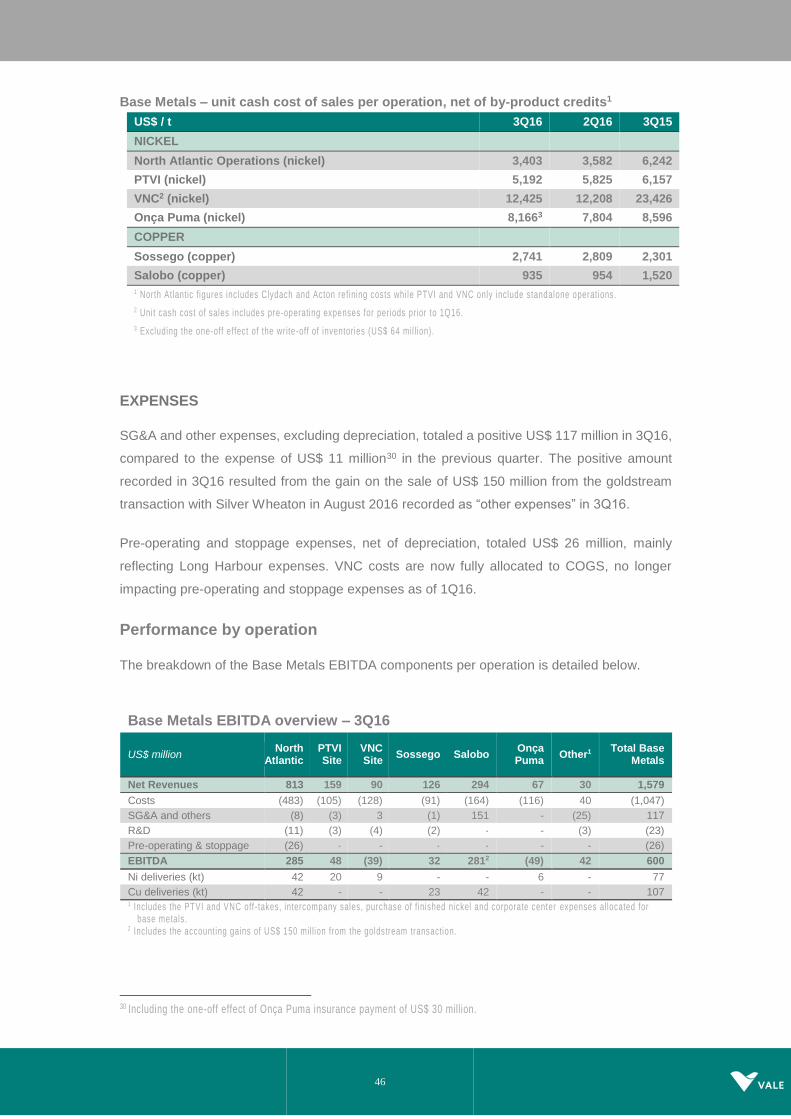
UNIT CASH COST
Unit cash cost in the North Atlantic Operations decreased in 3Q16 due to an increase in by-
product credit prices and volumes. The Onça Puma unit cost increased mainly due to the
negative impact of exchange rate variations (US$ 4 million). VNC unit costs net of by-product
credits increased from the US$ 12,208/t recorded in 2Q16 to US$ 12,425/t in 3Q16 mainly due
to costs associated with the three-week scheduled maintenance shutdown carried-out in 3Q16.
Sossego and Salobo unit costs decreased mainly due to increased revenues from by-products
which more than offset the negative impact of the exchange rate.
Base Metals – unit cash cost of sales, net of by-product credits
46
Base Metals – unit cash cost of sales per operation, net of by-product credits1
EXPENSES
SG&A and other expenses, excluding depreciation, totaled a positive US$ 117 million in 3Q16,
compared to the expense of US$ 11 million30 in the previous quarter. The positive amount
recorded in 3Q16 resulted from the gain on the sale of US$ 150 million from the goldstream
transaction with Silver Wheaton in August 2016 recorded as “other expenses” in 3Q16.
Pre-operating and stoppage expenses, net of depreciation, totaled US$ 26 million, mainly
reflecting Long Harbour expenses. VNC costs are now fully allocated to COGS, no longer
impacting pre-operating and stoppage expenses as of 1Q16.
Performance by operation
The breakdown of the Base Metals EBITDA components per operation is detailed below.
Base Metals EBITDA overview – 3Q16
US$ million North
Atlantic PTVI Site
VNC Site
Sossego Salobo Onça Puma
Other1 Total Base
Metals
Net Revenues 813 159 90 126 294 67 30 1,579
Costs (483) (105) (128) (91) (164) (116) 40 (1,047)
SG&A and others (8) (3) 3 (1) 151 - (25) 117
R&D (11) (3) (4) (2) - - (3) (23)
Pre-operating & stoppage (26) - - - - - - (26)
EBITDA 285 48 (39) 32 2812 (49) 42 600
Ni deliveries (kt) 42 20 9 - - 6 - 77
Cu deliveries (kt) 42 - - 23 42 - - 107 1 Includes the PTVI and VNC off - takes, intercompany sales, purchase of f inished nickel and corporate center expenses allocated for
base metals. 2 Includes the accounting gains of US$ 150 mill ion from the goldstream transaction.
30 Including the one-off effect of Onça Puma insurance payment of US$ 30 million.
US$ / t 3Q16 2Q16 3Q15
NICKEL
North Atlantic Operations (nickel) 3,403 3,582 6,242
PTVI (nickel) 5,192 5,825 6,157
VNC2 (nickel) 12,425 12,208 23,426
Onça Puma (nickel) 8,1663 7,804 8,596
COPPER
Sossego (copper) 2,741 2,809 2,301
Salobo (copper) 935 954 1,520
1 North Atlantic figures includes Clydach and Acton refining costs whi le PTVI and VNC only include standalone operations.
2 Unit cash cost of sales includes pre-operating expenses for periods prior to 1Q16.
3 Excluding the one-off effect of the write-off of inventories (US$ 64 mil l ion).

47
EBITDA
Details of Base Metals’ adjusted EBITDA by operations are as follows:
(i) The North Atlantic operations EBITDA was US$ 285 million, increasing by US$ 52
million vs. 2Q16 mainly as a result of favorable prices (US$ 46 million), and higher
volumes (US$ 10 million).
(ii) PTVI’s EBITDA was US$ 48 million, increasing US$ 22 million vs. 2Q16 mainly as a
result of favorable prices (US$ 18 million).
(iii) VNC's EBITDA was negative US$ 39 million, an improvement compared to the
negative US$ 50 million in 2Q16, as a result of lower expenses (US$ 8 million).
(iv) Onça Puma’s EBITDA was negative US$ 49 million, decreasing US$ 80 million vs.
2Q16 mainly as a result of the one-off effect of the write-off of inventories of low-grade
ROM (US$ 64 million) and the US$ 30 million insurance payment received in 2Q16.
(v) Sossego’s EBITDA was US$ 32 million, increasing US$ 2 million vs. 2Q16 mainly as a
result of lower costs31 (US$ 6 million) and higher realized prices (US$ 4 million) despite
the negative impact of the exchange rate variation (US$ 8 million).
(vi) Salobo’s EBITDA was US$ 131 million (US$ 281 million including the goldstream
transaction), increasing US$ 9 million vs. 2Q16 mainly as a result of higher realized
prices (US$ 11 million) and higher sales volumes (US$ 10 million) despite the negative
impact of the exchange rate variation (US$ 12 million).
Base metals – EBITDA by operation
31 Net of volume effects of US$ 6 million.
US$ million 3Q16 2Q16 3Q15
North Atlantic operation1 285 233 139
PTVI 48 26 57
VNC (39) (50) (115)
Onça Puma (49) 31 12
Sossego 32 30 36
Salobo 281 122 77
Other2 42 (16) (13)
Total 600 376 193 1 Includes the operations in Canada and in the United Kingdom.
2 Includes the PTVI and VNC off - takes, intercompany sales, purchase of f inished nickel and corporate center al location for base metals.
48
Market outlook – base metals
NICKEL
LME nickel prices improved over the third quarter of 2016 to a quarterly average of US$ 10,265/t
Ni, from US$ 8,823/t Ni in the second quarter of 2016. The rally in price can be attributed partly
to the uncertainty of ore availability, particularly from the Philippines, and the continuing
improvement in market fundamentals.
Stainless steel production in China in 3Q16 is expected to be down 4% vs. 2Q16 following
seasonal patterns, however when compared to 3Q15 production is expected to be up 9%.
Demand for nickel in non-stainless applications remained robust, particularly in the automotive
and aerospace sectors, however, oil and gas applications continued to struggle.
On the supply side, Chinese NPI production declined 7% in 3Q16 vs. 2Q16. NPI production is
also down 7% 9M16 versus 9M15. Likewise, nickel ore imports into China, which feed NPI
production, were down by 20% 8M16 vs. 8M15. Imports of FeNi into China have increased to
97.9 kt contained Ni in 8M16 versus 92.7 kt contained Ni in 8M15, largely as a result of
continued Indonesian nickel smelter production ramp-up. Refined nickel imports into China
continued to grow January through August of 2016 with 282 kt of nickel imported in 2016 versus
169 kt over the same period in 2015.
The Philippine government announced the results of their environmental audit on September
27th. This could affect significant volumes of nickel ore exports. The audit findings
recommended 20 mines for suspension for various environmental, technical, and permitting
violations. The cited mines accounted for just over half of 2015 Philippine ore exports. However,
the exact volumes of ore exports affected will not be known until the impacted miners have had
a chance to respond to the government audit and possibly come to an agreement with the
government regarding corrective measures.
Exchange inventories continued to decline during the third quarter. LME inventories at the end
of September stood at 362 kt, declining by 79.5 kt since the start of the year. Meanwhile,
inventories on the SHFE increased by 61 kt to 111 kt over the same period. The net impact on
global exchange inventories was a decline of 18.5 kt since the start of the year to end of
September.
The market has shifted into a deficit after several years of consecutive surplus. Inventories are
trending down while premiums for non-exchange deliverable metal have improved. The nickel
price has recovered from the lows seen in 1H16, however the price continues to be below the
costs of much of the nickel industry, exerting pressure on cash flow. Nickel price is expected to
slowly recover as market fundamentals continue to improve. However, supply uncertainties

49
may help accelerate recovery in price or conversely may precipitate some negative price
pressures.
The long-term outlook for nickel continues to be positive as the market shifts deeper into deficit
and capital investment for new projects and replacement volumes is deferred within the context
of challenging economic conditions. Demand is expected to pick up as global economies
stabilize and continue to grow, while increasing demand from the battery segment for electric
vehicle manufacturing will play an increasingly important role in the nickel market over the
coming years.
COPPER
LME copper prices have remained range bound, improving slightly over the third quarter of
2016 to a quarterly average of US$ 4,772/t Cu, from US$ 4,729/t Cu in the second quarter of
2016.
Demand for copper remained soft during the seasonally slow summer period as softness in
global economic conditions and copper consumption continued. However, there have been
signs of improvement in the Chinese air conditioning, auto production and housing sectors –
key copper consuming sectors.
On the supply side, production of Chinese refined copper continues to increase resulting in a
pick-up in copper concentrate imports and a slowing of refined imports (+7% and -24% in June
vs. August, respectively). There have been limited cuts to mine production in 2016 as miners
focus on productivity and lowering production costs in an effort to improve the health of their
balance sheets.
Chinese copper smelter spot TC/RCs continue to increase, rising 3% from the end of 2Q16 to
the end of 3Q16 but up 22% from the beginning of the year due to new concentrates entering
the market.
Shanghai inventories increased 14% during the third quarter after experiencing a steady
decline throughout most of 2Q16. LME inventories continued to climb in the third quarter vs.
the second quarter, adding 179 kt (+93%).
Auto production and housing sales are expected to bolster copper consumption over the
remainder of the year however key sectors such as air conditioner production and grid spending
are expected to create a drag on the market. Ongoing tightness in scrap supply continues to
provide some support for refined copper demand. However, a lack of cuts to mine supply and
a weak demand picture is expected to result in a small surplus for 2016.
The long-term outlook is expected to improve as future supply is constrained by declining ore
grades and deferred capital investment.

50
Selected financial indicators - Base Metals US$ million 3Q16 2Q16 3Q15
Net Revenues 1,579 1,447 1,347
Costs¹ (1,047) (1,013) (1,038)
Expenses¹ 117 (11) 7
Pre-operating and stoppage expenses¹ (26) (25) (97)
R&D expenses (23) (22) (26)
Adjusted EBITDA 600 376 193
Depreciation and amortization (403) (438) (437)
Adjusted EBIT 197 (63) (244)
Adjusted EBIT margin (%) 12.6 (4.4) (18.1)
¹ Net of depreciation and amortization .
51
Coal
EBITDA
Adjusted EBITDA for the Coal business segment improved significantly to negative US$ 7
million in 3Q16 from negative US$ 110 million in 2Q16, despite not fully capturing the recent
spike in index prices. The EBITDA increase of US$ 103 million was mainly driven by lower
costs and expenses32 (US$ 77 million).
Adjusted EBITDA at the Nacala port improved by 71% to negative US$ 7 million, while adjusted
EBITDA at the Beira Port (-US$ 28 million) was offset by the adjusted EBITDA from the
Australian operations (US$ 28 million).
SALES REVENUES AND VOLUMES
Net sales revenues of metallurgical coal increased to US$ 105 million in 3Q16 from US$ 77
million in 2Q16, as a result of higher sales prices (US$ 16 million) and higher sales volumes
(US$ 12 million). Net sales revenues of thermal coal decreased to US$ 58 million in 3Q16 from
US$ 68 million in 2Q16 as a result of lower sales volumes (US$ 19 million) which were partly
offset by higher sales prices (US$ 9 million).
Sales volumes of metallurgical coal totaled 1.156 Mt in 3Q16, increasing by 155 kt vs. 2Q16,
as a result of the good performance of Moatize I and the start-up of Moatize II, being partially
offset by lower sales from Carborough Downs due to the inventory build-up after the geological
instability issues faced in 2Q16. Sales volumes of thermal coal reached 1.271 Mt in 3Q16, 496
kt lower than in 2Q16, as a result of the increase in the metallurgical coal volume transported
through the Nacala Logistics Corridor with the ramp-up of Moatize II.
REALIZED PRICES
Coal sales are distributed across three pricing systems, namely the: (i) quarterly fixed
benchmark prices; (ii) index prices and (iii) fixed prices.
Quarterly fixed benchmark prices are used for pricing only metallurgical coal and are
determined based on negotiations between the Australian coal producers and the main steel
mills in Japan, South Korea and Taiwan, usually prior to the beginning of the quarter. Once the
quarterly fixed benchmark price is agreed upon and announced to the market, other coal
players adopt it for pricing their coal trades.
Index prices are provided by several index providers, such as Platts, Global Coal, TSI and Metal
Bulletin, and used as price references considering product type (metallurgical or thermal) and
32 After adjusting for the impacts of volumes and exchange rate variation.
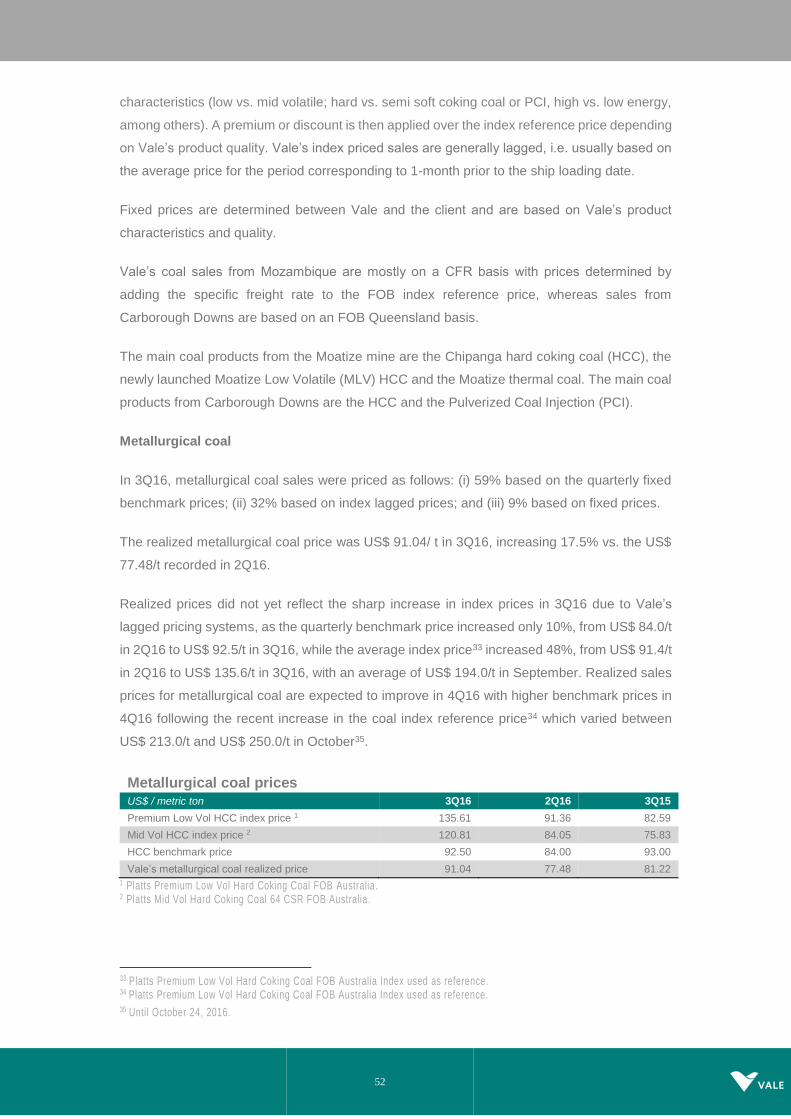
52
characteristics (low vs. mid volatile; hard vs. semi soft coking coal or PCI, high vs. low energy,
among others). A premium or discount is then applied over the index reference price depending
on Vale’s product quality. Vale’s index priced sales are generally lagged, i.e. usually based on
the average price for the period corresponding to 1-month prior to the ship loading date.
Fixed prices are determined between Vale and the client and are based on Vale’s product
characteristics and quality.
Vale’s coal sales from Mozambique are mostly on a CFR basis with prices determined by
adding the specific freight rate to the FOB index reference price, whereas sales from
Carborough Downs are based on an FOB Queensland basis.
The main coal products from the Moatize mine are the Chipanga hard coking coal (HCC), the
newly launched Moatize Low Volatile (MLV) HCC and the Moatize thermal coal. The main coal
products from Carborough Downs are the HCC and the Pulverized Coal Injection (PCI).
Metallurgical coal
In 3Q16, metallurgical coal sales were priced as follows: (i) 59% based on the quarterly fixed
benchmark prices; (ii) 32% based on index lagged prices; and (iii) 9% based on fixed prices.
The realized metallurgical coal price was US$ 91.04/ t in 3Q16, increasing 17.5% vs. the US$
77.48/t recorded in 2Q16.
Realized prices did not yet reflect the sharp increase in index prices in 3Q16 due to Vale’s
lagged pricing systems, as the quarterly benchmark price increased only 10%, from US$ 84.0/t
in 2Q16 to US$ 92.5/t in 3Q16, while the average index price33 increased 48%, from US$ 91.4/t
in 2Q16 to US$ 135.6/t in 3Q16, with an average of US$ 194.0/t in September. Realized sales
prices for metallurgical coal are expected to improve in 4Q16 with higher benchmark prices in
4Q16 following the recent increase in the coal index reference price34 which varied between
US$ 213.0/t and US$ 250.0/t in October35.
Metallurgical coal prices US$ / metric ton 3Q16 2Q16 3Q15
Premium Low Vol HCC index price 1 135.61 91.36 82.59
Mid Vol HCC index price 2 120.81 84.05 75.83
HCC benchmark price 92.50 84.00 93.00
Vale’s metallurgical coal realized price 91.04 77.48 81.22
1 Platts Premium Low Vol Hard Coking Coal FOB Australia. 2 Platts Mid Vol Hard Coking Coal 64 CSR FOB Australia.
33 Platts Premium Low Vol Hard Coking Coal FOB Australia Index used as reference. 34 Platts Premium Low Vol Hard Coking Coal FOB Australia Index used as reference. 35 Until October 24, 2016.

53
Price realization in 3Q16 for metallurgical coal from Mozambique was impacted by:
Quality adjustment over the index reference price due to product characteristics which
negatively impacted prices in 3Q16 by US$ 2.9/t.
Sales using lagged index prices which negatively impacted prices in 3Q16 by US$
12.7/t, as index prices strongly increased in the second half of 3Q16.
Sales using quarterly benchmark pricing systems which negatively impacted prices in
3Q16 by US$ 28.3/t mainly as a result of the gap between quarterly benchmark and
index prices in 3Q16.
Freight differentials which negatively impacted prices in 3Q16 by US$ 0.3/t, mainly due
to freight differentials between Vale’s freight rates contracted from Mozambique to the
delivery ports and freight rates set in the sales contracts, which are determined
considering the index reference port and the delivery ports.
Other adjustments, mainly price discounts due to market forces and penalties, which
negatively impacted prices in 3Q16 by US$ 1.2/t.
Price realization – Metallurgical coal from Mozambique
US$/t 3Q16

54
Price realization in 3Q16 for the Hard Coking Coal from Carborough Downs was impacted by:
Quality adjustment which positively impacted prices by US$ 0.6/t.
Lagged index prices which negatively impacted prices by US$ 14.5/t.
Quarterly benchmark prices which negatively impacted prices by US$ 10.4/t.
Commercial discount and other items which negatively impacted prices by US$ 3.4/t
Price realization – Carborough Downs Hard Coking Coal
US$/t, 3Q16
Thermal coal
In 3Q16, thermal coal sales were priced as follows: (i) 58% based on index prices and (ii) 42%
based on fixed prices.
The realized price of thermal coal was US$ 45.80/t in 3Q16, increasing 19.3% vs. US$ 38.38/t
in 2Q16.
Price realization in 3Q16 for thermal coal was impacted by:
Quality adjustment which negatively impacted prices by US$ 8.9/t.
Lagged index and fixed pricing which negatively impacted prices by US$ 6.3/t.
Commercial discount which negatively impacted prices by US$ 4.3/t.

55
Price realization – Thermal coal from Mozambique
US$/t, 3Q16
COSTS AND EXPENSES
Coal costs and expenses, net of depreciation, totaled US$ 170 million in 3Q16, decreasing
against the US$ 255 million recorded in 2Q16. After adjusting for the effects of lower volumes
(US$ 3 million) and exchange rate variation (US$ 1 million) and excluding the reversal of
inventory impairments in Carborough Downs (US$ 10 million), costs and expenses decreased
by US$ 77 million in 3Q16 vs. 2Q16.
QUARTERLY PERFORMANCE BY OPERATION
Highlights by operation are:
Australia
Adjusted EBITDA for the Australian operations36 was US$ 28 million in 3Q16, improving
from negative US$ 10 million in 2Q16. The increase of US$ 38 million vs. 2Q16 was
mainly a result of the positive impacts of the lower costs and expenses37 (US$ 19
million) and of the reversal of inventory impairments (US$ 10 million).
Costs and expenses, net of depreciation, for Australian operations totaled US$ 1 million
in 3Q16, compared to US$ 40 million in 2Q16, being positively impacted by the reversal
of inventory impairments of US$ 10 million in 3Q16. After adjusting for the effects of
lower volumes and exchange rate variation (US$ 10 million) and excluding the effects
36 Includes Carborough Downs operations; Broadlea and Eagle Downs are currently in care and maintenance.
37 After adjusting for the impacts of volumes and exchange rate variation.
56
of the reversal of inventory impairments (US$ 10 million), costs and expenses
decreased US$ 19 million in 3Q16 vs. 2Q16.
Mozambique
Adjusted EBITDA for the operations in Mozambique was negative US$ 35 million in
3Q16 compared to the negative US$ 100 million in 2Q16. The increase vs. 2Q16 was
mainly driven by the positive impacts of lower costs and expenses38 (US$ 58 million)
and higher sales prices (US$ 20 million).
Adjusted EBITDA at the Nacala port improved by 71% to negative US$ 7 million in
3Q16, while adjusted EBITDA at the Beira Port was negative US$ 28 million.
Production cost per ton at the Nacala port decreased 16% to US$ 87/t in 3Q16 from
US$ 103/t in 2Q16, with further reductions expected for the coming quarters as Nacala
and Moatize II ramp up.
Costs and expenses, net of depreciation, amounted to US$ 169 million in 3Q16,
compared to US$ 215 million in 2Q16. After adjusting for the effects of lower volumes
(US$ 12 million), costs and expenses decreased US$ 58 million in 3Q16 vs. 2Q16
mainly as a result of the ramp-up of the Nacala Logistic Corridor and the Moatize II
plant.
The ramp-up of the Nacala Logistics Corridor continued as planned, with 2.002 Mt
being transported on the railway in 3Q16 against 1.655 Mt in 2Q16. Twenty one
shipments (2.025 Mt) were completed in 3Q16 compared to nineteen shipments (1.567
Mt) in 2Q16.
The commissioning of the Moatize II coal handling and processing plant was concluded
with its start-up in August 2016. The ramp-up of Moatize II is progressing well, with
129,000 t produced in August and 169,000 t in September 2016.
Market outlook – coal
Coking coal prices have rallied on the back of strong Chinese demand and tight global supply.
Prices for the low volatility premium hard coking coal quarterly benchmark FOB Australia
increased by 10% from US$ 84/t in 2Q16 to US$ 92.5/t in 3Q16. Spot prices for the premium
hard coking coal averaged US$ 133/t in 3Q16, up from US$ 91/t in 2Q16.
China supply-side reforms were the main reason behind the price rally in the coal market. In
March, the Chinese Government limited operations at Chinese coal mines to a maximum of
38 After adjusting for the impact of volumes variation.

57
276 days annually, from 330 days previously, in an effort to cut surplus capacity in the coal
industry. As a result, coal production dropped by more than 10% year-to-date in August
compared to the same period of last year on an annualized basis and created a major supply
shock amid low coke inventories at a time of strong steel output in China. Supply disruptions
in Australia, due to heavy rains, longwall moves and geological issues, and production cuts
from exporting countries amounting to 57 Mt on annualized basis also limited supply in 3Q16.
Recently, Chinese regulators (NDRC) proposed a relaxation of the supply control policy by
allowing almost 800 coal mines, with capacity of 350-380 Mtpy of coking coal, to return to
operate 330 working days in an attempt to bring the market back to balance in 2017.
Thermal coal market prices (Richards Bay Coal index prices) inched higher from US$ 52.9/t in
2Q16 to US$ 65.4/t in 3Q16 supported by Chinese demand. However, Chinese regulators have
loosened their production controls, based on a three-tier supply response mechanism, allowing
the better rated coal mines (according to product quality, efficiency, safety standards) to
increase production as a strategy to prevent a power tariff hike.
Thermal coal demand in China is down only 4% year-on-year from January to August 2016,
but demand peaked in July, increasing by 8% month-on-month, and seasonal restocking is
likely to occur next quarter, providing further price support.
Coal business performance
Net operating revenue by product US$ million 3Q16 2Q16 3Q15
Metallurgical coal 105 77 115
Thermal coal 58 68 12
Total 163 145 127
Average prices US$/ metric ton 3Q16 2Q16 3Q15
Metallurgical coal 91.04 77.48 81.22
Thermal coal 45.80 38.38 48.24
Volume sold
‘000 metric tons 3Q16 2Q16 3Q15
Metallurgical coal 1,156 1,001 1,419
Thermal coal 1,271 1,767 243
Total 2,427 2,768 1,662
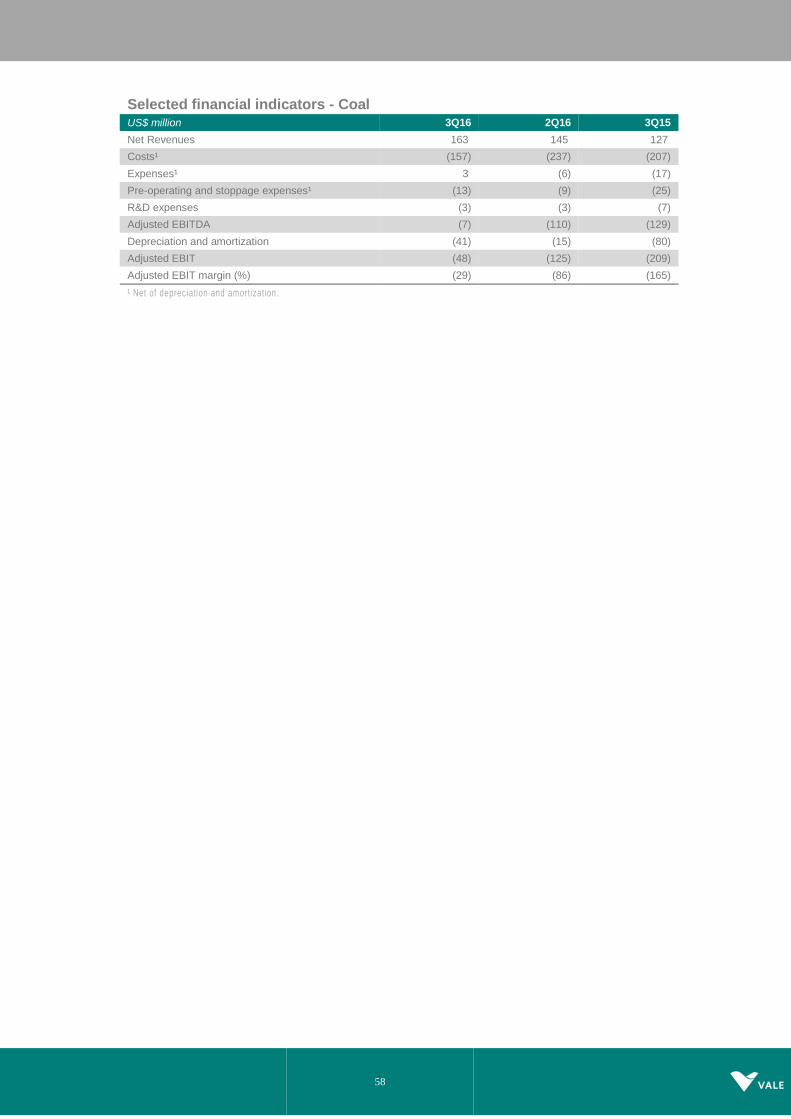
58
Selected financial indicators - Coal US$ million 3Q16 2Q16 3Q15
Net Revenues 163 145 127
Costs¹ (157) (237) (207)
Expenses¹ 3 (6) (17)
Pre-operating and stoppage expenses¹ (13) (9) (25)
R&D expenses (3) (3) (7)
Adjusted EBITDA (7) (110) (129)
Depreciation and amortization (41) (15) (80)
Adjusted EBIT (48) (125) (209)
Adjusted EBIT margin (%) (29) (86) (165)
¹ Net of depreciation and amortization .

59
Fertilizer nutrients
Adjusted EBITDA for the Fertilizer business segment increased to US$ 59 million in 3Q16 from
US$ 32 million in 2Q16. The increase of US$ 27 million was mainly driven by the positive impact
of higher sales volumes (US$ 13 million) and lower costs39 (US$ 42 million), being partly offset
by the negative impact of lower prices (US$ 17 million) and exchange rate variations (US$ 9
million).
Potash net sales revenues totaled US$ 34 million in 3Q16, US$ 12 million higher than in 2Q16.
The increase was due to higher sales volumes (US$ 13 million), which were partly offset by a
slight decrease in realized prices (US$ 1 million), alongside the reduction in international potash
prices.
Phosphate products net sales revenues totaled US$ 470 million in 3Q16, US$ 107 million
higher than in 2Q16 as a result of higher sales volumes (US$ 112 million), partially offset by
lower prices (US$ 5 million). Sales volumes increased from 1,880 kt in 2Q16 to 2,377 kt in
3Q16.
Nitrogen fertilizers net sales revenues totaled US$ 69 million in 3Q16 vs. US$ 60 million in
2Q16, as a result of higher sales volumes (US$ 13 million) which were partially offset by lower
prices (US$ 4 million).
Fertilizer costs, net of depreciation, totaled US$ 501 million in 3Q16 (or US$ 610 million with
depreciation charges), increasing by US$ 106 million vs. 2Q16. After excluding the effects of
higher volumes (US$ 129 million) and exchange rate variations (US$ 18 million), costs
decreased by US$ 42 million, mainly as a result of a decrease in raw materials prices.
SG&A and Other expenses, net of depreciation, totaled US$ 29 million in 3Q16, remaining in
line with 2Q16. R&D expenses totaled US$ 5 million in 3Q16, decreasing US$ 1 million vs.
2Q16. Pre-operating and stoppage expenses totaled US$ 4 million in 3Q16, remaining in line
with 2Q16.
Market outlook – fertilizer nutrients
Prices remained subdued as a result of a strong supply of fertilizer products alongside a
demand slowdown in major markets such as India and China due to weather conditions in
3Q16. Fertilizer demand improved in Brazil – Vale’s main market for fertilizers – on the back of
better agricultural commodities prices relative to fertilizer prices.
39 Excluding volume and exchange rate variations.
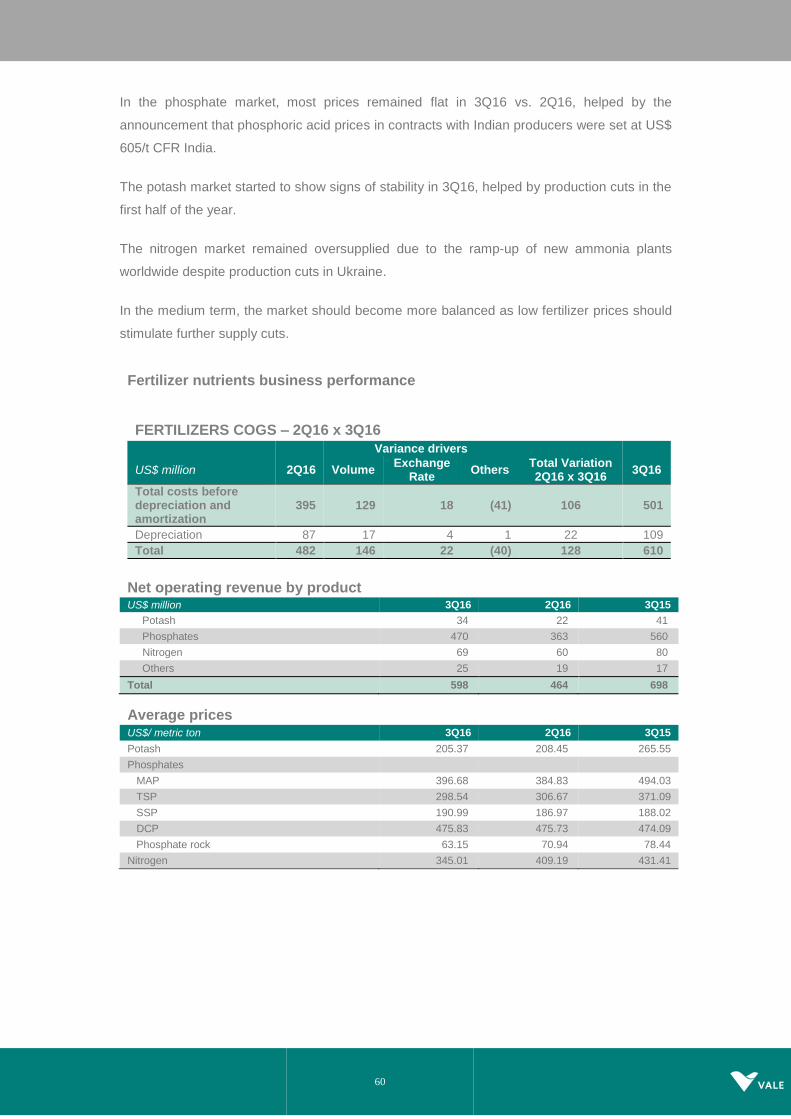
60
In the phosphate market, most prices remained flat in 3Q16 vs. 2Q16, helped by the
announcement that phosphoric acid prices in contracts with Indian producers were set at US$
605/t CFR India.
The potash market started to show signs of stability in 3Q16, helped by production cuts in the
first half of the year.
The nitrogen market remained oversupplied due to the ramp-up of new ammonia plants
worldwide despite production cuts in Ukraine.
In the medium term, the market should become more balanced as low fertilizer prices should
stimulate further supply cuts.
Fertilizer nutrients business performance
FERTILIZERS COGS – 2Q16 x 3Q16
Variance drivers
US$ million 2Q16 Volume Exchange
Rate Others
Total Variation 2Q16 x 3Q16
3Q16
Total costs before depreciation and amortization
395 129 18 (41) 106 501
Depreciation 87 17 4 1 22 109
Total 482 146 22 (40) 128 610
Net operating revenue by product US$ million 3Q16 2Q16 3Q15
Potash 34 22 41
Phosphates 470 363 560
Nitrogen 69 60 80
Others 25 19 17
Total 598 464 698
Average prices
US$/ metric ton 3Q16 2Q16 3Q15
Potash 205.37 208.45 265.55
Phosphates
MAP 396.68 384.83 494.03
TSP 298.54 306.67 371.09
SSP 190.99 186.97 188.02
DCP 475.83 475.73 474.09
Phosphate rock 63.15 70.94 78.44
Nitrogen 345.01 409.19 431.41
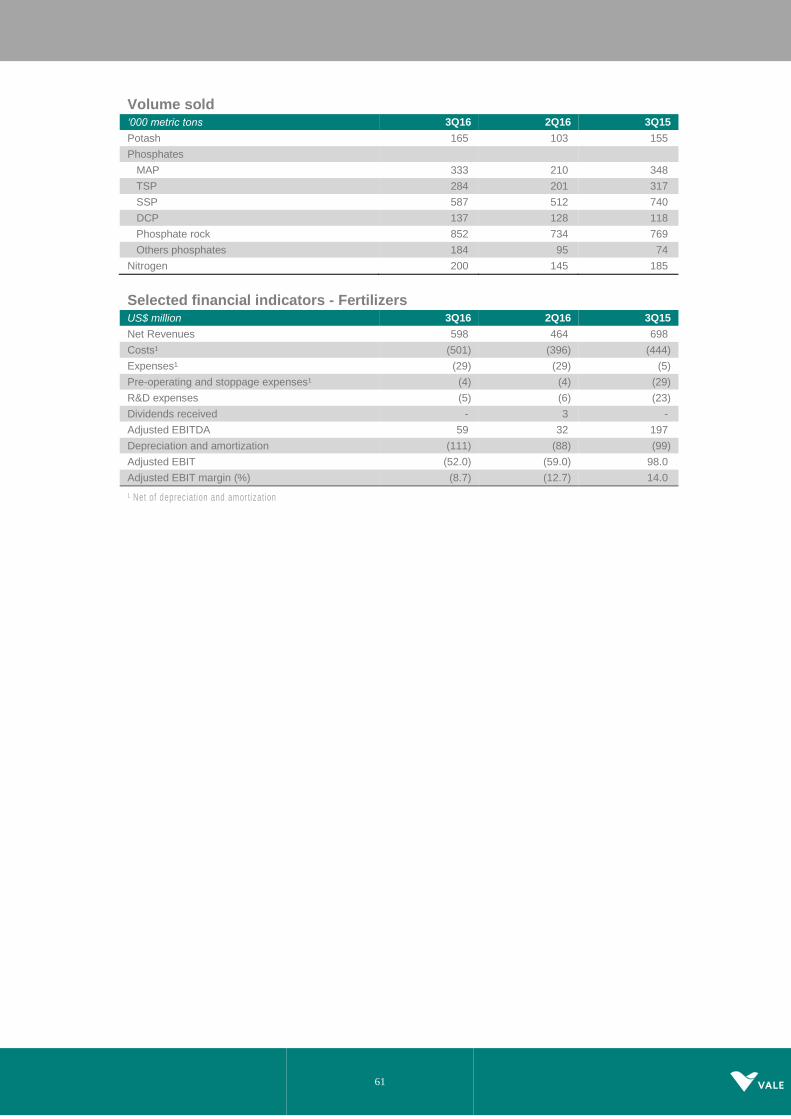
61
Volume sold
‘000 metric tons 3Q16 2Q16 3Q15
Potash 165 103 155
Phosphates
MAP 333 210 348
TSP 284 201 317
SSP 587 512 740
DCP 137 128 118
Phosphate rock 852 734 769
Others phosphates 184 95 74
Nitrogen 200 145 185
Selected financial indicators - Fertilizers
US$ million 3Q16 2Q16 3Q15
Net Revenues 598 464 698
Costs¹ (501) (396) (444)
Expenses¹ (29) (29) (5)
Pre-operating and stoppage expenses¹ (4) (4) (29)
R&D expenses (5) (6) (23)
Dividends received - 3 -
Adjusted EBITDA 59 32 197
Depreciation and amortization (111) (88) (99)
Adjusted EBIT (52.0) (59.0) 98.0
Adjusted EBIT margin (%) (8.7) (12.7) 14.0
¹ Net of depreciation and amortization
62
Financial indicators of non-consolidated companies
For selected financial indicators of the main non-consolidated companies, see our quarterly
financial statements on www.vale.com / investors / information to the market / financial
statements.
Conference call and webcast
Vale will host two conference calls and webcasts on Thursday, October 27th, 2016. The first, in
Portuguese (non-translated), will begin at 10:00 a.m. Rio de Janeiro time. The second, in
English, at 12:00 p.m. Rio de Janeiro time (10:00 a.m. US Eastern Daylight Time, 3:00 p.m.
British Standard Time).
Dial in to conference calls/webcasts:
In Portuguese:
Participants from Brazil: (55 11) 3193-1001 or (55 11) 2820-4001
Participants from the US: (1 888) 700-0802
Participants from other countries: (1 786) 924-6977
Access code: VALE
In English:
Participants from Brazil: (55 11) 3193-1001 or (55 11) 2820-4001
Participants from the U.S.: (1 866) 262-4553
Participants from other countries: (1 412) 317-6029
Access code: VALE
Instructions for participation will be available on the website: www.vale.com/investors. A
podcast will be available on Vale’s Investor Relations website.
This press release may include statements that present Vale’s expectations about future events or results. All statements, when based upon
expectations about the future, involve various risks and uncertainties. Vale cannot guarantee that such statements will prove correct. These
risks and uncertainties include factors related to the following: (a) the countries where we operate, especially Brazil and Canada; (b) the global
economy; (c) the capital markets; (d) the mining and metals prices and their dependence on global industrial production, which is cyclical by
nature; and (e) global competition in the markets in which Vale operates. To obtain further information on factors that may lead to results
different from those forecast by Vale, please consult the reports Vale files with the U.S. Securities and Exchange Commission (SEC), the
Brazilian Comissão de Valores Mobiliários (CVM) and the French Autorité des Marchés Financiers (AMF), and in particular the factors discussed
under “Forward-Looking Statements” and “Risk Factors” in Vale’s annual report on Form 20-F.
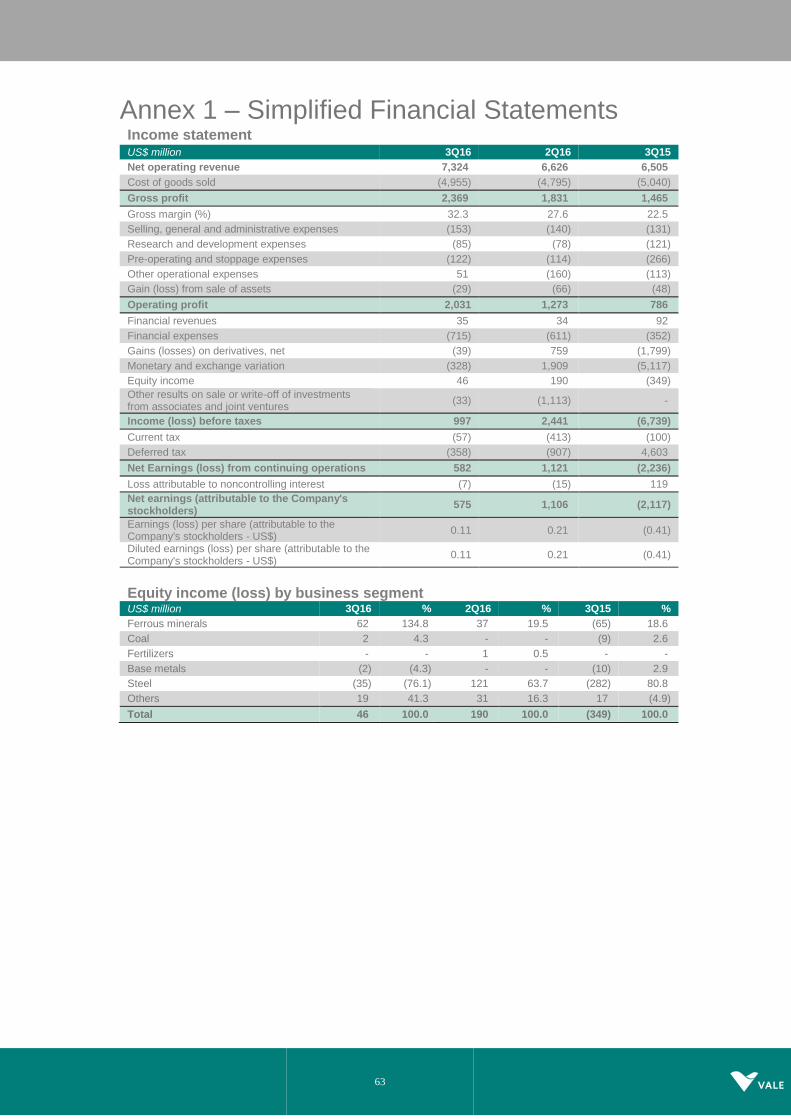
63
Annex 1 – Simplified Financial Statements Income statement US$ million 3Q16 2Q16 3Q15
Net operating revenue 7,324 6,626 6,505
Cost of goods sold (4,955) (4,795) (5,040)
Gross profit 2,369 1,831 1,465
Gross margin (%) 32.3 27.6 22.5
Selling, general and administrative expenses (153) (140) (131)
Research and development expenses (85) (78) (121)
Pre-operating and stoppage expenses (122) (114) (266)
Other operational expenses 51 (160) (113)
Gain (loss) from sale of assets (29) (66) (48)
Operating profit 2,031 1,273 786
Financial revenues 35 34 92
Financial expenses (715) (611) (352)
Gains (losses) on derivatives, net (39) 759 (1,799)
Monetary and exchange variation (328) 1,909 (5,117)
Equity income 46 190 (349)
Other results on sale or write-off of investments from associates and joint ventures
(33) (1,113) -
Income (loss) before taxes 997 2,441 (6,739)
Current tax (57) (413) (100)
Deferred tax (358) (907) 4,603
Net Earnings (loss) from continuing operations 582 1,121 (2,236)
Loss attributable to noncontrolling interest (7) (15) 119
Net earnings (attributable to the Company's stockholders)
575 1,106 (2,117)
Earnings (loss) per share (attributable to the Company's stockholders - US$)
0.11 0.21 (0.41)
Diluted earnings (loss) per share (attributable to the Company's stockholders - US$)
0.11 0.21 (0.41)
Equity income (loss) by business segment US$ million 3Q16 % 2Q16 % 3Q15 %
Ferrous minerals 62 134.8 37 19.5 (65) 18.6
Coal 2 4.3 - - (9) 2.6
Fertilizers - - 1 0.5 - -
Base metals (2) (4.3) - - (10) 2.9
Steel (35) (76.1) 121 63.7 (282) 80.8
Others 19 41.3 31 16.3 17 (4.9)
Total 46 100.0 190 100.0 (349) 100.0

64
Balance sheet US$ million 30/09/2016 30/06/2016 30/09/2015
Assets
Current assets 19,507 18,274 17,701
Cash and cash equivalents 5,369 4,168 4,397
Financial investments 115 138 65
Derivative financial instruments 141 136 158
Accounts receivable 2,556 2,452 2,028
Related parties 66 68 343
Inventories 3,900 3,866 3,808
Prepaid income taxes 317 299 904
Recoverable taxes 1,603 1,781 1,364
Others 651 708 746
Non-current assets held for sale and discontinued operation
4,789 4,658 3,888
Non-current assets 10,581 10,861 10,857
Related parties 19 3 23
Loans and financing agreements receivable 182 179 194
Judicial deposits 1,073 1,090 838
Recoverable income taxes 542 513 417
Deferred income taxes 6,849 7,289 7,982
Recoverable taxes 688 619 527
Derivative financial instruments 504 497 133
Others 661 671 743
Fixed assets 72,062 71,835 70,467
Total assets 102,087 100,970 99,025
Liabilities
Current liabilities 10,847 11,546 10,226
Suppliers and contractors 3,751 3,891 3,482
Payroll and related charges 593 493 455
Derivative financial instruments 868 1,010 1,422
Loans and financing 2,181 3,153 3,030
Related parties 558 600 141
Income taxes settlement program 449 442 330
Taxes payable and royalties 185 262 261
Provision for income taxes 154 120 217
Employee postretirement obligations 72 77 69
Asset retirement obligations 70 81 81
Redeemable noncontrolling interest - - 135
Other results on sale or write-off of investments from associates and joint ventures
329 289 -
Others 1,488 1,048 323
Liabilities directly associated with non-current assets held for sale and discontinued operations
149 80 280
Non-current liabilities 49,409 47,941 44,298
Derivative financial instruments 1,167 1,201 2,808
Loans and financing 29,268 28,661 25,645
Related parties 137 144 76
Employee postretirement obligations 2,113 2,150 1,881
Provisions for litigation 919 924 858
Income taxes settlement program 4,977 5,013 3,992
Deferred income taxes 1,676 1,739 2,896
Asset retirement obligations 3,169 2,759 2,648
Participative stockholders' debentures 658 617 603
Gold stream transaction 2,158 1,666 1,785
Other results on sale or write-off of investments from associates and joint ventures
795 874 -
Others 2,372 2,193 1,106
Total liabilities 60,256 59,487 54,524
Stockholders' equity 41,831 41,483 44,501
Total liabilities and stockholders' equity 102,087 100,970 99,025
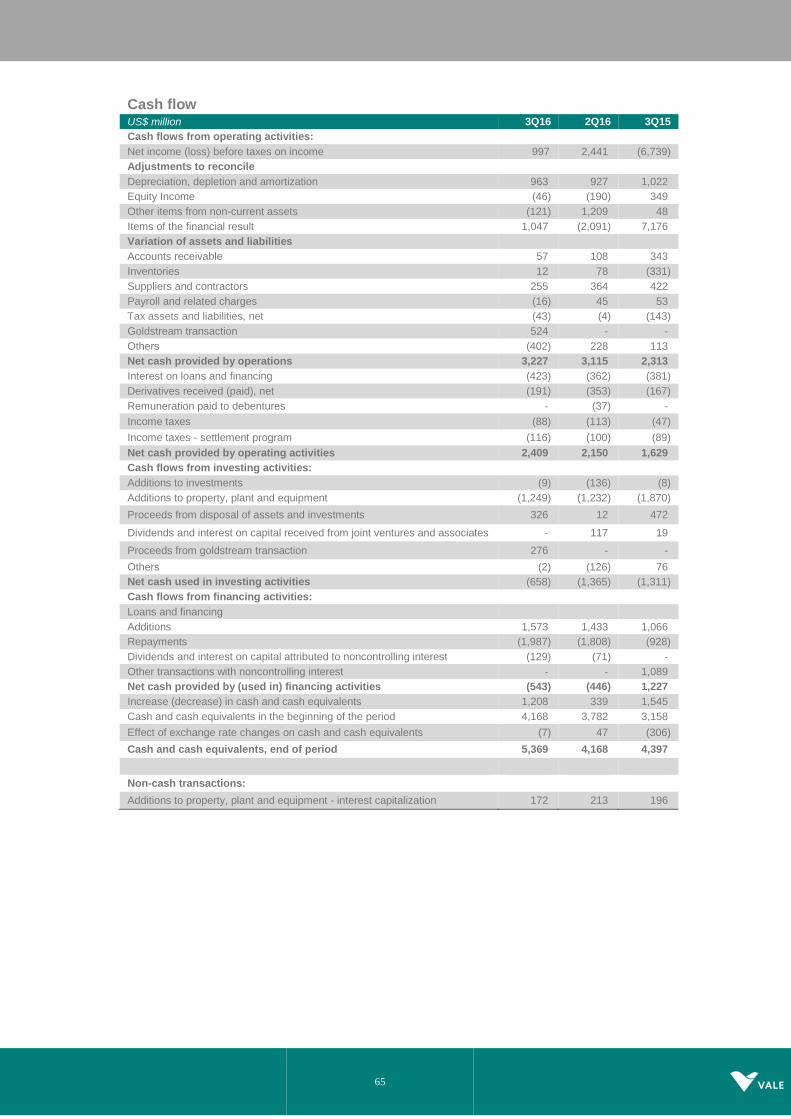
65
Cash flow US$ million 3Q16 2Q16 3Q15
Cash flows from operating activities:
Net income (loss) before taxes on income 997 2,441 (6,739)
Adjustments to reconcile
Depreciation, depletion and amortization 963 927 1,022
Equity Income (46) (190) 349
Other items from non-current assets (121) 1,209 48
Items of the financial result 1,047 (2,091) 7,176
Variation of assets and liabilities
Accounts receivable 57 108 343
Inventories 12 78 (331)
Suppliers and contractors 255 364 422
Payroll and related charges (16) 45 53
Tax assets and liabilities, net (43) (4) (143)
Goldstream transaction 524 - -
Others (402) 228 113
Net cash provided by operations 3,227 3,115 2,313
Interest on loans and financing (423) (362) (381)
Derivatives received (paid), net (191) (353) (167)
Remuneration paid to debentures - (37) -
Income taxes (88) (113) (47)
Income taxes - settlement program (116) (100) (89)
Net cash provided by operating activities 2,409 2,150 1,629
Cash flows from investing activities:
Additions to investments (9) (136) (8)
Additions to property, plant and equipment (1,249) (1,232) (1,870)
Proceeds from disposal of assets and investments 326 12 472
Dividends and interest on capital received from joint ventures and associates - 117 19
Proceeds from goldstream transaction 276 - -
Others (2) (126) 76
Net cash used in investing activities (658) (1,365) (1,311)
Cash flows from financing activities:
Loans and financing
Additions 1,573 1,433 1,066
Repayments (1,987) (1,808) (928)
Dividends and interest on capital attributed to noncontrolling interest (129) (71) -
Other transactions with noncontrolling interest - - 1,089
Net cash provided by (used in) financing activities (543) (446) 1,227
Increase (decrease) in cash and cash equivalents 1,208 339 1,545
Cash and cash equivalents in the beginning of the period 4,168 3,782 3,158
Effect of exchange rate changes on cash and cash equivalents (7) 47 (306)
Cash and cash equivalents, end of period 5,369 4,168 4,397
Non-cash transactions:
Additions to property, plant and equipment - interest capitalization 172 213 196

66
Annex 2 – Volumes sold, prices and margins
Volume sold - Minerals and metals
‘000 metric tons 3Q16 2Q16 3Q15
Iron ore fines 74,231 72,678 70,530
ROM 351 405 3,546
Pellets 12,001 11,388 11,961
Manganese ore 448 354 448
Ferroalloys 31 36 3
Thermal coal 1,271 1,767 243
Metallurgical coal 1,156 1,001 1,419
Nickel 77 77 72
Copper 107 107 94
Gold as by-product ('000 oz) 129 122 105
Silver as by-product ('000 oz) 609 619 528
PGMs ('000 oz) 130 151 83
Cobalt (metric ton) 1,069 1,000 468
Potash 165 103 155
Phosphates
MAP 333 210 348
TSP 284 201 317
SSP 587 512 740
DCP 137 128 118
Phosphate rock 852 734 769
Others phosphates 184 95 74
Nitrogen 200 145 185
Average prices US$/ton 3Q16 2Q16 3Q15
Iron ore fines CFR reference price (dmt) 59.30 56.30 56.00
Iron ore fines CFR/FOB realized price 50.95 48.30 46.48
ROM 11.40 12.35 6.77
Pellets CFR/FOB (wmt) 82.58 76.20 73.82
Manganese ore 113.84 103.13 51.34
Ferroalloys 806.45 690.36 1,000.00
Thermal coal 45.80 38.38 48.24
Metallurgical coal 91.04 77.48 81.22
Nickel 10,317.00 9,180.00 10,866.00
Copper 4,218.00 4,144.00 3,892.00
Platinum (US$/oz) 1,060.30 908.64 1,004.75
Gold (US$/oz) 1,383.00 1,265.93 1,094.81
Silver (US$/oz) 15.15 16.66 13.49
Cobalt (US$/lb) 11.83 10.41 14.54
Potash 205.37 208.45 265.55
Phosphates
MAP 396.68 384.83 494.03
TSP 298.54 306.67 371.09
SSP 190.99 186.97 188.02
DCP 475.83 475.73 474.09
Phosphate rock 63.15 70.94 78.44
Nitrogen 345.01 409.19 431.44
Operating margin by segment (EBIT adjusted margin) % 3Q16 2Q16 3Q15
Ferrous minerals 42.2 37.3 29.0
Coal (29.4) (86.2) (164.6)
Base metals 12.5 (4.4) (18.1)
Fertilizer nutrients (8.7) (12.7) 14.0
Total¹ 28.1 20.2 12.8
¹ Excluding non-recurring effects
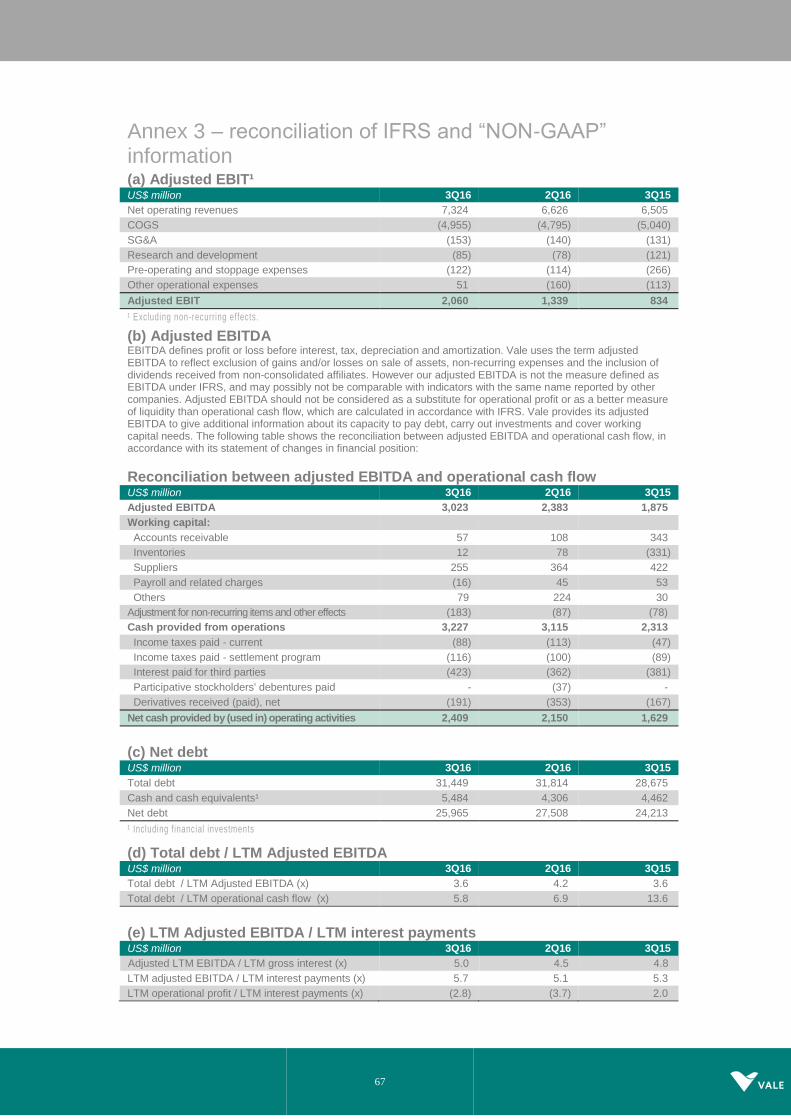
67
Annex 3 – reconciliation of IFRS and “NON-GAAP” information
(a) Adjusted EBIT¹ US$ million 3Q16 2Q16 3Q15
Net operating revenues 7,324 6,626 6,505
COGS (4,955) (4,795) (5,040)
SG&A (153) (140) (131)
Research and development (85) (78) (121)
Pre-operating and stoppage expenses (122) (114) (266)
Other operational expenses 51 (160) (113)
Adjusted EBIT 2,060 1,339 834
¹ Excluding non-recurring effects.
(b) Adjusted EBITDA
EBITDA defines profit or loss before interest, tax, depreciation and amortization. Vale uses the term adjusted EBITDA to reflect exclusion of gains and/or losses on sale of assets, non-recurring expenses and the inclusion of dividends received from non-consolidated affiliates. However our adjusted EBITDA is not the measure defined as EBITDA under IFRS, and may possibly not be comparable with indicators with the same name reported by other companies. Adjusted EBITDA should not be considered as a substitute for operational profit or as a better measure of liquidity than operational cash flow, which are calculated in accordance with IFRS. Vale provides its adjusted EBITDA to give additional information about its capacity to pay debt, carry out investments and cover working capital needs. The following table shows the reconciliation between adjusted EBITDA and operational cash flow, in accordance with its statement of changes in financial position:
Reconciliation between adjusted EBITDA and operational cash flow
US$ million 3Q16 2Q16 3Q15
Adjusted EBITDA 3,023 2,383 1,875
Working capital:
Accounts receivable 57 108 343
Inventories 12 78 (331)
Suppliers 255 364 422
Payroll and related charges (16) 45 53
Others 79 224 30
Adjustment for non-recurring items and other effects (183) (87) (78)
Cash provided from operations 3,227 3,115 2,313
Income taxes paid - current (88) (113) (47)
Income taxes paid - settlement program (116) (100) (89)
Interest paid for third parties (423) (362) (381)
Participative stockholders' debentures paid - (37) -
Derivatives received (paid), net (191) (353) (167)
Net cash provided by (used in) operating activities 2,409 2,150 1,629
(c) Net debt US$ million 3Q16 2Q16 3Q15
Total debt 31,449 31,814 28,675
Cash and cash equivalents¹ 5,484 4,306 4,462
Net debt 25,965 27,508 24,213
¹ Including financial investments
(d) Total debt / LTM Adjusted EBITDA
US$ million 3Q16 2Q16 3Q15
Total debt / LTM Adjusted EBITDA (x) 3.6 4.2 3.6
Total debt / LTM operational cash flow (x) 5.8 6.9 13.6
(e) LTM Adjusted EBITDA / LTM interest payments
US$ million 3Q16 2Q16 3Q15
Adjusted LTM EBITDA / LTM gross interest (x) 5.0 4.5 4.8
LTM adjusted EBITDA / LTM interest payments (x) 5.7 5.1 5.3
LTM operational profit / LTM interest payments (x) (2.8) (3.7) 2.0


