32
1 Validated Stage 1 Science Maturity Review for JPSS LST Presented by Yunyue Yu Contributors Yuling Liu, Peng Yu, Zhuo Wang, Leslie Belsma December 11 th , 2014

1
Validated Stage 1 Science Maturity Review for JPSS LST
Presented by Yunyue Yu Contributors
Yuling Liu, Peng Yu, Zhuo Wang, Leslie Belsma
December 11th, 2014

Outline
• Algorithm Cal/Val Team Members
• Product Requirements
• Evaluation of algorithm performance to specification requirements – Evaluation of the effect of required algorithm inputs
– Quality analysis/validation
– Error Budget
• Documentation • Identification of Processing Environment
• Users & User Feedback
• Conclusion
• Path Forward
2

Data Product Maturity Definition
Provisional Maturity: • Product quality may not be optimal • Incremental product improvements
still occurring • Version control is in effect • General research community is
encouraged to participate • Users urged to consult the EDR
product status • May be replaced in the archive • Ready for operational evaluation
3
Validated Maturity: • Product performance is defined and
documented over a wide range of representative conditions via numerous and ongoing ground-truth and validation efforts
• Clear documentation of product performance exists that includes all known product anomalies and their recommended remediation strategies, regardless of severity level
• Product analyses are sufficient for full qualitative and quantitative determination of product fitness-for-purpose
• Testing has been fully documented
• Ready for long term monitoring
• Product improvements continue through the lifetime of the instrument
Validated Stage 1: Using a limited set of samples, the algorithm output is shown to meet the threshold performance attributes identified in the JPSS Level 1 Requirements Supplement with the exception of the S-NPP Performance Exclusions

LST EDR Cal/Val Team
4
Name Institute Function
JPSS-STAR Ivan Csiszar NOAA/NESDIS/SATR Land Lead, Project Management
Yunyue YU NOAA/NESDIS/SATR TEDR Lead, algorithm development, validation, team management
Yuling Liu NOAA Affiliate, UMD/ESSIC product monitoring and validation ; algorithm development
Zhuo Wang NOAA Affiliate, UMD/ESSIC algorithm improvement
Peng Yu NOAA Affiliate, UMD/ESSIC product validation tool
Marina Tsidulko NOAA Affiliate, SciTech/IMSG STAR AIT
Michael EK NOAA/EMC/NCEP user readiness
Jesse Meng NOAA Affiliate user readiness
JPSS/DPA
Leslie Belsma Aerospace Corp algorithm Manager (JAM) for Land
NASA S-NPP Science Team
Miguel Roman NSAS/GSFC Validation data support, product monitoring
Sadashiva Devadiga NASA/GSFC Affiliate, SSC Validation data support, product monitoring

Requirements
Product Requirements from JPSS L1RD
5
Attribute Threshold Objective
Geographic coverage At least 90% coverage of the globe every 24 hours (monthly average)
Vertical Coverage
Vertical Cell Size
Horizontal Cell Size 4 km 1 km
Mapping Uncertainty 1 Km at Nadir (800 m) 1 km at Edge of Scan (500m)
Measurement Range 213 – 343 K 183 – 343 K
Measurement Accuracy 1.4 K 0.8 K
Measurement Precision 2.5 K 1.5 K

History of Algorithm Changes/Updates
Date DR# Reason Status
12/12/12 5028 LST QA not set correctly in all-ocean granules Closed 3/31/13. Rejected b/c No land products over ocean will ever be used; illustrates larger IDPS architecture issue that land products should not be produced over ocean
11/26/12 4983 VIIRS LST beta Maturity Closed 1/25/13 474-CCR-12-0773 deployed in ops
02/28/12 4608
Split-window algorithm - Baseline Coefficient files. LUT update #2 (same as"Updated LUT" in slides): DR 4608/CCR 12-0355: Corrects errors for both dual split window and split window.
Closed 06/10/12 Split Window algorithm implemented in IDPS baseline on 10 Aug, 2012.
02/15/12 4582 LST Day Night Land Water Misidentification, The LST EDR appears to have a coding error that may have incorrectly mixed up the Day/Night flag with the Land/Water and Surface Type QA Flag within the QF Byte 3 of the LST EDR... This same Day/Night flag is being correctly encoded in the bit3 of QF Byte1 of the LST EDR.
Closed 03/29/12 Rejected because EDR team did not observe such error.
09/14/11 4353 Snow/ice field is always "no snow" at night if the Quarterly Surface Type does not indicate so. “Temporal snow” can only be directed daytime by snow/ ice EDR
Closed 04/26/12. Reallocated to Cryo team as new DRs: 4699 Out of Date snow cover seeded grid & 4700 Alternative snow/ice grid needed to support algorithms; Both have been addressed.
02/14/11 4203 The OPS LST code, both v1.5.00.48 and v1.5.03.00, do not verify that the value for the Surface Type input falls within the valid range prior to calculating LST
Closed 1/9/13 Rejected because not a problem to LST production since LST code does check the ST.
6
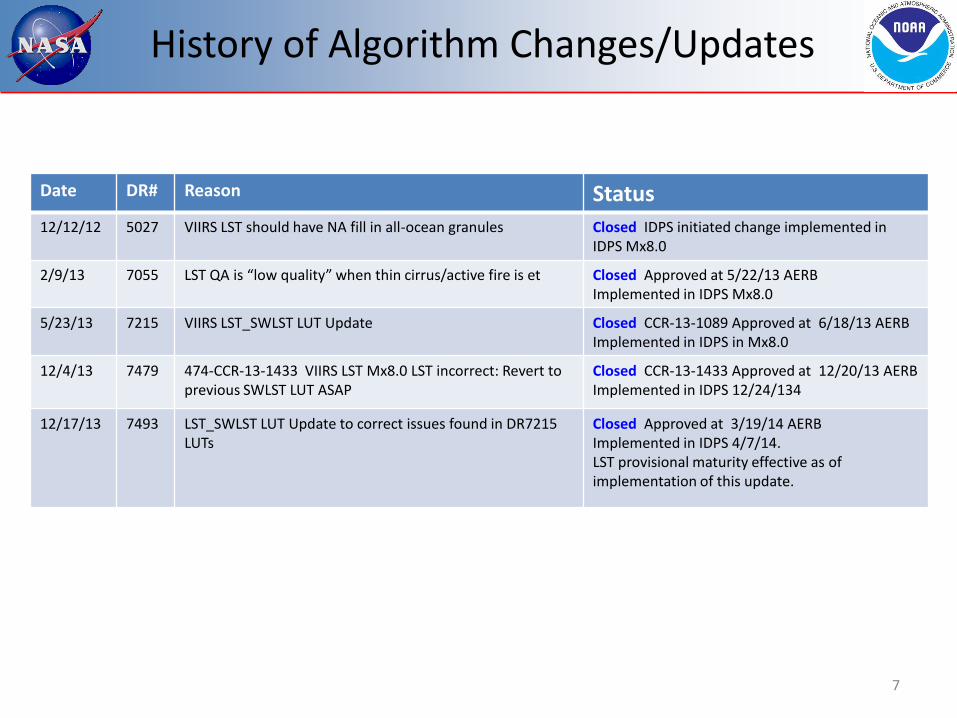
History of Algorithm Changes/Updates
Date DR# Reason Status
12/12/12 5027 VIIRS LST should have NA fill in all-ocean granules Closed IDPS initiated change implemented in IDPS Mx8.0
2/9/13 7055 LST QA is “low quality” when thin cirrus/active fire is et Closed Approved at 5/22/13 AERB Implemented in IDPS Mx8.0
5/23/13 7215 VIIRS LST_SWLST LUT Update Closed CCR-13-1089 Approved at 6/18/13 AERB Implemented in IDPS in Mx8.0
12/4/13 7479 474-CCR-13-1433 VIIRS LST Mx8.0 LST incorrect: Revert to previous SWLST LUT ASAP
Closed CCR-13-1433 Approved at 12/20/13 AERB Implemented in IDPS 12/24/134
12/17/13 7493 LST_SWLST LUT Update to correct issues found in DR7215 LUTs
Closed Approved at 3/19/14 AERB Implemented in IDPS 4/7/14. LST provisional maturity effective as of implementation of this update.
7

Evaluation of algorithm performance to specification requirements
• Findings/Issues from Provisional Review – Strong impact of surface type uncertainty on LST quality
– Cloud contamination impact is significant
– Lack of high quality validation data set
• Improvements since Provisional – Algorithm and LUT remain the same
– Significant efforts done on validation and uncertainty analysis
– Long term monitoring tool is in development • in use with daily/weekly/monthly/yearly maps and graphics,
providing near-real time quality assessment
– Emissivity explicit algorithm is in development
8

Evaluation of algorithm performance ---- monitoring tool
9

Evaluation of algorithm performance ---- Impact of ST input error (1/2)
10
Impact on LST (using simulation database)
Overall Statistics Impact on LST
All-Day 0.61
All-Night 0.83
All 0.73
*Reference: Damien Sulla-Menashe, VIIRS ST V1 Quality Assessment April 02, 2014 EDR meeting
is the probability of mis-classfication of surface type i (i=1,2…17) to be j (j=1,2…17) is the LST difference between LST calculated with the equation for surface type i and with the equation for surface type j for each pixel with i surface type represents the error for each IGBP type i under either day or night condition represents the error for all IGBP types and all day/night conditions represents the number of samples for surface type IGBP i represents the total number of samples for all cases
r
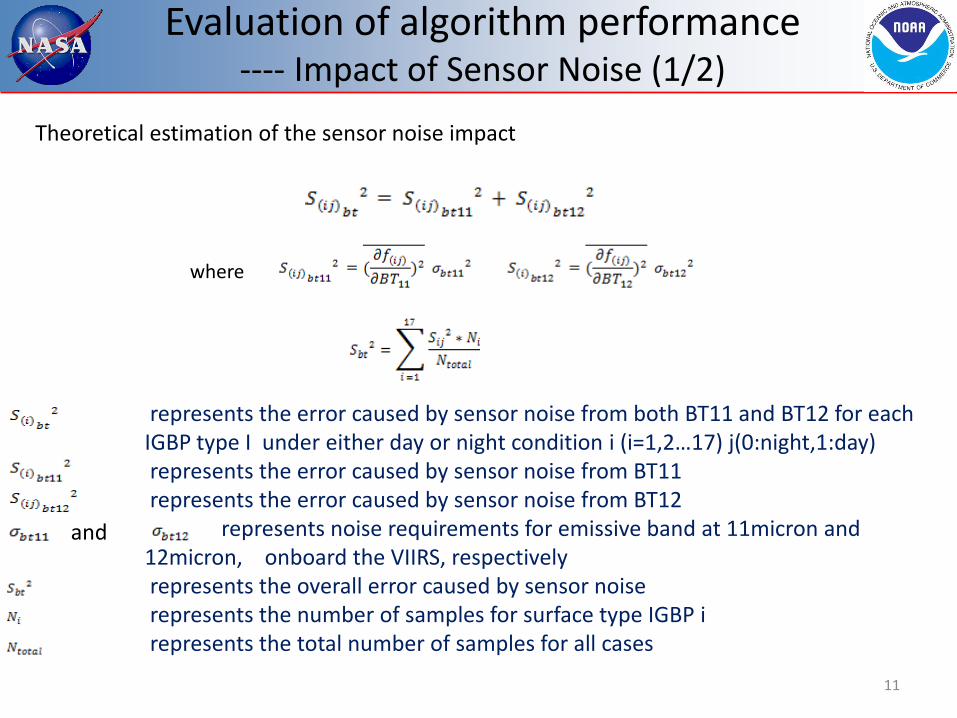
Evaluation of algorithm performance ---- Impact of Sensor Noise (1/2)
11
where
represents the error caused by sensor noise from both BT11 and BT12 for each IGBP type I under either day or night condition i (i=1,2…17) j(0:night,1:day) represents the error caused by sensor noise from BT11 represents the error caused by sensor noise from BT12 represents noise requirements for emissive band at 11micron and 12micron, onboard the VIIRS, respectively represents the overall error caused by sensor noise represents the number of samples for surface type IGBP i represents the total number of samples for all cases
and
Theoretical estimation of the sensor noise impact

Evaluation of algorithm performance ---- Impact of Sensor Noise (2/2)
12
0
0.05
0.1
0.15
0.2
0.25
LST
Erro
r
IGBP Surface Type
LST Errors Attrbuted to Sensor Noise-Daytime
LST Error LST Error By BT11 LST Error By BT12
0
0.05
0.1
0.15
0.2
0.25
LST
Erro
r
IGBP Surface Type
LST Errors Attrbuted to Sensor Noise-Nightime
LST Error LST Error By BT11 LST Error By BT12
Overall Statistics
Impact on LST*
All-Day 0.197K
All-Night 0.199K
All 0.198K
*Impact on LST is estimated using simulation database
Sensor noise level : s = 0.070 K

Evaluation of algorithm performance ---- Impact of input errors (overall)
represents the overall LST uncertainty
represents the uncertainty caused by surface type
represents the uncertainty caused by sensor noise
is the algorithm uncertainty, estimated in the coefficients regression procedure bases only on the simulation data.
13
Overall Statistics Uncertainty by
Surface Type
Accuracy
Uncertainty by
Sensor Noise
Algorithm
Uncertainty
Overall LST
product
Uncertainty**
All 0.73 0.198 0.46 0.88
All-Day 0.61 0.197 0.42 0.77
All-Night 0.83 0.199 0.51 0.99
**Impact on LST is estimated using simulation database
Theoretical estimation of the overall impact

Evaluation of algorithm performance ---- Impact of ST input error (2/2)
14
0
0.5
1
1.5
2
2.5
3
3.5
IGBP Surface Types
Surface Type Accuracy on LST(Day)
Surface Type Accuracy LST Uncertainty
0
0.2
0.4
0.6
0.8
1
1.2
1.4
1.6
IGBP Surface Type
Surface Type Accuracy on LST(Night)
Surface Type Accuracy LST Uncertainty
Overall Statistics Impact on LST
All-Day 1.5K
All-Night 0.8K
All 1.2K
Impact on LST using real orbit data on Oct. 22, 2014, daytime (top) and nighttime(bottom)

Quality Analysis/Validation
Quality analysis and validation studies on
• Ground measurements – SURFRAD
– CRN
– Africa data
– China
• Radiance based validation – Global (9 areas selected)
• Cross satellite comparison – MODIS Aqua LST
– MSG SEVIRI LST
15
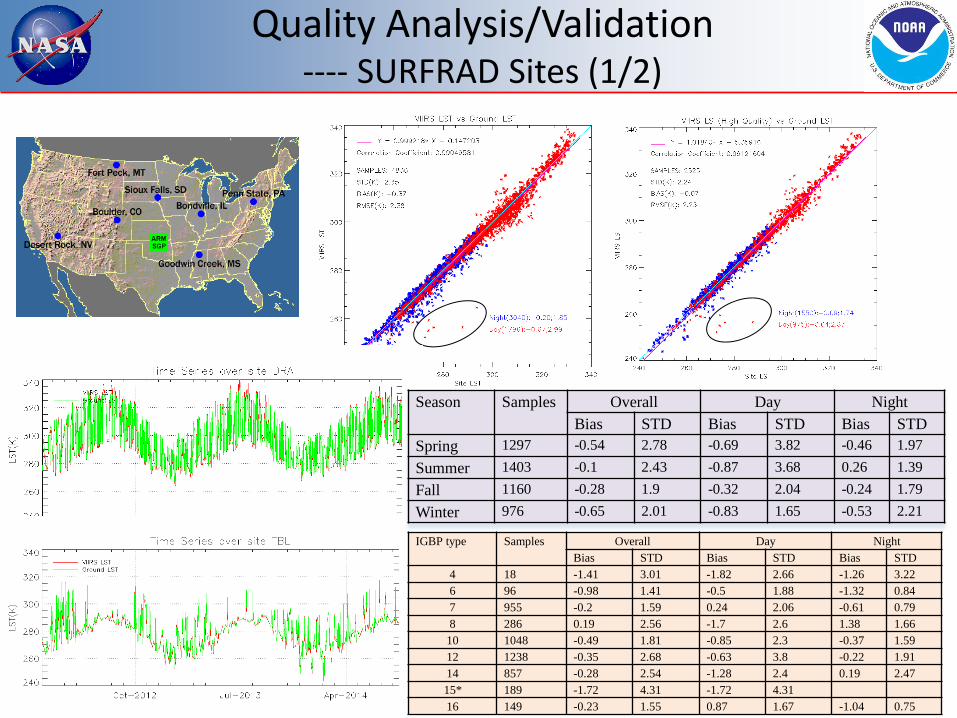
Quality Analysis/Validation ---- SURFRAD Sites (1/2)
16
Season Samples Overall Day Night
Bias STD Bias STD Bias STD
Spring 1297 -0.54 2.78 -0.69 3.82 -0.46 1.97
Summer 1403 -0.1 2.43 -0.87 3.68 0.26 1.39
Fall 1160 -0.28 1.9 -0.32 2.04 -0.24 1.79
Winter 976 -0.65 2.01 -0.83 1.65 -0.53 2.21
IGBP type Samples Overall Day Night
Bias STD Bias STD Bias STD
4 18 -1.41 3.01 -1.82 2.66 -1.26 3.22
6 96 -0.98 1.41 -0.5 1.88 -1.32 0.84
7 955 -0.2 1.59 0.24 2.06 -0.61 0.79
8 286 0.19 2.56 -1.7 2.6 1.38 1.66
10 1048 -0.49 1.81 -0.85 2.3 -0.37 1.59
12 1238 -0.35 2.68 -0.63 3.8 -0.22 1.91
14 857 -0.28 2.54 -1.28 2.4 0.19 2.47
15* 189 -1.72 4.31 -1.72 4.31
16 149 -0.23 1.55 0.87 1.67 -1.04 0.75

Quality Analysis/Validation ---- SURFRAD Sites (2/2)
17
VIIRS Data: Feb. 2012 – Aug. 2014 MODIS Data: Jan. 2012 – Jul. 2013

Quality Analysis/Validation ---- Africa Site*
18
VIIRS LST
MODIS v5 LST
Suggested for matchup
Sensor Location
*the Africa site data provided by Frank Goettsche (KIT & EUMETSAT Land SAF), through LST validation collaboration
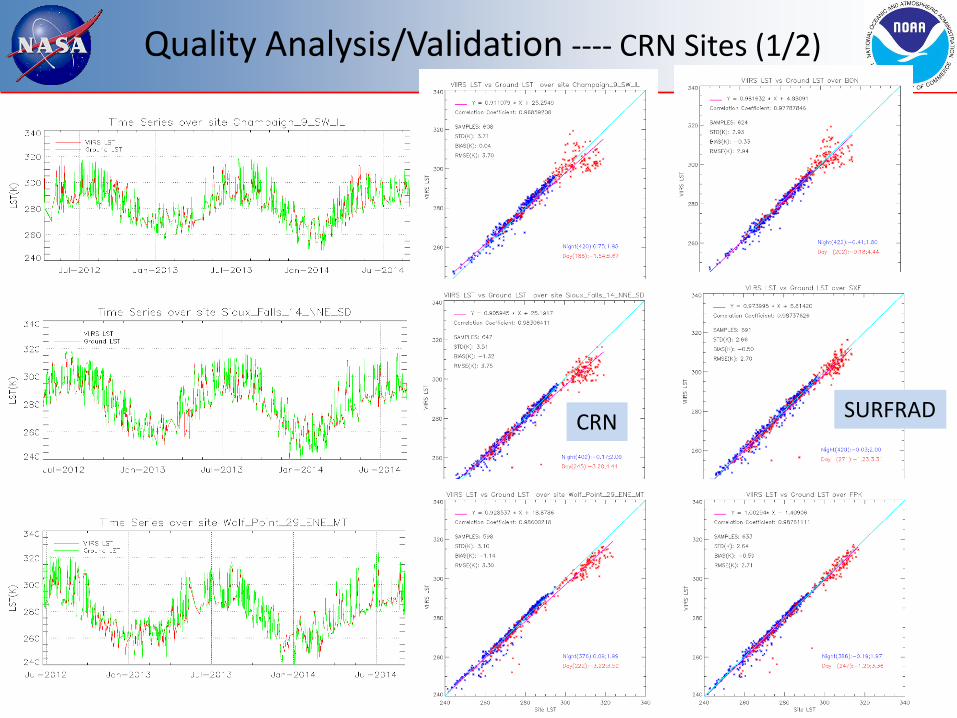
Quality Analysis/Validation ---- CRN Sites (1/2)
19
CRN SURFRAD

Quality Analysis/Validation ---- CRN Sites (2/2)
20
Corresponding matchups for VIIRS and MODIS: Time span: Jul. 2013 – Sep. 2014 Data: same site, same day, satellite zenith angle within 10 degree
VIIRS
MODIS

Quality Analysis/Validation ---- China Sites* (2/2)
21
VIIRS LST-Beta Maturity
MODIS Aqua LST
Reference: H. Li, D. Sun, Y. Yu, H. Wang, Y. Liu, Q. Liu, Y. Du, H. Wang and B. Cao(2014) , Evaluation of the VIIRS and MODIS LST products in an arid area of Northwest China Remote Sensing of Environment 02/2014; 142:111–121.
Data collection: arid area of northwest China (Heihe Watershed Allied Telemetry Experimental Research), from June 2012 to April 2013. Four barren surface sites were chosen for the evaluation.
The result generally shows a better agreement for VIIRS LST than that for MODIS LST.
*the China site data provided by Hua Li (China Academy of Science), through LST validation collaboration

Quality Analysis/Validation ---- Radiance based validation
22
9
1
2
3 5
4
8 7 6
SurfaceType Overall Day Night
Samples Bias STD Samples Bias STD Samples Bias STD Evergreen Needleleaf Forests 216593 0.19 0.54 70324 -0.22 0.54 146269 0.38 0.41 Evergreen Broadleaf Forests 207839 -0.4 0.97 107698 -0.68 1.02 100141 -0.09 0.82 Deciduous Needleleaf Forest 13554 0.25 0.74 5932 -0.44 0.46 7622 0.78 0.42 Broadleaf Forests 385231 0.22 0.55 204843 -0.05 0.56 180388 0.54 0.32 Mixed Forests 597413 -0.02 0.8 359702 -0.42 0.76 237711 0.59 0.34 Closed Shrublands 92393 0.94 1.13 30537 -0.21 0.97 61856 1.5 0.69 Open Shrublands 5906708 0.72 1.29 3305495 -0.22 0.85 2601213 1.92 0.53 Woody Savannahs 917791 0.31 0.7 407793 -0.12 0.65 509998 0.66 0.52 Savannahs 3142202 0.48 0.81 1008898 -0.22 0.81 2133304 0.81 0.56 Grasslands 1124800 -0.07 1.42 517457 -1.2 1.25 607343 0.9 0.6 Permanent Wetlands 28282 0.02 0.54 4013 0.09 0.91 24269 0.01 0.45 Croplands 4072551 0.15 1.2 1491236 -1.02 1.21 2581315 0.82 0.44 Urban Built-Up 190876 0.27 0.52 89295 0.04 0.5 101581 0.47 0.45 Croplands/Natural Vegetation
Mosiacs 1276644 0.31 0.56 543193 -0.08 0.45 733451 0.59 0.45 Snow Ice 1142843 0.04 0.51 336615 0.54 0.55 806228 -0.17 0.31 Barren 2389775 1.29 0.89 699333 0.54 0.75 1690442 1.6 0.75 Water Bodies 161468 -0.22 0.86 45826 -0.35 1.35 115642 -0.16 0.55
Areas Overall Day Night
Samples Bias STD Samples Bias STD Samples Bias STD
Algeria 850088 1.41 0.79 110433 0.22 0.56 739655 1.59 0.66
Australia 5164739 0.54 1.27 3021553 -0.18 1.05 2143186 1.56 0.72
Brazil 3436612 0.48 0.89 1002784 -0.32 0.94 2433828 0.81 0.61
China 1603865 0.83 0.91 528628 0.15 0.8 1075240 1.17 0.17
France 3014553 0.07 0.93 1530488 -0.53 0.91 1484065 0.70 0.39
Greenland 1059702 0.08 0.55 294543 0.62 0.50 765159 -0.13 0.41
Gobabeb 959981 0.52 1.53 595335 -0.5 0.75 364646 2.18 0.90
Indian 2482012 0.39 1.23 656915 -0.98 1.53 1825097 0.88 0.54
USA 3408392 0.43 1.17 1565562 -0.41 0.85 1842830 1.14 0.92
Temp.
Range Samples Bias STD RMSE
220-230 12978 -0.05 0.18 0.19
230-240 355782 -0.08 0.28 0.29
240-250 622961 0.1 0.57 0.58
250-260 371442 0.54 0.56 0.78
260-270 303642 0.75 0.72 1.04
270-280 1648372 0.89 0.78 1.18
280-290 3732633 1.05 0.82 1.33
290-300 7990823 0.89 0.92 1.28
300-310 2173475 -0.52 1 1.13
310-320 2481185 -0.51 1 1.12
320-330 1578097 -0.22 1.26 1.28
330-340 465266 -0.01 1.28 1.28
Validation Results over areas
Results over surface type
Over temperature range

Quality analysis/validation ---- Cross satellite comparison (MODIS)
Comparison results from Simultaneous Nadir Overpass (SNO) between VIIRS and AQUA in 2012 over US , Oct-Dec, 2013 over US, polar and low latitude (over 100 scenes). The matchups are quality controlled for both LST measurements. 23
Cross Satellite Comparison: VIIRS vs MODIS Aqua LST (granules)

VIIRS SEVIRI
Quality Analysis/Validation ---- Cross satellite comparison (SEVIRI)
1-9 Jan 2014
Courtesy of Isabel F. Trigo , through US-Portugal Bilateral cooperation program (on remote Sensing)
Daytime Bias = -2.02 ºC RMSE = 2.81 ºC
Daytime Bias = -2.95 ºC RMSE = 4.76 ºC
Night-time Bias = -0.15 ºC RMSE = 2.16 ºC
Night-time Bias = +0.26 ºC RMSE = 1.55 ºC
Jan. 1-9
Aug. 1-9

Error Budget
25
Attribute
Analyzed
L1RD
Threshold
Validation
Result
Description
In-situ
Validation
1.4K(2.5K) -0.37(2.35) Results are based on the VIIRS data over SURFRAD sites for over 2.5 years . The error
budget estimation is limited by ground data quality control, cloud filtering procedure and
upstream data error.
R-based
Validation
1.4K(2.5K)
0.47(1.12)
A forward radiative transfer model is used, over 9 regions in globe, representing all 17-IGBP
types over the seasons. The error budget estimation is limited by profile quality, cloud
screening procedure and sampling procedure.
Cross
satellite
Comparison
0.59(1.93):
daytime
0.99(2.02):
nighttime
The results are based on comparisons to MODIS LST, over 100 scenes, over low latitude,
polar area and CONUSThe error budget estimation is limited by the spatial and temporal
difference, sensor difference, angle difference etc.
Attribute
Analyzed
L1RD
Threshold
Theoretical
Results
Real data
results
Description
Overall 1.4K(2.5K) 0.00(0.46) -0.37(2.35) Results are based on the VIIRS data over SURFRAD sites for over 2.5 years
. The error budget estimation is limited by ground data quality control, cloud
filtering procedure and upstream data error.
Surface
Type
(0.73) (1.21) This error is from surface type EDR quality.
Sensor
noise
(0.2) (0.23) This error is from sensor noise from M-band 15 and M16
Others (1.98) Uncertainty from ground data quality control, viewing angle, cloud
contamination, Aerosol effect etc.
Count from error sources:
Count from validation methods:
Documentation
– A README file for CLASS will be submitted with the Validation Stage 1 Maturity CCR
– A Product User’s Guide is not required
26

Identification of Processing Environment
• IDPS number and effective date – IDPS build MX8.4 implemented on 04/07/2014
• Algorithm version – Baseline split window algorithm – ATBD to be updated
• Version of LUTs used – CCR-14-1638 VIIRS LST_SWLST LUT Update, – DR 7493 (Land)- VIIRS LST_SWLST LUT Update to correct issues found in
DR7215 LUTs
• Version of PCTs used • Description of environment used to achieve validated
stage All data used in the validation is calculated locally using the same LUT as in the
operational run. We compared the difference between our local calculation and IDPS calculation; difference by the floating error is neglected in our validation efforts.
27
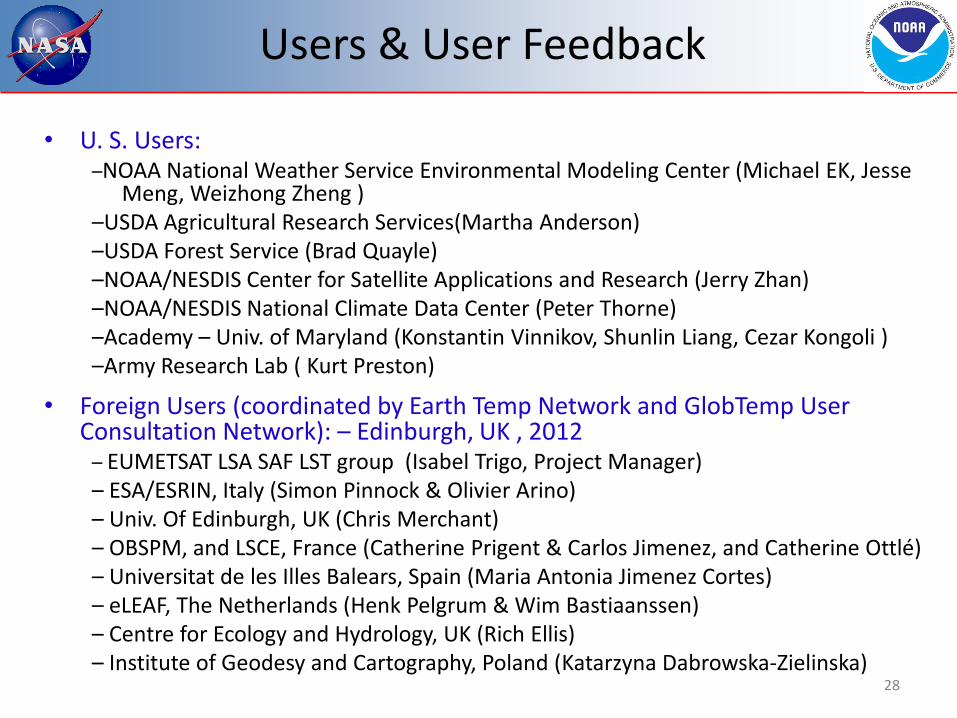
Users & User Feedback
28
• U. S. Users: –NOAA National Weather Service Environmental Modeling Center (Michael EK, Jesse
Meng, Weizhong Zheng ) –USDA Agricultural Research Services(Martha Anderson) –USDA Forest Service (Brad Quayle) –NOAA/NESDIS Center for Satellite Applications and Research (Jerry Zhan) –NOAA/NESDIS National Climate Data Center (Peter Thorne) –Academy – Univ. of Maryland (Konstantin Vinnikov, Shunlin Liang, Cezar Kongoli ) –Army Research Lab ( Kurt Preston)
• Foreign Users (coordinated by Earth Temp Network and GlobTemp User Consultation Network): – Edinburgh, UK , 2012
– EUMETSAT LSA SAF LST group (Isabel Trigo, Project Manager) – ESA/ESRIN, Italy (Simon Pinnock & Olivier Arino) – Univ. Of Edinburgh, UK (Chris Merchant) – OBSPM, and LSCE, France (Catherine Prigent & Carlos Jimenez, and Catherine Ottlé) – Universitat de les Illes Balears, Spain (Maria Antonia Jimenez Cortes) – eLEAF, The Netherlands (Henk Pelgrum & Wim Bastiaanssen) – Centre for Ecology and Hydrology, UK (Rich Ellis) – Institute of Geodesy and Cartography, Poland (Katarzyna Dabrowska-Zielinska)

Model comparison
29
Comparisons to NAM (North American Model) over CONUS (5km) :
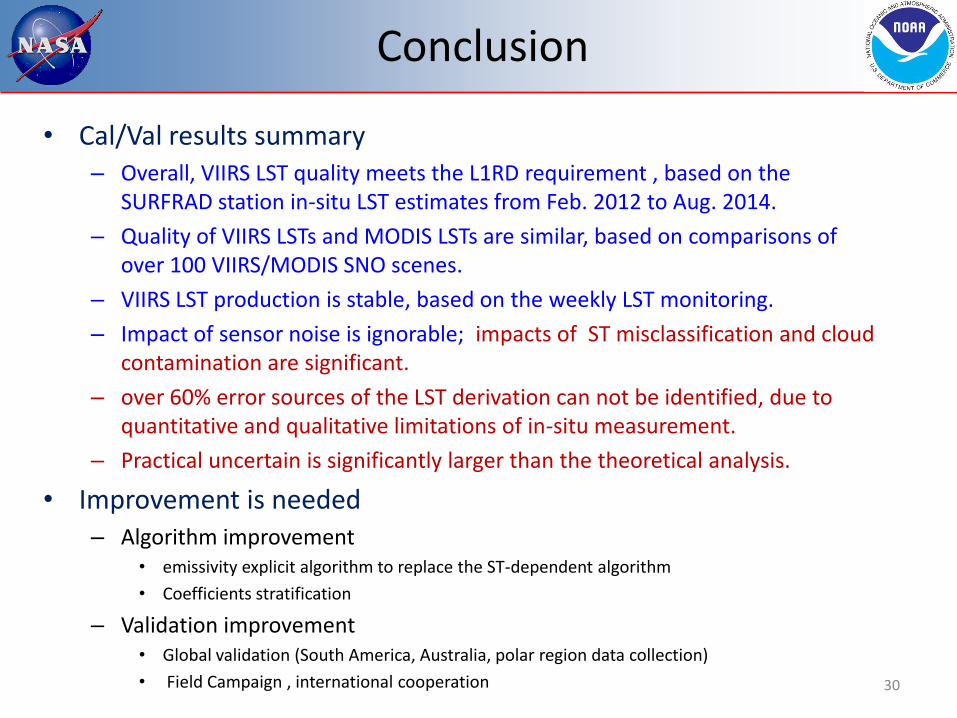
Conclusion
• Cal/Val results summary – Overall, VIIRS LST quality meets the L1RD requirement , based on the
SURFRAD station in-situ LST estimates from Feb. 2012 to Aug. 2014.
– Quality of VIIRS LSTs and MODIS LSTs are similar, based on comparisons of over 100 VIIRS/MODIS SNO scenes.
– VIIRS LST production is stable, based on the weekly LST monitoring.
– Impact of sensor noise is ignorable; impacts of ST misclassification and cloud contamination are significant.
– over 60% error sources of the LST derivation can not be identified, due to quantitative and qualitative limitations of in-situ measurement.
– Practical uncertain is significantly larger than the theoretical analysis.
• Improvement is needed – Algorithm improvement
• emissivity explicit algorithm to replace the ST-dependent algorithm
• Coefficients stratification
– Validation improvement • Global validation (South America, Australia, polar region data collection)
• Field Campaign , international cooperation
30
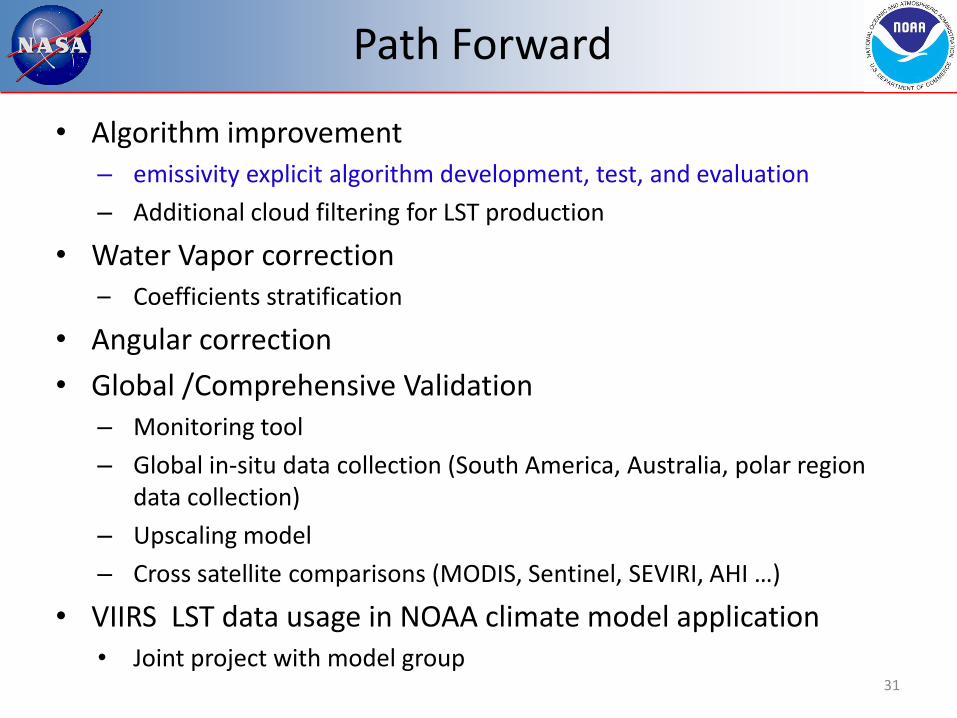
Path Forward
• Algorithm improvement – emissivity explicit algorithm development, test, and evaluation
– Additional cloud filtering for LST production
• Water Vapor correction – Coefficients stratification
• Angular correction
• Global /Comprehensive Validation – Monitoring tool
– Global in-situ data collection (South America, Australia, polar region data collection)
– Upscaling model
– Cross satellite comparisons (MODIS, Sentinel, SEVIRI, AHI …)
• VIIRS LST data usage in NOAA climate model application • Joint project with model group
31

Impact of Surface Type Error
32
0
0.5
1
1.5
2
2.5
3
3.5
IGBP Surface Types
Surface Type Accuracy on LST(Day)
Surface Type … LST Uncertainty
0
0.2
0.4
0.6
0.8
1
1.2
1.4
1.6
IGBP Surface Type
Surface Type Accuracy on LST(Night)
Surface Type … LST Uncertainty
Overall Statistics Impact on LST
All-Day 1.5K
All-Night 0.8K
All 1.2K
Impact on LST using real orbit data on Oct. 22, 2014, daytime (top-left) and nighttime(top-right)
*Reference: Damien Sulla-Menashe, VIIRS ST V1 Quality Assessment April 02, 2014 EDR meeting


