During their fourth year of undergraduate studies, chemical engineering students at the Instituto Su-perior de Engenharia de Coimbra (ISEC), Portugal,
take a full laboratory course in unit operations and process control. The topics covered include evaporation, distillation, absorption in packed columns, solid-liquid extraction, dry-ing, and the control of variables often found in industrial units (e.g., pressure, flow, level, and temperature) employing laboratory units or bench-scale kits. The course’s basic aim is the practical demonstration of theoretical concepts taught in courses on process separation, chemical thermodynamics, and process dynamics at laboratory scale. It also provides students with experience in operating and controlling complex units. Regarding the work on distillation, the students are asked to validate the steady-state behavior of a laboratory unit used for separating an azeotropic mixture of aniline and water. The interest in this binary system arose from an intensive research program carried out in the chemical engineering department of ISEC in collaboration with a Portuguese company that produces aniline—with the aim of optimizing the aniline production section. In addition, this work also aims to vali-date knowledge relating to the distillation of heterogeneous azeotropic mixtures, of which the aniline-water system is a simple and easily handled example.
The conceptual basis used to describe the phenomena involved in a distillation column is the equilibrium stage model, which assumes thermodynamic equilibrium between
the species and perfect mixing in each phase and tray.[1, 2] But it is quite common for equilibrium not to be achieved in vapor-liquid-liquid dispersions arising from heterogeneous azeotropic mixtures. This is because of the occurrence of kinetically controlled phenomena, such as mass transfer, coalescence, and nucleation in liquid phases. Regardless of
Validating The eqUiLiBriUm sTAge modeL
for an Azeotropic System in a Laboratorial Distillation Column
B.P.M. duarte, M.n. coelho Pinheiro, d.c.M. da silva, and M.J. Moura
Instituto Superior de Engenharia de Coimbra • 3030-290 Coimbra, Portugal
Che laboratory
Belmiro Duarte is auxiliary professor in the chemical engineering department of Instituto Superior de Engenharia de Coimbra, Portugal. He graduated in chemical engineering from the University of Coimbra, Portugal, in 1991. He received his Ph.D. in chemical engineering from the same university in 1995, and the M.Sc. degree in business management from Coimbra in 1998. His research interests include simulation, process optimization, and modeling.
Maria Nazare´ Coelho Pinheiro is coordinator professor in the chemical engineering department of Instituto Superior de Engenharia de Coimbra, Portugal. She graduated in chemical engineering from the University of Porto (FEUP), Portugal, in 1986. She received her Ph.D. in chemical engineering from the same university in 1994. Her research interests include mass transfer and hydrodynamic characterization in bubbling columns.
Dulce Cristina Martins da Silva is researcher at CIEPQPF. She gradu-ated in chemical engineering in 1996, and received her Ph.D. in chemi-cal engineering in 2006, both from the University of Coimbra (FCTUC), Portugal. Her research interests include simulation, process optimization, and control.
Maria Jose´ Moura is assistant lecturer in the chemical engineering department of Instituto Superior de Engenharia de Coimbra, Portugal. She graduated in chemical engineering from the University of Coim-bra (FCTUC), Portugal, in 1993 and received her M.Sc. in chemical processes from the same university in 1999. Her research interest is in biomaterials.
the mismatch of theoretical assumptions and real behavior, the equilibrium stage model is still used to represent the operation of distillation columns phenomenologically, and several research groups have presented data for three-phase distillation experiments to validate it.[3-6] Thus, this work aims simultaneously to enable students to gain experience in operat-ing and analyzing a distillation procedure, to use vapor-liquid equilibrium (VLE) prediction methods, and to contribute to the research community’s efforts to validate the equilibrium stage model for the aniline-water system.
Three four-hour sessions are required to complete the work. The first is devoted to a review of the basic theory behind mixture thermodynamics and methods for predicting activ-ity coefficients for VLE, analysis of the column layout, and understanding its operation and control. Between the first and second sessions, the students develop an Excel workbook to obtain the VLE prediction for the aniline-water system at atmospheric pressure. Each group of three or four students is asked to use a different prediction method for the activ-ity coefficients among UNIFAC, UNIQUAC, two-constant Margules, and van Laar,[7] then to compare the results with experimental data published in the literature for the aniline-water system at atmospheric pres-sure.[8, Appendix G] During the second session, the students carry out the experimental work with the distillation column, running it until steady-state conditions are reached. Next, they use Aspen Plus v. 11.1 to compute the unit steady state with an equilibrium stage-model-based module. Fi-nally, in the third session, the results are presented, compared with those given by simulation, and discussed.
experimenTAL eqUip-menT And sAmpLing
Aniline, even in low concentra-tions, is a fairly toxic aromatic hydrocarbon. Its handling there-fore requires students take some safety precautions, that is, to wear protective clothing, gloves, and eye/face protection to avoid skin contact. Furthermore, the work is carried out in a well-ventilated area to reduce the toxicity risk.
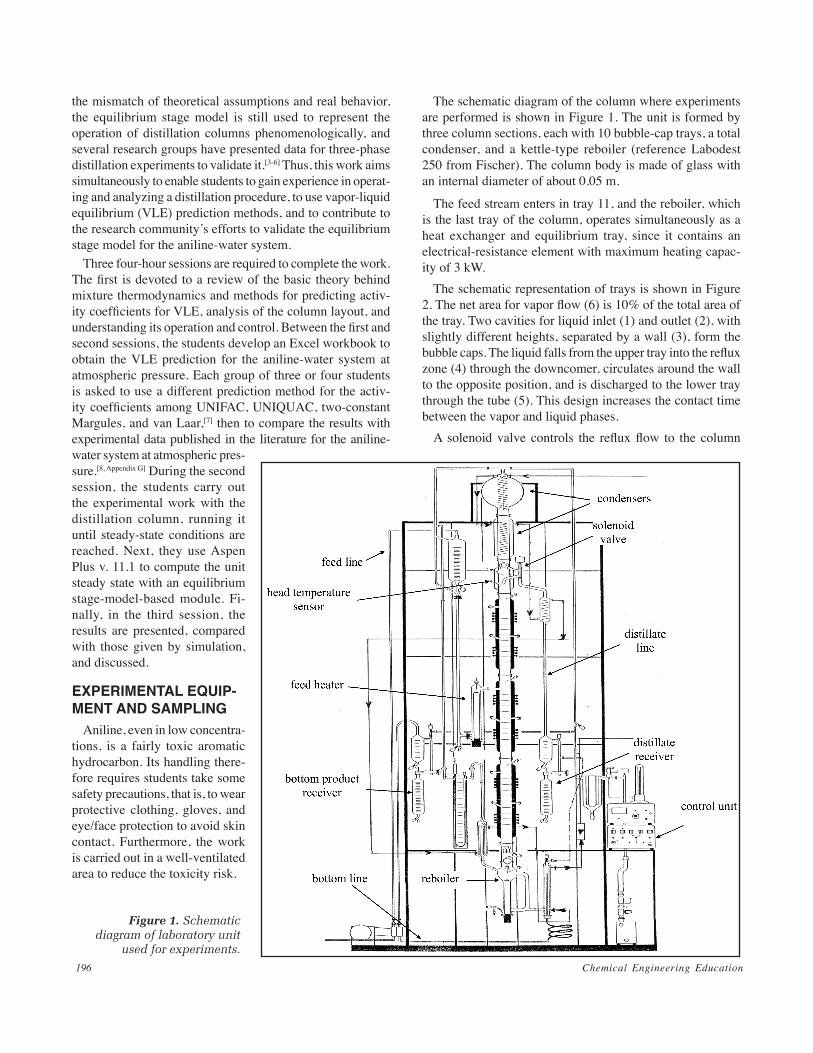
The schematic diagram of the column where experiments are performed is shown in Figure 1. The unit is formed by three column sections, each with 10 bubble-cap trays, a total condenser, and a kettle-type reboiler (reference Labodest 250 from Fischer). The column body is made of glass with an internal diameter of about 0.05 m.
The feed stream enters in tray 11, and the reboiler, which is the last tray of the column, operates simultaneously as a heat exchanger and equilibrium tray, since it contains an electrical-resistance element with maximum heating capac-ity of 3 kW.
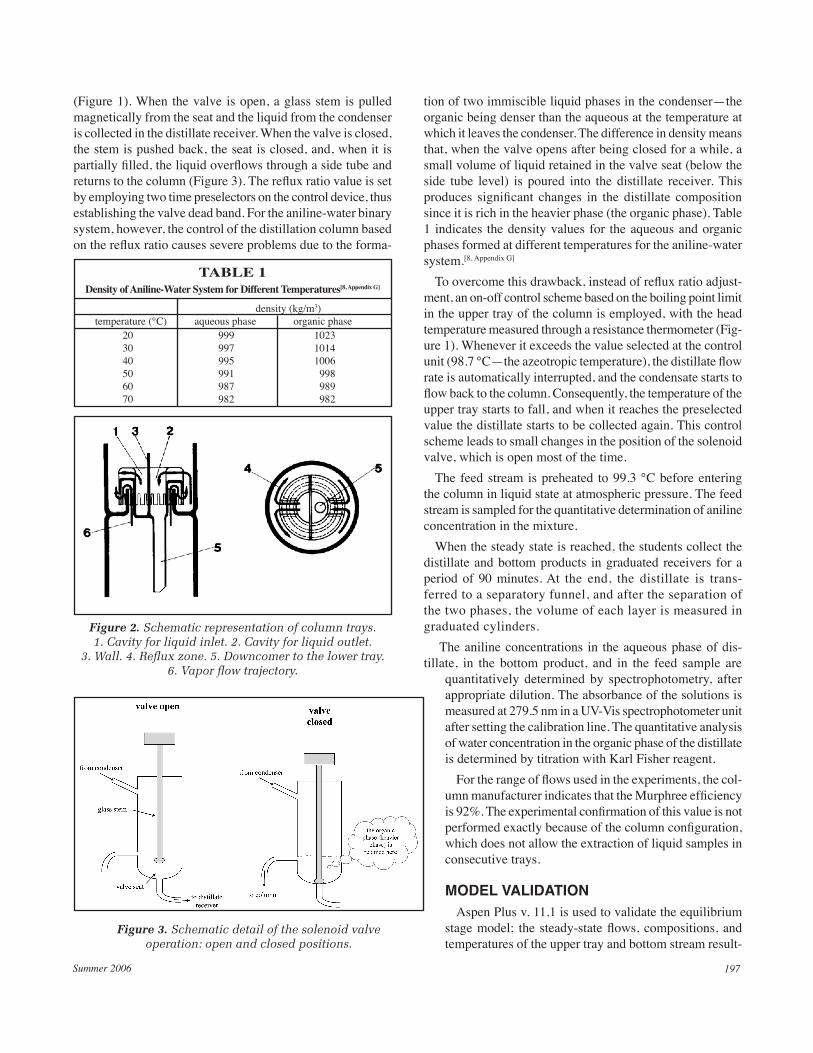
The schematic representation of trays is shown in Figure 2. The net area for vapor flow (6) is 10% of the total area of the tray. Two cavities for liquid inlet (1) and outlet (2), with slightly different heights, separated by a wall (3), form the bubble caps. The liquid falls from the upper tray into the reflux zone (4) through the downcomer, circulates around the wall to the opposite position, and is discharged to the lower tray through the tube (5). This design increases the contact time between the vapor and liquid phases.
A solenoid valve controls the reflux flow to the column
Figure 1. Schematic diagram of laboratory unit
used for experiments.
Summer 2006 197
Figure 2. Schematic representation of column trays. 1. Cavity for liquid inlet. 2. Cavity for liquid outlet.
3. Wall. 4. Reflux zone. 5. Downcomer to the lower tray.6. Vapor flow trajectory.
Figure 3. Schematic detail of the solenoid valveoperation: open and closed positions.
TABLE 1Density of Aniline-Water System for Different Temperatures[8, Appendix G]
(Figure 1). When the valve is open, a glass stem is pulled magnetically from the seat and the liquid from the condenser is collected in the distillate receiver. When the valve is closed, the stem is pushed back, the seat is closed, and, when it is partially filled, the liquid overflows through a side tube and returns to the column (Figure 3). The reflux ratio value is set by employing two time preselectors on the control device, thus establishing the valve dead band. For the aniline-water binary system, however, the control of the distillation column based on the reflux ratio causes severe problems due to the forma-
tion of two immiscible liquid phases in the condenser—the organic being denser than the aqueous at the temperature at which it leaves the condenser. The difference in density means that, when the valve opens after being closed for a while, a small volume of liquid retained in the valve seat (below the side tube level) is poured into the distillate receiver. This produces significant changes in the distillate composition since it is rich in the heavier phase (the organic phase). Table 1 indicates the density values for the aqueous and organic phases formed at different temperatures for the aniline-water system.[8, Appendix G]
To overcome this drawback, instead of reflux ratio adjust-ment, an on-off control scheme based on the boiling point limit in the upper tray of the column is employed, with the head temperature measured through a resistance thermometer (Fig-ure 1). Whenever it exceeds the value selected at the control unit (98.7 °C—the azeotropic temperature), the distillate flow rate is automatically interrupted, and the condensate starts to flow back to the column. Consequently, the temperature of the upper tray starts to fall, and when it reaches the preselected value the distillate starts to be collected again. This control scheme leads to small changes in the position of the solenoid valve, which is open most of the time.
The feed stream is preheated to 99.3 °C before entering the column in liquid state at atmospheric pressure. The feed stream is sampled for the quantitative determination of aniline concentration in the mixture.
When the steady state is reached, the students collect the distillate and bottom products in graduated receivers for a period of 90 minutes. At the end, the distillate is trans-ferred to a separatory funnel, and after the separation of the two phases, the volume of each layer is measured in graduated cylinders.
The aniline concentrations in the aqueous phase of dis-tillate, in the bottom product, and in the feed sample are
quantitatively determined by spectrophotometry, after appropriate dilution. The absorbance of the solutions is measured at 279.5 nm in a UV-Vis spectrophotometer unit after setting the calibration line. The quantitative analysis of water concentration in the organic phase of the distillate is determined by titration with Karl Fisher reagent.
For the range of flows used in the experiments, the col-umn manufacturer indicates that the Murphree efficiency is 92%. The experimental confirmation of this value is not performed exactly because of the column configuration, which does not allow the extraction of liquid samples in consecutive trays.
modeL vALidATion Aspen Plus v. 11.1 is used to validate the equilibrium
stage model; the steady-state flows, compositions, and temperatures of the upper tray and bottom stream result-
Chemical Engineering Education198
ing from the model solution are compared with laboratory data. The Radfrac module is chosen to describe the column unit since it is based on the rigorous solution of the equilib-rium stage model for multistage vapor-liquid fractionation, steady-state operations.[9, 10] The model consists of a set of nonlinear algebraic equations, comprising the material bal-ance (M) and thermodynamic equilibrium relation (E) for each component and tray, and the summation of mole fractions (S) and enthalpy balance (H) for each tray, generally called MESH equations.[11]
This system can be augmented with the trays’ hydraulic relations and pressure-drop profiles across the column when the unit geometry is known. The broader generality of the Newton-Raphson algorithm led this to be chosen to solve Radfrac module in rating mode. The Newton-Raphson al-gorithm implemented is based on the classic Naphtali and Sandholm algorithm.[12] First, the number of equations and variables resulting from unit modeling is reduced through the condensation of mole fractions, liquid, and vapor flows into new variables representing component molar flows. Next, the complete set of variables is ordered, and the resulting algebraic equation system solved iteratively by employing a Newton-type algorithm. The convergence is checked after each iteration by comparing the sum of squares of all vari-ables, conveniently weighted by scale factors, with a tolerance defined as a function of the number of degrees of freedom the system involves and inlet flows. An azeotropic convergence al-gorithm is chosen to handle the current binary system that forms a minimum-boiling azeotrope in the region of low aniline concentrations. The operating conditions, including the molar flow of distillate stream, the heat consumed in reboiler, the stages at which streams enter/leave the unit, the pressure-drop profile across the column, additional information regarding the con-denser operation, and the char-acterization of the second liquid phase—formed essentially by an-iline—are introduced into Aspen Plus. Molar flows are set equal to the experimental steady-state values, and the pressure drop is
disregarded due to the small flows involved in the operation. The characteristics of the feed stream, including its tempera-ture, pressure, and molar composition, are also entered into Aspen Plus. It is considered that there is no sub-cooling in the condenser and the Murphree stage efficiency is set to 92%. The Appendix at the end of this paper presents the Aspen Plus Input Summary file for a successfully converged model.
resULTs The first step in analyzing the results is to compare the
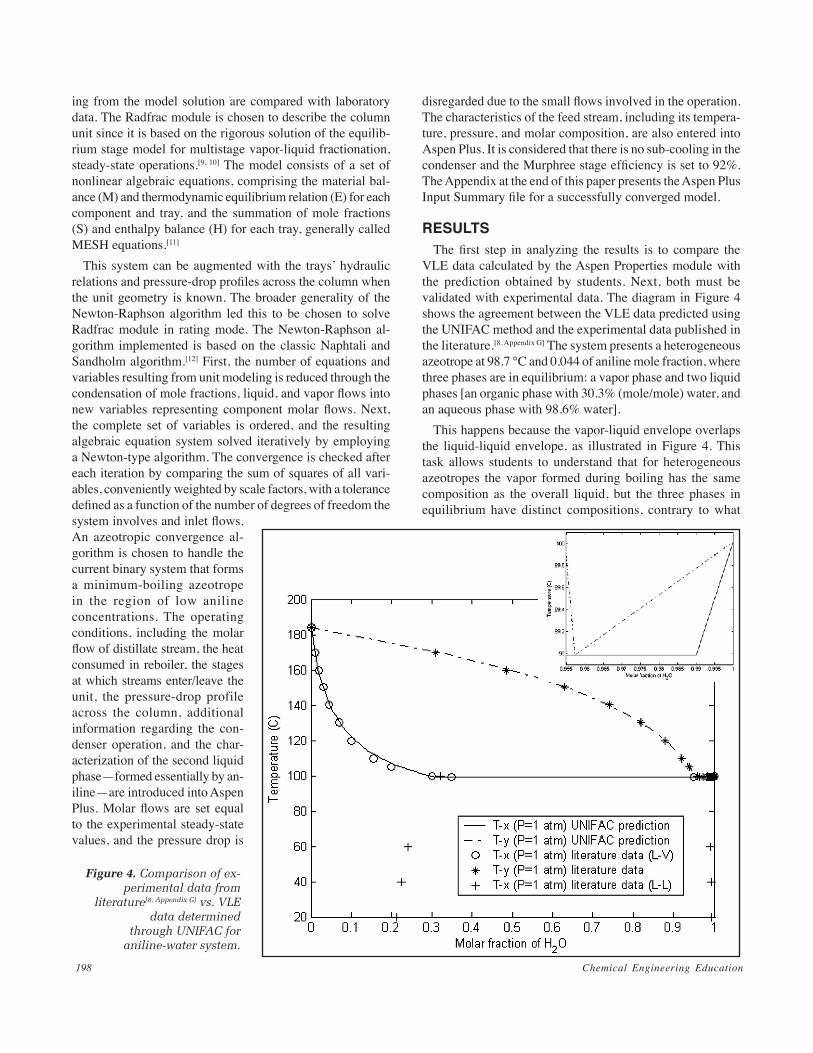
VLE data calculated by the Aspen Properties module with the prediction obtained by students. Next, both must be validated with experimental data. The diagram in Figure 4 shows the agreement between the VLE data predicted using the UNIFAC method and the experimental data published in the literature.[8, Appendix G] The system presents a heterogeneous azeotrope at 98.7 °C and 0.044 of aniline mole fraction, where three phases are in equilibrium: a vapor phase and two liquid phases [an organic phase with 30.3% (mole/mole) water, and an aqueous phase with 98.6% water].
This happens because the vapor-liquid envelope overlaps the liquid-liquid envelope, as illustrated in Figure 4. This task allows students to understand that for heterogeneous azeotropes the vapor formed during boiling has the same composition as the overall liquid, but the three phases in equilibrium have distinct compositions, contrary to what
Figure 4. Comparison of ex-perimental data from
literature[8, Appendix G] vs. VLE data determined
through UNIFAC for aniline-water system.
Summer 2006 199
happens for homogeneous azeotropes, where the liquid and vapor formed have the same composition.
The VLE prediction methods using UNIQUAC, two-con-stant Margules, and van Laar activity-coefficient models require binary parameters for the aniline-water system, which students estimate by employing the following procedure and theoretical basis.
For a binary system containing two liquid phases and one vapor phase in equilibrium, the fugacities of each compound in each of the phases are equal. That is:
γ asorg
a asorgP x*
fugacity ofaniline (a) in thee
organic phase
fugacit *= γ as
aqa as
aqP xyy of
aniline (a) in theaqueous phase
= P yafugacity of
aniline (a) in thevapor phaase
( )1
and
γ wsorg
w wsorgP x*
fugacity ofwater (w) in theorrganic phase
fugacity *= γ ws
aqw ws
aqP xoof
water (w) in theaqueous phase
= P ywwfugacity of
water (w) in thevapor phase
(2))
when the vapor phase behaves like an ideal gas mixture. The expressions γ i
org and γ iaq represent the activity coefficients of
component i in the organic and aqueous phases, respectively; xi
org and xiaq are the molar fractions of component i in the
organic phase and aqueous phases, respectively; Pi* is the
vapor pressure of the pure component i at temperature T; P is the pressure; and yi is the mole fraction of component i in the vapor phase. The subscript s stands for saturated liquid phases.
According to the phase rule, a binary system with three phases in equilibrium has just one degree of freedom, which means that by fixing the pressure (atmospheric pressure) the system becomes determined. Setting the activity coefficient model, the functional forms of γ a and γ w can be explicitly written, and the preceding equations lead to
γ γasorg
a w w a asorg
asorg
asaq
a wA A x x A, , ,, , ( ) = ,, ,
( ),A x xw a as
aqasaq( )
3
and
γ γwsorg
a w w a wsorg
wsorg
wsaq
a wA A x x A, , ,, , ,( ) = AA x xw a wsaq
wsaq
, ,
( )( )
4
where Aa,w and Aw,a are the binary interaction parameters of the model chosen for the aniline-water system. When the liquid-liquid equilibrium data is available, the fractions xas
org , xasaq ,
xwsorg , and xws
aq can be used to evaluate the two parameters Aa,w and Aw,a. Solubility data of aniline in water and of water in aniline for a temperature range of 20 °C to 100 °C can be found in the reference,[8, Appendix G] thus allowing students to estimate mutual solubility values at the azeotrope temperature (98.7 °C). The parameters obtained are used to calculate activity coefficients for subsequent vapor-liquid equilibrium calculations in the regions of 0<xw< xws
org , and xwsaq <xw<1.
Table 2 lists the parameters obtained by the students for the UNIQUAC, two-constant Margules, and van Laar activity coefficient models.
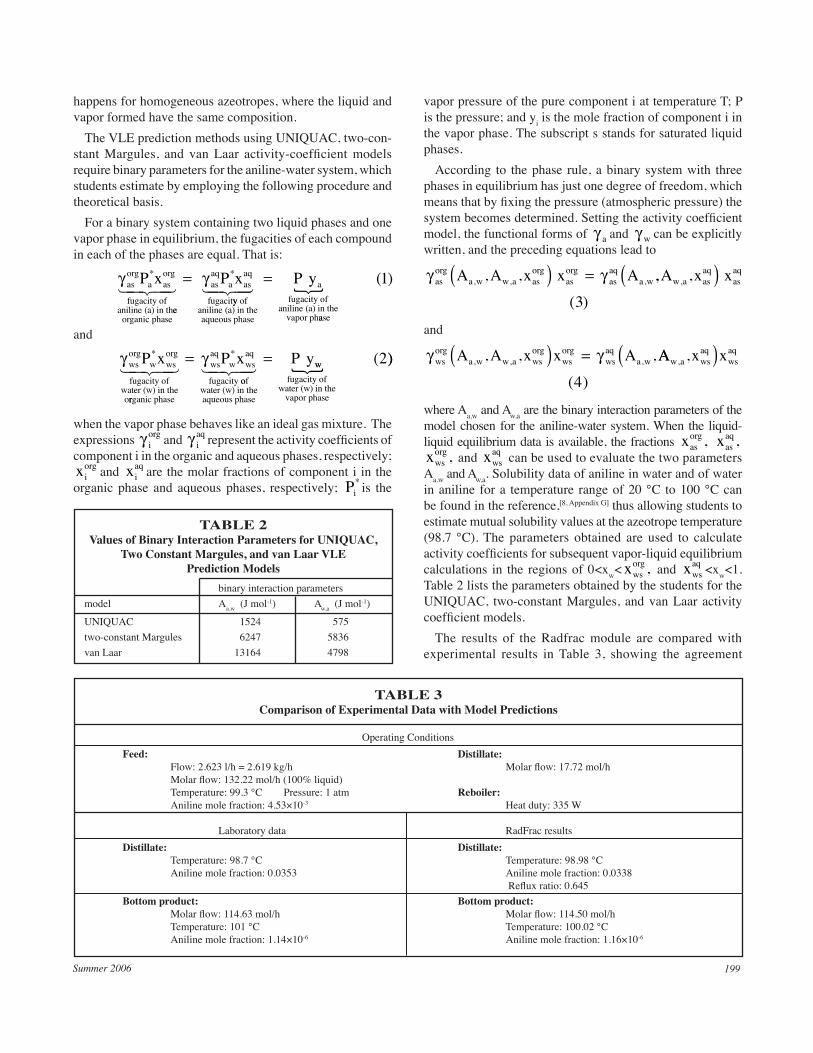
The results of the Radfrac module are compared with experimental results in Table 3, showing the agreement
TABLE 2Values of Binary Interaction Parameters for UNIQUAC,
Two Constant Margules, and van Laar VLE Prediction Models
binary interaction parameters model Aa,w (J mol-1) Aw,a (J mol-1)
Laboratory data RadFrac results Distillate: Distillate: Temperature: 98.7 °C Temperature: 98.98 °C Aniline mole fraction: 0.0353 Aniline mole fraction: 0.0338 Reflux ratio: 0.645 Bottom product: Bottom product: Molar flow: 114.63 mol/h Molar flow: 114.50 mol/h Temperature: 101 °C Temperature: 100.02 °C Aniline mole fraction: 1.14×10⁻⁶ Aniline mole fraction: 1.16×10⁻⁶
Chemical Engineering Education200
between the model’s prediction and experimental data, thus validating the equilibrium stage model for the aniline-water system. Once the heat duty in the reboiler is introduced into the model, in rating mode, it is able to determine the reflux ratio, which just represents an average value since, with the control strategy implemented, it varies discretely between 0 and ∞ , depending on the valve position. Indeed, such a value represents a possible set-point value, if the control scheme was based on the reflux ratio.
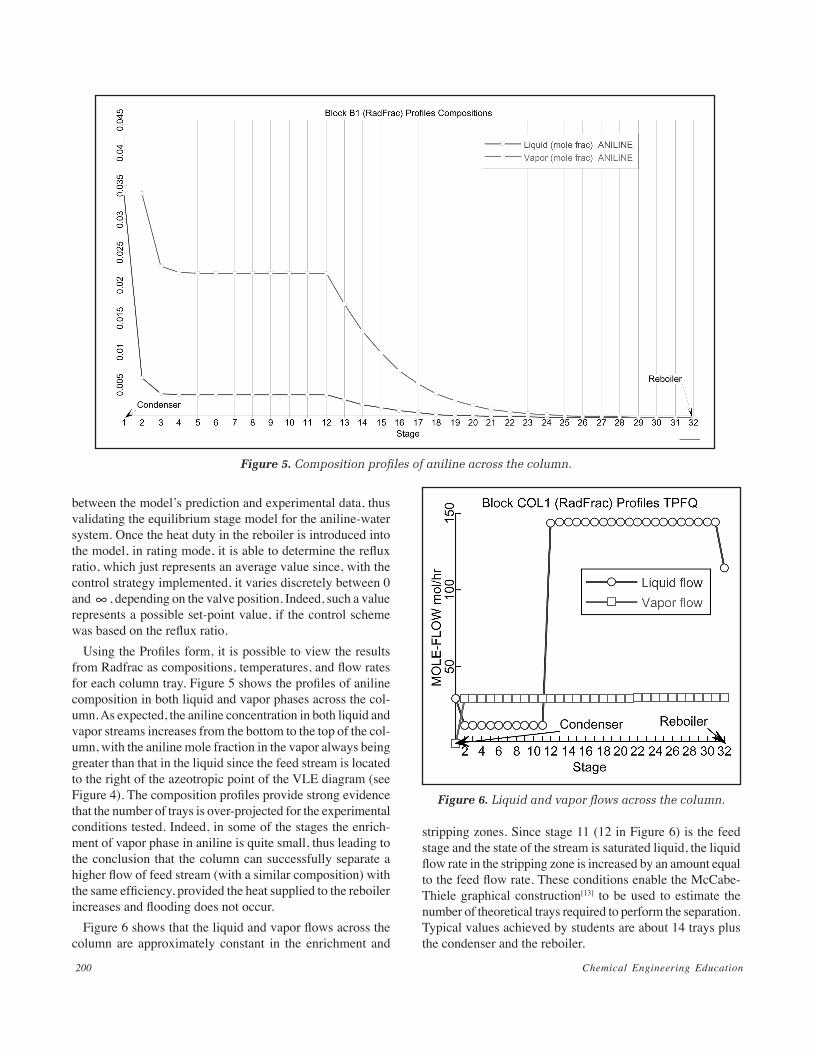
Using the Profiles form, it is possible to view the results from Radfrac as compositions, temperatures, and flow rates for each column tray. Figure 5 shows the profiles of aniline composition in both liquid and vapor phases across the col-umn. As expected, the aniline concentration in both liquid and vapor streams increases from the bottom to the top of the col-umn, with the aniline mole fraction in the vapor always being greater than that in the liquid since the feed stream is located to the right of the azeotropic point of the VLE diagram (see Figure 4). The composition profiles provide strong evidence that the number of trays is over-projected for the experimental conditions tested. Indeed, in some of the stages the enrich-ment of vapor phase in aniline is quite small, thus leading to the conclusion that the column can successfully separate a higher flow of feed stream (with a similar composition) with the same efficiency, provided the heat supplied to the reboiler increases and flooding does not occur.
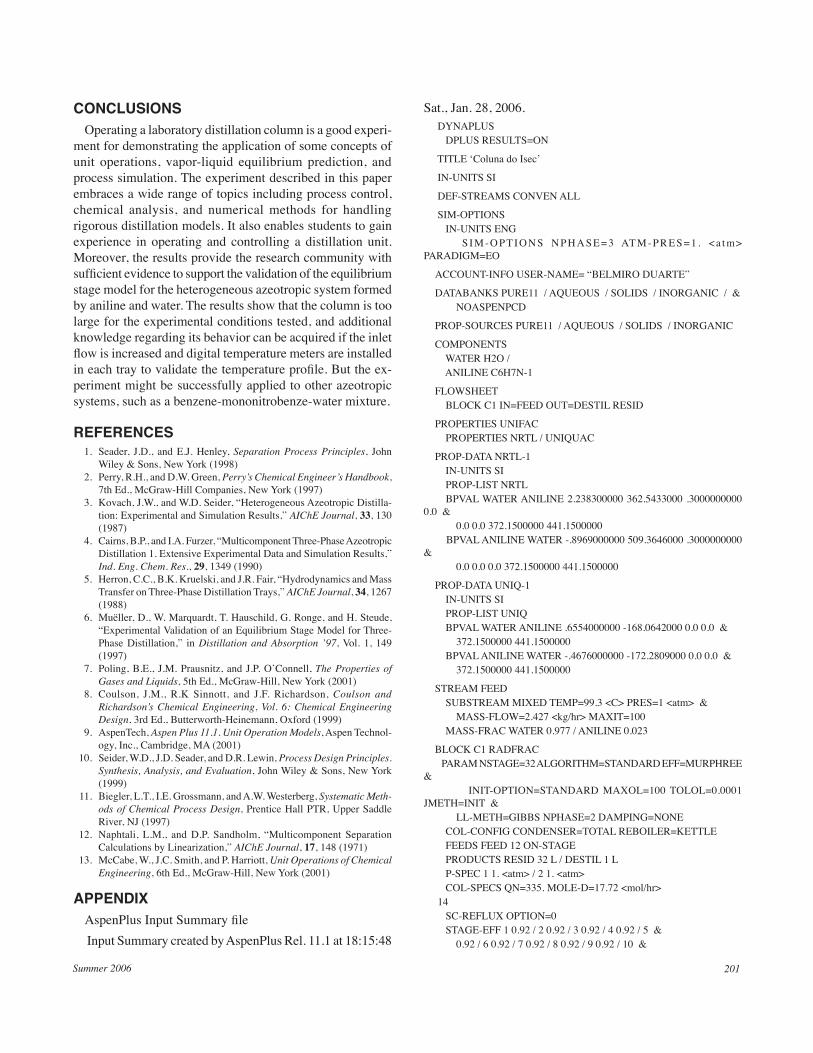
Figure 6 shows that the liquid and vapor flows across the column are approximately constant in the enrichment and
stripping zones. Since stage 11 (12 in Figure 6) is the feed stage and the state of the stream is saturated liquid, the liquid flow rate in the stripping zone is increased by an amount equal to the feed flow rate. These conditions enable the McCabe-Thiele graphical construction[13] to be used to estimate the number of theoretical trays required to perform the separation. Typical values achieved by students are about 14 trays plus the condenser and the reboiler.
Figure 5. Composition profiles of aniline across the column.
Figure 6. Liquid and vapor flows across the column.
Summer 2006 201
Sat., Jan. 28, 2006. DYNAPLUS DPLUS RESULTS=ON
TITLE ‘Coluna do Isec’
IN-UNITS SI
DEF-STREAMS CONVEN ALL
SIM-OPTIONS IN-UNITS ENG S I M - O P T I O N S N P H A S E = 3 AT M - P R E S = 1 . < a t m >
ConCLUsions Operating a laboratory distillation column is a good experi-
ment for demonstrating the application of some concepts of unit operations, vapor-liquid equilibrium prediction, and process simulation. The experiment described in this paper embraces a wide range of topics including process control, chemical analysis, and numerical methods for handling rigorous distillation models. It also enables students to gain experience in operating and controlling a distillation unit. Moreover, the results provide the research community with sufficient evidence to support the validation of the equilibrium stage model for the heterogeneous azeotropic system formed by aniline and water. The results show that the column is too large for the experimental conditions tested, and additional knowledge regarding its behavior can be acquired if the inlet flow is increased and digital temperature meters are installed in each tray to validate the temperature profile. But the ex-periment might be successfully applied to other azeotropic systems, such as a benzene-mononitrobenze-water mixture.
referenCes 1. Seader, J.D., and E.J. Henley, Separation Process Principles, John
Wiley & Sons, New York (1998) 2. Perry, R.H., and D.W. Green, Perry’s Chemical Engineer’s Handbook,
7th Ed., McGraw-Hill Companies, New York (1997) 3. Kovach, J.W., and W.D. Seider, “Heterogeneous Azeotropic Distilla-
tion: Experimental and Simulation Results,” AIChE Journal, 33, 130 (1987)
4. Cairns, B.P., and I.A. Furzer, “Multicomponent Three-Phase Azeotropic Distillation 1. Extensive Experimental Data and Simulation Results,” Ind. Eng. Chem. Res., 29, 1349 (1990)
5. Herron, C.C., B.K. Kruelski, and J.R. Fair, “Hydrodynamics and Mass Transfer on Three-Phase Distillation Trays,” AIChE Journal, 34, 1267 (1988)
6. Muëller, D., W. Marquardt, T. Hauschild, G. Ronge, and H. Steude, “Experimental Validation of an Equilibrium Stage Model for Three-Phase Distillation,” in Distillation and Absorption ’97, Vol. 1, 149 (1997)
7. Poling, B.E., J.M. Prausnitz, and J.P. O’Connell, The Properties of Gases and Liquids, 5th Ed., McGraw-Hill, New York (2001)
8. Coulson, J.M., R.K Sinnott, and J.F. Richardson, Coulson and Richardson’s Chemical Engineering, Vol. 6: Chemical Engineering Design, 3rd Ed., Butterworth-Heinemann, Oxford (1999)
9. AspenTech, Aspen Plus 11.1. Unit Operation Models, Aspen Technol-ogy, Inc., Cambridge, MA (2001)
10. Seider, W.D., J.D. Seader, and D.R. Lewin, Process Design Principles. Synthesis, Analysis, and Evaluation, John Wiley & Sons, New York (1999)
11. Biegler, L.T., I.E. Grossmann, and A.W. Westerberg, Systematic Meth-ods of Chemical Process Design, Prentice Hall PTR, Upper Saddle River, NJ (1997)
12. Naphtali, L.M., and D.P. Sandholm, “Multicomponent Separation Calculations by Linearization,” AIChE Journal, 17, 148 (1971)
13. McCabe, W., J.C. Smith, and P. Harriott, Unit Operations of Chemical Engineering, 6th Ed., McGraw-Hill, New York (2001)
Appendix AspenPlus Input Summary file Input Summary created by AspenPlus Rel. 11.1 at 18:15:48


![Equilibrium Stage Processes - Distillation[1].](https://static.documents.pub/doc/80x56/54f9d1dd4a79590b398b486d/equilibrium-stage-processes-distillation1.jpg)


