VALIDATION OF A LOW-COST DRIVING SIMULATOR USING A TELEPHONE DIALING TASK FINAL REPORT Matthew P. Reed Paul A. Green University of Michigan Transportation Research Institute 2901 Baxter Road Ann Arbor, Michigan 48 109-2150 Submitted to: Link Foundation for Simulation and Training 3280 Progress Drive Orlando, Florida June 1995
Transcript
VALIDATION OF A LOW-COST DRIVING SIMULATOR USING A TELEPHONE DIALING TASK
FINAL REPORT
Matthew P. Reed Paul A. Green
University of Michigan Transportation Research Institute
2901 Baxter Road Ann Arbor, Michigan 48 109-2150
Submitted to: Link Foundation for Simulation and Training
3280 Progress Drive Orlando, Florida
June 1995
Technical Report Documentation Page
1. Report No.
UMTRI-95- 19
7. Author(s)
Matthew P. Reed and Paul A. Green 8. Performing Organization Report No.
UMTRI-95- 19 9. Performing Organization Name and Address
University of Michigan Transportation Research Institute 2901 Baxter Road
3280 Progress Drive Orlando. Florida
2. Government Accession No.
10. Work Unit no. (TRAIS)
11. Contract or Grant NO.
304003 Ann Arbor, Michigan 48 109-2 150 USA 12. Sponsoring Agency Name and Address
Link Foundation for Simulation and Training 14. Sponsoring Agency Code
3. Recipient's Catalog No.
4. Title and Subtitle
Validation of a Low-Cost Driving Simulator Using a Telephone Dialing Task
13. Type of Report and Period Covered
Final Report
15. Supplementary Notes
5. Report Date
June 1995
6. Performing Organization Code
Abstract
Driving performance in an instrumented vehicle was compared with performance in a low-cost, fixed-based driving simulator. Six men and six women drove a freeway route while periodically dialing simulated phone calls. Lane position, speed, steering-wheel angle, and throttle position were recorded. The same subjects drove a computer simulation of the route in the laboratory driving simulator using two scene fidelity levels: a color scene with relatively high detail, and a monochrome scene showing only road-edge markings. Lane-keeping in the simulator was less precise than on the road, but speed control performance was comparable. Lane keeping and speed control were less precise when dialing the phone than in normal driving, both in the simulator and on the road, but the performance decrement was greater in the simulator. Subjects over 60 years of age showed larger performance decrements during a concurrent phone dialing task than did subjects 20 to 30 years of age both in the simulator and on-road. No important differences in driving performance were found between the high and low simulator scene fidelity levels. Based on these findings, recommendations for improvements to the simulator were made.
17. Key Words
ITS, human factors, ergonomics, simulation, instrumented vehicles, driving, safety
18. Distribution Statement
No restrictions. This document is available to the public through the National Technical Information Service, Springfield, Virginia 22161
19. Security Classif. (of this report)
None Form DOT F 1700 7 (8-72) Reproduction of completed page authorized
20. Security Classif. (of this page)
None 21. No. of pages
50 22. Price
CONTENTS
........................................................................................................ LIST OF TABLES vii
LIST OF FIGURES ...................................................................................................... ix
.......................................................................................... ACKNOWLEDGEMENTS xi
3.3 High Versus Low Scene Fidelity in the Simulator ................... .. ........... 16 ................................................... 3.4 On-Road Versus High-Fidelity Simulator 17
............................................... 3.5 Summary Comparison of Car and Simulator 20
2 . Measures of Driver Performance (Dependent Variables) ................................. 14
3 . Summary of Driving Performance Measures (Means and Standard Deviations) for all Drivers ................... ... .................... 20
LIST OF FIGURES
Equipment installed in the test vehicle ................................................................ 6
...................................................................................... Manual car phone handset 8
Phone display mounted in test vehicle .................... ... .................................... 9
On-road test route ..................................... .. ....................................................... 10
Typical simulated road scene in high-fidelity mode ................... .... ................ 11
.................... Typical simulated road scene in low-fidelity mode .. .... ... ......... 11
Age and Task effects on the mean lateral speed in on-road driving ...................... 16
Age and Task effects on the standard deviation of steering-wheel angle in on-road driving ................................................................................................. 16
Age*Fidelity interaction in the standard deviation of steering-wheel angle during normal driving in the simulator (both older and younger subjects) ........... 17
Age*Task interactions in mean lateral speed data on-road and in the high-fidelity simulator condition ........................................................................... 18
Fidelity effects by Age*Gender group for normal driving ...................................................................................... and phone-task conditions 18
Age*Task interactions in the standard deviation of steering-wheel angle ......................................... on-road and in the high-fidelity simulator condition 19
Effects of Age. Fidelity. and Task on the standard deviations of speed and throttle position ................... .. ............................................................ 19
ACKNOWLEDGMENTS
This research was made possible by a Fellowship from the Link Foundation for Simulation and Training. Matthew Reed was the Principal Investigator and Paul Green was the Project Director. The authors would like to thank Stewart Katz for his assistance with the instrumented car and Brian Davis for assistance with simulator programming.
1.0 INTRODUCTION
This experiment addressed the following issues:
1. Does performance in a typical low-cost driving simulator (the UMTRI Driver Interface Research Simulator) resemble that of driving a real vehicle on the highway?
2. How does the resemblance vary with the fidelity of the visual scene in the simulator?
3. How does adding a concurrent in-vehicle task (dialing a cellular phone) affect performance in both contexts?
1.1 BACKGROUND
Driving simulation has been an important part of automobile human factors research for more than two decades (Lincke, Richter, and Schmidt, 1973; Alm and Nilsson, 1994; Green, 1993; Green, 1995). Advances in computer technology have facilitated the development of interactive simulators, in particular, those with large visual displays and motion bases (Freeman, 1994; Bertollini, Johnson, Kuiper, Kukula, Kulczycka, and Thomas, 1994). Examples of research conducted with driving simulators include studies of driver interaction with suspension and steering systems (Repa, Alexandridis, Howell, and Wienville, 1977), research on driver workload (Green, Lin, and Bagian, 1993), and studies of the effects of alcohol on driving performance (Gawron and Ranney, 1988; Roehrs, Beare, Zorick, and Roth, 1994).
There are three primary justifications for using driving simulation rather than in-vehicle testing:
1. Safety. Some research is too hazardous to be conducted in vehicles on the road. Some examples are studies of driver accident avoidance and the effects of alcohol on driving performance. While test-track conditions can be used to examine these issues for single vehicles, multiple-vehicle scenarios are more safely studied in a simulator.
2. Equipment Cost. Simulators allow study of driver responses to changes in the vehicle without having to construct a vehicle with those features or performance characteristics. Alternative four-wheel steering systems have been studied using simulators, potentially at less cost and more quickly than constructing roadworthy systems.
3. Experimental Control. A wider variety of test conditions can be prescribed and consistently applied in a driving simulator than on the road. The influence of the weather on driving conditions is controllable in the simulator. In many places, such as Michigan, snow and rain make on-road testing during the winter difficult.
Unfortunately, high-fidelity driving simulators can be much more expensive to construct and operate than other equipment typically used in human factors research, particularly in academic settings. There are many human factors research projects for which the costs of these relatively high-fidelity simulators are prohibitive. Consequently, automotive
human-factors research relating to driving performance, such as studies of alternative interface designs for in-vehicle driving aids, must usually be done on-road.
To realize the benefits of simulation without incurring the capital and operating costs of a high-fidelity simulator, lower-fidelity and part-task driving simulators have been developed (Stein, Allen, and Parseghian, 1992; MacAdam, 1992; Aaronson and Eberhard, 1994). Recently, UMTRI has developed a low-cost, fixed-base simulator (MacAdam, Green, and Reed, 1993). The objective of this study was to investigate the validity of the simulator for conducting studies of driving performance and how visual scene fidelity affects validity.
1.2 SIMULATOR VALIDATION
A number of studies have assessed driving simulator validity. Good correlations have been found between driving performance in simulators and on the road. The dynamic performance of operators has been shown to be similar in simulators (Lincke, Richter, and Schmidt, 1973; McRuer and Klein, 1975; Leonard and Wierwille, 1975; Bertollini, Johnston, Kuiper, Kukula, Kulczycka, and Thomas, 1994). The performance of driving tasks (speed control and lane keeping) in fixed-base simulators has been found to be less precise than in actual vehicles or moving-base simulators due to the lack of motion cues (McLane and Wierwille, 1975; Blaauw, 1980; Alicandri, Roberts, and Walker, 1986). However, lane-keeping performance measures in fixed-base simulators have been found to be more sensitive than in actual vehicles due to differences in subject's driving experience (Blaauw, 1980; Blaauw, 1982).
Two aspects of simulator validity are generally assessed. The first concerns the physical correspondence between the environments, including the geometry of the controls and their response characteristics. In driving simulation, mockups of vehicle cabs are used and an effort is made to generate foot-control and steering-wheel force feedback that is similar to the vehicle. The second aspect of simulator validity is the behavioral correspondence between the performance of the operator in the simulator and in the actual vehicle. This is of primary importance in human factors applications. Blaauw (1980) describes four methods of assessing the behavioral correspondence in driving simulation:
1, comparison of the system output (e.g., lane position) or driver response (e.g., steering-wheel angle),
2. comparison of physical andlor mental loading by analysis of physiological variables,
3, subjective criteria, e.g., task difficulty ratings, and 4. transfer of training.
In the current experiment, the first method is used to investigate both the absolute and the relative validity of the UMTRI driving simulator. A simulator demonstrates absolute validity if levels of driver performance are similar to those obtained in a real vehicle. If the values of the performance measures are different, but the directions of the responses to experimental variables, such as side-task loading, are comparable, the simulator demonstrates relative validity. Previous studies have found that fixed-base simulators are likely to produce poor absolute validity but good relative validity for many measures of driving performance (Blaauw, 1982; McLane and Wierwille, 1975; Alicandri, Roberts, and Walker, 1986). Visual scene fidelity has not been found to have a strong effect on driving performance (McLane and Wierwille, 1975; McRuer and Klein, 1975).
1.3 OVERVIEW OF THE EXPERIMENT
In this experiment, driver performance was measured in the simulator with two visual- scene fidelity levels and on the road in an instrumented car. A primary concern was to compare the performance decrements associated with side-task performance in the simulator and on the road. Manual car-phone dialing was chosen over other artificial tasks (e.g. , choice response time to words) because it is a task that is normally carried out while driving, yet still has the necessary structure for a good experimental task. Manual car-phone dialing has been shown to have a strong effect on driving precision, which potentially affects driving safety, primarily because of the visual demands of the task (Stein, Parseghian, and Allen, 1987; Zwahlen, Adams, and Schwartz, 1988; Serafin, Wen, Paelke, and Green, 1993a, 1993b; Green, Hoekstra, and Williams, 1993). Relatively long-duration glances are required to read a phone number and to enter it correctly using a numeric keypad. The difficulty of dialing a telephone while driving has been rated by users as more difficult than most typical driving tasks (Kames, 1978; Smith, 1978). In the present study, subjects were periodically asked to place simulated car phone calls. Driving performance with and without the side task was compared in the simulator and on the road to examine simulator validity. Driving performance in the simulator was compared between two scene fidelity levels to determine if higher scene fidelity improved the correspondence with on-road performance.
2.0 METHODS
The experiment was conducted in two parts. In the first part, twelve subjects drove an instrumented vehicle over a limited-access highway route, periodically dialing simulated telephone calls. In the second part, the same twelve drivers operated a laboratory driving simulator over a simulated route intended to be comparable to the on-road route, using two scene fidelity levels. In both parts of the experiment, performance data were collected during normal driving and while concurrently dialing.
2.1 SUBJECTS
Twelve subjects were recruited by word of mouth and from previous subject lists. Six subjects were over 60 years of age and six were between 20 and 30 years of age. Three men and three women were selected within each age group. All subjects were currently licensed drivers and had corrected vision of at least 20125 (Landholt ring). One younger male subject had used a car phone more than 20 times prior to the study. The other subjects had used a car phone fewer than ten times, Subjects were told that this was a study of "driving performance" during cellular phone use both on the road and in the laboratory simulator.
2.2 TEST VEHICLE
The test vehicle was a left-hand-drive 1991 Honda Accord LX station wagon equipped with instrumentation to measure driver performance. Although it was highly instrumented, the test vehicle was indistinguishable from any other vehicle on the road from the outside except for an identifying sign on the side of the vehicle. Vehicle handling was typical of that of a midsize station wagon with a moderate cargo load.
Detailed specifications of the test vehicle have been reported elsewhere (Sweet and Green, 1993; Katz, Green, and Fleming, 1995). Figure 1 shows a schematic representation of the vehicle instrumentation. Data were collected by an on-board computer via a custom-made signal conditioner located in the cargo section of the car. Sensors included a potentiometer to measure steering-wheel angle, speed, throttle, and brake signals from the engine computer, and output from the headway sensor. Lane position was determined in real time by processing video images from the two lane- tracking cameras aimed at the road that were mounted in the side mirrors. Two thumb- sized video cameras (one aimed at the forward scene, one aimed at the driver) provided for simultaneous recording of key events. Sound was recorded by two small microphones located near the driver. All equipment was operated by an experimenter seated in the right-rear passenger seat. For this experiment, data recorded included lateral lane position, speed, steering-wheel position, throttle position, and video images of the driver and forward scene.
Driver Interface Research Vehicle 1991 Honda Accord LX Wagon
Headway sensor - Leica Odin II
Transmission controller
Electronic Control Unit (ECU)
Right lane tracking camera - Phillips 56475
Ali-Scout navigation unit
Ali-Scout beacon transmitter
Scene camera - Panasonic GP-KS152 with 1 :I -4 3mm lens
Left lane tracking camera - Phillips 56475
Driver camera - Panasonic GP- KS152 with 1 :1.4 3mm lens
PC compatible keyboard Color video monitor - Panasonic BT-S901Y
(2) Camera controllers - Panasonic GP-KS152
Super VHS VCR - Panasonic AG-5700
Data collection computer - Gateway 2000 33MHz 486 with
4 MBytes RAM, National Instruments AT MIO-16 and PC
DIO-24 boards, Cortex-l video frame grabber, 16 bit SCSl card,
and Ergo LCD display card
Microphone mixer - Shure M267
Quad splitter - Panasonic WJ-450
Splitterlinserter - American Dynamics 1470A
Custom signal conditioning module
400 Watt inverter - Powerstar model UPG 400,12V power
supply & t151-15V power supply
Video converter - ADS VGA->TV Elite
Conner 85MByte external hard drive
Bernoulli drive - lomega 90 Pra
Figure 1. Equipment installed in the test vehicle.
2.3 DRIVING SIMULATOR
The driving simulator used in this study is based on software, developed at UMTRI over the past several years that runs on Apple Macintosh computers (MacAdam, Green, and Reed, 1993) . The software is designed to be flexible and extensible, and different configurations are used in several laboratories at UMTRI. The Driver Interface Research Simulator used in this experiment consists of the cab of a 1985 Chrysler Laser with instrumented steering wheel, accelerator pedal, and brake pedal. Vehicle speed is displayed on a digital LED panel in the instrument panel. The simulated visual scene is projected onto a 2.5 x 3.7 m (8 x 12 ft) screen located approximately 6 m (20 ft) in front of the driver's eye point, giving a 22-by-33-degree field of view.
The scene resolution is 640 x 480 pixels with 8-bit color depth, although these values can be adjusted to trade off resolution and color depth to increase update rate. In this experiment, approximately 70 percent of the available display was used, or about 448 x 336 pixels. The simulator "world" is programmed using text files consisting of link descriptions. These link files describe the position and orientation of road segments and the locations of roadside objects, such as signs, trees, or poles. Curving roads with hills, intersections, and appropriate signs can be defined. The distribution of scene detail has been optimized for speed. The background scene above the horizon is displayed as a panning pixel map, which is loaded from a library. The ground objects, including the road and the roadside areas, are drawn using large polygons, while signs, trees, and other roadside objects are displayed as pixel maps.
One objective in the design of the software was that the simulator should be able to run on generic, off-the-shelf computer hardware, without requiring specialized sound or graphics processors. Consequently, the software makes use of the built-in Macintosh graphics capabilities, rather than using external libraries or processors. This approach limits the maximum performance that can be obtained, but increases the portability of the software and decreases hardware costs. The code is written in C using standard Macintosh programming conventions, and has proven to be readily ported to a new processor (PowerPC 601 from Motorola 68040) and new operating system configurations.
The simulator software is executed as two communicating processes running on separate, networked machines. One process controls the main flow of the simulation and creates and displays the visual scene. The other process samples the control inputs, executes the vehicle dynamics code, and generates appropriate vehicle sounds (engine noise, wind noise, road noise, and off-road noise) from a digitized library. The scene update rate is determined by the scene complexity. For the high-fidelity scenes used in this study, typical frame rates are between 20 and 25 Hz. For the low-fidelity condition, frame rates are about 40 Hz.
This simulator is continually under development, but has been successfully used in a number of automotive human factors studies (Green, Lin, and Bagian, 1993; Reed, Schneider, and Eby, 1995), along with yet-to-be-reported research on the effects of Alzheimer's disease on driving, and the interaction between low levels of alcohol and driver age on performance. The findings of the present study are being used to direct further upgrades of the hardware and software, and to provide general design guidance for driving simulator development.
2.4 PHONE TASK
A car-phone handset was modified to interface with a Macintosh computer running a Supercard-based software simulation of a cellular phone. This system has been used in previous studies of driver performance during simulated phone tasks (Serafin, Wen, Paelke, and Green, 1993a, 1993b). The handset, modified from a Motorola model SCN2085A phone shell, is shown in Figure 2. As 9-x-9-mrn buttons are pressed on the handset, digits are displayed on a 115-x-86-mm LCD display panel mounted in the center of the instrument panel at approximately the height of the top of the steering wheel. Figure 2 shows the LCD panel mounted in the test vehicle. Digits are displayed using a 7-segment LED font with 10-mrn character height. Key presses are recorded in a data file, along with the timing of the keystroke relative to the start of data acquisition. Eleven-digit telephone numbers to be dialed were provided to the subject on 127-x-76- mm flip cards mounted on a stalk immediately to the right of the phone display. The digits on the cards were 10 mrn high.
Figure 2. Manual car phone handset.
Figure 3. Phone display mounted in test vehicle.
2.5 TEST PROTOCOL
2.5.1 On-Road Testing
On-road testing was conducted during the months of September and October on dry pavement. The subject entered the car, fastened the seatbelt and made appropriate adjustments to mirrors. The experimenter sat in the right-rear seat. The phone handset was initially placed on the right-front passenger seat, within reach of the driver.
Using only his or her right hand, the subject dialed 11-digit long-distance numbers (1 plus a 3-digit area code plus a 7-digit local number) shown on the card mounted near the center of the instrument panel. Most subjects chose to dial with the right thumb while gripping the handset with the fingers. After the phone number was entered completely, the subject pressed "Call" to place the call and held the handset to his or her ear. The computer played a ringing sound, followed by a spoken message indicating if the number was dialed correctly or incorrectly. The subject then pressed "End to terminate the call. If the number was dialed correctly, the subject placed the handset on the passenger seat, turned to the next card, picked up the handset, and dialed the next number. If the message indicated that the number was rnisdialed, the subject redialed the same number. If a mistake was made during dialing and detected before the "Call" button was pressed, the subject could use the "Delete" key to erase one digit at a time. After the subject indicated that he or she understood the phone-task instructions, the subject dialed three long-distance numbers for practice. The experimenter provided additional coaching as necessary.
The subject then drove the car over approximately 1 mile of surface streets and onto an expressway. The test route (Figure 4) was a 14-mile (22.4-km) section of M- 14, a lirnited-access highway. Subjects drove from UMTRI to US-23 to east-bound M-14 to Beck Road, returned on M-14 to Ford Road, drove again to Beck Road, then returned to UMTRI via M-14 and US-23. Subjects were instructed to drive in a normal, safe manner, maintaining a speed of 60 mi/hr (96 kmlhr), 5 rnih (8 krn/hr) below the posted speed limit of 65 mi/hr (104 km/hr). The subject drove in the right lane during all data collection intervals. Occasionally, the driver was instructed to move to the left lane to pass a slower-moving vehicle between data collection intervals.
Phone Task Section
North
Figure 4. On-road test route (approximately to scale).
Data were collected as the subject drove in both directions over two straight sections of the road. Normal-driving data (no phone task) were collected for about 90 seconds on one straight section and phone-dialing data were collected for about 120 seconds on the other straight section. Subjects were verbally cued to begin dialing. Subjects dialed numbers and listened to the computer-generated messages continually until instructed to stop after the end of the straight section of road was reached, which typically took about 120 seconds. Four sets of normal and phone-task driving data were collected in the following order: normal, phone, phone, normal, normal, phone, phone, normal. Total test time was approximately 40 minutes (20 minutes per lap). After returning to UMTRI, subjects parked the car and then dialed three phone numbers as at the beginning of testing.
2.5.2 Simulator Testing
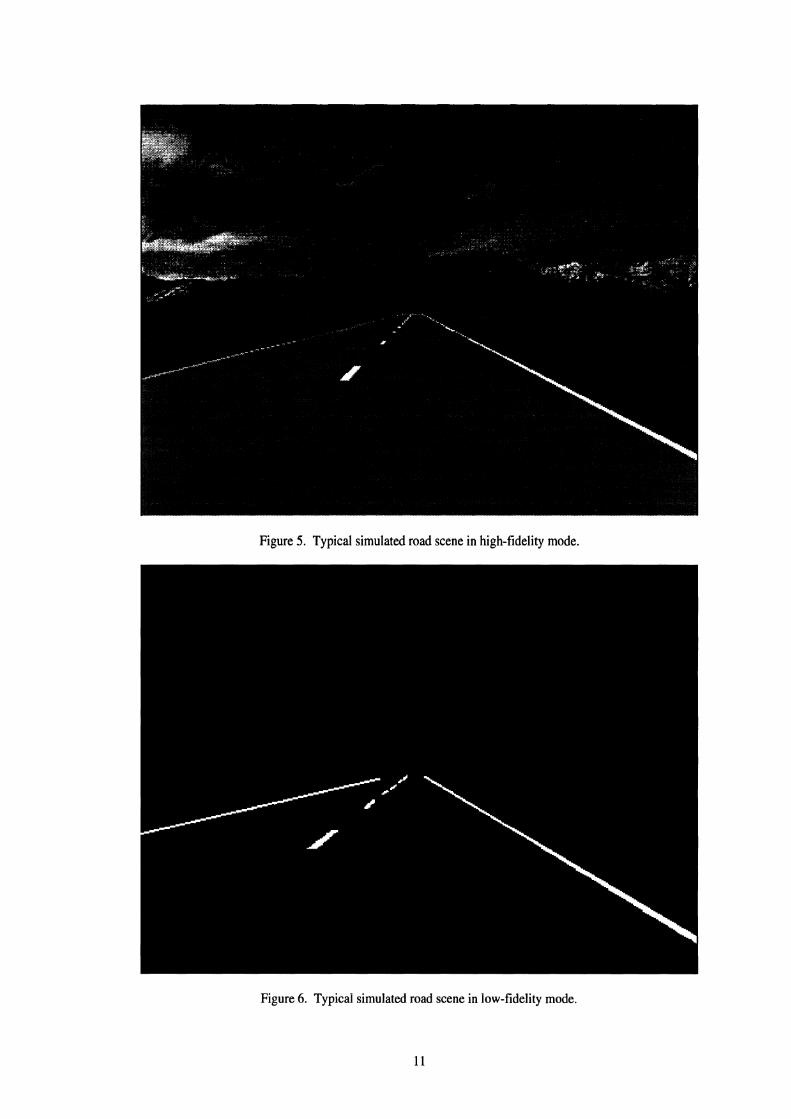
Simulator testing was conducted eight to ten weeks after on-road testing with the same subjects. A simulated two-lane road was developed to match the turns and straightaways of the highway route. Subjects were tested in two visual fidelity modes. In the high- fidelity mode, a colored, textured background and roadside objects (trees, signs, and posts) were included. Figure 5 shows a typical scene. In the low-fidelity mode, the scene was black except for white road-edge lines and a white, dashed centerline. Figure 6 shows a typical scene in the low-fidelity mode. The l-bit-per-pixel image resembled a rural road driven on a very dark night.
Figure 5. Typical simulated road scene in high-fidelity mode.
Figure 6. Typical simulated road scene in low-fidelity mode.
Subjects sat in the laboratory vehicle mockup and adjusted the seat. The phone task equipment was located in approximately the same position relative to the driver and instrument panel as it was for on-road testing. The subject was once again instructed on the use of the phone and dialed three numbers prior to driving the simulator.
The simulator was started in high-fidelity mode for a practice run and the subject was instructed to maintain 60 rnih in the right-hand lane. The subject drove through the first leg of the test route (Ford Road to Beck Road -- see Figure 4), which required approximately 8 minutes. The experimenter provided coaching as needed. Most subjects made excessively large steering corrections initially, but all were able to drive smoothly in the right lane by the end of the practice trial.
The experimenter stopped the simulator at the end of the practice run and reviewed the phone task procedures with the subject. The subject dialed three phone numbers and listened to the computer-generated feedback after placing each call.
Four simulator runs were then conducted. Simulator scene fidelity (low or high) was alternated between runs. The order of fidelity presentation was counterbalanced within age groups, so that an equal number of subjects in each age group began testing with low fidelity and high fidelity. For each simulator run, the subject drove for approximately eight minutes under instructions to maintain 60 rnilhr and stay in the right lane. Driving performance data were collected continuously. The subjects drove the part of the simulated roadway corresponding to the first leg of the on-road route. When the subject reached the second straight section (about 5 minutes into the simulation), the experimenter instructed the subject to begin the phone task. The subject continued with the phone task until the end of the straightaway was reached, at which time the experimenter stopped the simulator to end the run.
3.0 RESULTS
Data analyses were conducted to address the following research questions:
1. Does performance in a typical low-cost driving simulator (the UMTRI Driver Interface Research Simulator) resemble that of driving a real vehicle on the highway?
2. How does the resemblance vary with the fidelity of the visual scene in the simulator?
3. How does adding a concurrent in-vehicle task (dialing a cellular phone) affect performance in both contexts?
3.1 ANALYSIS
Data from normal driving and phone-task driving intervals (car and simulator) were extracted from the raw data files for analysis. Unfortunately, data for the phone-task during low-visual-fidelity trials were lost and therefore unavailable for analysis. Custom software was written in the Mathematica programming environment to perform the analysis (Wolfram, 1991). The central 60 seconds of data from each normal driving interval and the central 90 seconds from each phone-task interval were extracted. Identical procedures were then used for both the car and simulator data to obtain measures of driving performance. Car data were analyzed at 30 Hz, although data from the lane tracker were updated at only 10 Hz. Simulator data were recorded at a frequency between 15 and 30 Hz that varied with the scene update rate. Linear interpolation was used to obtained thirty evenly spaced values per second. All data were digitally low-pass filtered to remove frequency components above 2 Hz. Analysis of variance was used to investigate the effects of the independent variables on driver performance measures. Table 1 lists the factors and their levels. Table 2 lists the dependent measures that were calculated from the lane-position, speed, steering-wheel angle, and throttle-position data.
Table 1 Independent Variable Levels
Variable
Age
Gender
Fidelity
Task
Levels
Young, Old
Men, Women
Car, High*, Low* (*simulator scene fidelity)
Normal, Phone
Table 2 Measures of Driver Performance (Dependent Variables)
Lane Position
Data Source
Speed
Dependent Measure (Units)
Mean Lane Position (ft)
Steering- wheel Angle
Calculation Method
Arithmetic mean of lane position, positive to the right of the centerline.
Standard Deviation of Lane Position (ft)
Mean Log Time to Line (log seconds)
Standard deviation of lane position.
Mean Lateral Speed (ft/s)
Standard Deviation of Speed (min-4
Mean Absolute Acceleration (mihr per second)
Standard Deviation of Steering-wheel Angle (degrees)
Steering Reversal Frequency (11s)
Mean of absolute values of first-order differences in lane position.
Time-to-line was calculated for each data interval (301s) as the time that would be required for a wheel of the car or simulated vehicle to reach a lane-edge marker if the lateral velocity remained constant at the value calculated from the first-order difference in lane position (Godthelp, Milgram, and Blaauw, 1984). The log (base 10) of the time-to-line was taken to reduce the influence of the large values that result each time the lateral velocity changes direction.
Standard deviation of vehicle or simulated speed.
Mean of absolute values of first-order differences in speed.
Standard deviation of steering-wheel angle.
Mean number of steering-wheel reversals per second. A discrete steering-wheel motion consists of a series of first-order steering-wheel-angle differences that do not change sign for more than 0.33 second (ten samples at 30 Hz) and that represent a net monotonic change in steering-wheel position of more than 1 degree. The number of reversals during a trial is one less than the number of discrete motions. Dividing by the duration of the trial gives the frequency of steering-wheel reversals.
Throttle Position
Standard Deviation of Throttle Position (percent of full throttle)
Standard deviation of throttle position.
Throttle Reversal Frequency (11s)
Calculated in a manner similar to steering-wheel- reversal frequency, except that a discrete throttle motion consists of a net monotonic change of 0.5 percent with a duration of at least 0.33 seconds.
The effects of Age, Gender, and Task in the car are discussed first, followed by a comparison of performance in the low- and high-fidelity simulator conditions. Findings from the car and high-fidelity simulator conditions are then compared. In this analysis, greater driving precision (smaller standard deviations in lane position, speed, steering- wheel angle, and throttle position) are indicative of better driving performance. Statistical effect tests with Type-I error probabilities less than or equal to 0.01 are considered significant.
Of the ten dependent measures listed in Table 2, one was selected from each data source (lane position, speed, steering-wheel angle, throttle position) to illustrate the findings. The dependent measures based on each data source generally show similar results, although there are differences that will be examined in future analyses. The findings presented here will focus on mean lateral speed and standard deviation of steering-wheel position as measures of lane keeping, and standard deviation of speed and standard deviation of throttle position as a measures of speed control. For each subtask (lane keeping and speed control), the analyzed variables include a measure of driver-vehicle system performance and a measure of driver response. These measures are related by the respective transfer functions of the vehicle systems. (Mean lateral speed was chosen rather than standard deviation of lane position as a measure of lane-keeping precision because, although the two measures are highly correlated, mean lateral speed was significantly affected by the phone task and age in the on-road conditions, while standard deviation of lane position was significantly affected only by age.)
3.2 ON-ROAD DRIVING PERFORMANCE
Data from on-road testing showed significant interactions among Age, Gender and Task. When subjects were driving without the telephone task, driving performance did not differ significantly between men and women or younger and older subjects.
Lane Keeping
Older and younger subjects had similar mean lateral speed values during normal driving (0.16 ft/s). Figure 7 shows the Age and Task effects on mean lateral speed. Mean lateral speed was higher when subjects were performing the phone task (0.23 ft/s). Younger subjects were less affected by the concurrent phone task than older subjects (increase of 0.4 ftls vs. 0.9 ftls). Both Task and the Age*Task interaction were significant. No Gender-related effects were significant.
The standard deviation of steering-wheel angle shows similar Age and Task effects, as expected. Figure 8 shows the Age and Task effects. The standard deviation of steering- wheel angle was higher during the phone task (0.8 1 degree). Age groups did not differ during normal driving (0.58 degree), but younger drivers showed a smaller effect of task than older drivers (0.17 degree vs. 0.28 degree). No Gender-related effects were significant.
Speed Control
The standard deviation of speed was smaller in normal driving than during the phone task (0.89 mph vs. 1.90 mph). The standard deviation of throttle position was also smaller in normal driving than during the phone task (2.8 percent vs. 3.4 percent ). No effects of Age or Gender were significant for either variable.
0.10
norm phone
Task
Figure 7. Age and Task effects on the mean lateral speed in on-road driving.
- Old
Young
2 0.5 .
norm phone
Task
Figure 8. Age and Task effects on the standard deviation of steering-wheel angle in on-road driving.
3.3 HIGH VERSUS LOW SCENE FIDELITY IN THE SIMULATOR
Because driving performance data for the phone task under the low-fidelity condition were lost, only the Age, Gender, and Fidelity effects, and their interactions, could be tested to compare the high- and low-fidelity conditions. Only one significant difference between simulator fidelity conditions was observed in analyses of mean lateral speed, standard deviation of speed, standard deviation of steering-wheel angle, and standard deviation of throttle position. For the standard deviation of steering-wheel angle, the effect of fidelity on steering precision was opposite for men and women. Figure 9 shows a plot of the Age*Fidelity interaction. No other effects were significant (p10.01), although the Age*Gender interaction approached significance in the other three variables examined.
high low Simulator Scene Fidelity
-
; -
Figure 9. AgehFidelity interaction in the standard deviation of steering-wheel angle during normal driving in the simulator (both older and younger subjects).
Women Xen I
3.4 ON-ROAD VERSUS HIGH-FIDELITY SIMULATOR
Since little difference was observed between the high- and low-fidelity simulator conditions, the simulator validity was evaluated by comparing on-road data with data from the high-fidelity simulator condition only. In general, the same effects were significant in both data sets, but the variable values were larger in the simulator than on the road, indicating decreased driving precision in the simulator. One difference between the on-road and simulator data was an interaction between Age and Gender. Older women drove with significantly less precision than other subject groups in the simulator. This interaction was not significant in the on-road data.
Lane Keeping
Mean lateral speed was considerably higher in the simulator than on the road. Age, Task, and Age*Task were significant both in the simulator and in the car, but the magnitudes of the effects were much larger in the simulator. Figure 10 shows the Age*Task interaction for both the car and simulator. For normal driving, mean lateral speed was 0.16 ft/s in the car and 0.45 ft/s in the simulator, a 18 1 percent increase. Under phone-task conditions, mean lateral speed was 0.23 ft/s in the car and 1.16 ft/s in the simulator, a 404 percent increase. Thus, the simulator was more sensitive to the interfering effects of the secondary task. The effects of task on younger and older drivers were likewise greater in the simulator than on the road. For older drivers, the task effect was 1.0 ft/s in the simulator compared with 0.21 ft/s on the road. For younger drivers, the task effect was 0.61 ft/s in the simulator and 0.18 ft/s on the road. The ratio of the task effects by age group (younglold) was 0.62 in the simulator and 0.89 on the road.
--C Young-Car
-A- Old-Sim
Young- + Sim
norm phone Task
Figure 10. Age*Task interactions in mean lateral speed data on-road and in the high-fidelity simulator condition.
Age*Gender and Age*Gender*Fidelity were significant in this analysis. Examination of the data showed that the effect was due to high values of mean lateral speed from older women in the simulator during the phone task. Figure 11 shows the fidelity effects for each Age*Gender group in phone-task and normal conditions. Older subjects showed a larger difference in driving precision between the car and the simulator during the phone task, and older women showed a larger difference than older men. In normal driving, the difference between Age*Gender groups in car versus simulator differential was markedly smaller.
car simulator Phone
+ Old-Women
+ Old-Men
Young- - Women
Young- - Men
car simulator Norm
Figure 11. Fidelity effects by Age*Gender group for normal driving and phone-task conditions.
Findings for the standard deviation of steering-wheel angle were similar to those for mean lateral speed. Figure 12 shows the effects of Age, Fidelity, and Task. Task and Age effects were much larger in the simulator than on the road. The Gender-related interactions observed in the mean lateral speed data were also evident in the steering analysis. The older-women subjects showed significantly higher steering variance than other subject groups, particularly while performing the phone task.
+ Old-Car
4 Young-Car
-A- Old-Sim
Young- + sim
Figure 12. Age*Task interactions in the standard deviation of steering-wheel angle on-road and in the high-fidelity simulator condition.
2 0
Speed Control
M I
The effects of Age, Fidelity, and Task on speed control were different from the effects on lane keeping. In the on-road data for standard deviation of speed, only the task effect is significant, although the Age*Task interaction approaches significance. Age effects were more important than car/simulator differences. Task effects for younger subjects were smaller than for older subjects both in the car and in the simulator. Figure 13 shows the effects of Age, Fidelity, and Task on standard deviation of speed and standard deviation of throttle position. The latter was significantly higher under phone task conditions both in the simulator and in the car, but differences between Age*Gender groups were larger than the Task effect. The largest Task effect was observed for older subjects in the simulator.
norm phone
- I I I norm phone
4 Young-Car
-A- Old-Sim
Young- * Sim
norm phone
Figure 13. Effects of Age, Fidelity, and Task on the standard deviations of speed and throttle position.
3.5 SUMMARY COMPARISON OF CAR AND SIMULATOR
Table 2 presents the mean values for all of the performance measures listed in Table 2 for the car and simulator (high-fidelity condition) for both normal driving and driving with the phone task. Another way of assessing simulator validity is to examine the correlations between subjects' simulator performance and car performance. Subjects who perform well on the road will ideally perform well in the simulator, relative to other subjects. Table 3 shows correlation coefficients for each of the dependent measures. In general, measures of lane keeping were well correlated between the car and simulator (r = 0.76 and 0.74 for mean lateral speed and the standard deviation of steering-wheel position, respectively), but measures of speed control were more poorly correlated. These results reflect the fact that there was a much larger range of values across subjects in the lane-keeping variables, particularly because age had more pronounced effects on lane keeping than speed control.
Table 3 Summary of Driving Performance Measures (Means and Standard Deviations) for All Drivers
Dependent Measure (Abbreviation, Units)
Mean Lane Position (ft from left edge)
Standard Deviation of Lane Position (ft)
Mean Lateral Speed (ftls)
Mean Log Time to Line (Log[sl)
Standard Deviation of Speed ( m ~ h )
Mean Absolute Acceleration (mphlsecond)
Standard Deviation of Steering- wheel Angle (degrees)
Throttle Reversal Frequency
Car
0.16 (0.04)
Steering Reversal Frequency (11s)
Standard Deviation of Throttle Position
Normal
6.39 (0.80)
0.54 (0.20)
1.65 (0.19)
0.89 (0.44)
0.22 (0.07)
0.58 (0.14)
Correlation (r), Car vs.
Simulator
0.43
0.59
Simulator (high-fidelity condition)
Phone
6.36 (0.70)
0.72 (0.22)
0.23 (0.05)
0.08 (0.05)
2.77 (1.14)
Normal
5.32 (1.09)
1.18 (0.28)
1.52 (0.13)
1.90 (2.3 1)
0.26 (0.08)
0.80 (0.19)
Phone
5.25 (1.70)
2.80 (2.62)
0.45 (0.15)
0.11 (0.06)
3.40 (1.40)
1.26 (0.3 1)
0.76 (0.71)
0.14 (0.16)
2.44 (1.43)
I
1.16 (0.60)
0.31 (0.1 1)
1.44 (1.67)
0.76
0.88 (0.2 1)
1.87 (2.26)
0.22 (0.28)
8.18 (4.46)
0.58
0.19
0.34
0.74
0.43 (0.09)
2.71 (3.33)
0.48
0.45
4.0 DISCUSSION
The simulated car-phone dialing task reduced driving precision both on the road and in the simulator. Subjects over 60 years of age showed larger performance decrements during the phone task than did subjects 20 to 30 years of age. The simulator demonstrated good absolute validity for measures of speed control, and good relative validity for the effects of the phone task and age on driving precision.
4.1 LANE KEEPING
Measures of lane-keeping performance showed that subjects drove with greater precision in the car than in the simulator. This finding is consistent with other assessments of fixed-based simulator validity (McRuer and Klein, 1975; Blaauw, 1980). Both the driver's input to the vehicle (steering-wheel position) and the system output (lane position) showed larger variance in the simulator. The standard deviation of lane position in normal driving was about twice as large, on average, in the simulator (1.18 ft vs. 0.54 ft). Other measures of lane keeping showed similar trends. Both on the road and in the simulator, measures of lane-keeping performance showed highly significant effects of the phone task. In the simulator, however, these effects were of considerably larger magnitude. The addition of the phone task increased the mean lateral speed in the car by about 43 percent, while in the simulator the mean lateral speed increased by 158 percent with the addition of the phone task. Age effects on lane keeping were also significant in both the car and the simulator, with much larger effects noted in the simulator. Older subjects demonstrated a significantly larger performance decrement associated with the concurrent phone task in both the simulator and the car than did the younger subjects, consistent with other research on age effects in driving (Ponds, Brouwer, and van Wolffelaar, 1988). The difference between age groups was larger in the simulator than on the road. While the larger absolute change in the mean lateral speed in the simulator due to task loading indicates poor absolute validity, this aspect of performance in the simulator may make simulator studies more sensitive for detecting conditions of high driver workload than on-road studies.
4.2 SPEED CONTROL
Measures of speed control were comparable between the car and simulator, although the variance in driver input (throttle position) was larger on the road than in the simulator. There were two important differences between the simulator and the car with regard to the speed-control task. In the car, speed was displayed on an analog gauge, while the speed display was a digital LED panel in the simulator. Also, in the car, external disturbances due to wind disturbances and road irregularities increased the difficulty of the speed-control task, while these disturbances were not present in the simulator. The digital speedometer may have prompted subjects to be more precise in their judgment of speed, i.e., to produce exactly 60 milhr on the digital display as opposed to approximately 60 milhr on the analog gauge. Further, the lack of speed signal noise in the simulated system made it relatively easy for subjects to select a fixed pedal position that would maintain a constant speed for several minutes. This reduced the need to make throttle corrections, accounting for the smaller frequency of throttle reversals in the simulator. In both the car and the simulator, the standard deviation of throttle position was sensitive to the phone task, while the frequency of throttle reversals was not.
One hypothesis is that the visual and cognitive requirements of the phone task altered the visual scanning patterns that monitor speed. Since most scans of the speedometer do not prompt a speed correction, reducing the number of scans did not significantly change the frequency of throttle corrections. However, because the number of scans was reduced, or their frequency altered compared to normal driving, speed errors requiring correction that were detected were likely to be larger, and hence the corrective throttle motions were likely to be larger. Since the speed is visually sampled and corrections are issued at fairly long intervals during performance of the phone task, the speed is likely to oscillate more widely than during normal driving, when near-continuous control can be used to reduce errors when they are detected.
4.3 ASSESSMENT OF SIMULATOR VALIDITY
The driving simulator measures of speed control showed good absolute validity, consistent with Blaauw (1980), who found that a fixed-base driving simulator produced similar longitudinal speed variance to an instrumented vehicle. The lane-keeping measures were of more interest, because a number of studies have shown that performance of the lane-keeping task is sensitive to the driver's workload (Zwahlen, Adams, and Schwartz, 1988; MacAdam, 1992; Alm and Nilsson, 1994). Lane keeping was considerably less precise in the simulator, as expected, indicating poor absolute validity. However, the purpose of the simulator in many human factors studies is to detect differences in performance produced by changes in the subject's capabilities (e.g., under the influence of alcohol) or differences in side-task loading (e.g., use of an in- vehicle route-guidance system). Blaauw (1980) showed that a fixed-base simulator could differentiate between inexperienced and experienced drivers with greater sensitivity than an on-road test. In the current study, one between-subjects effect (Age) and one within- subject effect (phone task vs. normal driving) were significant in both the simulator and on-road data, but were more pronounced in the simulator. The high correlations for lane- keeping measures showed that subjects who performed well on the road also generally performed well in the simulator.
A number of investigators have identified the lack of vestibular and tactile feedback as the reason for poor absolute validity for lane keeping in fixed-base simulators (McRuer and Klein, 1975; McLane and Wierwille, 1975). With the current simulator configuration, the subject has only auditory cues concerning lane position (on-road vs. off-road) when visual feedback is interrupted, such as during performance of a visually demanding side task. In the actual vehicle, the subject experiences accelerations that give feedback on the movement of the vehicle and the location on the road.
During normal driving (without a side task), the visual feedback is essentially continuous and the simulator-driving performance measures are reasonably close to those measured in the car. When a visually demanding side task is introduced, however, the visual feedback is sampled rather than continuous (or rapidly sampled), and driving precision deteriorates considerably more in the simulator than on the road. The steering-wheel movements demonstrate a difference in control tactics. During performance of the phone task in the simulator, the steering reversal frequency increased slightly (about 30 percent), but the standard deviation of the steering-wheel angle increased by about 235 percent. On the road, the increases in the frequency of corrections and the standard deviation of steering-wheel angle are about the same (38 percent). This means that the subjects, on average, made slightly more frequent, but much larger, steering corrections during performance of the phone task than they did when driving the simulator without a side task. Subjects who performed well in the simulator with the phone task usually adopted a very rapid scanning procedure, glancing quickly from the number card to the handset to
the visual scene and back. The more successful subjects glanced only rarely at the visual display of the dialed digits.
In the simulator, the lack of vestibular cues and the absence of danger associated with lane-keeping errors contributed to larger lane-keeping errors prior to the initiation of steering corrections than were observed on the road. But the absence of these feedback modalities also resulted in a reduced ability of the subjects to select an appropriate steering correction, even in closed-loop (continuous visual feedback) mode. Subjects were frequently observed to correct a lane-edge exceedance in the simulator with a large, rapid steering-wheel motion that would have produced tire squeal, high lateral acceleration and body roll, and possibly a loss of control on the road. The acceleration cues in actual driving probably act to modulate steering correction magnitudes, thereby increasing the stability of the driver-vehicle tracking system. In the absence of these cues, subjects were observed to produce large-magnitude yaw oscillations when recovering from a large lane-keeping error, in a manner similar to the loss of control of an actual vehicle in slippery road conditions.
The visual scene generator does not simulate pitch and roll of the vehicle, further reducing the feedback that is normally available to the driver during a rapid steering movement. However, the absence of these motions in the visual scene may have contributed to the low incidence of simulator sickness in this study. Only one subject complained briefly of discomfort, which subsided after the subject learned to control the simulator using smaller steering motions. All other subjects were able to complete the 40-minute simulator testing session without reporting discomfort.
The results of this study suggest that the UMTRI simulator is a useful tool for automotive human factors studies. Although the absolute values of driving performance measures are different in the simulator and on the road, driving performance in the simulator has been shown to be sensitive to both a within-subject factor (concurrent phone task) and a between-subjects factor (driver age) in a manner consistent with the on-road findings. The greater sensitivity to these factors in the simulator may allow preliminary studies to be conducted in the simulator with fewer subjects than would be necessary on the road. There are a number of research applications for which the simulator will be useful:
1. Assessment of the effects of medical conditions on driving. There is considerable interest in assessing the effects of conditions such as Alzheimer's disease, stroke, and CNS trauma on driving performance and accident risk. The evidence from the current study suggests that performance in the driving simulator will be a good indicator of the trends in on-road driving precision between two groups of subjects, e.g., patients and controls. The driving simulator has not yet been shown to produce valid results for conditions other than normal driving (e.g., low visibility conditions or emergency situations), but the insight gained from studying the effects of disease or trauma on normal driving performance might allow improved assessments of the increased accident risk associated with medical conditions.
2. Assessment of the effects of new in-vehicle devices. The simulator has been shown to produce driving performance measures with good relative validity with a visually demanding side task. This suggests that the simulator can be used to assess the relative performance degradations that would be associated with alternative interface designs for in-vehicle driver aids, for example. The data from the present study suggest that differences in multi-task performance ability between subject groups that would be significant on-road would produce even larger effects in the simulator.
Studies of driver workload. The relative validity of the simulator for detecting decrements in driving precision as a result of concurrent side performance suggests that the simulator might be used in more general studies of driver workload. Although much of the performance decrement associated with cellular phone dialing is probably due to the visual demands of the task, cognitive workload may also produce performance decrements that would be detected in the simulator as well as on the road. One advantage of the simulator is that the primary task difficulty (lane tracking) can be manipulated more readily in the simulator than on the road.
4.4 SIMULATOR IMPROVEMENTS
These findings suggest a number of steps that might be taken to improve the correspondence between car and simulator performance measures for straight-line driving with visually demanding side tasks.
1. Facilitate detection of lane-keeping errors
One difference between simulator and on-road performance is that subjects allowed larger lane-keeping errors to accrue in the simulator before taking corrective action. One reason could be that the physical danger associated with errors on the road increased the motivation to detect and correct errors. Another possibility is that acceleration cues are used in the on-road environment to determine when the visual scene should be sampled, and, absent these cues, the visual scene is not sampled as frequently, or with appropriate timing. One way to improve the performance of the subjects in a fixed-base simulator might be to augment the available feedback to improve detection of lane-keeping errors. Tactile cues presented through the steering wheel (simulating the jerk felt while the tire moves from pavement to the shoulder) might prompt the subject to glance at the road when the lane error exceeds a certain level. Such cues probably influence on-road scanning patterns, since gusts of wind, changes in the crown of the road, and other external influences on the path of the vehicle are readily felt through the steering of most cars.
The addition of lateral disturbances ("wind gusts") may also improve the detection of lane-keeping errors by increasing the difficulty of the straight-line tracking task, thereby increasing the rate at which uncertainty about the vehicle's position accrues during glances away from the road scene (Wierwille, 1974). Senders, Kristofferson, Levison, Dietrich, and Ward (1967) have proposed an information-based model of visual scanning in driving in which the frequency of road scene scans is related to the driver's uncertainty about the road and vehicle position. In this study, no lateral disturbances were applied to the simulated vehicle. This lack of noise in the lateral control system probably reduced the rate at which uncertainty concerning the position of the simulated vehicle on the road accrued during a glance away from the road scene. Adding lateral disturbances might reduce the absolute validity of the simulator during normal driving by increasing lane tracking error, but might improve the relative validity during concurrent side task performance by inducing the subjects to glance at the road scene more frequently.
2. Improve the controllability of the system during recovery from lane-keeping errors
One of the factors contributing to the poor absolute validity of the simulator lane- keeping measures was that many subjects initiated unrealistically large and fast steering-wheel motions when a lane-keeping error was detected. Changes in the simulated vehicle dynamics and augmentation of the steering feel might help to improve performance during these maneuvers. In particular, reducing the yaw inertia of the simulated vehicle might help to reduce the tendency of the subjects to overcorrect their yaw errors. Similarly, the steering system itself might be programmed to have substantial resistance to large-magnitude, high-frequency movements, reducing the possibility that the subjects will begin an unstable correction pattern. Leonard and Wierwille (1975) have suggested selecting simulator dynamics to obtain improved correspondence with on-road performance in preference to matching the dynamics of the actual vehicle. The recent addition of a computer-controlled torque motor to the UMTRI simulator steering system will allow experiments with augmented tactile feedback. Another benefit of changes that restrict rapid steering movements is that they may reduce the incidence of motion sickness, which often occurs as a result of repeated, large amplitude oscillations of the forward scene.
3. Improve the realism of the longitudinal control simulation
Although the absolute validity of the simulator was better for speed control than for lane keeping, some improvements could be made. In particular, the addition of random variations to the vehicle drag would improve the correspondence between the car and simulator for measures of the variance in throttle position and speed. Without this noise, subjects are able to lock in the desired speed with a particular pedal position, and can maintain that speed without scanning the speed display for a period of minutes. Because speed errors are probably detected primarily by visual scanning of the speedometer, the lack of vestibular and tactile feedback may not hamper improved absolute validity for speed control.
4.5 CONCLUSIONS
The UMTRI low-cost, fixed-base simulator demonstrated good relative validity for assessing decrements in driving performance associated with dialing a car phone. Driving performance was less precise in the simulator than on the road, particularly for lane keeping. Older drivers showed larger performance decrements than younger subjects under phone-task conditions, both in the simulator and on the road. For normal driving conditions, two visual scene fidelity levels did not produce important differences in driving performance.
5.0 REFERENCES
Aaronson, D., and Eberhard, J. (1994). An evaluation of computer-based driving systems for research, assessment, and advisement. Behavior Research Methods, Instruments, and Computers, 26(2), 195- 197.
Alicandri, E., Roberts, K,, and Walker, J. (1986). A Validation Study of the DOT/FHWA Highway Simulator (HYSIM). Report No. PB86-211778. U.S. Department of Transportation, Federal Highway Administration, Washington, District of Columbia.
Alm, H., and Nilsson, L. (1994). Changes in driver behaviour as a function of handsfree mobile phones- a simulator study. Accident Analysis and Prevention, 26(4), 44 1-45 1.
Bertollini, G. P., Johnston, C. M., Kuiper, J. W., Kukula, J. C., Kulczycka, M. A,, and Thomas, W. E. (1994). The General Motors Driving Simulator. SAE Technical Paper No. 940179. Society of Automotive Engineers, Warrendale, Pennsylvania.
Blaauw, G. J. (1980). Driving Experience and Task Demands in Simulator and Instrumented Car: A Validation Study. Progress Report II. Report No. IZF 1980-9. Institute for Perception TNO, The Netherlands.
Blaauw, G. J. (1982). Driving experience and task demands in simulator and instrumented car: A validation study. Human Factors, 24(4), 473-486.
Freeman, J. S. (1994). The Iowa driving simulator: a tool for human factors and vehicle virtual prototyping research. Heavy Vehicle Systems, International Journal of Vehicle Design, 1 (2), 223-229.
Gawron, V. J., and Ranney, T. A. (1988). The effects of alcohol dosing on driving performance on a closed course and in a driving simulator. Ergonomics, 31(9), 1219- 1244.
Godthelp, H., Milgram, P., and Blaauw, G. J. (1984). The development of a time-related measure to describe driving strategy. Human Factors, 26(3), 257-268.
Green, P. (1993). Tools and methods for developing easy to use driver information systems. In Concurrent Engineering Tools and Technologies for Mechanical System Design, pp. 959-970. Edited by E.J. Haug. Springer-Verlag, Berlin, Germany.
Green, P. (1995). Automotive techniques. In Research Techniques in Human Engineering, 2nd ed. Edited by J . Weimer. Prentice-Hall, New York City, New York.
Green, P., Hoekstra, E., and Williams, M. (1993). On-the-Road Tests of Driver Intellfaces: Examination of a Route Guidance System and a Car Phone. Technical Report UMTRI-93-53. University of Michigan Transportation Research Institute, Ann Arbor, Michigan.
Green, P., Lin, B., and Bagian, T. (1993). Driver Workload as a Function of Road Geometry: A Pilot Experiment. Technical Report UMTRI-93-39. University of Michigan Transportation Research Institute, Ann Arbor, Michigan.
Kames, A.J. (1978). A study of the effects of mobile telephone use and control unit design on driving performance. IEEE Transactions on Vehicular Technology, VT- 27(4), 282-287.
Katz, S., Green, P. , and Fleming, J. (1995, in preparation). Calibration and Baseline Driving Data for the UMTRI Driver Interface Research Vehicle. Technical Report UMTRI-95-2. University of Michigan Transportation Research Institute, Ann Arbor, Michigan.
Leonard, J. J., and Wierwille, W. (1975). Human performance validation of simulators; theory and experimental verification. Proceedings of the 19th Annual Meeting Human Factors Society, pp. 446-456. Human Factors Society, Santa Monica, California.
Lincke, W., Richter, B., and Schmidt, R. (1973). Simulation and Measurement of Driver Vehicle Handling Performance. SAE Technical Paper No. 730489. Society of Automotive Engineers, Warrendale, Pennsylvania.
MacAdam, C. C. (1992). Truck Driver Informational Overload. Technical Report UMTRI-92-36. University of Michigan Transportation Research Institute, Ann Arbor, Michigan.
MacAdam, C.C., Green, P.A., and Reed, M.P. (1993). An overview of current UMTRI driving simulators, UMTRI Research Review, 24(1), 1-8.
McLane, R. C., and Wierwille, W.W. (1975). The influence of motion and audio cues on driver performance in an automobile simulator. Human Factors, 17(5), 488-501.
McRuer, D. T., and Klein, R. H. (1975). Comparison of Driver Dynamics with Actual and Simulated Visual Displays. Paper No. 173. Systems Technology, Inc., Hawthorne, California.
Ponds, R. W. H., Brouwer, W. H., and van Wolffelaar, P. C. (1988). Age differences in divided attention in a simulated driving task. Journal of Gerentology, 43(6), 15 1-156.
Reed, M.P., Schneider, L.W., and Eby, B.A. (1995). Some effects of lumbar support contour on driver seated posture. SAE Technical Paper No. 950 14 1. In Human Factors in Vehicle Design (SP-1088), pp. 9-20. Society of Automotive Engineers, Wanendale, Pennsylvania.
Repa, B. S., Alexandridis, A. A,, Howell, L. J., and Wierwille, W. W. (1977). The Influence of Vehicle Characteristics on Driver-Vehicle Performance in Simulated and Actual Driving. Research Publication GMR-25 10. General Motors Corportation, Warren, Michigan.
Roehrs, T., Beare, D., Zorick, F., and Roth, T. (1994). Sleepiness and ethanol effects on simulated driving. Alcoholism: Clinical and Experimental Research, 18(1), 154- 158.
Senders, J, W., Kristofferson, A. B., Levison, W. H., Dietrich, C. W., and Ward, J. L. (1967). The Attentional Demand of Automobile Driving. Bolt Beranek and Newman, Inc., Cambridge, Massachusetts.
Serafin, C., Wen, C., Paelke, G., and Green, P. (1993a). Development and Human Factors Tests of Car Phones. Technical Report UMTRI-93-17. University of Michigan Transportation Research Institute, Ann Arbor, Michigan.
Serafin, C., Wen, C., Paelke, G., and Green, P. (1993b). Car phone usability: A human factors test, Proceedings of the Human Factors and Ergonomics Society 37th Annual Meeting, pp. 220-224. Human Factors and Ergonomics Society, Santa Monica, California.
Smith, V.J. (1978). What about the Customer? A Survey of Mobile Telephone Users. Presented at the 28th IEEE Vehicular Technology Conference, Denver, Colorado.
Stein, A. C., Allen, R. W., and Parseghian, Z. (1992). The use of low-cost driving simulation to detect impaired drivers. Proceedings of the IMAGE VI Conference, pp. 372-382. Scottsdale, Arizona.
Stein, A. C., Parseghian, Z., and Allen, R. W. (1987). A simulator study of the safety implications of cellular mobile phone use. Proceedings of the 31st Annual Conference of the American Association for Automotive Medicine, pp. 18 1-200. Des Plaines, ILL.
Sweet, R.E., and Green, P. (1993). UMTRI's instrumented car. UMTRI Research Review, 24(2):1-11.
Wierwille, W. W. (1974). Driving simulator design for realistic handling. Proceedings of the 3rd International Conference on Vehicle System Dynamics, pp. 186- 199. Amsterdam.
Wolfram, S. (1991). Mathematica. A System for Doing Mathematics by Computerr, 2nd ed. Addison Wesley, New York, New York.
Zwahlen, H. T., Adams, C. C., and Schwartz, P. J. (1988). Safety aspects of cellular telephones in automobiles. Proceedings of the 18th International Symposium on Automotive Technology and Automation. Florence, Italy.
APPENDIX A
Subject Consent Form
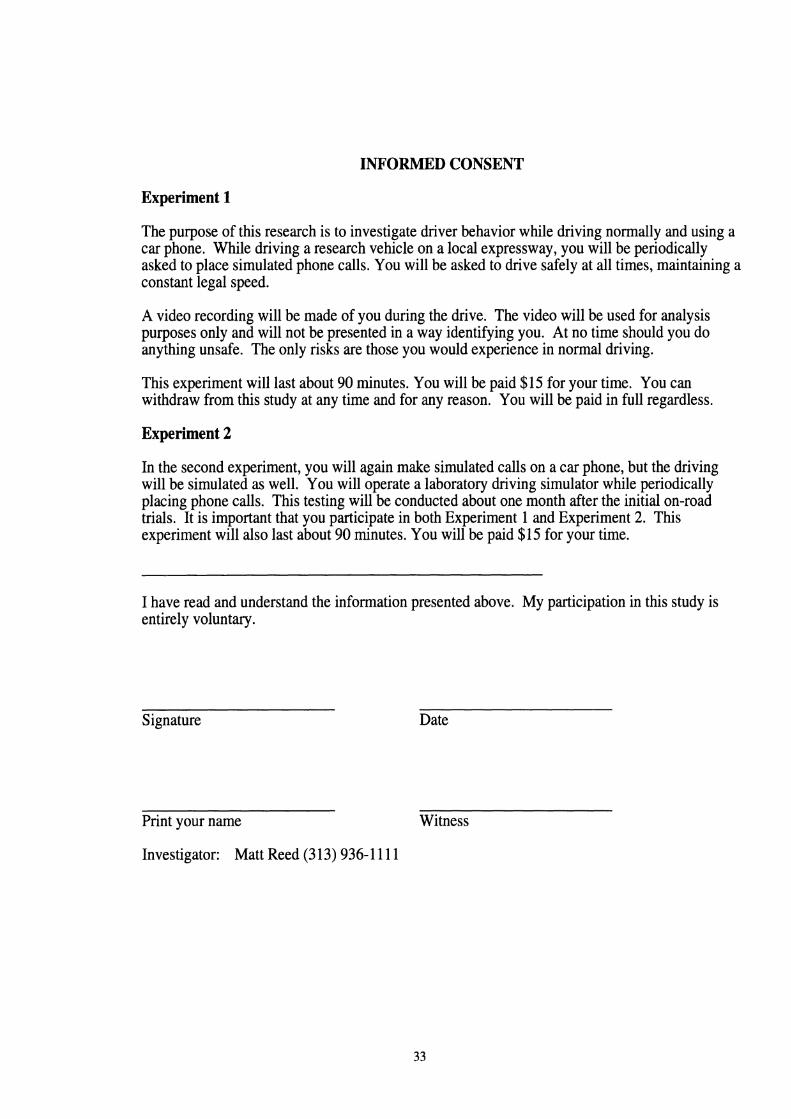
INFORMED CONSENT
Experiment 1
The purpose of this research is to investigate driver behavior while driving normally and using a car phone. While driving a research vehicle on a local expressway, you will be periodically asked to place simulated phone calls. You will be asked to drive safely at all times, maintaining a constant legal speed.
A video recording will be made of you during the drive. The video will be used for analysis purposes only and will not be presented in a way identifying you. At no time should you do anything unsafe. The only risks are those you would experience in normal driving.
This experiment will last about 90 minutes. You will be paid $15 for your time. You can withdraw from this study at any time and for any reason. You will be paid in full regardless.
Experiment 2
In the second experiment, you will again make simulated calls on a car phone, but the driving will be simulated as well. You will operate a laboratory driving simulator while periodically placing phone calls. This testing will be conducted about one month after the initial on-road trials. It is important that you participate in both Experiment 1 and Experiment 2. This experiment will also last about 90 minutes. You will be paid $15 for your time.
I have read and understand the information presented above. My participation in this study is entirely voluntary.
Signature Date
Print your name Witness
Investigator: Matt Reed (3 13) 936- 1 1 1 1
APPENDIX B
Biographical Form
BIOGRAPHICAL FORM Subject # Date Time
Name:
Address:
Phone #:
Circle one: Male Female Age:
Occupation: (RetiredIStudents: note former occupation or scholastic major)
Education (highest level completed)
What kind of car do you drive the most:
Year Manufacturer Model
Approximate annual mileage
Do you have a phone in your car?
Have you ever used a car phone?
If yes, how many times?
Do you wear glasses or contact lenses when you drive (indicate)
I*****************
Experimenter Use
Vision
Informed Consent
*********I********
1 2 3 4 5 6 7 8 9 1 0 1 1 1 2 1 3 1 4 T R R L T B L R L B R B T R