EUR 23559 EN - 2008 Validation of an Analytical Method to Determine the Content of T-2 and HT-2 Toxins in Cereals and Baby Food by Immunoaffinity Column Clean-up and GC-MS RESULTS OF THE COLLABORATIVE STUDY A. BREIDBACH, V. POVILAITYTE, C. MISCHKE, I. DONCHEVA, H. van EGMOND, J. STROKA
Transcript
EUR 23559 EN - 2008
Validation of an Analytical Method toDetermine the Content of T-2 and HT-2
Toxins in Cereals and Baby Foodby Immunoaffinity Column
Clean-up and GC-MS
RESULTS OF THE COLLABORATIVE STUDY
A. BREIDBACH, V. POVILAITYTE, C. MISCHKE, I. DONCHEVA, H. van EGMOND, J. STROKA
The mission of the IRMM is to promote a common and reliable European measurement system in support of EU policies. European Commission Joint Research Centre Institute for Reference Materials and Measurements Contact information Address: Retieseweg 111, 2440 Geel, Belgium E-mail: [email protected] Tel.: +32 14 571 205 Fax: +32 14 571 783 http://irmm.jrc.ec.europa.eu/ http://www.jrc.ec.europa.eu/ Legal Notice Neither the European Commission nor any person acting on behalf of the Commission is responsible for the use which might be made of this publication.
Europe Direct is a service to help you find answers to your questions about the European Union
Freephone number (*):
00 800 6 7 8 9 10 11
(*) Certain mobile telephone operators do not allow access to 00 800 numbers or these calls may be billed.
Determine the Content of T-2 and HT-2 toxins in Cereals and Baby Food
by
Immunoaffinity Column Clean-up and GC-MS
RESULTS OF THE COLLABORATIVE STUDY
A. BREIDBACH1, V. POVILAITYTE1, C. MISCHKE1, I. DONCHEVA1, H. van EGMOND2, J. STROKA1
1European Commission, Joint Research Centre, Institute for Reference Materials and Measurements, Geel, Belgium 2 National Institute for Public Health & the Environment, Bilthoven, the Netherlands
2
Contents
Section Page
Abstract............................................................................................................................3 Introduction .....................................................................................................................4 Materials and methods.....................................................................................................5 Test materials for the collaborative study........................................................................5 Homogeneity of the Test Materials and In-House Method Performance........................6 Statistical evaluation:.......................................................................................................8 Design of the collaborative study ....................................................................................9 Results of the collaborative study and Discussion ........................................................12 Conclusions ...................................................................................................................24 References: ....................................................................................................................25 Annex I –VI ...................................................................................................................27
3
Abstract
A method for the determination of T-2 toxin and HT-2 toxin in cereals and baby food
was validated by collaborative study.
In short, the method is as follows: A test portion of a sample is extracted with a
mixture of methanol/water (80/20, v/v). This raw extract is then diluted, filtered, and
applied to an immunoaffinity column. After washing and elution with acetonitrile the
eluate is evaporated to dryness. T-2 and HT-2 toxins in the dry residue are then
derivatised with N-methyl-N-trimethylsilyl-trifluoroacetamid (MSTFA)/
trimethylchlorosilane (TMCS) (99/1, v/v), injected into a gas chromatograph, and
detected and quantified by mass spectrometry.
Fourteen laboratories from ten different countries were selected to participate in
the collaborative study. They received six different test materials as blind duplicates.
The test materials consisted of a blank cereal mix, two cereal mixes naturally
contaminated at different levels, a blank baby food, and two baby foods naturally
contaminated at different levels. Furthermore, two blank cereal mixes and two blank
baby foods together with specific spiking solutions were provided for recovery
determination. The sum of the mass fractions of T-2 & HT-2 after spiking were 50
µg/kg in the cereal mix, and 25 µg/kg in the baby food.
Reported recoveries in the baby food ranged from 83 to 130% with 102% for
the mean value. The RSDR values were 25% at a natural contamination level of ca. 10
µg/kg, 17% at ca. 23 µg/kg, and 14% for the spiked material at 25 µg/kg. The Horwitz
ratios (HorRat) ranged from 0.6 to 1.1. For the cereal mix recovery values ranged
from 84 to 115% for the sum of T-2 & HT-2 with a mean value of 99%.
Reproducibility relative standard deviations (RSDR) for the cereal matrix were 17% at
a natural contamination level of ca. 32 µg/kg, 13% at ca. 77 µg/kg, and 10% for the
spiked material at 50 µg/kg.
Since all these performance parameters lie well within the acceptable ranges set
forth in European legislation [1] this method is suited for official food control.
4
Introduction
The A-type trichothecenes T-2 toxin (4β,15-Diacetoxy-3α-hydroxy-8α-(3-
methylbutyryloxy)-12,13-epoxytrichothec-9-ene, CAS No: 21259-20-1) and HT-2
food medium 24.2 6 20 0.79 1- Homogeneity of the cereal materials was tested with an early version of the proposed method without internal
standard, VICAM IAC columns , and Tri-SIL-TBT as derivatization reagent
Table 4: Results of the recovery experiments, showing the added and the determined mass fractions of the respective toxins in µg/kg, the recovery in per cent, and the number of measurements
Toxin Material Added Determined % N
Cereal 17 17.7 104 4 T-2
Baby food 8 8.2 103 4
Cereal 33 37.7 114 4 HT-2
Baby food 17 23.2 136 4
Cereal 50 55.5 111 4 Sum T-2/HT-2 Baby
food 25 31.4 126 4
Statistical evaluation
Calculations of the precision parameters were done according to Youden & Steiner[8]
and are detailed below:
The square root of the within-laboratory mean sum-of-squares (MS0) was taken
as estimate of the repeatability standard deviation.
0MSsr = (1)
9
The laboratory related variance was calculated as the difference of the between-
laboratory mean sum-of-squares (MSL) and MS0 divided by the number of replications
per laboratory (n=2).
nMSMS
s LL
02 −= (2)
Finally the reproducibility standard deviation was calculated from the residual
and the laboratory variances.
22rLR sss += (3)
Relative standard deviations (RSD) were calculated as standard deviation times
100 divided by the mean value:
xsRSD 100*
= (4)
Repeatability and reproducibility were calculated by multiplying the respective
standard deviation with 2.8 with gives roughly a 95% confidence at two replications:
rsr *8.2= (5)
RsR *8.2= (6)
The precision parameters were calculated using the EXCEL macro
CLSTD.XLT (V3.6) [9].
Based on ISO guide 11843 Part 2 calibration functions for data with non-
constant variance were calculated with iteratively re-weighted least square. The
formulas were extended to calibration functions including a 2nd degree term. Minimum
detectable levels (MDL) were then calculated from the estimated calibration and
variance functions.
Design of the collaborative study
The design was based on the "Guidelines for Collaborative Study Procedures to
Validate Characteristics of a Method of Analysis" [10].
The participants were selected from a list of interested parties and a total of 14
laboratories from ten different countries were chosen to participate in this collaborative
trial (Figure1).
10
A
CZ
D
EE
F
GR
I
NL
P
UK
Figure 1: Distribution of the selected participants by country for the inter-laboratory comparison.
The participants represented governmental (57%), industrial (36%), and
academic (7%) food control laboratories. Among these were three National Reference
Laboratories (NRL) for Mycotoxins appointed by European Union Member States.
All participants received cereal and baby food samples. One selected
laboratory returned the samples because of unavailability of a GC/MS system, 2
selected laboratories received samples but never reported, and one selected laboratory
reported results with the remark that their instrument was not working properly.
Subsequently that laboratory was excluded from the evaluation. Table 5 lists the
names and addresses of the laboratories which reported results and were included in
the evaluation.
Table 5: List of participating laboratories in alphabetical order
Participant Institution Address
Wolfgang Brodacz
AGES Austrian Agency for Health and Food Safety - Österreichische Agentur für Gesundheit und Ernährungssicherheit GmbH Competence centre "Cluster Chemistry Linz"
Wieningerstraße 8, A-4021 Linz, Austria
Michel Cam CAPINOV ZI de Lanrinou, 29206 Landerneau, France
Jürgen Danier
Technische Universität München (TUM), Zentralinstitut für Ernährungs- und
Legend: Mean –mean mass fraction [µg/kg] or mean percentage; N – number of labs; nc – non-compliant laboratories; outl. – outlying laboratories; n – number of laboratories used for statistics; r – repeatability [µg/kg], sr – repeatability standard deviation [µg/kg], RSDr – relative standard deviation under repeatability conditions [%]; R, sR, RSDR– the respective values for reproducibility, HoRmod – the HorRat value for reproducibility modified after Thompson [11]
Since for recovery determination the blank material was spiked the reported
values for the spike have been corrected for the values reported in the blank material.
The resulting mean apparent recovery is then 102 % for baby food which is statistically
not different from 100 %. The modified Horwitz ratios of 0.8 and 1.1 for the low and
medium contaminated materials, respectively, demonstrate acceptable performance.
The apparent recovery and the values for the relative standard deviations of
repeatability and reproducibility are well below the limits set forth in [1].
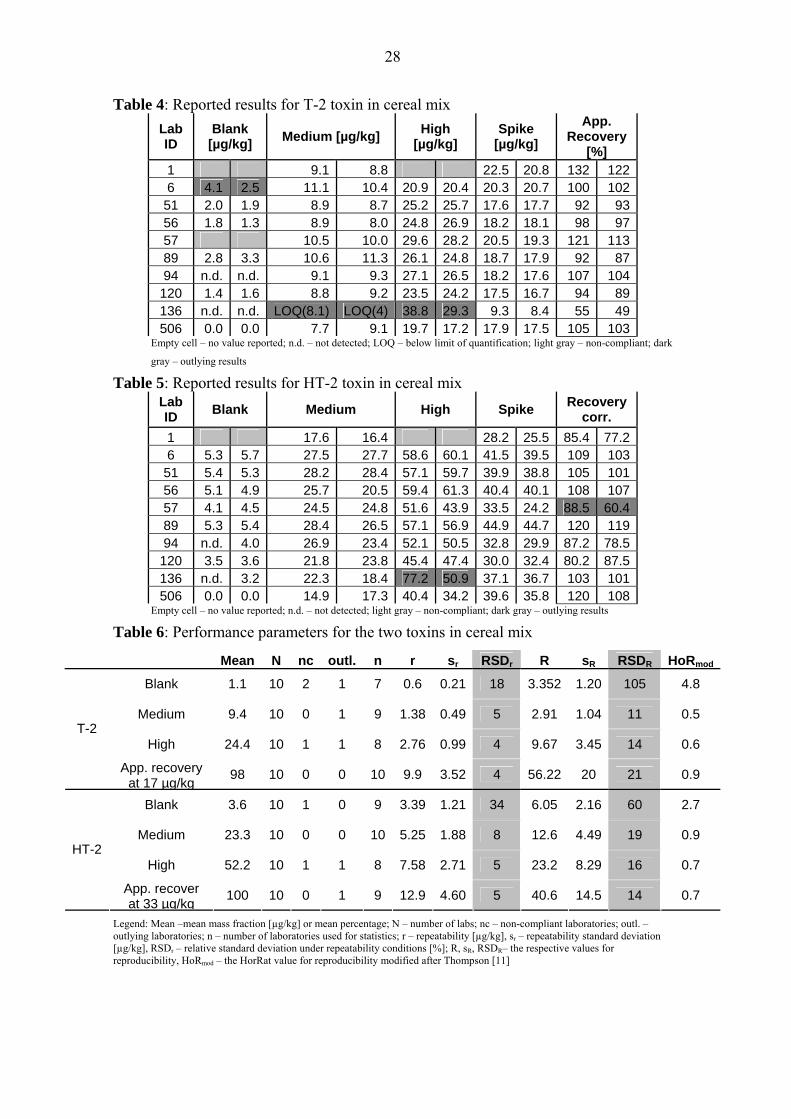
Cereals
All the results for the cereal mix are listed in Table 8 for which the same
conventions apply as for Table 6.
Table 8: Sum parameter (T-2 & HT-2 toxin) in cereal mix Lab ID
Legend: Mean –mean mass fraction [µg/kg] or mean percentage; N – number of labs; nc – non-compliant laboratories; outl. – outlying laboratories; n – number of laboratories used for statistics; r – repeatability [µg/kg], sr – repeatability standard deviation [µg/kg], RSDr – relative standard deviation under repeatability conditions [%]; R, sR, RSDR– the respective values for reproducibility, HoRmod – the HorRat value for reproducibility modified after Thompson [11]
Table 9 lists the performance parameters of the tested method for the cereal mix.
Again, as for the baby food blank material, the mean of the reported results indicates a
contamination of 4.9 µg/kg with an associated relative reproducibility standard
deviation of 71 %. This means no reliable quantification is possible at this
contamination level. The mean apparent recovery after correction for the blank results
is 99 % (no statistical difference to 100%). The performance for the medium and
highly contaminated materials is acceptable (HoRmod 0.8 and 0.6, respectively) and
together with the apparent recovery within the limits set forth in [1].
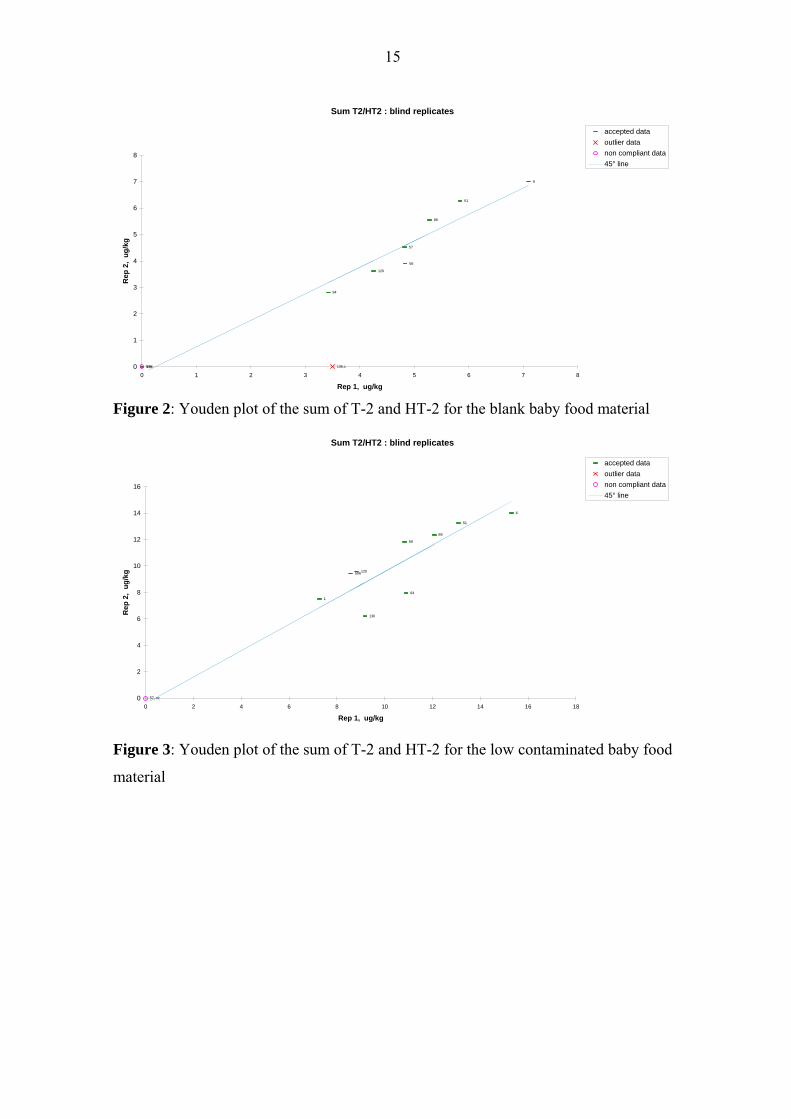
Graphical representations
When plotting the first replicate result of a laboratory versus the second so called
Youden plots are created. They display in one glance repeatability (closeness of points
to the identity line) and reproducibility (tightness of the cloud of points). Figures 2 to
5 show the Youden plots for the sum of T-2 and HT-2 for the blank, the two naturally
contaminated, and the spiked baby food material, respectively. For the blank, the two
naturally contaminated, and the spiked cereal mix figures 6 to 9 show the respective
Youden plots. The plots for the individual toxins can be found in Annex II.
Mean & range plots are a second way of displaying the data. Here the mean
value for each laboratory and its range are plotted compared to the overall mean value.
This kind of plot allows the quick identification of an individual laboratory's bias
compared to the overall mean value. Figures 10 to 13 show the mean & range plots for
the sum of T-2 and HT-2 for the baby food materials, and figures 14 to 17 for the
cereal mix materials. The plots for the individual toxins can be found in Annex II.
15
Sum T2/HT2 : blind replicates
6
51
56
57
89
94
120
506 136,c1,nc0
1
2
3
4
5
6
7
8
0 1 2 3 4 5 6 7 8
Rep 1, ug/kg
Rep
2,
ug/k
gaccepted dataoutlier datanon compliant data45° line
Figure 2: Youden plot of the sum of T-2 and HT-2 for the blank baby food material
Sum T2/HT2 : blind replicates
1
6
51
56
89
94
120
136
506
57, nc0
2
4
6
8
10
12
14
16
0 2 4 6 8 10 12 14 16 18
Rep 1, ug/kg
Rep
2,
ug/k
g
accepted dataoutlier datanon compliant data45° line
Figure 3: Youden plot of the sum of T-2 and HT-2 for the low contaminated baby food
material
16
Sum T2/HT2 : blind replicates
1
6
5156
89
94120
136
506
57, nc
0
5
10
15
20
25
30
35
0 5 10 15 20 25 30 35
Rep 1, ug/kg
Rep
2,
ug/k
gaccepted dataoutlier datanon compliant data45° line
Figure 4: Youden plot of the sum of T-2 and HT-2 for the medium contaminated baby
food material
Sum T2/HT2 : blind replicates
1
6
51
56
57
89
94
120
136
506
0
20
40
60
80
100
120
140
0 20 40 60 80 100 120 140
Rep 1, %
Rep
2,
%
accepted dataoutlier datanon compliant data45° line
Figure 5: Youden plot of the sum of T-2 and HT-2 for the recovery determination in
baby food material
17
Sum T2/HT2 : blind replicates
506
136
120
94
89
56
51
6
57, nc1, nc0
2
4
6
8
10
12
0 1 2 3 4 5 6 7 8 9 10
Rep 1, ug/kg
Rep
2,
ug/k
gaccepted dataoutlier datanon compliant data45° line
Figure 6: Youden plot of the sum of T-2 and HT-2 for the blank cereal mix material
Sum T2/HT2 : blind replicates
506
136
120 94
89
57
56
516
1
0
5
10
15
20
25
30
35
40
45
0 5 10 15 20 25 30 35 40 45
Rep 1, ug/kg
Rep
2,
ug/k
g
accepted dataoutlier datanon compliant data45° line
Figure 7: Youden plot of the sum of T-2 and HT-2 for the medium contaminated
cereal mix material
18
Sum T2/HT2 : blind replicates
506
120
94
89
57
5651
6 136, c
1, nc0
20
40
60
80
100
120
140
0 20 40 60 80 100 120 140
Rep 1, ug/kg
Rep
2,
ug/k
gaccepted dataoutlier datanon compliant data45° line
Figure 8: Youden plot of the sum of T-2 and HT-2 for the highly contaminated cereal
mix material
Sum T2/HT2 : blind replicates
1
6
51
56
89
94120
136
506
57, c
0
20
40
60
80
100
120
0 20 40 60 80 100 120 140
Rep 1, %
Rep
2,
%
accepted dataoutlier datanon compliant data45° line
Figure 9: Youden plot of the sum of T-2 and HT-2 for the recovery determination in
the cereal mix material
19
Sum T2/HT2 : blind replicates
6
51
56
57
89
94
120
5061,nc
136,c
1,nc0
1
2
3
4
5
6
7
8
laboratory number
lab.
mea
n an
d ra
nge,
ug/
kgaccepted dataoutlier datanon compliant dataoverall mean
Figure 10: Mean & range plots of the sum of T-2 and HT-2 for the blank baby food
material
Sum T2/HT2 : blind replicates
1
6
51
56
89
94120
136
506
57, nc57, nc0
2
4
6
8
10
12
14
16
18
laboratory number
lab.
mea
n an
d ra
nge,
ug/
kg
accepted dataoutlier datanon compliant dataoverall mean
Figure 11: Mean & range plots of the sum of T-2 and HT-2 for the low contaminated
baby food material
20
Sum T2/HT2 : blind replicates
1
6
51
56
89
94120
136
506
57, nc
0
5
10
15
20
25
30
35
laboratory number
lab.
mea
n an
d ra
nge,
ug/
kgaccepted dataoutlier datanon compliant dataoverall mean
Figure 12: Mean & range plots of the sum of T-2 and HT-2 for the medium
contaminated baby food material
Sum T2/HT2 : blind replicates
1
6
51
56
57
89
94 120
136
506
0
20
40
60
80
100
120
140
laboratory number
lab.
mea
n an
d ra
nge,
%
accepted dataoutlier datanon compliant dataoverall mean
Figure 13: Mean & range plots of the sum of T-2 and HT-2 for the recovery
determination in baby food material
21
Sum T2/HT2 : blind replicates
6
51
56
89
94
120
136
5061, nc 57, nc57, nc1, nc0
1
2
3
4
5
6
7
8
9
10
laboratory number
lab.
mea
n an
d ra
nge,
ug/
kgaccepted dataoutlier datanon compliant dataoverall mean
Figure 14: Mean & range plot of the sum of T-2 and HT-2 for the blank cereal mix
material
Sum T2/HT2 : blind replicates
1
6
51
56
57
89
94
120
136
506
0
5
10
15
20
25
30
35
40
45
laboratory number
lab.
mea
n an
d ra
nge,
ug/
kg
accepted dataoutlier datanon compliant dataoverall mean
Figure 15: Mean & range plot of the sum of T-2 and HT-2 for the medium
contaminated cereal mix material
22
Sum T2/HT2 : blind replicates
651
56
57
89
94
120
506
1, nc
136, c
1, nc0
20
40
60
80
100
120
140
laboratory number
lab.
mea
n an
d ra
nge,
ug/
kgaccepted dataoutlier datanon compliant dataoverall mean
Figure 16: Mean & range plot of the sum of T-2 and HT-2 for the highly contaminated
cereal mix material
Sum T2/HT2 : blind replicates
1
6
51
56
89
94
120 136
506
57, c
0
20
40
60
80
100
120
140
laboratory number
lab.
mea
n an
d ra
nge,
%
accepted dataoutlier datanon compliant dataoverall mean
Figure 17: Mean & range plot of the sum of T-2 and HT-2 for the recovery
determination in the cereal mix material
23
Comments from collaborative trial participants
The questionnaire, which was sent along with materials and reagents, was filled in and
returned by 9 laboratories. Below are some of the answers given:
The question whether there was a deviation from the protocol was answered
with Yes by five labs. One of those five labs was Laboratory 27 which did not have
any valid results. They have used a cool-on-column injector instead of the
recommended split/splitless injector. Another one was Laboratory 94 which used with
the Gerstel KAS system a non-standard split/splitless injector. But in this case there is
no indication of a negative influence on the results. The other three deviations
concerned the use of a different column, different temperature programs between the
first and second run, or the use of an initial full-scan measurement. Again, in these
cases no indication of a negative influence is recognized.
The questions whether there was familiarity with the procedures used in the
protocol and whether the method description was adequate were answered with Yes by
all 9 laboratories.
Criticism/ Suggestions were brought forward by six laboratories. Two remarks
concerned the ion m/z 185, which was supposed to be used for the calculation of ion
ratios. It was remarked that it is insufficiently specific which is correct if seen by
itself. The specificity is given by the combination with the two other ions per analyte.
Furthermore, there is a significant contribution of m/z 185 coming from the internal
standard which needs to be taken into account but which we failed to mention in the
method description. Laboratory 27 mentioned that they normally use Tri-Sil-TBT
derivatisation with subsequent partitioning between hexan and phosphate buffer. For
that procedure the cool-on-column injections in that laboratory seem to work. Other
remarks were the recommendation of a different column, lack of information on extract
stability, and the evaporation step not being optimized. One remark concerned the low
volume of the injection solution. We realize that the handling of such small volumes
needs practice, but we also see the small volume as the strength of the novel
derivatisation procedure since the low volume leads to higher analyte concentrations in
the injection solution.
24
Conclusions
The results of this collaborative trial show that immunoaffinity clean-up in
combination with GC/MS is a suitable procedure to determine the two type A
trichothecenes T-2 and HT-2 in cereal and baby food based matrices.
The novel trimethylsilylation reagent introduced in this trial works well if some
precautions are considered: the efficient handling of the small injection volumes need
some experience, the autosampler settings need to be adjusted such that no sample
washes are performed, and cool-on-column injection techniques might be deleterious
to successful separation and detection. We believe that the small injection solution
volume has helped considerably in achieving the reported precision parameters.
Since some of the labs have successfully used columns other than the
recommended one it can be concluded that this method is quite robust in that respect as
long as sufficient separation of the two analytes is achieved.
Recently a fully 13C labelled HT-2, analogue to the fully 13C labelled T-2 used
in this study, has become available. Its inclusion is strongly recommended.
The blank materials of baby food and cereal mix proved to be not blank but
contaminated at a very low level. But the levels reported by the laboratories varied
widely so that it must be said that determination at such a low concentration is not
possible with an acceptable level of reliability.
The results of this collaborative study show precision characteristics for the
sum of the concentrations of T-2 and HT-2 toxin which fulfil the criteria (RSDr, RSDR
and recovery) as set forth by European legislation [1] for all tested levels in both cereal
mix and baby food.
The JRC is currently transforming this method into CEN format and will
submit it to CEN TC 275/WG 5 for adoption.
25
References:
1. Regulation (EC) No 401/2006, E. Commission, Editor. 2006. 2. Gareis, M., et al., SCOOP TASK 3.2.10: Collection of occurence data of
fusarium toxins in food and assessment of dietary intake by the population of EU Member States. 2003, European Commission: Brussels, Belgium. p. 1-10.
3. Verstraete, F., Decision-making process and overview of recent and future European Union legislation on mycotoxins in food and feed, in The mycotoxin fact book, D. Barug, et al., Editors. 2006, Wageningen Academic Publishers: Wageningen. p. 51-79.
4. Biselli, S., et al., Analysis of Fusarium Toxins using LC/MS–MS: Application to Various Food and Feed Matrices. LC-GC Europe Special Edition: Recent Applications in LC-MS, 2004. 17(11a): p. 25-31.
5. Visconti, A., et al., Analysis of T-2 and HT-2 toxins in cereal grains by immunoaffinity clean-up and liquid chromatography with fluorescence detection. J Chromatogr A, 2005. 1075(1-2): p. 151-158.
6. Eskola, M., P. Parikka, and A. Rizzo, Trichothecenes, ochratoxin A and zearalenone contamination and Fusarium infection in Finnish cereal samples in 1998. Food Additives & Contaminants, 2001. 18(8): p. 707-718.
7. Jestoi, M., A. Ritieni, and A. Rizzo, Analysis of the Fusarium Mycotoxins Fusaproliferin and Trichothecenes in Grains Using Gas Chromatography-Mass Spectrometry. J Agric Food Chem, 2004. 52(6): p. 1464-1469.
8. Youden, W.J. and E.H. Steiner, Statistical manual of the AOAC. 1975: AOAC International.
9. Mathieson, K., CLSTD.XLT. 1998. p. Microsoft EXCEL template with macro collection.
10. Appendix D: Guidelines for Collaborative Study Procedures To Validate Characteristics of a method of Analysis, in J AOAC Int. 2002.
11. Thompson, M., Recent trends in inter-laboratory precision at ppb and sub-ppb concentrations in relation to fitness for purpose criteria in proficiency testing. Analyst, 2000. 125: p. 385-386.
26
27
Annex I Table 1: Reported results for T-2 toxin in baby food
Legend: Mean –mean mass fraction [µg/kg] or mean percentage; N – number of labs; nc – non-compliant laboratories; outl. – outlying laboratories; n – number of laboratories used for statistics; r – repeatability [µg/kg], sr – repeatability standard deviation [µg/kg], RSDr – relative standard deviation under repeatability conditions [%]; R, sR, RSDR– the respective values for reproducibility, HoRmod – the HorRat value for reproducibility modified after Thompson [11]
28
Table 4: Reported results for T-2 toxin in cereal mix Lab ID
Legend: Mean –mean mass fraction [µg/kg] or mean percentage; N – number of labs; nc – non-compliant laboratories; outl. – outlying laboratories; n – number of laboratories used for statistics; r – repeatability [µg/kg], sr – repeatability standard deviation [µg/kg], RSDr – relative standard deviation under repeatability conditions [%]; R, sR, RSDR– the respective values for reproducibility, HoRmod – the HorRat value for reproducibility modified after Thompson [11]
29
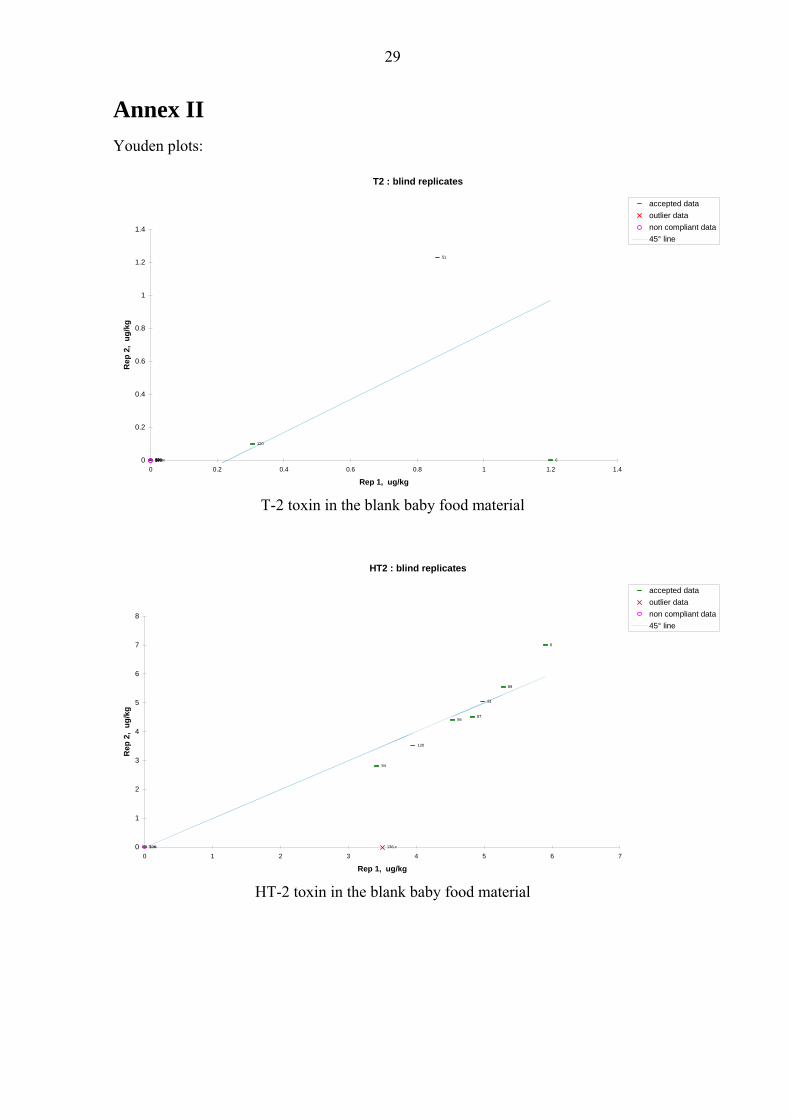
Annex II Youden plots:
T2 : blind replicates
6
51
8994
120
1365061,nc57,nc0
0.2
0.4
0.6
0.8
1
1.2
1.4
0 0.2 0.4 0.6 0.8 1 1.2 1.4
Rep 1, ug/kg
Rep
2,
ug/k
g
accepted dataoutlier datanon compliant data45° line
T-2 toxin in the blank baby food material
HT2 : blind replicates
6
51
5657
89
94
120
506 136,c1,nc0
1
2
3
4
5
6
7
8
0 1 2 3 4 5 6 7
Rep 1, ug/kg
Rep
2,
ug/k
g
accepted dataoutlier datanon compliant data45° line
HT-2 toxin in the blank baby food material
30
T2 : blind replicates
1 6
51
56
89
120
136
506
94, c
57, nc0
0.5
1
1.5
2
2.5
3
3.5
4
4.5
0 0.5 1 1.5 2 2.5 3 3.5 4
Rep 1, ug/kg
Rep
2,
ug/k
gaccepted dataoutlier datanon compliant data45° line
T-2 toxin in the low contaminated baby food material
HT2 : blind replicates
1
651
56
89
94
120
506136, c
57, nc0
2
4
6
8
10
12
14
0 2 4 6 8 10 12 14
Rep 1, ug/kg
Rep
2,
ug/k
g
accepted dataoutlier datanon compliant data45° line
HT-2 toxin in the low contaminated baby food material
31
T2 : blind replicates
1
6
51
56
89
94
120
136
506
57, nc
0
2
4
6
8
10
12
0 2 4 6 8 10 12
Rep 1, ug/kg
Rep
2,
ug/k
gaccepted dataoutlier datanon compliant data45° line
T-2 toxin in the medium contaminated baby food material
HT2 : blind replicates
1
6
51
5689
94
120
506
136, c
57,nc
0
5
10
15
20
25
0 5 10 15 20 25
Rep 1, ug/kg
Rep
2,
ug/k
g
accepted dataoutlier datanon compliant data45° line
HT-2 toxin in the medium contaminated baby food material
32
T2 : blind replicates
6
51
56
5789
120
136
506
1,gs
94,c
0
20
40
60
80
100
120
140
160
180
200
0 20 40 60 80 100 120 140 160
Rep 1, %
Rep
2,
%accepted dataoutlier datanon compliant data45° line
T-2 toxin apparent recovery in the spiked blank baby food material
HT2 : blind replicates
1 6
51
56
57
89
94
120
136
506
0
20
40
60
80
100
120
140
0 20 40 60 80 100 120
Rep 1, %
Rep
2,
%
accepted dataoutlier datanon compliant data45° line
HT-2 toxin apparent recovery in the spiked blank baby food material
33
T2 : blind replicates
506136
120
94
89
56
51
6,c
57, nc1, nc0
0.5
1
1.5
2
2.5
3
3.5
4
4.5
0 0.5 1 1.5 2 2.5 3 3.5 4 4.5
Rep 1, ug/kg
Rep
2,
ug/k
gaccepted dataoutlier datanon compliant data45° line
T-2 toxin in the blank cereal mix
HT2 : blind replicates
6
51
56
57
89
94
120
136
5061,nc0
1
2
3
4
5
6
7
0 1 2 3 4 5 6
Rep 1, ug/kg
Rep
2,
ug/k
g
accepted dataoutlier datanon compliant data45° line
HT-2 toxin in the blank cereal mix
34
T2 : blind replicates
506 120 94
89
57
56
51
6
1
136, c
0
2
4
6
8
10
12
0 2 4 6 8 10 12
Rep 1, ug/kg
Rep
2,
ug/k
gaccepted dataoutlier datanon compliant data45° line
T-2 toxin in the medium contaminated cereal mix
HT2 : blind replicates
506
136
12094
89
57
56
516
1
0
5
10
15
20
25
30
0 5 10 15 20 25 30
Rep 1, ug/kg
Rep
2,
ug/k
g
accepted dataoutlier datanon compliant data45° line
HT-2 toxin in the medium contaminated cereal mix
35
T2 : blind replicates
506
120
94
89
5756
51
6
136, c
1, nc0
5
10
15
20
25
30
35
40
45
0 5 10 15 20 25 30 35 40 45
Rep 1, ug/kg
Rep
2,
ug/k
gaccepted dataoutlier datanon compliant data45° line
T-2 toxin in the highly contaminated cereal mix
HT2 : blind replicates
506
120
94
89
57
5651 6
136, c
1, nc0
10
20
30
40
50
60
70
80
90
0 10 20 30 40 50 60 70 80 90
Rep 1, ug/kg
Rep
2,
ug/k
g
accepted dataoutlier datanon compliant data45° line
HT-2 toxin in the highly contaminated cereal mix
36
T2 : blind replicates
1
6
51
56
57
89
94
120
136
506
0
20
40
60
80
100
120
140
0 20 40 60 80 100 120 140
Rep 1, %
Rep
2,
%accepted dataoutlier datanon compliant data45° line
T-2 toxin apparent recovery in the spiked blank cereal mix
HT2 : blind replicates
1
651
56
89
94
120
136
506
57,c
0
20
40
60
80
100
120
140
0 20 40 60 80 100 120 140
Rep 1, %
Rep
2,
%
accepted dataoutlier datanon compliant data45° line
HT-2 toxin apparent recovery in the spiked blank cereal mix
37
Mean & Range plots:
T2 : blind replicates
6
51
89 94
120
136 5061,nc 57,nc57,nc1,nc0
0.2
0.4
0.6
0.8
1
1.2
1.4
laboratory number
lab.
mea
n an
d ra
nge,
ug/
kg
accepted dataoutlier datanon compliant dataoverall mean
T-2 toxin in the blank baby food material
HT2 : blind replicates
6
51
5657
89
94
120
5061,nc
136,c
1,nc0
1
2
3
4
5
6
7
8
laboratory number
lab.
mea
n an
d ra
nge,
ug/
kg
accepted dataoutlier datanon compliant dataoverall mean
HT-2 toxin in the blank baby food material
38
T2 : blind replicates
1
6
51
56
89
120
136
506
57, nc
94, c
57, nc0
0.5
1
1.5
2
2.5
3
3.5
4
laboratory number
lab.
mea
n an
d ra
nge,
ug/
kgaccepted dataoutlier datanon compliant dataoverall mean
T-2 toxin in the low contaminated baby food material
HT2 : blind replicates
1
6
51
56
89
94
120
506
57, nc
136, c
57, nc0
2
4
6
8
10
12
14
laboratory number
lab.
mea
n an
d ra
nge,
ug/
kg
accepted dataoutlier datanon compliant dataoverall mean
HT-2 toxin in the low contaminated baby food material
39
T2 : blind replicates
1
6
51
56
89
94
120
136
506
57, nc
0
2
4
6
8
10
12
laboratory number
lab.
mea
n an
d ra
nge,
ug/
kgaccepted dataoutlier datanon compliant dataoverall mean
T-2 toxin in the medium contaminated baby food material
HT2 : blind replicates
1
6
51 56
89
94
120
506
136, c
57,nc
0
5
10
15
20
25
laboratory number
lab.
mea
n an
d ra
nge,
ug/
kg
accepted dataoutlier datanon compliant dataoverall mean
HT-2 toxin in the medium contaminated baby food material
40
T2 : blind replicates
6
51
56
57 89
120
136
506
1,gs
94,c
0
20
40
60
80
100
120
140
160
180
200
laboratory number
lab.
mea
n an
d ra
nge,
%accepted dataoutlier datanon compliant dataoverall mean
T-2 toxin apparent recovery in the spiked blank baby food material
HT2 : blind replicates
16
51
56
57
89
94 120
136
506
0
20
40
60
80
100
120
140
laboratory number
lab.
mea
n an
d ra
nge,
%
accepted dataoutlier datanon compliant dataoverall mean
HT-2 toxin apparent recovery in the spiked blank baby food material
41
T2 : blind replicates
51
56
89
94
120
136 5061, nc
6,c
57, nc57, nc1, nc0
0.5
1
1.5
2
2.5
3
3.5
4
4.5
laboratory number
lab.
mea
n an
d ra
nge,
ug/
kgaccepted dataoutlier datanon compliant dataoverall mean
T-2 toxin in the blank cereal mix
HT2 : blind replicates
651
56
57
89
94
120
136
5061,nc1,nc0
1
2
3
4
5
6
laboratory number
lab.
mea
n an
d ra
nge,
ug/
kg
accepted dataoutlier datanon compliant dataoverall mean
HT-2 toxin in the blank cereal mix
42
T2 : blind replicates
1
6
51
56
57
89
94120
506
136, c
0
2
4
6
8
10
12
laboratory number
lab.
mea
n an
d ra
nge,
ug/
kgaccepted dataoutlier datanon compliant dataoverall mean
T-2 toxin in the medium contaminated cereal mix
HT2 : blind replicates
1
651
56
57
89
94
120
136
506
0
5
10
15
20
25
30
laboratory number
lab.
mea
n an
d ra
nge,
ug/
kg
accepted dataoutlier datanon compliant dataoverall mean
HT-2 toxin in the medium contaminated cereal mix
43
T2 : blind replicates
6
51 56
57
89
94
120
506
1, nc
136, c
1, nc0
5
10
15
20
25
30
35
40
45
laboratory number
lab.
mea
n an
d ra
nge,
ug/
kgaccepted dataoutlier datanon compliant dataoverall mean
T-2 toxin in the highly contaminated cereal mix
HT2 : blind replicates
6 5156
57
89
94
120
506
1, nc
136, c
1, nc0
10
20
30
40
50
60
70
80
90
laboratory number
lab.
mea
n an
d ra
nge,
ug/
kg
accepted dataoutlier datanon compliant dataoverall mean
HT-2 toxin in the highly contaminated cereal mix
44
T2 : blind replicates
1
6
51
56
57
89
94
120
136
506
0
20
40
60
80
100
120
140
laboratory number
lab.
mea
n an
d ra
nge,
%accepted dataoutlier datanon compliant dataoverall mean
T-2 toxin apparent recovery in the spiked blank cereal mix
HT2 : blind replicates
1
651
56
89
94 120
136
506
57,c
0
20
40
60
80
100
120
140
laboratory number
lab.
mea
n an
d ra
nge,
%
accepted dataoutlier datanon compliant dataoverall mean
HT-2 toxin apparent recovery in the spiked blank cereal mix
EUROPEAN COMMISSION DIRECTORATE-GENERALJOINT RESEARCH CENTRE Institute for Reference Materials and MeasurementsCommunity Reference Laboratory for Mycotoxins
Foodstuffs – Determination of T-2 and HT-2 toxins in
EUROPEAN COMMISSION DIRECTORATE-GENERAL JOINT RESEARCH CENTRE Institute for Reference Materials and Measurements Community Reference Laboratory for Mycotoxins
Annex IV: Geel, 04. Dec, 2006 AB D(2006)
Spiking Protocol:
In order to calculate the recovery of the method you are supplied with 2 different vials containing 3 mL each of a mixed T-2/ HT-2 standard in acetonitrile
The vial marked with "Spike B solution" has to be used to spike the two samples marked "Spike B".
The vial marked with "Spike C solution" has to be used to spike the two samples marked "Spike C".
Prior to analysis shake all containers vigorously (e.g. with a vortex shaker).
These containers are exclusively reserved for the spiking experiments and MUST NOT be used for direct analysis.
After shaking the spike sample containers weigh, to the nearest 0.1 g, 25.0 g of the blank material into a clean flask and add exactly 1.0 mL of the respective spiking solution (4.12, e.i. "Spike B solution" for "Spike B" sample) using a 1000 µL Hamilton syringe (3.16). Dispense right onto the sample making sure that the spiking solution is evenly distributed across the sample. Do not dispense onto the glass surface of the flask. Gently shake the flask by hand to achieve some mixing. Leave the spiked test sample for at least 1 h before proceeding with the extraction as described in the protocol, section 5.1, paragraph 2.
In the following four columns for the peak of T-2 enter the retention time (RT, 2 decimals), peak area (integer only) of ion 436 (Area 436), and ion ratios (3 decimals) of ions 350/185 and of ions 436/185, for the first injection of each injection solution .In the next four columns for the peak of T-2 enter the respective data for the second injection of each injection solution.In the next eight columns for the peak of HT-2 enter the respective data for both injections of each injection solution.Finally, in the last six columns for the ISTD peak enter the respective information for both injections of each injection solution.
Instructions :
T-2 HT-2Run 1
Please carefully fill in all the requested information. If for a certain reason data is not available leave field empty and make a note in the "Remarks" column. In the column "Sample Code" below enter the codes of the samples you have received.In the columns "Mean Concentration" enter the average of the calculated concentration of the duplicate runs for either T-2 or HT-2 for each of the samples.The column "Mean Concentration SUM" will then show the sum of both concentrations.
Fields for one full calibration are provided in this table. Also at the end fields for the optional in-house standard measurement are provided.If more calibrations have been performed enter them in the "Additional calibrations" work sheet.
EUROPEAN COMMISSION DIRECTORATE-GENERAL JOINT RESEARCH CENTRE Institute for Reference Materials and Measurements Community Reference Laboratory for Mycotoxins
Annex VI: Geel, 04. Dec, 2006 AB D(2006)
Results Questionnaire for the T-2/HT-2 Collaborative Study
Name of the participant
00X (code of the participant)
PLEASE ANSWER THESE QUESTIONS AND USING THE SUBJECT LINE "T-2/ HT-2 trial" SEND THEM TO:
CRL on Mycotoxins
European Commission
DG Joint Research Centre
Institute for Reference Materials and Measurements
1. Did you already use a similar method for the determination of T-2/ HT-2 including immunoaffinity clean-up or solid phase extraction and GC/MS detection?
Yes No
If yes, please state source:
2. Have you been familiar with the procedures used in this method?
Yes No
If no, please specify briefly which procedures were unfamiliar to you:
3. Was the method description adequate?
Yes No
4. What criticisms and/or suggestions could you make concerning the method and/or its performance? (Please attach additional sheets if necessary).
Page 3 of 6
Specific remarks about execution of the method:
5. What type of shaker was used for the initial extraction of materials?
Side-to-side Wrist action Rotational
Other please specify:
Type/Manufacturer:
6. Did you encounter any problems during filtration (e.g. low flow rate)?
Yes No
If yes, please state the exact problem and for which sample(s) this occurred (include codes):
7. What procedure was used for sample application to the IAC?
Gravity Vacuum
Other please specify:
8. Did you encounter problems during application of the extract to the IAC (e.g. slow flow rate, discolouration of immunoaffinity gel)?
Yes No
If yes, please state the exact problem and for which sample(s) this occurred (include codes).
Page 4 of 6
9. What was the average run time for sample application to the IAC
minutes
10. Did you encounter any problems during evaporation?
Yes No
If yes, please state the exact problem and for which sample(s) this occurred (include codes):
11. What evaporation system was used?
Vacuum centrifuge Heating block with N2
Other please specify:
12. How long were the samples dried for?
minutes
13. Specify manufacturer and model of the gas chromatography system used:
14. Specify manufacturer and model of the mass spectrometer used:
Page 5 of 6
15. Specify specifications (Manufacturer, Name, Dimensions) of the GC column used:
16. Specify GC parameters: Injection volume in μL:
Injector temperature [ºC]:
Injection mode (split, splitless, or pulsed modes thereof):
Temperature program [ºC]:
Transfer line temperature [ºC]:
Head pressure (if constant pressure mode) or flow rate (if constant flow):
Carrier gas:
17. Specify MS parameters (if applicable): Ion source temperature [ºC]:
Ionization energy [eV]:
Scan speed [scans/s]:
18. Specify whether peaks were integrated valley-to-valley or using a horizontal baseline:
Valley-to-Valley Horizontal baseline
Page 6 of 6
19. If manual integration was used, specify the samples and peaks affected and the reasons why:
20. Was any data smoothing applied before integration?
Yes No
If yes, please specify name of the algorithm:
21. Describe any deviation from the protocol other than what has been mentioned above:
Please supply copies of all chromatograms obtained (similar layout as the chromatograms in the appendix of the method protocol) and detailed calculations.
Thank you for completing this questionnaire.
European Commission EUR 23559 EN – Joint Research Centre – Institute for Reference Materials and Measurements Title: Validation of an Analytical Method to Determine the Content of T-2 and HT-2 toxinx in Cereals and Baby Food by Immunoaffinity Column Clean-up and GC-MS Author(s): A. Breidbach, V. Povilaityte, C. Mischke, I. Doncheva, H. van Egmond, J. Stroka Luxembourg: Office for Official Publications of the European Communities 2008 – 76 pp. –21 x 29.7 cm EUR – Scientific and Technical Research series – ISSN 1018-5593 ISBN 978-92-79-10531-9 DOI 10.2787/9311 Abstract A method for the determination of T-2 toxin and HT-2 toxin in cereals and baby food was validated by collaborative study. In short, the method is as follows: A test portion of a sample is extracted with a mixture of methanol/water (80/20, v/v). This raw extract is then diluted, filtered, and applied to an immunoaffinity column. After washing and elution with acetonitrile the eluate is evaporated to dryness. T-2 and HT-2 toxins in the dry residue are then derivatised with N-methyl-N-trimethylsilyl-trifluoroacetamid (MSTFA)/ Trimethylchlorosilane (TMCS) (99/1, v/v), injected into a gas chromatograph, and detected and quantified by mass spectrometry. 14 laboratories from 10 different countries were selected to participate in the collaborative study. They received 6 different test materials as blind duplicates. The test materials consisted of a blank cereal mix, two cereal mixes naturally contaminated at different levels, a blank baby food, and two baby foods naturally contaminated at different levels. Furthermore, two blank cereal mixes and two blank baby foods together with specific spiking solutions were provided for recovery determination. The sum of the mass fractions of T-2 & HT-2 after spiking were 50 µg/kg in the cereal mix, and 25 µg/kg in the baby food. Reported recoveries in the cereal mix ranged from 87 to 127% for the sum of T-2 & HT-2 with a mean value of 107%. Reproducibility relative standard deviations (RSDR) for the cereal matrix were 19% at a natural contamination level of ca. 32 µg/kg, 11% at ca. 79 µg/kg, and 12% for the spiked material at 50 µg/kg. For baby food the recovery values ranged from 91 to 127% with 116% for the mean value. The RSDR values were 23% at a natural contamination level of ca. 10 µg/kg, 15% at ca. 23 µg/kg, and 16% for the spiked material at 25 µg/kg. The Horwitz ratios (HorRat) ranged from 0.5 to 1.1. Since all these performance parameters lie well within the acceptable ranges set forth in European legislation [1] this method is suited for official food control.
How to obtain EU publications Our priced publications are available from EU Bookshop (http://bookshop.europa.eu), where you can place an order with the sales agent of your choice. The Publications Office has a worldwide network of sales agents. You can obtain their contact details by sending a fax to (352) 29 29-42758.
The mission of the JRC is to provide customer-driven scientific and technical support for the conception, development, implementation and monitoring of EU policies. As a service of the European Commission, the JRC functions as a reference centre of science and technology for the Union. Close to the policy-making process, it serves the common interest of the Member States, while being independent of special interests, whether private or national.