Page 1
LMPC 2011
321
VALIDATION OF FOUNDRY PROCESS FOR ALUMINUM PARTS
WITH FLOW3D® SOFTWARE
Ngadia Taha Niane
1 and Jean-Pierre Michalet
2
1PSA Peugeot Citroën; 18, rue des Fauvelles, 92250 La Garenne Colombes, FRANCE
2 PSA Peugeot Citroën; Centre Technique de Belchamp, 25420 Voujeaucourt, FRANCE
Keywords: Foundry, aluminium alloys, mould filling, thermal analysis
Abstract
The importance of smooth mould filling in the foundry casting process has been recognized
for a long time. More uniform the filling process is, the better the quality of the casting of the
products produced. Successful computer simulations can help to reduce the number of trials
and cut down the lead time in the design of new casting products by better understanding the
complex mechanisms and interplay of different process parameters in the mould filling
process.
This work deals with the numerical simulation of the filling of gravity die casting, lost foam
casting and its solidification. Computations were carried out using Flow3D® which is a
general computational fluid dynamics (CFD) code [1]. The simulation involved viscous fluid
flow with transient free surfaces, metal/mould heat transfer, conduction in both metal and
mould, and latent heat release. Full Navier-Stokes equations, energy equations and Volume
of Fluid (VOF) methods were used to simulate this topic.
Simulations results were compared with experimental data and good correlation for thermal
effects and front tracking evolution throughout the parts have been found.
Introduction
PSA Peugeot Citroën owns three foundries. They are located in northern France. The foundry
of Charleville Mézières produces cylinder heads by gravity die casting, and lost Foam
cylinder heads as well as GJS cast-iron parts. The Foundry of Mulhouse produces crankcases
cylinders in high pressure die casting. Lastly the foundry of Sept-Fons produces crankcases
cylinders and revolution parts in GJL Cast.
For many years, PSA Peugeot Citroen has been using the numerical simulation in its projects
development of new vehicles and new parts.
The foundry was one of the first processes modelized. For twenty years, design and new
part’s development of power units or crossmember parts were based on the numerical
simulation of the foundry.
Presently, the tools for simulation are impossible to circumvent from the numerical channel
of design as well as the CAD.
Page 2
LMPC 2011
322
The application of the foundry simulation in the projects has considerably advanced in
particular thanks to the contribution of the different software used these last two decades.
Flow3D®
used since 2008 in PSA Peugeot Citroen shows a new step of this evolution.
Flow3D®
represents a new ambitious goal with respect to the objectives that we fixed in
terms of predictability for all the foundry process. Among those, is the lost Foam, High
Pressure Die Casting and gravity die casting process which inaugurates this new stage.
Lost Foam process offers today some Industrial advantages. Particularly, the costs are
between 15% and 30% lower compared to more conventional methods of moulding.
However, this technique requires expertise and significant experience during development
phases. Defects in specific processes can occur on parts such as effects of ceiling or partial
vitrification (deposit of sand). Other defects (defects misrun, blowholes, turbulent flow and
solidification defects) are similar than in gravity die casting even if their origin is different.
Like other processes, the formation of defects during aluminum cylinder heads Lost Foam
casting can be affected by the flow, solidification and cooling. We did this study in order to
understand the evolution of the flow front and the thermal process during filling and
solidification of our process. This complexity was proven by tests, used to detect the progress
of the flow using binary metal detector. The same tests have been used for the gravity die
casting process. This study is achieved to supplement the understanding of the flow for Lost
Foam and gravity die casting using specific tools Flow3D®, numerical modeling, physical
modeling (Flow3D® model) and industrial testing. Each one of the tests and calculations that
was made by using these methods helped to validate the numerical model and gives an idea
of the parameters which impact fluid flow and temperature. As it is the temperature which
governs all the defects, we will see if the thermal evolution is well reproduced for our
applications.
In this paper we describe the models that are used in industrial applications and have
provided validation for the thermal and flow front evolution.
Model
FAVOR is an acronym for Fractional-Area-Volume-Obstacle-Representation. It was
originally developed for defining obstacles of general shape within a grid composed of
rectangular brick elements [2]. The concept is to define for each brick element the fractional
areas of each of six faces that are open to flow, together with the open volume of the brick.
These fractions are then incorporated into the finite-volume equations of motion. For
instance, convective fluxes of mass, momentum and energy between two elements at their
common face must contain the open area of this face as a multiplier. If there is no open area,
there can be no convective flux. The strength of the FAVOR method is the modeling
flexibility it offers [3]. For heat transfer between fluids and solids, the FAVOR method gives
high solution accuracy by providing a good approximation of the areas of the fluid/obstacle
interface within each brick element.
For an incompressible, viscous fluid, the FAVOR equations take the form:
Page 3
LMPC 2011
323
In these equations Ai is the open area fraction associated with the flow in the ith
direction, V
the open volume fraction, density, p pressure, ui the ith
velocity component, the fluid
viscosity coefficient, g gravity, H fluid enthalpy, T fluid temperature, fs solid fraction, L
latent heat, and C and fluid specific heat ant thermal conductivity coefficient, respectively.
For the mould, the energy equation has the form:
where the subscript m indicates a parameter related to the mould and the subscript c indicates
quantities that are complements of the volume and area fractions. At the metal/mould
interface the heat flux, q, is calculated according to
where h is the heat transfer coefficient.
Applications
Die casting for cylinder head is a case of industrial castings vehicle engines by PSA Peugeot
Citroen fabricated by gravity casting source (permanent die-casting) or Lost foam casting.
We have studied the case of a cylinder head. During the filling and the solidification,
thermocouples and sensors were introduced into the mold to obtain the evolution of the
temperature and detect the metal. Therefore, some test data were used to compare the results
obtained in simulation. Thus we can see whether the software Flow3D®
accurately models
the actual behavior of the aluminum alloy during the casting of the part.
This section shows the various steps of the gravity casting process: filling and solidification
of the part.
Page 4
LMPC 2011
324
Gravity Die Casting
Gravity die casting is a process where the liquid metal is poured into metallic moulds without
application of any external pressure, Figure 1 (a) and (b).
Figure 1. (a) illustrative case, (b) industrial case "cylinder head"
Figures 2 (a) and (b) shows the results of the flow front during filling, and Figure 3 shows the
results of the thermal during the filling and solidification.
comparison measurements and simulation filters 10 ppi
Time of release of the sensors
0,00
2,00
4,00
6,00
8,00
10,00
12,00
14,00
16,00
Tc1 Tc3 Tc5 Tc7 TC9 TC11 TC13 Tc15 TC17 TC19 TC21 TC23
Number of sensor
Tim
e i
n s
.
0,00
2,00
4,00
6,00
8,00
10,00
12,00
14,00
16,00
Mesures 10 ppi
Bas lou filtre poro 70 v06 10ppi
Figure 2 (a). Evolution of front filling, experimental test/simulation for gravity die casting process
Figure 2 (b). Visualization of filling at time = 4 seconds, and time =5 seconds
In Figure 2 (a), we can say qualitatively that the behavior of the metal is well reproduced by
the simulation in all the part. Figure 2 (b) shows the filling of the part at time = 4 seconds and
5 seconds.
comparison measurements and simulation filters 20 ppi
Time of release of the sensors
0,00
2,00
4,00
6,00
8,00
10,00
12,00
14,00
16,00
Tc1 Tc3 Tc5 Tc7 TC9 TC11 TC13 Tc15 TC17 TC19 TC21 TC23
Number of sensor
Tim
e i
n s
.
0,00
2,00
4,00
6,00
8,00
10,00
12,00
14,00
16,00
Mesures 20 ppi
Bas lou filtre poro 60 v04 20ppi
Page 5
LMPC 2011
325
In Figure 2 (b), we can see the progress of the flow front during mold filling. We can also see
the tilt pouring to model the arrival of aluminum liquid at 720 ° C.
On Figure 3 we can notice the temperature evolution obtained in simulations until 200s. The
graphs show the general behavior of the alloy, which is well reproduced by the software
Flow3D®, according to the thermocouples 1, 4 and 6. Indeed we can see that the liquidus and
eutectic levels are present at the same time in simulations and tests.
Figure 3. Thermal validation for gravity die casting process
Nevertheless we can see differences of over 20°C between the results obtained in simulations
and those obtained during the tests. This can be explained by the fact that the transfer
coefficient between the permanent "solid steel" and the aluminum alloy is not exactly known.
Lost Foam Casting
Lost Foam Casting is particularly used for automotive applications. It is a molding technique
that produces patterns by blowing polystyrene beads into aluminum mold cavities. Injecting
steam into the tooling cavity expands the beads. The beads will flatten against the tool surface
and stick to one another. After cooling, the patter is ejected from the tool Figure 4. The multi
component patterns with gating systems are assembled with contact adhesive. The assembly
is coated, usually by dipping, in a permeable coating, and then air or oven dried. The coating
prevents sand collapse during pouring. The coated pattern-gating assembly is set in a flask,
and the unbonded sand is added to the flask. In order to compact the sand, the flask will first
need to be vibrated during filling. When molten metal is poured into the mold, the pattern
vaporizes, allowing the metal to fill the mold cavity.
TC1
440
450
460
470
480
490
500
510
520
530
540
550
560
570
580
590
600
610
620
0 20 40 60 80 100 120 140 160 180 200
Time (s)
Tem
pera
ture
(°C
)
TC1_essai_V1
TC1_essai_V2
TC1_simulation
TC4
470
480
490
500
510
520
530
540
550
560
570
580
590
600
610
620
630
640
650
0 20 40 60 80 100 120 140 160 180 200
Time (s)
Tem
pera
ture
(°C
)
TC4_essai_V1
TC4_essai_V2
TC4_simulation
TC6
540
550
560
570
580
590
600
610
620
630
640
0 20 40 60 80 100 120 140 160 180 200
Time (s)
Tem
pera
ture
(°C
)
TC6_essai_V1
TC6_essai_V2
TC6_simulation
Page 6
LMPC 2011
326
Figure 4. (a) illustrative case, (b) industrial case "cylinder head"
comparison measurements and simulation lost foam
Time of release of the sensors
0
5
10
15
20
25
30
35
TC1 TC2 TC3 TC4 TC5 TC6 TC7 TC8 TC9 TC10 TC11 TC12 TC13 TC14 TC15 TC16 TC17 TC18 TC19 TC20
Number of sensor
Tim
e i
n s
.
0
5
10
15
20
25
30
35
Instrumentation 1
Instrumentation 2
Flow3d V13
Figure 5 (a). Evolution of front filling, experimental test/simulation for Lost Foam process
Figure 5 (b). Visualization of filling at time = 5 seconds, and time = 14 seconds
Page 7
LMPC 2011
327
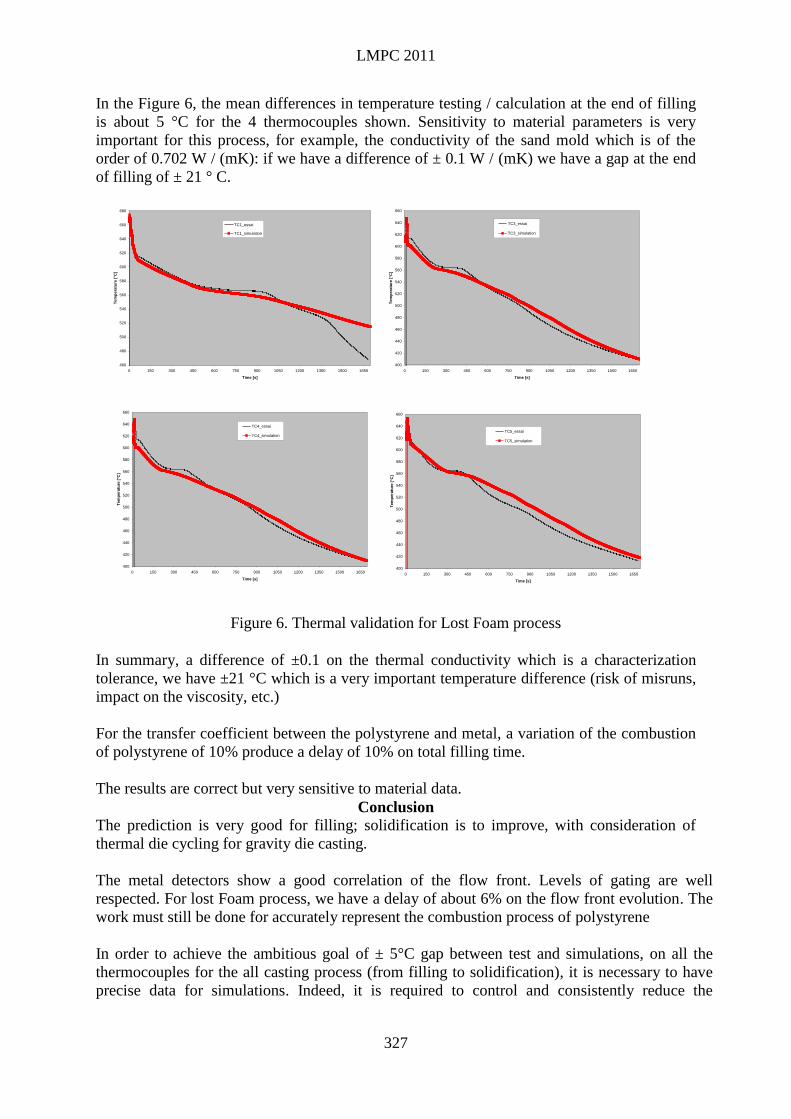
In the Figure 6, the mean differences in temperature testing / calculation at the end of filling
is about 5 °C for the 4 thermocouples shown. Sensitivity to material parameters is very
important for this process, for example, the conductivity of the sand mold which is of the
order of 0.702 W / (mK): if we have a difference of ± 0.1 W / (mK) we have a gap at the end
of filling of ± 21 ° C.
Figure 6. Thermal validation for Lost Foam process
In summary, a difference of ±0.1 on the thermal conductivity which is a characterization
tolerance, we have ±21 °C which is a very important temperature difference (risk of misruns,
impact on the viscosity, etc.)
For the transfer coefficient between the polystyrene and metal, a variation of the combustion
of polystyrene of 10% produce a delay of 10% on total filling time.
The results are correct but very sensitive to material data.
Conclusion
The prediction is very good for filling; solidification is to improve, with consideration of
thermal die cycling for gravity die casting.
The metal detectors show a good correlation of the flow front. Levels of gating are well
respected. For lost Foam process, we have a delay of about 6% on the flow front evolution. The
work must still be done for accurately represent the combustion process of polystyrene
In order to achieve the ambitious goal of ± 5°C gap between test and simulations, on all the
thermocouples for the all casting process (from filling to solidification), it is necessary to have
precise data for simulations. Indeed, it is required to control and consistently reduce the
460
480
500
520
540
560
580
600
620
640
660
680
0 150 300 450 600 750 900 1050 1200 1350 1500 1650
Time [s]
Tem
pera
ture
[°C
]
TC1_essai
TC1_simulation
400
420
440
460
480
500
520
540
560
580
600
620
640
660
0 150 300 450 600 750 900 1050 1200 1350 1500 1650
Time [s]
Tem
pera
ture
[°C
]
TC3_essai
TC3_simulation
400
420
440
460
480
500
520
540
560
580
600
620
640
660
0 150 300 450 600 750 900 1050 1200 1350 1500 1650
Time [s]
Tem
pera
ture
[°C
]
TC4_essai
TC4_simulation
400
420
440
460
480
500
520
540
560
580
600
620
640
660
0 150 300 450 600 750 900 1050 1200 1350 1500 1650
Time [s]
Tem
pera
ture
[°C
]
TC5_essai
TC5_simulation
Page 8
LMPC 2011
328
measurement dispersion on industrial case. (The thermal objective is difficult to reach with the
actual resources and processes).
References
1. “FLOW-3D: Computational Modeling Power for Scientists and Engineers,” Flow Science,
Inc. report, FSI-87-00-01; see also web site www.flow3d.com.
2. C.W. Hirt and J.M. Sicilian, “A Porosity Technique for the Definition of Obstacles in
Rectangular Cell Meshes,” 4-th International Conference on Ship Hydrodynamics,
Washington, DC, September 1985.
3. C.W. Hirt and B.D. Nichols, “Volume of Fluid (VOF) Methods for the Dynamics of Free
Boundaries,” J. Computational Physics, 39, 201-255, 1981.