Page 1
1
Validation of learning progression in scientific imagination using data from
Taiwanese and Finnish elementary school students
Abstract
This study validated learning progression in scientific imagination and compared the
performance of Taiwanese and Finnish elementary school students on scientific imagination
tasks. A total of 150 5th and 6th graders completed the Scientific Imagination Test-Verbal
(SIT-Verbal). Multiple analyses related to the validity of the SIT-Verbal were conducted using
the Rasch partial credit model. Differences in scientific imagination due to gender and
country of residence were assessed using t-tests. The results indicated that the various
components of scientific imagination were hierarchically ordered, except for
conceptualisation/organisation/formation. No differences in scientific imagination due to
gender or country of residence were observed. Suggestions for future research are offered.
Keywords: scientific imagination, processes, learning progression, Scientific Imagination
Test-Verbal, Taiwan, Finland
Page 2
2
Introduction
Back to the Future Part II is an American science-fiction adventure comedy film from
1989. The vision of the future portrayed in the film enthralled audiences when it was first
released, and over 25 years later, its version of the future has proven to be more accurate than
might have been expected. Whilst hover boards, self-lacing shoes, and virtual-reality headsets
did not exist in the 1980s, some of the technology depicted in the film has now become a
reality (http://www.techinsider.io/things-back-to-the-future-2-got-right-2015-10). Through
the use of their imagination, people can develop their creative ideas to become real products
or objects based on those ideas (Eckhoff & Urbach, 2008). Imagination drives people to
explore the world, pursue their interests, solve problems, and develop new abilities that are
needed for the future (Church, 2006). In other words, imagination affects our thinking,
language, and experiences on a daily basis (Adams, 2004; Grant, 2004; Mountain, 2007;
Wang, Ho, & Cheng, 2015a, b).
In recent years, many countries around the world have increased their efforts to promote
and support imagination-related research. Key examples include projects such as “Imagining
the Future”, a course created by the Writing and Humanistic Studies Department of the
Massachusetts Institute of Technology (MIT) and the Imagination Institute, established by the
Positive Psychology Center at the University of Pennsylvania
(http://imagination-institute.org/) in the United States, as well as the Imaginative Education
Research Group, established by Simon Fraser University in Canada (http://ierg.ca/). Among
the countries engaging with this field, Finland has performed outstandingly in promoting
education targeted at innovation, creativity, and imagination. In the 2014–2015 Global
Competitiveness Report of the World Economic Forum, Finland was ranked top of 144
economies on both the Innovation and the Higher Education and Training indices. Finland is
an example of a nation that has transformed itself from a remote agrarian/industrial state in
the 1950s to a model knowledge economy state, using education as the key to economic and
Page 3
3
national development. Finnish education policies are designed to increase student
achievement and national competitiveness (Sahlberg, 2007). The success of these policies is
reflected in the outstanding performances by Finnish students on international assessments
(e.g., the Program for International Student Assessment: PISA) (Reinikainen, 2012, p. 3-18;
Sahlberg, 2007). Finnish students are not subjected to routine testing, and schools are granted
considerable pedagogical freedom (Niemi, Multisilta, Lipponen, & Vivitsou, 2014). The
combination of using imagination and life experiences has become an important educational
paradigm in the Finnish system. Besides, Finnish educational initiatives, such as the 2012
Hernesaari Local Masterplan (Lin, 2011; Meskanen, 2012), serve as good models for the
integration of imagination, creativity, and innovation.
Similarly, in recent decades, Taiwan has placed increasing emphasis on technological
innovation, creativity, and scientific imagination. Beginning in 2009, the Ministry of Science
and Technology (MOST) and the Ministry of Education (MOE) have promoted education and
research related to imagination by recruiting people to participate in projects focusing on
imagination and technology research and on nurturing practical skills (Department of Science
Education, 2009), thereby substantially increasing the country’s capacity for generating
research related to technological development. The MOE Advisory Office designated
2011–2014 as a period for establishing “a program for the future of imagination and
creativity in education”, with the main theme of “nurturing individuals with imagination for
the future, for caring, and for practical applications” (MOE Advisory Office, 2012). Although
education authorities in Taiwan aim to advocate scientific imagination and creativity, the
volume of memorisation and repetition tasks, which remain typical educational methods used
in many Asian countries, has been a major impediment (Kim, 2005; Wu, 2002). Previous
experience at an educational site in Taiwan showed that creativity and imagination in
Taiwanese students may be limited or stifled by an exam-oriented culture that requires a
single correct answer (Wu, 2002). This exam-oriented culture restricts not only teachers’
Page 4
4
instructional practices but also the development of creativity and imagination among students.
Creation and invention originate from a rich imagination (Ho, Wang, & Cheng, 2013). Using
Finland as a positive role model for Taiwan to progress economically and in innovation, it is
of value to explore how Finnish students think and to be able to measure their imagination for
use as a reference for Taiwanese imaginative education.
Literature review
Scientific imagination and creativity
Many scientific theories and inventions have come from ideas that originated from the
human imagination (Wang et al., 2015a). Scientific imagination is one aspect of scientific
creativity, which plays an important role in the development of science theory (Hu & Adey,
2002; Lin, Hu, Adey, & Shen, 2003). Scientific creativity is an intellectual trait, or the ability
or potential to produce a certain product that is original and has a social or personal value,
designed with a certain purpose in mind, using some given information. It covers creative
science experiments, creative scientific problem finding and solving, and creative scientific
activity, which all require scientific knowledge and skills (Hu & Adey, 2002). Scientific
imagination is a mental activity involving the creation of new ideas that are consistent with
scientific principles and linked to daily life experiences (Ho et al., 2013); it is an intellectual
trait with the ability to produce, or potentially produce, a product. It can be inferred that
scientific imagination plays a significant role in scientific creativity. Although there is an
increasing body of research focusing on scientific creativity, very few studies (e.g., Cruz &
Smedt, 2010) have dealt with scientific imagination, and this prompted our exploration of the
constructs of scientific imagination and learning progression (LP) of scientific imagination.
The definition and components of scientific imagination
Ho et al. (2013) proposed the notion of scientific imagination as a type of purposeful
Page 5
5
imagination applied to a scientific discipline. They defined scientific imagination as a form of
mental activity involving the creation of new ideas consistent with scientific principles and
that are linked to daily life experiences. By studying award-winning teachers and students
participating in the International Exhibition for Young Inventors (IEYI) competition, they
argued that the process of scientific imagination consisted of three key stages, namely,
initiation, dynamic adjustment, and virtual implementation, and four underlying components,
namely, brainstorming (Man-hsiang, 漫想), association (Lien-hsiang, 聯想),
transformation/elaboration (Chi-hsiang, 奇想), and conceptualisation/organisation/formation
(Miao-hsiang, 妙想). Here, multiple life experiences (e.g., reading science fiction novels,
watching movies, playing, attending seminars, and travelling) were considered as the most
influential factors in the scientific imagination processes. The daily life experiences of
students are not only a source for developing new ideas but also act as a guide to help
students to identify relationships between different ideas (Wang, Ho, Wu, & Cheng, 2014).
Ho et al. (2013) used the example of the “Illuminated Shoes” that contain a flashlight, and
which were created by a group of Taiwanese elementary school students. Their invention was
motivated by their past experience of trying to find their way in the dark. Ho et al. (2013)
described the entire process experienced by the students of the use of their scientific
imagination, including where they encountered the different scientific principles and
functions (e.g., LED light placement and the circuit diagram of the power supply).
The learning progression of scientific imagination
In recent years, LP has been regarded as a more sophisticated method to analyse a
particular topic over an extended period of time and can be used as a template for the
development of curriculum and assessments. LP has been used to explore “the big ideas” in
scientific disciplines, for example, scientific modelling and scientific argumentation in
Page 6
6
science education (Wang et al., 2015a). Under this premise, Wang et al. (2015a) identified an
LP for scientific imagination based on a measured approach using the Berkeley Evaluation
and Assessment Research (BEAR) Assessment System (BAS; Wilson, 2005, 2009). The aim
was to obtain a better understanding of the core ideas and developmental trajectory of the
process of scientific imagination and to align curricular development, instruction, and
assessment through the construction of LP. It is noteworthy that the LP for scientific
imagination in their study was focused on 5th and 6th grade elementary school levels. Finally,
Wang et al. (2015b) revised the contents of the LP (Table 1) and the scoring guidelines for
assessing scientific imagination based on their previous research.
Table 1 Learning progression for scientific imagination and its indicators
Scientific
imagination
Abilities Indicators Stages
Level 4
Conceptualisa
tion/organisati
on/formation
4.1 Students can refine their previous activities to
create a prototype for implementing their
specific ideas, including details related to the
choice of materials, techniques for assembling
parts, and the means of creating design diagrams
and final drafts from the initial diagrams.
Virtual
implementation
stage
Level 3
Transformatio
n/elaboration
3.1 Student can reorganise the physical features and
functions of inventions to solve problems.
Virtual
implementation
stage
Level 2
Association
2.2 Students can come up with possible solutions
and illustrate the physical features and functions
of their inventions.
Dynamic
adjustment stage
2.1 Students can specify problems relating to their
life experience.
Initiation stage
Level 1
Brainstorming
1.2 Based on the problems identified, students can
propose solutions or inventions.
Dynamic
adjustment stage
1.1 Based on the question scenario, students can
specify the problems (e.g. inconvenience) that a
situation might bring about.
Initiation stage
Note. From “Validation of the Scientific Imagination Test-Verbal”, by C. C. Wang, H. C. Ho, & Y. Y. Cheng.
2015, Paper presented at the Pacific Rim Objective Measurement Symposium (PROMS) 2015, Fukuoka, Japan.
Page 7
7
Based on their revised LP related to scientific imagination (Wang et al., 2015a), the
scoring guidelines for the Scientific Imagination Test-Verbal (SIT-Verbal) were revised to
measure scientific imagination in 3rd to 6th grade elementary school students. The SIT-Verbal
was deemed suitable for measuring students’ scientific imagination at the elementary school
level, although differences in daily life experiences and stages of cognitive development
should be considered in assessing scientific imagination in these cases. However, the
development of suitable LPs is an iterative process that requires ongoing research. Wang et al.
(2015a) also suggested that LP for scientific imagination may differ depending on age, gender,
or background. To provide additional empirical evidence (e.g. cross-sample and cross-gender)
on the validity of LP in scientific imagination (Wang et al., 2015a, b), we aimed to validate
LP in scientific imagination using samples from Taiwanese and Finnish elementary students.
The results may serve as a valuable reference pertaining to Asian (Taiwanese) and Western
(Finland) cultures, providing useful information for future science education initiatives aimed
at cultivating scientific imagination.
Method
Participants
This study aimed to validate LP in scientific imagination (Wang et al., 2015a, b) using
data from Taiwanese and Finnish elementary school students. Data were collected from
students in both countries, by means of purposive sampling.
Taiwanese students. A total of 74 5th and 6th graders from elementary schools in southern
Taiwan were recruited; of these, 2.70% were 5th graders (n = 2) and 97.30% were 6th graders
(n = 72); 54.10% of the participants were male (n = 40) and 45.90% were female (n = 34).
The Taiwanese students were aged between 11 and 13 years (M = 11.99 years; SD = 0.59).
Finnish students. A total of 76 5th and 6th graders from comprehensive schools in
Page 8
8
Helsinki were recruited; of these, 23.70% were 5th graders (n = 18) and 76.30% were 6th
graders (n = 58); 46.10% of the participants were male (n = 35) and 53.90% were female (n =
41). The Finnish students were aged between 10 and 13 years (M = 11.82 years; SD = 0.69).
Instrument
The SIT-Verbal, designed by Wang et al. (2015a), is a situation test that measures 5th and
6th grade elementary school students’ scientific imagination, and is composed of four
components, comprising brainstorming (Man-hsiang, 漫想), association (Lien-hsiang, 聯想),
transformation/elaboration (Chi-hsiang, 奇想), and conceptualisation/organisation/formation
(Miao-hsiang, 妙想). A small revision was made to the methods regarding the items and
scoring guidelines. A bilingual (Chinese/Finnish) version of the SIT-Verbal was drafted to
measure Taiwanese and Finnish students’ scientific imagination. The back-translation of the
SIT-Verbal (Wang et al., 2015b) was carried out by two bilingual experts who translated the
English version of the questionnaire into Finnish, and one expert who verified the consistency
between these two versions.
The test introduced the pupils to a situation involving a space mission to another planet
in which they encountered “a lot of falling leaves” at a school on the planet. In the
open-ended test, students were required to complete two missions (Table 2). The first mission
(Mission 1) consisted of three questions. The first question addressed brainstorming
(Man-hsiang, 漫想) and required the participants to identify potential problems posed by the
situation of “a lot of falling leaves” at the school. Based on Question 1, the second question
(Question 2) addressed association (Lien-hsiang, 聯想) and asked the students to assess how
these problems might influence their daily lives. The third question (Question 3) addressed
both brainstorming and association, and tasked the students with designing solutions to the
Page 9
9
problem.
Following the successful completion of the first mission (answering the first three
questions), the students were given a second mission (Mission 2), in which they had to draw
one “new invention” to solve the problem identified in Mission 1. The
transformation/elaboration (Chi-hsiang, 奇想) and conceptualisation/organisation/formation
(Miao-hsiang, 妙想) components were assessed in Mission 2. The test covered six items
related to the four components. The time given to the students to complete both missions was
limited to 15 minutes.
The scoring guidelines for student responses were developed through expert consensus
based on three meetings/discussions and on pre-test results (Wang et al., 2015a, b). The test
administrator/rater (and the first author of this study) evaluated the responses. To overcome
potential rater inconsistency arising from cultural differences, the same test administrator/test
rater, who also co-developed the SIT-Verbal in Taiwan, went to Finland to collect the data
from the Finnish students and rated their responses.
The quality of the students’ responses was ranked from “category 0” (the lowest level) to
“category 3” (the highest level). See Appendix A for the scoring guidelines.
Table 2.
Content included in the revised version of the Scientific Imagination Test-Verbal
(SIT-Verbal).
Mission 1
The planet LABIDO has rich natural resources and minerals that could help to solve crises facing the earth.
However, LABIDO is in big trouble now. You have been chosen as one of the spacemen to undertake an
adventure to help LABIDO. Before your journey, you need to accomplish one mission. Then you can go to
LABIDO and complete the second mission with the other spacemen.
Situation:
“There is a school on LABIDO. Many trees are planted at the school. There are always lots of falling leaves
near the trees….” Please answer the following questions.
1) Question 1: What problems might this situation bring about? (The more problems you can think of the
better)
2) Question 2: Based on Question 1, how might these problems influence daily life?(The more
Page 10
10
influences you can think of the better)
3) Question 3: How many solutions can you think of? (The more solutions the better)
Mission 2
Based on the same situation, please draw one “new invention” that you think can efficiently solve the problem
described in the situation. You have to explain the materials you will need for your new invention and specify
the functions of this invention. Please also give your invention a name. Time limit for these two missions: 15
minutes.
Analysis
In this study, the data were analysed in two phases: process validation and analysis of
differences. First, the Rasch partial credit model (Rasch PCM; Masters, 1982) was used to
conduct process validation for the Taiwanese and Finnish data. This model consists of two
primary parameters: the person’s (n) ability (θn) and the difficulty (δi) of the item (i). When
person n responds to item i, the probability that this person will provide the correct answer
for this item is as follows:
im
k
k
j
ijin
x
j
ijin
nix mxPi
,...,1,0,
)]([exp
)]([exp
0
0
, (1)
where Pnix is the probability of person n scoring x on item i. Additionally, θn (scientific
imagination ability), the latent trait level of person n, is the target of the measurement, and δj
is the overall difficulty of item i (e.g., difficulty or threshold value). To compare the
hierarchies related to scientific imagination, we calculated the Thurstone thresholds for each
item. Because the revised version of the SIT-Verbal uses a four-point scale, each item has
three Thurstone threshold values. The kth Thurstone threshold of each item on the SIT-Verbal
corresponds to the threshold point at which the probability of the participant obtaining a score
below k is equal to the probability of that participant obtaining a score equal to or higher than
k (Linacre, 1998). Taking indicator 1.1 as an example, the lowest performance (Level 0) for
student brainstorming in the initiation stage is, “students cannot suggest what problems (e.g.,
inconvenience) the situation might bring about”; the highest performance (Level 3) is,
“students can specify at least three problems the situation might bring about.” This study
Page 11
11
focused on responses at or above “Level 2,” which is the lowest cut-off point for classifying a
student with more/less scientific imagination (Level 2) where, “students can specify two
problems that the situation might bring about” (Wang et al., 2015a, b). Therefore, we used
the second Thurstone threshold for each item as a reference point to compare differences in
scientific imagination. Parameters of the Rasch PCM were estimated using the ConQuest
computer program (Wu, Adams, & Wilson, 2007).
For process validation, we assessed the content validity, structural validity,
generalisability, substantive validity, and interpretability (Messick, 1994, 1995a, b; Wolfe &
Smith, 2007) of the SIT-Verbal using Rasch PCM analysis. For content validity, we presented
which and how the items and the score guidelines of the SIT-Verbal were revised. Regarding
structural validity, the Rasch PCM was used to examine the fit of each item and the
unidimensionality of scientific imagination. When the data fit the expectations generated by
the model, the expected value of the infit and outfit mean-square (MNSQ) is unity. An
MNSQ value between 0.6 and 1.4 was set as the criterion for a reasonably good model–data
fit (Bond & Fox, 2007). With regard to substantive validity, the current hypothesised scores
for each item represented different levels of student understanding. In principle, the
hypothesised item hierarchy should match the empirically derived hierarchy. In addition, for
each item, we also provided the percentage of times each category was chosen. Regarding
generalisability, differential item functioning (DIF) analyses were conducted across genders
and countries. Furthermore, person separation reliabilities (Schumacker & Smith, 2007) were
calculated to determine measurement precision. As Wright Maps are graphical and empirical
representations of construct maps showing how a construct unfolds or evolves with
increasingly sophisticated student performance, they were used in this study to represent
simultaneously the participants’ scientific imagination level and the difficulty of items; this
allowed for hierarchies related to scientific imagination to be evaluated for each item.
Finally, we assessed both the Taiwanese and the Finnish data for differences in scientific
Page 12
12
imagination due to gender using t-tests and evaluated any differences in scientific
imagination between the two countries.
Results
Multiple validities of the scientific imagination process in Taiwanese and Finnish samples
Content and structural evidence. The Rasch PCM was used to examine the
unidimensionality of scientific imagination. The results based on the Taiwanese and Finnish
data revealed that most of the items had acceptable infit and outfit MNSQs in the second step
(range: 0.6–1.4), except for item 4.1 for the Taiwanese students (Table 3).
Generalisability evidence. DIF analyses were conducted for scientific imagination. All of
the estimates of the differences in item difficulty by gender in the Taiwanese (△DIF1.1=0.18;
△DIF1.2=0.04; △DIF2.1=0.36; △DIF2.2=0.49; △DIF3.1=0.41; △DIF4.1=0.31) and Finnish
(△DIF1.1=0.65; △DIF1.2=0.10; △DIF2.1=0.06; △DIF2.2=0.23; △DIF3.1=0.07; △DIF4.1=0.32)
data were < 0.5 logits, with the exception of item 1.1 that measured brainstorming in the
Finnish data. Additionally, differences between the countries in all of the estimates of item
difficulty were < 0.5 logits. The person separation reliabilities for scientific imagination
were .82 and .78 for the Taiwanese and Finnish students, respectively.
Table 3.
Estimates of item difficulty and goodness-of-fit values for scientific imagination in
Taiwanese and Finnish students.
Data resource
Item Step Estimates of item difficulty
SE OUTFIT MNSQ
INFIT MNSQ
Taiwan 1.1 0 1.65 1.12 1 -1.13 0.25 0.76 0.89 2 -0.09 0.26 0.88 0.95 3 1.22 1.44 0.98
1.2 0 0.84 0.89
Page 13
13
Data resource
Item Step Estimates of item difficulty
SE OUTFIT MNSQ
INFIT MNSQ
1 -1.71 0.27 0.89 0.93 2 0.24 0.28 0.87 0.98 3 1.47 0.49 0.91
2.1 0 0.77 0.88 1 -1.77 0.26 0.91 0.94 2 0.79 0.32 0.87 0.98 3 0.98 0.79 1.12
2.2 0 0.76 0.88 1 -2.07 0.28 0.93 0.94 2 0.38 0.31 0.85 0.95 3 1.69 0.63 1.10
3.1 0 1.14 1.14 1 -1.13 0.27 0.96 1.01 2 0.07 0.41 1.63 1.05 3 1.07 4.01 1.29
4.1 0 1.07 1.12 1 -0.28 0.28 0.89 0.98 2 0.28 2.06 1.29
Finland 1.1 0 0.78 1.00 1 -1.55 0.26 2.13 1.23 2 -0.23 0.24 1.09 1.07 3 1.78 1.42 1.18
1.2 0 1.67 1.19 1 -1.72 0.28 1.19 1.08 2 -0.27 0.26 1.05 1.07 3 1.99 0.63 1.04
2.1 0 0.59 0.84 1 -1.61 0.26 1.03 1.02 2 0.32 0.27 0.92 0.98 3 1.29 1.26 0.99
2.2 0 0.59 0.83 1 -2.38 0.30 0.93 0.94 2 -0.21 0.28 0.79 0.91 3 2.59 0.42 0.99
3.1 0 0.66 0.80 1 -2.05 0.26 0.90 0.91 2 0.51 0.36 0.62 0.89 3 1.54 5.53 1.10
4.1 0 0.74 0.85 1 -1.85 0.26 0.92 0.94
2 -0.41 0.33 0.72 0.92 3 2.26 0.17 1.02
Interpretability evidence. Figure 1 shows individual performance data and the Thurstone
threshold item difficulty for Taiwanese and Finnish students. Each ‘X’ to the left of Figure 1
denotes one individual’s scientific imagination ability. The digit on the right denotes the item
Page 14
14
number corresponding to the second Thurstone threshold. Positive values indicate higher
levels of scientific imagination ability achieved by that individual; the higher the value for an
item, the less likely it was that the individual had achieved scientific imagination with regard
to that item. The item difficulty values for scientific imagination as measured by the
SIT-Verbal (MT = 0.24, MF = −0.04; SDT = 0.73, SDF = 1.03) were higher in the Taiwanese
and Finnish students than the scientific imagination scores for 5th and 6th graders (MT = −0.78,
MF = −0.61; SDT = 1.09, SDF = 0.99). Overall, the hierarchy of the scientific imagination
process was confirmed, with the exception of conceptualisation/organisation/formation.
Page 15
15
======================================= ========================================
person +item person +item
---------------------------------------- ---------------------------------------
| |
| |
| |
3 | 3 |
| |
| |
| |
| |
| |
2 | |
| 2 |
X| |
X| XXX|
X| XX|
XXX| |
XX|3.1 Transformation/Elaboration X|
1 XXX|4.1 Conceptualization XX|3.1 Transformation/Elaboration
XXX| /Organization/Formation 1 XXX|
XXXXX| XX|4.1 Conceptualization/Organization/Formation XXXXX| XXXXXX|
XXXX|2.1, 2.2 Brainstorming, Association XXXXXXXX|
XXXXX| XXXXX|
0 XXXXXXX| XXXXXX|2.2 Association
XXXXXXX|1.2 Association 0 XXXXXXX|
XXXXXX| XXXXXXXXX|2.1 Brainstorming
XXXXXXXXXX| XXXXXXXXX|
XXXXXXXX| XXXXXXX|
XXXXXXX|1.1 Brainstorming XXXXXXXXXX|1.2 Association
-1 XXXXXX| XXXXXXXXX|
XXXXX| XXXXXXXX|
XXXXX| -1 XXXXXX|
XX| XXXXXXX|
XXXX| XXXXXXXX|
XXXX| XXXXX|
-2 XX| XXXXX|
XX| XXXX|1.1 Brainstorming
XXX| XXXXX|
XX| -2 XXX|
XX| XXXXX|
X| XX|
-3 X| XX|
X| X|
| X|
X| -3 |
X| X|
| X|
-4 X| |
| X|
| |
| XX|
| -4 |
====================================== =========================================
Each 'X' represents 0.6 cases Each 'X' represents 0.5 cases
Taiwanese students Finnish students
====================================== ======================================== Figure 1. Individual performance data and second Thurstone threshold item difficulty for
Taiwanese and Finnish students.
Page 16
16
Table 4 lists the differences in scientific imagination due to gender and grade for the
Taiwanese and Finnish samples. Among the Taiwanese students, females (M = −0.31; SD =
0.80) significantly outperformed males (M = −1.19; SD = 1.16) on scientific imagination (t =
−3.84, p < .001). The results showed no significant difference between 5th (M = 0.42; SD =
0.88) and 6th graders (M = −0.82, SD = 1.09), as determined by a t-test (t = 1.60, p = .115).
Among the Finnish students, females (M = −0.42; SD = 0.72) outperformed males (M =
−0.83; SD = 1.20) on scientific imagination, but the t-test results showed that this difference
was not significant (t = −1.73, p = .089).
Table 4.
Means and standard deviations for scientific imagination scores according to gender and
grade. country Category (N) Scientific imagination
Taiwan Gender
Male (40) M -1.19
SD 1.16
Female (34) M -0.31
SD 0.80
Grade
5th grader (2)
M 0.42
SD 0.88
6th grader ( 72)
M -0.82
SD 1.09
Total (74)
M -0.79
SD 1.09 Finland Gender
Male (35) M -0.83 SD 1.20
Female (41) M -0.42 SD 0.73
Grade 5th grader (18) M -0.65
SD 1.18 6th grader (58) M -0.60
SD 0.94 Total (76) M -0.61
SD 0.99
Substantive evidence. Our results showed that the stronger the performance achieved by
the students, the greater likelihood of their reaching a higher level. For example, Figure 2
Page 17
17
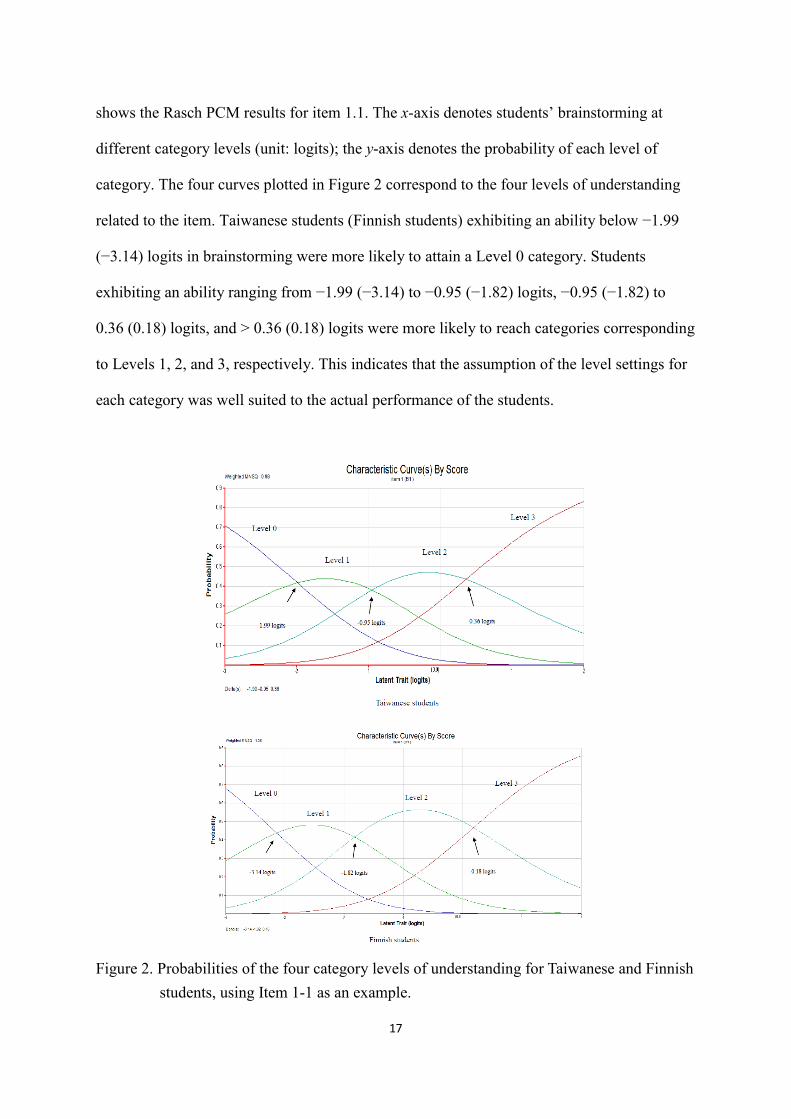
shows the Rasch PCM results for item 1.1. The x-axis denotes students’ brainstorming at
different category levels (unit: logits); the y-axis denotes the probability of each level of
category. The four curves plotted in Figure 2 correspond to the four levels of understanding
related to the item. Taiwanese students (Finnish students) exhibiting an ability below −1.99
(−3.14) logits in brainstorming were more likely to attain a Level 0 category. Students
exhibiting an ability ranging from −1.99 (−3.14) to −0.95 (−1.82) logits, −0.95 (−1.82) to
0.36 (0.18) logits, and > 0.36 (0.18) logits were more likely to reach categories corresponding
to Levels 1, 2, and 3, respectively. This indicates that the assumption of the level settings for
each category was well suited to the actual performance of the students.
Figure 2. Probabilities of the four category levels of understanding for Taiwanese and Finnish
students, using Item 1-1 as an example.
Page 18
18
Differences in scientific imagination between Taiwanese and Finnish students
Overall, the results showed no significant difference between Taiwanese (M = −0.79; SD
= 1.09) and Finnish students (M = −0.61, SD = 0.99), as determined by a t-test (t = −1.04, p
= .301, power = 0.30). As shown in Table 5, the category levels achieved by students on the
scientific imagination measures were similar for both countries. On item 1.1, most students
from both countries reached category 2. On item 1.2, most Taiwanese students reached
category 1, but the Finnish students reached category 2. On items 2.1 and 2.2, most students
from both countries reached category 1. On item 3.1, most Taiwanese students reached
category 0, but most Finnish students reached category 1. On item 4.1, most Taiwanese and
Finnish students reached category 0. To summarise, the assumption of the level setting for
each category was confirmed. In both countries, few students attained high levels of ability.
The results also indicated that the Finnish students performed slightly better than the
Taiwanese students for some components of scientific imagination. It would be worth
investigating the differences in scientific imagination between the two countries further
through a large-scale investigation.
Table 5.
Numbers in boldface indicate the level reached by the largest number of students. Country
item
Taiwan
(N=74)
Finland
(N=76)
Level of
category
Count PV1Avg:1 Level Count PV1Avg:1
1.1 0 14 -2.09 0 4 -2.76
1 20 -1.07 1 15 -1.01
2 24 -0.18 2 34 -0.70
3 16 0.51 3 23 -0.07
1.2 0 16 -1.84 0 13 -1.88
1 30 -0.71 1 27 -0.93
2 20 -0.13 2 29 -0.21
3 8 0.84 3 7 0.71
2.1 0 18 -1.74 0 15 -2.10
1 35 -0.56 1 31 -0.71
2 13 -0.05 2 20 0.05
3 8 0.61 3 10 0.12
2.2 0 18 -1.74 0 15 -2.10
1 36 -0.53 1 36 -0.67
2 16 0.04 2 23 0.16
Page 19
19
3 4 0.75 3 2 0.30
3.1 0 42 -1.11 0 26 -1.78
1 22 -0.10 1 38 -0.30
2 8 0.19 2 10 0.55
3 2 0.28 3 2 0.44
4.1 0 44 -1.10 0 32 -1.55
1 19 -0.03 1 29 -0.29
2 11 0.21 2 14 0.40
3 0 - 3 1 1.06
Note, PV1Avg:1 means the average ability of students responding in each category.
Discussion and conclusions
This exploratory study aimed to examine the validity of LP in scientific imagination of
elementary school students in Taiwan and Finland. It also explored differences in scientific
imagination due to gender and country of residence. Despite the small sample size, multiple
examples of the validity of LP in scientific imagination were effectively presented using the
Rasch analysis.
With respect to content and structural validity, the results indicated that all of the items
of the Chinese and Finnish versions of the SIT-Verbal had a good model–data fit. With regard
to generalisability, no DIF items were found between the countries. However, one gender DIF
item (item 1.1 measuring brainstorming: “Question 1: What problems might this situation
bring about? ... ”) was found in the Finnish sample. However, owing to the small sample size,
it is difficult to explain the occurrence of such a DIF or to make generalisations. This requires
further study using a larger sample size to provide more plausible explanations. In addition,
there was considerable person-separation reliability for scientific imagination among the
Taiwanese and Finnish students (Bond & Fox, 2007). With regard to substantive evidence,
our results showed that the higher the ability of the students, the greater the probability of
them choosing a higher level. This indicated that the assumption of the level setting for each
category was well aligned with the actual performance of the students.
With respect to interpretability, the results from both countries showed that the four
Page 20
20
components were hierarchical, with the exception of
conceptualisation/organisation/formation. This finding is consistent with results obtained by
Wang et al. (2015a, b), indicating that transformation/elaboration was highest among the four
components. Transformation/elaboration is defined as evidence that the student can
reorganise the physical features and functions of inventions to solve problems, and
conceptualisation/organisation/formation refers to the ability of students to refine their
previous activities to create a prototype for their specific ideas, including details related to the
choice of materials, techniques for assembling parts, and the means to create design diagrams
and final drafts based on their initial diagrams (Wang et al., 2015a, b). According to Ren et al.
(2012), students express their creativity in different ways at different ages. Younger students
prefer to express their thinking through drawings, as this is easier for elementary school
students than using language. Moreover, elementary school students’ thinking may suggest
alignment with scientific principles, but this may be difficult to determine based on their
limited cognitive abilities. In other words, the hierarchies of transformation/elaboration and
conceptualisation/organisation/formation may be different at elementary school level.
Therefore, we suggest further study with additional and more varied samples, including
pupils at junior and senior levels or even higher, to provide further evidence for LP related to
scientific imagination at different ages.
No significant differences in scientific imagination were found between the countries of
residence. With regard to gender, females outperformed males in Taiwan and Finland, but a
significant gender difference was found only in Taiwan. However, no significant difference in
scientific imagination due to gender was observed in a previous study by Wang et al. (2015a).
Previous research on creativity and imagination was inconclusive regarding gender-based
differences. To achieve a better understanding of the classroom performance of males and
females on tasks related to scientific imagination, further research should be conducted with
the focus on providing qualitative data, for example, based on interviews or observations
Page 21
21
pertaining to teacher-student and student-student interactions in instructional settings.
Finally, no significant difference was observed between Taiwanese and Finnish students.
However, Finnish students’ performance was slightly higher than that of Taiwanese students
in some components of scientific imagination. For example, the Finnish students created a
greater number of drawings than the Taiwanese students. These results echo the findings of
Liou and Lan (2016), who reported that Asian and Western students performed equally well
overall on tasks demanding creativity; however, Asian students performed well on practical
aspects, whereas Western students showed greater originality. Moreover, students belonging
to the same culture created similar products. Ward (1994) proposed that imagination is guided,
showing many common features reflecting similarity in structure and process. Hence, it
would be fruitful to conduct future research involving large-scale and detailed investigations
of differences in scientific imagination between the two countries.
Imagination undergoes various transformations over the course of a person’s
development (Eckhoff & Urbach, 2008; Vygotsky, 2004). As a result, the development and
verification of LP must be continuously revised throughout the developmental process to
accommodate the age of the learner (Shea & Duncan, 2013; Songer et al., 2009). In this study,
we succeeded in validating the scientific imagination process based on the LP of this concept
(Wang et al., 2015a, b) using Finnish and Taiwanese data. In other words, the scientific
imagination process might be deemed reliable and valid in two culturally different student
groups. Additional research is needed in the form of large-scale investigations between the
two countries and detailed comparisons using qualitative data to examine the differences in
scientific imagination between Finnish and Taiwanese elementary school students. Such
research would help future teachers to guide students to conduct scientific projects and
participate in scientific contests, and to foster multiple abilities from a number of different
perspectives.
Page 22
22
Reference
Adams, J. (2004). The imagination and social life. Qualitative Sociology, 27, 277-297. doi:
10.1023/B:QUAS.0000037619.28845.ef
Bond, T. & Fox, C. (2007). Applying the Rasch model: Fundamental measurement in the
human sciences (2nd). Mahwah, NJ: LEA.
Church, E. B. (2006). Let’s invent. Scholastic Parent & Child, 13, 28-35.
Cruz, H. D., & Smedt, J. D. (2010). Science as structured imagination. Journal of Creative
Behavior, 44, 29-44. doi: 10.1002/j.2162-6057.2010.tb01324.x
Department of Science Education (2009). 2009-intergrated program of Imagination and
technology research/nurture of implementation capacity. Cited from:
http://www.nsc.gov.tw/sci/ct.asp?xItem=16326&ctNode=3395
Eckhoff, A., & Urbach, J. (2008). Understanding imaginative thinking during childhood:
Sociocultural conceptions of creativity and imaginative thought. Early Childhood Educ
J, 36, 179-185. doi: 10.1007/s10643-008-0261-4
Grant, E. (2004). Scientific imagination in the middle ages. Perspectives on Science, 12,
394-423. doi: 10.1162/1063614042776021
Ho, H. C., Wang, C. C., & Cheng, Y. Y. (2013). Analysis of the Scientific Imagination
Process. Thinking Skills and Creativity, 10, 68-78.
Kim, K. H. (2005). Learning from each other: Creativity in East Asian and American
Education. Creativity Research Journal, 17, 337-347.
Lin, W. W. (2011). The Nurture of Imagination and Creation: Arkki, School of Architecture
for Children and Youth in Republic of Finland. Elementary Education, 51, 62-72. (In
Chinese)
Linacre, J. M. (1998). Thurstone thresholds and the Rasch model. Rasch Measurement
Transactions, 12, 634−635.
Liou S. & Lan X. (2016, forthcoming). Situational Salience of Norms Moderates Cultural
Differences in the Originality and Usefulness of Creative Ideas Generated or Selected by
Teams. Journal of Cross-cultural Psychology.
Luo, J. X., Olechowski, A. L., & Magee, C. L. (2014). Technology-based design and
sustainable economic growth. Technovation, 11, 663-677. doi:
10.1016/j.technovation.2012.06.005
Masters, G. N. (1982). A Rasch model for partial credit scoring. Psychometrika, 47, 149-174.
Meskanen, P. (2012) 'Encouraging Children and Youth to Participation, Get Involved,
International Symposium, Architectural and Built Environment Education for young
people. International Architecture Exhibition La Biennale di Venezia' Online. Available
http://www.baukulturvermittlung.at/wp/wp-content/plugins/download-monitor/downloa
d.php?id=132 (accessed 8 April 2013).
Messick, S. (1994). The interplay of evidence and consequences in the validation of
Page 23
23
performance assessments. Educational Researcher, 23, 13-23. doi:
10.3102/0013189X023002013
Messick, S. (1995a). Standards of validity and the validity of standards in performance
assessment. Educational Measurement: Issues and Practice, 14, 5-8. doi:
10.1111/j.1745-3992.1995.tb00881.x
Messick, S. (1995b). Validity of psychological assessment: Validation of inferences from
persons’ responses and performances as scientific inquiry into score meaning. American
Psychologist, 50, 741-749. doi: 10.1037/0003-066X.50.9.741
Ministry of Education Advisory Office (2012). Humanity and Social Science Education Plan.
Cited from: http://hss.edu.tw/plan_detail.php?class_plan=174
Mountain, V. (2007). Educational contexts for the development of children’s spirituality:
Exploring the use of imagination. International Journal of Children’s Spirituality, 12,
191-205. doi: 10.1080/13644360701467535
Niemi, H., Multisilta, J., Lipponen, L., & Vivitsou, V. (Eds.) 2014. Finnish Innovations and
Technologies in Schools. Towards New Ecosystems of Learning, Sense Publishers.
Reinikainen, P. (2012). Amazing PISA results in Finnish comprehensive schools. In H. Niemi,
& A. Kallioniemi, & A. Toom (Eds.), The Miracle of Education: The Principles and
Practices of Teaching and Learning In Finnish Schools (pp.3-18). Rotterdam: Sense.
Ren, F., Li, X., Zhang, H., & Wang, L. (2012). Progression of Chinese students’ creative
imagination from elementary through high school. International Journal of Science
Education, 34, 2043-2059. doi: 10.1080/09500693.2012.709334
Sahlberg, P. (2007). Education policies for raising student learning: The Finnish approach.
Journal of Education Policy, 22, 147-171.
Sala-i-Martín, X., Bilbao-Osorio, B., Battista, A. D., Hanouz, M. D., Geiger, T., & Galvan, C.
(2014). The global competitiveness index 2014-2015: Accelerating a robust recovery to
create productive jobs and support inclusive growth. Retrieved from
http://www3.weforum.org/docs/WEF_GlobalCompetitivenessReport_2014-15.pdf
Schumacker, R. E., & Smith, E. V., Jr. (2007). Reliability: A Rasch perspective. Educational
and Psychological Measurement, 67, 394-409.
Shea, N. A., & Duncan, R. G. (2013). From theory to data: The process of refining learning
progressions. The Journal of the Learning Sciences, 22, 7-32. doi:
10.1080/10508406.2012.691924
Songer, N. B., Kelcey, B., & Gotwals, A. W. (2009). How and when does complex reasoning
occur? Empirically driven development of a learning progression focused on complex
reasoning about biodiversity. Journal of Research in Science Teaching, 46, 610-631. doi:
10.1002/tea.20313
Vygotsky, S. L. (1930/2004). Imagination and creativity in childhood. Journal of Russian and
East European Psychology, 42, 7-97.
Page 24
24
Wang, C. C., Ho, H. C., & Cheng, Y. Y. (2015a). Building a learning progression for scientific
imagination: A measurement approach. Thinking Skills and Creativity, 17, 1-14. doi:
10.1016/j.tsc.2015.02.001
Wang, C. C., Ho, H. C., & Cheng, Y. Y. (2015b). Validation of the Scientific Imagination
Test-Verbal. Paper will present at the Pacific Rim Objective Measurement Symposium
(PROMS) 2015, Fukuoka, Japan
Ward, T. B. (1994). Structured imagination: The role of category structure in exemplar
generation. Cognitive Psychology, 27, 1-40.doi:10.1006/cogp.1994.1010
Wilson, M. (2005). Constructing measures: An item response modeling approach. Mahwah,
NJ: Erlbaum.
Wilson, M. (2009). Measuring processions: Assessment structures underlying a learning
progression. Journal of Research in Science Teaching, 46, 716-730. doi:
10.1002/tea.20318
Wolfe, E. W., & Smith, E. V., Jr. (2007). Instrument development tools and activities for
measure validation using Rasch models: Part II-Validation activities. Journal of Applied
Measurement, 8, 204-233.
Wu, J. J. (2002). Enticing the crouching tiger and awakening the hidden dragon: Recognizing
and nurturing creativity in Chinese students. Research in Applied Psychology, 15, 17-42.
(in Chinese)
Wu, M. L., Adams, R. J., & Wilson, M. R. (2007). ConQuest [Computer software and
manual]. Camberwell, Victoria, Australia: Australian Council for Educational Research.
Page 25
25
Appendix A: Scientific imagination and its indicators
Scientific
imagination
Abilities Scoring guides for student responses Description
of items
Level 4
Conceptu
alisation/o
rganisatio
n/formatio
n
4.1 Students can refine their previous activities to create a
prototype for implementing their specific ideas, including
details related to the choice of materials, techniques for
assembling parts, and the means of creating design diagrams
and final drafts from the initial diagrams.
4.1.1 Students cannot consider the possibilities of ideas and draw
them on the paper, including issues related to the choice of
materials, techniques for assembling parts, and the means of
creating design diagrams and final drafts from the initial
diagrams. (Level 0)
4.1.2 Students can roughly propose the idea of creation through
speaking or writing. (Level 1)
4.1.3 Students can propose the idea of creation through speaking
or writing and roughly consider the possibilities of ideas and
draw them on the paper, including the choice of material,
techniques for assembling parts, and the means of creating
design diagrams and final drafts from the initial diagrams.
(Level 2)
4.1.4 Students can draw a detailed draft of creation and illustrate
details for their choice of material, techniques for assembling
parts, and the means of creating design diagrams and final
drafts from the initial diagrams. (Level 3)
Mission 2
Level 3
Transform
ation/elab
oration
3.1 Student can reorganise the physical features and functions of
inventions to solve problems.
3.1.1Students cannot reorganize the physical features and
functions of creations to solve problems. (Level 0)
3.1.2 Students can reorganize one physical feature and function of
creations to solve problems. (Level 1)
3.1.3 Students can reorganize two physical features and functions
of creations to solve problems. (Level 2)
3.1.4 Students can reorganize at least three physical features and
functions of creations to solve problems. (Level 3)
Mission 2
Level 2
Associatio
n
2.2 Students can come up with possible solutions and illustrate
the physical features and functions of their inventions.
2.2.1 Students cannot illustrate and functions of their creations.
(Level 0)
2.2.2Students can illustrate one physical feature and function of
their creations. (Level 1)
2.2.3Students can illustrate two physical features and functions of
their creations. (Level 2)
2.2.4 Students can illustrate at least three physical features and
functions of creations. (Level 3)
Question 3,
Mission 1
Page 26
26
2.1 Students can specify problems relating to their life experience.
2.1.1 Students cannot specify problems correlate with life
experience. (Level 0)
2.1.2 Students can specify one problem correlate with life
experience. (Level 1)
2.1.3 Students can specify two problems correlate with life
experience. (Level 2)
2.1.4 Students can specify at least three problems correlate with
life experience. (Level 3)
Question 2,
Mission 1
Level 1
Brainstor
ming
1.2 Based on the problems identified, students can propose
solutions or inventions.
1.2.1 Students cannot propose solutions. (Level 0)
1.2.2 Students can propose one solution. (Level 1)
1.2.3 Students can propose two solutions. (Level 2)
1.2.4 Students can propose at least three solutions. (Level 3)
Question 3,
Mission 1
1.1 Based on the question scenario, students can specify the
problems (e.g. inconvenience) that a situation might bring
about.
1.1.1 Students cannot specify what problems (e.g., inconvenience
etc) the situation might bring about. (Level 0)
1.1.2 Students can specify one problem the situation might bring
about. (Level 1)
1.1.3 Students can specify two problems the situation might bring
about. (Level 2)
1.1.4 Students can specify at least three problems the situation
might bring about. (Level 3)
Question 1,
Mission 1
Note1. The words in bracket, (Level 0), (Level 1), (Level 2), and (Level 3) mean the level which students can
reach in this stage. Taking indicator 1.1 as an example, the lowest performance (Level 0) is students cannot
propose what problems (e.g., inconvenience) the situation might bring about for students’ brainstorming in
initiation stage; the highest performance (Level 3) is students can specify at least three problems the situation
might bring about.
Note2. From “Validation of the Scientific Imagination Test-Verbal”, by C. C. Wang, H. C. Ho, & Y. Y. Cheng.
2015, Paper presented at the Pacific Rim Objective Measurement Symposium (PROMS) 2015, Fukuoka, Japan.