Validation of predictive model for galvanic corrosion under thin electrolyte layers: An application to aluminium 2024-CFRP material combination S. Palani a,⇑ , T. Hack a , J. Deconinck b , H. Lohner c a EADS Innovation Works, Metallic Technologies & Surface Engineering (IW-MS), Building 6.1, Ludwig-Bölkow-Allee, D-85521 Ottobrunn, Germany b Research Group Electrochemical and Surface Engineering, Vrije Universiteit Brussel, Pleinlaan 2, 1050 Brussels, Belgium c Airbus Operations, Airbus Allee 1, 28199 Bremen, Germany article info Article history: Received 19 April 2013 Accepted 24 September 2013 Available online 1 October 2013 Keywords: A.aluminium B.modelling studies B.polarization C.atmospheric corrosion C.oxygen reduction C.pitting corrosion abstract An experimental setup was developed for the validation of a finite element model (FEM) for simulating galvanic corrosion occurring under very thin electrolyte for bi-material combination composed of alu- minium AA2024 and carbon-fibre reinforced polymer (CFRP). The validation approach is explained and the results obtained are presented. The main outcomes of the model are electric current density and potential distribution on the electrode surface. Good agreement has been obtained between measured and modelled data. Further parameter studies are discussed to show the effect of different physical prop- erties of the electrolyte on corrosion rates and total current changes in the materials involved. Ó 2013 Elsevier Ltd. All rights reserved. 1. Introduction Corrosion protection plays a very important role in the design and maintenance of aircraft. The mechanical properties of alloys currently used are the compromise of high specific strength and corrosion resistance. The extreme long aircraft design life requires durable protection systems to ensure acceptable operational cost while in-service. Inline with this objective, the corrosion protection should also be adequately optimised in-order to reduce design and manufacturing cost of the aircraft. The recent demand for better fuel-efficiency in aircraft industry has reflected an increase usage of more lightweight materials such as CFRP 1 and titanium, besides aluminium. The increase application of this ‘‘mixed materials’’ enhances the risk of galvanic corrosion when they are coupled in the presence of a corrosive electrolyte. New aircraft designs contain a high degree of CFRP materials, which are in contact with aluminium 2024 (AA2024-T3) in specific areas. Since the carbon fibres behave electrochemically like a noble metal, corrosion of the aluminium alloy can be induced. The basic principles of galvanic corrosion are quite established and generally well understood [1–3]. Scully et al. has demon- strated an experimental approach to validate a galvanic corrosion model [4]. The author made quantitative predictions of galvanic corrosion by finite element methods and compared it with long term measurements on heat exchanger tubes in seawater. Also, there have been numerous publications laying some background in the area of galvanic corrosion modelling [5–16]. On the other hand, numerous investigations [17–29] have shown that corrosion under thin electrolyte layer is very different from that in the bulk electrolyte due to oxygen transport and reduction kinetics. The thickness of the film may vary from nanometre to millimetre; however micrometre thicknesses are usually the range of interest when investigating atmospheric corrosion [25]. Specifically, struc- tures consisting of AA2024 and CFRP may experience different forms of corrosive environments, e.g. condensed water and melting of ice which could occur in the upper part of the inner aircraft structure. This can be generalised as thin layer electrolytes with variations in thickness and chemical composition. Quantitative knowledge of galvanic coupling under these various form of thin electrolyte films is useful in understanding corrosion mechanisms and in tailoring surface protection against galvanic corrosion. So far, very limited studies have addressed the galvanic corrosion be- tween AA2024 and CFRP [30–34]. More effort has been focused on general corrosion and particularly on the influence of the ion species in solution and the influence of cathodic impurity elements in the alloy on the general corrosion rate for aluminium alloys [35]. The influence of the electrolyte involves many factors such as pH, temperature, 0010-938X/$ - see front matter Ó 2013 Elsevier Ltd. All rights reserved. http://dx.doi.org/10.1016/j.corsci.2013.09.003 ⇑ Corresponding author. Tel.: +49 4215386335; fax: +49 4215383081. E-mail address: [email protected](S. Palani). 1 Carbon Fibre Reinforced Polymer. Corrosion Science 78 (2014) 89–100 Contents lists available at ScienceDirect Corrosion Science journal homepage: www.elsevier.com/locate/corsci
Transcript
Corrosion Science 78 (2014) 89–100
Contents lists available at ScienceDirect
Corrosion Science
journal homepage: www.elsevier .com/ locate /corsc i
Validation of predictive model for galvanic corrosion under thinelectrolyte layers: An application to aluminium 2024-CFRP materialcombination
0010-938X/$ - see front matter � 2013 Elsevier Ltd. All rights reserved.http://dx.doi.org/10.1016/j.corsci.2013.09.003
An experimental setup was developed for the validation of a finite element model (FEM) for simulatinggalvanic corrosion occurring under very thin electrolyte for bi-material combination composed of alu-minium AA2024 and carbon-fibre reinforced polymer (CFRP). The validation approach is explained andthe results obtained are presented. The main outcomes of the model are electric current density andpotential distribution on the electrode surface. Good agreement has been obtained between measuredand modelled data. Further parameter studies are discussed to show the effect of different physical prop-erties of the electrolyte on corrosion rates and total current changes in the materials involved.
� 2013 Elsevier Ltd. All rights reserved.
1. Introduction
Corrosion protection plays a very important role in the designand maintenance of aircraft. The mechanical properties of alloyscurrently used are the compromise of high specific strength andcorrosion resistance. The extreme long aircraft design life requiresdurable protection systems to ensure acceptable operational costwhile in-service. Inline with this objective, the corrosion protectionshould also be adequately optimised in-order to reduce design andmanufacturing cost of the aircraft.
The recent demand for better fuel-efficiency in aircraft industryhas reflected an increase usage of more lightweight materials suchas CFRP1 and titanium, besides aluminium. The increase applicationof this ‘‘mixed materials’’ enhances the risk of galvanic corrosionwhen they are coupled in the presence of a corrosive electrolyte.New aircraft designs contain a high degree of CFRP materials, whichare in contact with aluminium 2024 (AA2024-T3) in specific areas.Since the carbon fibres behave electrochemically like a noble metal,corrosion of the aluminium alloy can be induced.
The basic principles of galvanic corrosion are quite establishedand generally well understood [1–3]. Scully et al. has demon-strated an experimental approach to validate a galvanic corrosion
model [4]. The author made quantitative predictions of galvaniccorrosion by finite element methods and compared it with longterm measurements on heat exchanger tubes in seawater. Also,there have been numerous publications laying some backgroundin the area of galvanic corrosion modelling [5–16]. On the otherhand, numerous investigations [17–29] have shown that corrosionunder thin electrolyte layer is very different from that in the bulkelectrolyte due to oxygen transport and reduction kinetics. Thethickness of the film may vary from nanometre to millimetre;however micrometre thicknesses are usually the range of interestwhen investigating atmospheric corrosion [25]. Specifically, struc-tures consisting of AA2024 and CFRP may experience differentforms of corrosive environments, e.g. condensed water and meltingof ice which could occur in the upper part of the inner aircraftstructure. This can be generalised as thin layer electrolytes withvariations in thickness and chemical composition. Quantitativeknowledge of galvanic coupling under these various form of thinelectrolyte films is useful in understanding corrosion mechanismsand in tailoring surface protection against galvanic corrosion. Sofar, very limited studies have addressed the galvanic corrosion be-tween AA2024 and CFRP [30–34].
More effort has been focused on general corrosion andparticularly on the influence of the ion species in solution andthe influence of cathodic impurity elements in the alloy on thegeneral corrosion rate for aluminium alloys [35]. The influence ofthe electrolyte involves many factors such as pH, temperature,
90 S. Palani et al. / Corrosion Science 78 (2014) 89–100
composition and concentration of the ions and the conductivity ofthe electrolyte. The influence of electrolyte conductivity on gal-vanic corrosion has been previously stated by Waber [36] in-termsof ‘‘macroscopic’’ and ‘‘microscopic’’ galvanic cells, or in-terms ofthe Wagner number [36,37].
The main objective of modelling galvanic corrosion is to tailorthe corrosion protection measures for ‘‘mixed material’’ structureswithout performing a huge amount of laboratory testing. A crucialaspect of computational modelling for galvanic corrosion is its con-nection with reality, and its reliability as a predictive tool, and forthis reason the validation step of any model is as important as anyother aspect of the model. This paper generally describes the devel-opment of a validation technique which was successfully used tovalidate the Finite Element Method (FEM) based computationalpredictive model namely Elsyca Galvanic Master. The validationapproach consists of comparing the experimental measurementsof galvanic coupling current, under very thin electrolytes from13 lm to 45 lm obtained between untreated ‘‘macroscopic’’AA2024–CFRP coplanar electrodes with the predictions comingfrom the equivalent computational model.
2. Galvanic corrosion AA2024–CFRP
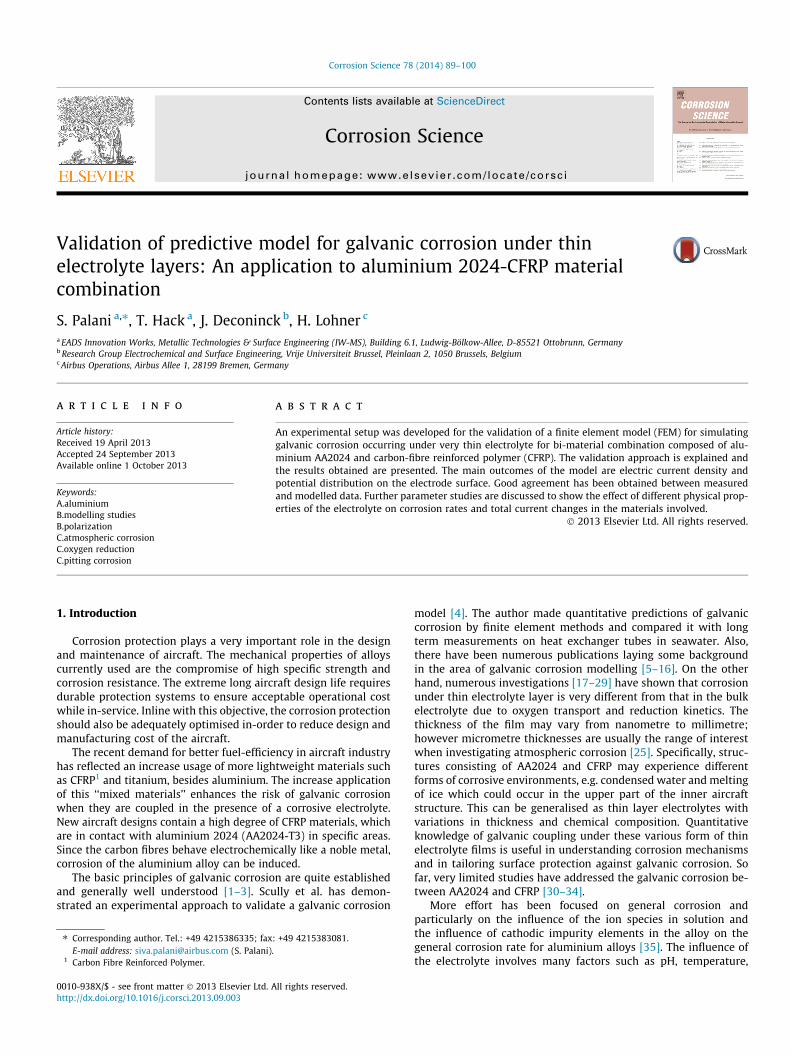
When CFRP and AA2024 are galvanically coupled with the pres-ence of electrolyte, ionic current flows through the electrolyte fromcathodic to the anodic areas. They are balanced by electron flowthrough the electrodes.
Galvanic corrosion under thin electrolyte features differentcharacteristics in mass transport, conductivity, change of liquidlayer chemistry due to the formation of reaction products. Besidesit also has different characteristics compared to those of a bulkelectrolyte. Under thin electrolyte, the oxygen transport is muchhigher than in bulk electrolyte, as the film thickness is very low.Under conditions of lowered relative humidity, which permits ra-pid evaporation, convective mixing in the condensed layer furtherhastens the arrival of dissolved oxygen at the cathode. Both thecharacteristics of the moisture film can result in an increase in gal-vanic corrosion rate.
From Fig. 1 the resistance of the electrodes RCFRP and RAA2024 areassumed to be zero, due to the fact that they are almost negligiblein value since there is a direct electrical contact in comparison tothe other resistances. In the event one of the resistance becomesextremely high e.g. at low conductivity electrolyte or in the pres-ence of a coating system on any one of the electrodes, no signifi-cant corrosion rates due to galvanic effect are possible except forself corrosion of AA2024. In-service, there are more complicatedinteractions among these factors, e.g. Rel depends on the geometri-cal shape of the electrolyte path between the anode and cathode.
Fig. 1. (a) Simplified galvanic corrosion macroscopic element for AA2024–CFRP and (belectron oxygen reduction step.
3. Governing equations
The mathematical model is based on the potential model. Thissection gives a short overview of the equations to be solved bythe model and the boundary conditions applied.
3.1. Electrolyte
Considering no ion diffusion effects, Ohm’s law describes thecurrent density proportional to the electric field, E:
r E!¼ �r � ~ru ð1Þ
E!
is the electric field (V m�1), r the conductivity (X�1 m�1), u is thepotential (V).
With the proportionality factor being the conductivity. Express-ing current conservation in local form yields the Laplace-equation,which is a partial differential equation of second order [5]:~r � ð�r~ruÞ ¼ 0 ð2Þ
Since the electrolyte in this investigation is treated as a homoge-neous ohmic conductor, which may not always be the case, theequation simplifies to:
r2u ¼ 0 ð3Þ
The local corrosion rate at any point on the surface of AA2024 cou-pled with CFRP is related to the local current density and can be pre-dicted if the potential distribution is known [5]. For that purpose,proper boundary conditions are to be imposed. They describe in aquantified way the kinetics of the reactions at the interface betweenelectrodes involved and the electrolyte i.e. the polarisation curve.They are usually non-linear and are acquired in an experimentalway. Polarisation curves could also be defined mathematically as:
jN ¼ f ðuÞ ð4Þ
jN is the normal current density on anode/cathode (A m�2).In the case of thin electrolytes the change of electrolyte thick-
ness affects a number of processes as mentioned in the precedingsection. Therefore, in this investigation in-order to obtain the mostrepresentative input data, RDE (Rotating Disc Electrode) experi-ments were performed for the acquisition of electrochemical prop-erties of the involved materials. Through this method, a stable masstransport is achieved via convection–diffusion that is well defined.
4. Experiments
4.1. Polarisation data
The galvanic corrosion validation activity is done on variousaqueous electrolyte film thicknesses containing sodium chloride
) simplified galvanic corrosion macroscopic circuit model exemplarily for direct 4
S. Palani et al. / Corrosion Science 78 (2014) 89–100 91
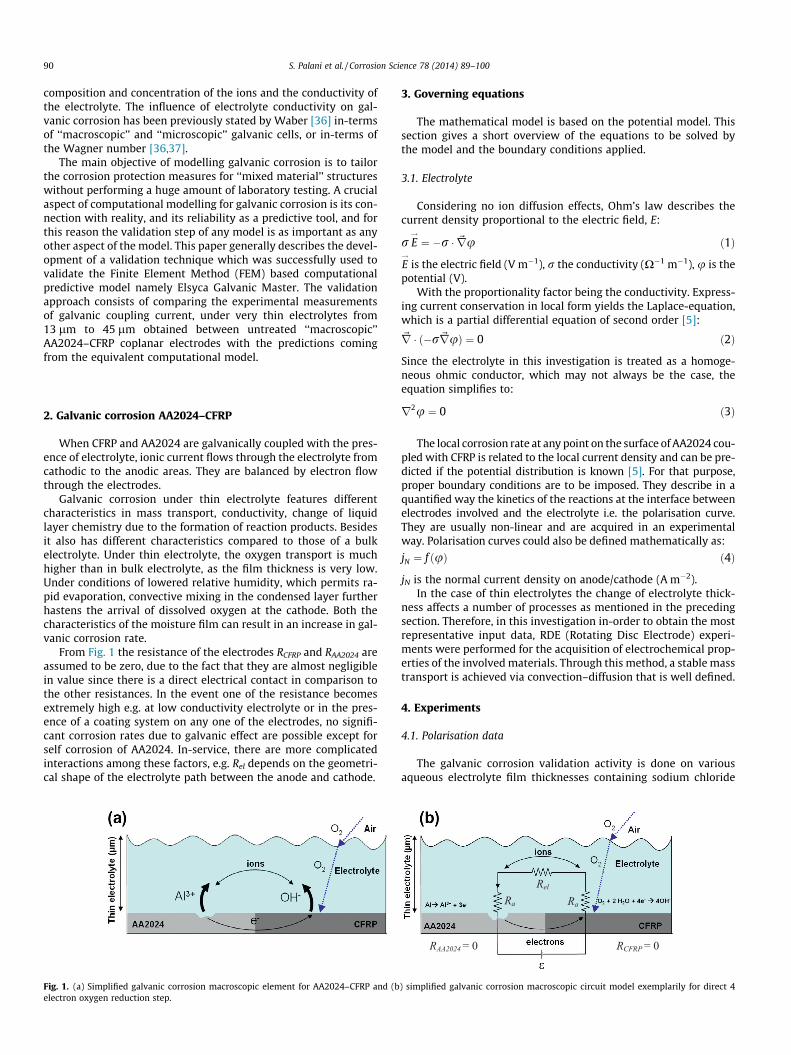
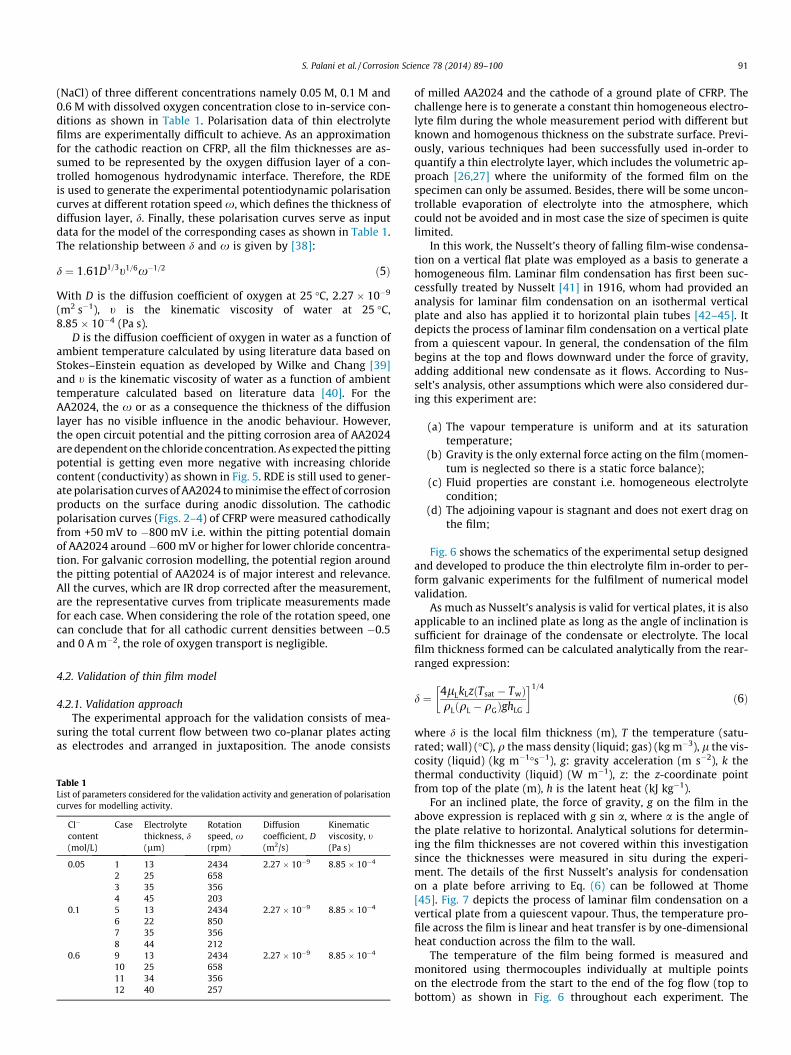
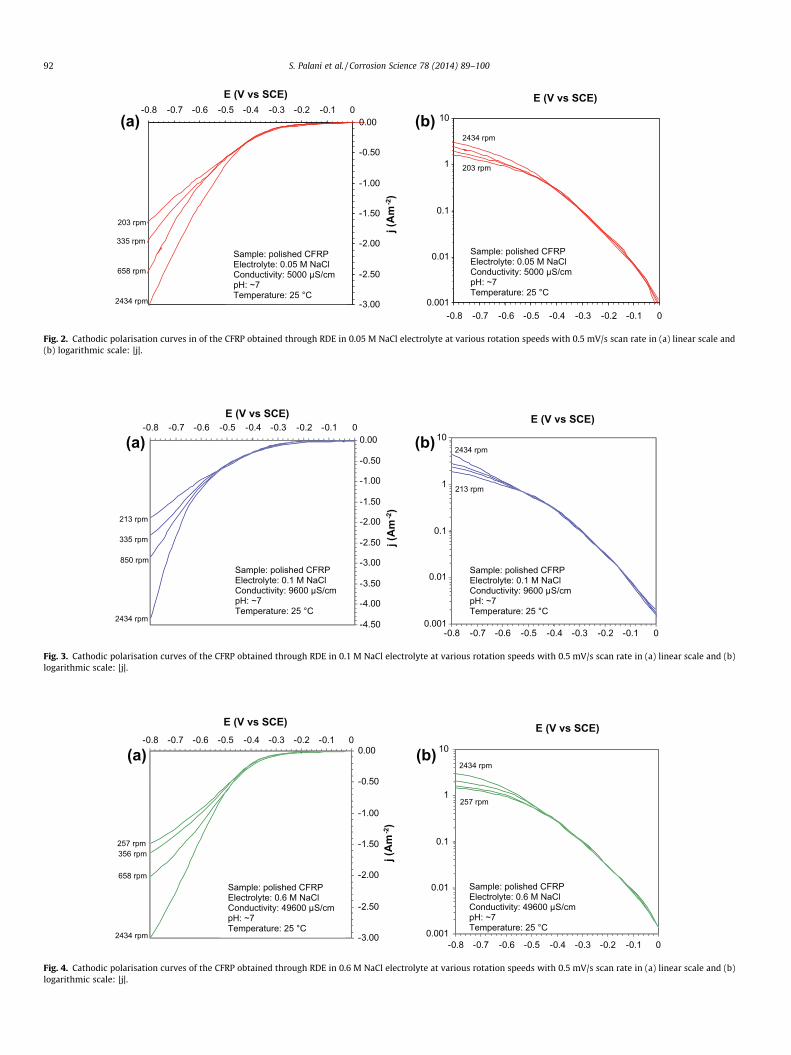
(NaCl) of three different concentrations namely 0.05 M, 0.1 M and0.6 M with dissolved oxygen concentration close to in-service con-ditions as shown in Table 1. Polarisation data of thin electrolytefilms are experimentally difficult to achieve. As an approximationfor the cathodic reaction on CFRP, all the film thicknesses are as-sumed to be represented by the oxygen diffusion layer of a con-trolled homogenous hydrodynamic interface. Therefore, the RDEis used to generate the experimental potentiodynamic polarisationcurves at different rotation speed x, which defines the thickness ofdiffusion layer, d. Finally, these polarisation curves serve as inputdata for the model of the corresponding cases as shown in Table 1.The relationship between d and x is given by [38]:
d ¼ 1:61D1=3t1=6x�1=2 ð5Þ
With D is the diffusion coefficient of oxygen at 25 �C, 2.27 � 10�9
(m2 s�1), t is the kinematic viscosity of water at 25 �C,8.85 � 10�4 (Pa s).
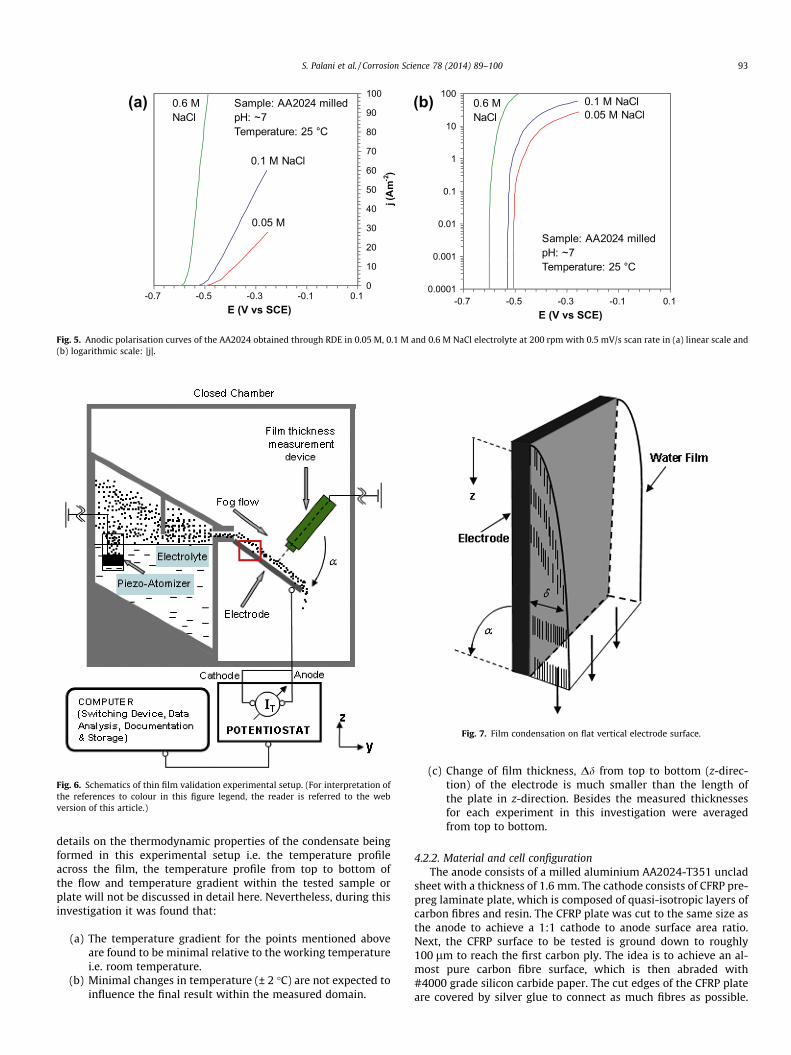
D is the diffusion coefficient of oxygen in water as a function ofambient temperature calculated by using literature data based onStokes–Einstein equation as developed by Wilke and Chang [39]and t is the kinematic viscosity of water as a function of ambienttemperature calculated based on literature data [40]. For theAA2024, the x or as a consequence the thickness of the diffusionlayer has no visible influence in the anodic behaviour. However,the open circuit potential and the pitting corrosion area of AA2024are dependent on the chloride concentration. As expected the pittingpotential is getting even more negative with increasing chloridecontent (conductivity) as shown in Fig. 5. RDE is still used to gener-ate polarisation curves of AA2024 to minimise the effect of corrosionproducts on the surface during anodic dissolution. The cathodicpolarisation curves (Figs. 2–4) of CFRP were measured cathodicallyfrom +50 mV to �800 mV i.e. within the pitting potential domainof AA2024 around�600 mV or higher for lower chloride concentra-tion. For galvanic corrosion modelling, the potential region aroundthe pitting potential of AA2024 is of major interest and relevance.All the curves, which are IR drop corrected after the measurement,are the representative curves from triplicate measurements madefor each case. When considering the role of the rotation speed, onecan conclude that for all cathodic current densities between �0.5and 0 A m�2, the role of oxygen transport is negligible.
4.2. Validation of thin film model
4.2.1. Validation approachThe experimental approach for the validation consists of mea-
suring the total current flow between two co-planar plates actingas electrodes and arranged in juxtaposition. The anode consists
Table 1List of parameters considered for the validation activity and generation of polarisationcurves for modelling activity.
Cl�
content(mol/L)
Case Electrolytethickness, d(lm)
Rotationspeed, x(rpm)
Diffusioncoefficient, D(m2/s)
Kinematicviscosity, t(Pa s)
0.05 1 13 2434 2.27 � 10�9 8.85 � 10�4
2 25 6583 35 3564 45 203
0.1 5 13 2434 2.27 � 10�9 8.85 � 10�4
6 22 8507 35 3568 44 212
0.6 9 13 2434 2.27 � 10�9 8.85 � 10�4
10 25 65811 34 35612 40 257
of milled AA2024 and the cathode of a ground plate of CFRP. Thechallenge here is to generate a constant thin homogeneous electro-lyte film during the whole measurement period with different butknown and homogenous thickness on the substrate surface. Previ-ously, various techniques had been successfully used in-order toquantify a thin electrolyte layer, which includes the volumetric ap-proach [26,27] where the uniformity of the formed film on thespecimen can only be assumed. Besides, there will be some uncon-trollable evaporation of electrolyte into the atmosphere, whichcould not be avoided and in most case the size of specimen is quitelimited.
In this work, the Nusselt’s theory of falling film-wise condensa-tion on a vertical flat plate was employed as a basis to generate ahomogeneous film. Laminar film condensation has first been suc-cessfully treated by Nusselt [41] in 1916, whom had provided ananalysis for laminar film condensation on an isothermal verticalplate and also has applied it to horizontal plain tubes [42–45]. Itdepicts the process of laminar film condensation on a vertical platefrom a quiescent vapour. In general, the condensation of the filmbegins at the top and flows downward under the force of gravity,adding additional new condensate as it flows. According to Nus-selt’s analysis, other assumptions which were also considered dur-ing this experiment are:
(a) The vapour temperature is uniform and at its saturationtemperature;
(b) Gravity is the only external force acting on the film (momen-tum is neglected so there is a static force balance);
(c) Fluid properties are constant i.e. homogeneous electrolytecondition;
(d) The adjoining vapour is stagnant and does not exert drag onthe film;
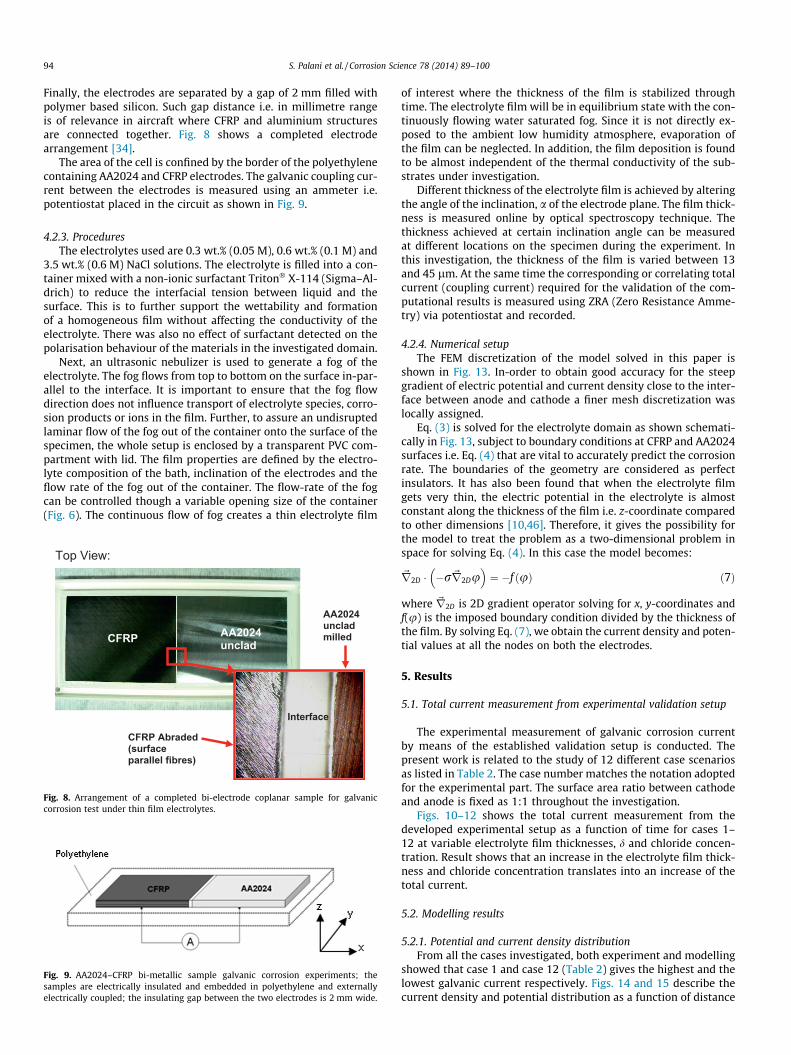
Fig. 6 shows the schematics of the experimental setup designedand developed to produce the thin electrolyte film in-order to per-form galvanic experiments for the fulfilment of numerical modelvalidation.
As much as Nusselt’s analysis is valid for vertical plates, it is alsoapplicable to an inclined plate as long as the angle of inclination issufficient for drainage of the condensate or electrolyte. The localfilm thickness formed can be calculated analytically from the rear-ranged expression:
d ¼ 4lLkLzðTsat � TwÞqLðqL � qGÞghLG
� �1=4
ð6Þ
where d is the local film thickness (m), T the temperature (satu-rated; wall) (�C), q the mass density (liquid; gas) (kg m�3), l the vis-cosity (liquid) (kg m�1�s�1), g: gravity acceleration (m s�2), k thethermal conductivity (liquid) (W m�1), z: the z-coordinate pointfrom top of the plate (m), h is the latent heat (kJ kg�1).
For an inclined plate, the force of gravity, g on the film in theabove expression is replaced with g sin a, where a is the angle ofthe plate relative to horizontal. Analytical solutions for determin-ing the film thicknesses are not covered within this investigationsince the thicknesses were measured in situ during the experi-ment. The details of the first Nusselt’s analysis for condensationon a plate before arriving to Eq. (6) can be followed at Thome[45]. Fig. 7 depicts the process of laminar film condensation on avertical plate from a quiescent vapour. Thus, the temperature pro-file across the film is linear and heat transfer is by one-dimensionalheat conduction across the film to the wall.
The temperature of the film being formed is measured andmonitored using thermocouples individually at multiple pointson the electrode from the start to the end of the fog flow (top tobottom) as shown in Fig. 6 throughout each experiment. The
-3.00
-2.50
-2.00
-1.50
-1.00
-0.50
0.00-0.8 -0.7 -0.6 -0.5 -0.4 -0.3 -0.2 -0.1 0
E (V vs SCE)
j (A
m-2)
2434 rpm
335 rpm
658 rpm
203 rpm
Sample: polished CFRP Electrolyte: 0.05 M NaCl Conductivity: 5000 µS/cm pH: ~7 Temperature: 25 °C
0.001
0.01
0.1
1
10
-0.8 -0.7 -0.6 -0.5 -0.4 -0.3 -0.2 -0.1 0
E (V vs SCE)
Sample: polished CFRP Electrolyte: 0.05 M NaCl Conductivity: 5000 µS/cm pH: ~7 Temperature: 25 °C
2434 rpm
203 rpm
(b)(a)
Fig. 2. Cathodic polarisation curves in of the CFRP obtained through RDE in 0.05 M NaCl electrolyte at various rotation speeds with 0.5 mV/s scan rate in (a) linear scale and(b) logarithmic scale: |j|.
-4.50
-4.00
-3.50
-3.00
-2.50
-2.00
-1.50
-1.00
-0.50
0.00-0.8 -0.7 -0.6 -0.5 -0.4 -0.3 -0.2 -0.1 0
E (V vs SCE)
j (A
m-2)
335 rpm
850 rpm
2434 rpm
Sample: polished CFRP Electrolyte: 0.1 M NaCl Conductivity: 9600 µS/cm pH: ~7 Temperature: 25 °C
213 rpm
0.001
0.01
0.1
1
10
-0.8 -0.7 -0.6 -0.5 -0.4 -0.3 -0.2 -0.1 0
E (V vs SCE)
Sample: polished CFRP Electrolyte: 0.1 M NaCl Conductivity: 9600 µS/cm pH: ~7 Temperature: 25 °C
2434 rpm
213 rpm
(b)(a)
Fig. 3. Cathodic polarisation curves of the CFRP obtained through RDE in 0.1 M NaCl electrolyte at various rotation speeds with 0.5 mV/s scan rate in (a) linear scale and (b)logarithmic scale: |j|.
-3.00
-2.50
-2.00
-1.50
-1.00
-0.50
0.00-0.8 -0.7 -0.6 -0.5 -0.4 -0.3 -0.2 -0.1 0
E (V vs SCE)
j (A
m-2)
2434 rpm
257 rpm
658 rpm
356 rpm
Sample: polished CFRP Electrolyte: 0.6 M NaCl Conductivity: 49600 µS/cm pH: ~7 Temperature: 25 °C 0.001
0.01
0.1
1
10
-0.8 -0.7 -0.6 -0.5 -0.4 -0.3 -0.2 -0.1 0
E (V vs SCE)
257 rpm
2434 rpm
Sample: polished CFRP Electrolyte: 0.6 M NaCl Conductivity: 49600 µS/cm pH: ~7 Temperature: 25 °C
(b)(a)
Fig. 4. Cathodic polarisation curves of the CFRP obtained through RDE in 0.6 M NaCl electrolyte at various rotation speeds with 0.5 mV/s scan rate in (a) linear scale and (b)logarithmic scale: |j|.
92 S. Palani et al. / Corrosion Science 78 (2014) 89–100
0
10
20
30
40
50
60
70
80
90
100
E (V vs SCE)
j (A
m-2
)
0.6 M NaCl
0.1 M NaCl
0.05 M
Sample: AA2024 milledpH: ~7Temperature: 25 °C
0.0001
0.001
0.01
0.1
1
10
100
-0.7 -0.5 -0.3 -0.1 0.1 -0.7 -0.5 -0.3 -0.1 0.1E (V vs SCE)
0.6 M NaCl
0.1 M NaCl0.05 M NaCl
Sample: AA2024 milledpH: ~7Temperature: 25 °C
(b)(a)
Fig. 5. Anodic polarisation curves of the AA2024 obtained through RDE in 0.05 M, 0.1 M and 0.6 M NaCl electrolyte at 200 rpm with 0.5 mV/s scan rate in (a) linear scale and(b) logarithmic scale: |j|.
Fig. 6. Schematics of thin film validation experimental setup. (For interpretation ofthe references to colour in this figure legend, the reader is referred to the webversion of this article.)
Fig. 7. Film condensation on flat vertical electrode surface.
S. Palani et al. / Corrosion Science 78 (2014) 89–100 93
details on the thermodynamic properties of the condensate beingformed in this experimental setup i.e. the temperature profileacross the film, the temperature profile from top to bottom ofthe flow and temperature gradient within the tested sample orplate will not be discussed in detail here. Nevertheless, during thisinvestigation it was found that:
(a) The temperature gradient for the points mentioned aboveare found to be minimal relative to the working temperaturei.e. room temperature.
(b) Minimal changes in temperature (± 2 �C) are not expected toinfluence the final result within the measured domain.
(c) Change of film thickness, Dd from top to bottom (z-direc-tion) of the electrode is much smaller than the length ofthe plate in z-direction. Besides the measured thicknessesfor each experiment in this investigation were averagedfrom top to bottom.
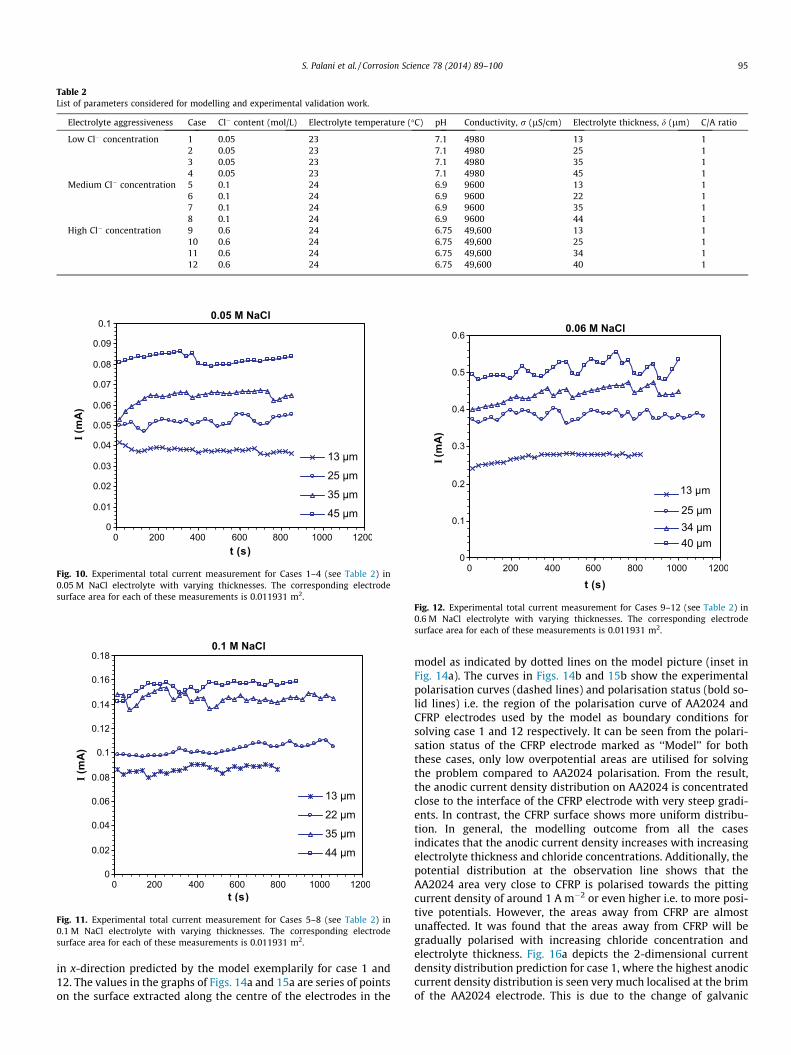
4.2.2. Material and cell configurationThe anode consists of a milled aluminium AA2024-T351 unclad
sheet with a thickness of 1.6 mm. The cathode consists of CFRP pre-preg laminate plate, which is composed of quasi-isotropic layers ofcarbon fibres and resin. The CFRP plate was cut to the same size asthe anode to achieve a 1:1 cathode to anode surface area ratio.Next, the CFRP surface to be tested is ground down to roughly100 lm to reach the first carbon ply. The idea is to achieve an al-most pure carbon fibre surface, which is then abraded with#4000 grade silicon carbide paper. The cut edges of the CFRP plateare covered by silver glue to connect as much fibres as possible.
94 S. Palani et al. / Corrosion Science 78 (2014) 89–100
Finally, the electrodes are separated by a gap of 2 mm filled withpolymer based silicon. Such gap distance i.e. in millimetre rangeis of relevance in aircraft where CFRP and aluminium structuresare connected together. Fig. 8 shows a completed electrodearrangement [34].
The area of the cell is confined by the border of the polyethylenecontaining AA2024 and CFRP electrodes. The galvanic coupling cur-rent between the electrodes is measured using an ammeter i.e.potentiostat placed in the circuit as shown in Fig. 9.
4.2.3. ProceduresThe electrolytes used are 0.3 wt.% (0.05 M), 0.6 wt.% (0.1 M) and
3.5 wt.% (0.6 M) NaCl solutions. The electrolyte is filled into a con-tainer mixed with a non-ionic surfactant Triton� X-114 (Sigma–Al-drich) to reduce the interfacial tension between liquid and thesurface. This is to further support the wettability and formationof a homogeneous film without affecting the conductivity of theelectrolyte. There was also no effect of surfactant detected on thepolarisation behaviour of the materials in the investigated domain.
Next, an ultrasonic nebulizer is used to generate a fog of theelectrolyte. The fog flows from top to bottom on the surface in-par-allel to the interface. It is important to ensure that the fog flowdirection does not influence transport of electrolyte species, corro-sion products or ions in the film. Further, to assure an undisruptedlaminar flow of the fog out of the container onto the surface of thespecimen, the whole setup is enclosed by a transparent PVC com-partment with lid. The film properties are defined by the electro-lyte composition of the bath, inclination of the electrodes and theflow rate of the fog out of the container. The flow-rate of the fogcan be controlled though a variable opening size of the container(Fig. 6). The continuous flow of fog creates a thin electrolyte film
Interface
CFRP AA2024unclad
CFRP Abraded(surface parallel fibres)
AA2024 uncladmilled
Top View:
Fig. 8. Arrangement of a completed bi-electrode coplanar sample for galvaniccorrosion test under thin film electrolytes.
Fig. 9. AA2024–CFRP bi-metallic sample galvanic corrosion experiments; thesamples are electrically insulated and embedded in polyethylene and externallyelectrically coupled; the insulating gap between the two electrodes is 2 mm wide.
of interest where the thickness of the film is stabilized throughtime. The electrolyte film will be in equilibrium state with the con-tinuously flowing water saturated fog. Since it is not directly ex-posed to the ambient low humidity atmosphere, evaporation ofthe film can be neglected. In addition, the film deposition is foundto be almost independent of the thermal conductivity of the sub-strates under investigation.
Different thickness of the electrolyte film is achieved by alteringthe angle of the inclination, a of the electrode plane. The film thick-ness is measured online by optical spectroscopy technique. Thethickness achieved at certain inclination angle can be measuredat different locations on the specimen during the experiment. Inthis investigation, the thickness of the film is varied between 13and 45 lm. At the same time the corresponding or correlating totalcurrent (coupling current) required for the validation of the com-putational results is measured using ZRA (Zero Resistance Amme-try) via potentiostat and recorded.
4.2.4. Numerical setupThe FEM discretization of the model solved in this paper is
shown in Fig. 13. In-order to obtain good accuracy for the steepgradient of electric potential and current density close to the inter-face between anode and cathode a finer mesh discretization waslocally assigned.
Eq. (3) is solved for the electrolyte domain as shown schemati-cally in Fig. 13, subject to boundary conditions at CFRP and AA2024surfaces i.e. Eq. (4) that are vital to accurately predict the corrosionrate. The boundaries of the geometry are considered as perfectinsulators. It has also been found that when the electrolyte filmgets very thin, the electric potential in the electrolyte is almostconstant along the thickness of the film i.e. z-coordinate comparedto other dimensions [10,46]. Therefore, it gives the possibility forthe model to treat the problem as a two-dimensional problem inspace for solving Eq. (4). In this case the model becomes:
~r2D � �r~r2Du� �
¼ �f ðuÞ ð7Þ
where ~r2D is 2D gradient operator solving for x, y-coordinates andf(u) is the imposed boundary condition divided by the thickness ofthe film. By solving Eq. (7), we obtain the current density and poten-tial values at all the nodes on both the electrodes.
5. Results
5.1. Total current measurement from experimental validation setup
The experimental measurement of galvanic corrosion currentby means of the established validation setup is conducted. Thepresent work is related to the study of 12 different case scenariosas listed in Table 2. The case number matches the notation adoptedfor the experimental part. The surface area ratio between cathodeand anode is fixed as 1:1 throughout the investigation.
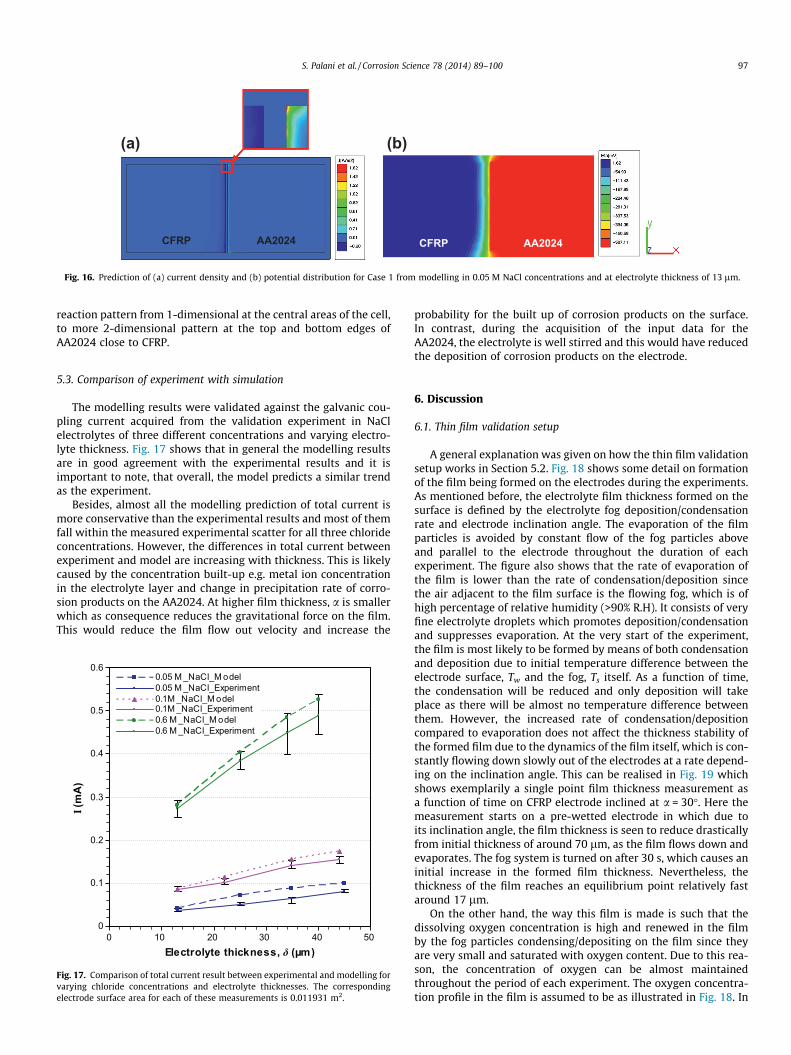
Figs. 10–12 shows the total current measurement from thedeveloped experimental setup as a function of time for cases 1–12 at variable electrolyte film thicknesses, d and chloride concen-tration. Result shows that an increase in the electrolyte film thick-ness and chloride concentration translates into an increase of thetotal current.
5.2. Modelling results
5.2.1. Potential and current density distributionFrom all the cases investigated, both experiment and modelling
showed that case 1 and case 12 (Table 2) gives the highest and thelowest galvanic current respectively. Figs. 14 and 15 describe thecurrent density and potential distribution as a function of distance
Table 2List of parameters considered for modelling and experimental validation work.
Electrolyte aggressiveness Case Cl� content (mol/L) Electrolyte temperature (�C) pH Conductivity, r (lS/cm) Electrolyte thickness, d (lm) C/A ratio
Fig. 10. Experimental total current measurement for Cases 1–4 (see Table 2) in0.05 M NaCl electrolyte with varying thicknesses. The corresponding electrodesurface area for each of these measurements is 0.011931 m2.
Fig. 11. Experimental total current measurement for Cases 5–8 (see Table 2) in0.1 M NaCl electrolyte with varying thicknesses. The corresponding electrodesurface area for each of these measurements is 0.011931 m2.
Fig. 12. Experimental total current measurement for Cases 9–12 (see Table 2) in0.6 M NaCl electrolyte with varying thicknesses. The corresponding electrodesurface area for each of these measurements is 0.011931 m2.
S. Palani et al. / Corrosion Science 78 (2014) 89–100 95
in x-direction predicted by the model exemplarily for case 1 and12. The values in the graphs of Figs. 14a and 15a are series of pointson the surface extracted along the centre of the electrodes in the
model as indicated by dotted lines on the model picture (inset inFig. 14a). The curves in Figs. 14b and 15b show the experimentalpolarisation curves (dashed lines) and polarisation status (bold so-lid lines) i.e. the region of the polarisation curve of AA2024 andCFRP electrodes used by the model as boundary conditions forsolving case 1 and 12 respectively. It can be seen from the polari-sation status of the CFRP electrode marked as ‘‘Model’’ for boththese cases, only low overpotential areas are utilised for solvingthe problem compared to AA2024 polarisation. From the result,the anodic current density distribution on AA2024 is concentratedclose to the interface of the CFRP electrode with very steep gradi-ents. In contrast, the CFRP surface shows more uniform distribu-tion. In general, the modelling outcome from all the casesindicates that the anodic current density increases with increasingelectrolyte thickness and chloride concentrations. Additionally, thepotential distribution at the observation line shows that theAA2024 area very close to CFRP is polarised towards the pittingcurrent density of around 1 A m�2 or even higher i.e. to more posi-tive potentials. However, the areas away from CFRP are almostunaffected. It was found that the areas away from CFRP will begradually polarised with increasing chloride concentration andelectrolyte thickness. Fig. 16a depicts the 2-dimensional currentdensity distribution prediction for case 1, where the highest anodiccurrent density distribution is seen very much localised at the brimof the AA2024 electrode. This is due to the change of galvanic
97112
Interface = 2
123 123
262
Top View:
All dimensions in millimetres
AA2024CFRP
Fig. 13. Mesh discretisation of the bi-metallic galvanic corrosion model, viewed from below the electrodes.
-3
-2
-1
0
1
2
3
-0.7 -0.6 -0.5 -0.4 -0.3 -0.2 -0.1 0
E (V vs SCE)
AA2024CFRPModel
IRdrop
Kinetics regime
Mixed-diffusion regime
AA2024Pitting Current
-590
-490
-390
-290
-190
-90
10
0 0.05 0.1 0.15 0.2 0.25Distance in x-axis (m)
E (V
vs
SCE)
-0.20
0.00
0.20
0.40
0.60
0.80
1.00
j (A
m-2)
Current Density[A/m²]Potential Distribution[mV]
Interface
CFRP AA2024
Electrolyte: 0.05 M NaClFilm Thickness: 13 µm
(a) (b)
Fig. 14. Plot of (a) current density and potential profile prediction by the model on the surface along the centre and across the model and (b) polarisation state of electrodesduring simulation for Case 1.
-3
0
3
6
9
12
15
18
21
24
-0.7 -0.6 -0.5 -0.4 -0.3 -0.2 -0.1 0
E (V vs SCE)
AA2024CFRPModel
jmax, CFRP
jmax, AA2024
-690
-590
-490
-390
-290
-190
-90
10
0 0.05 0.1 0.15 0.2 0.25Distance in x-axis (m)
E (V
vs
SCE)
-1
0
1
2
3
4
5
6
7
j (A
m-2)
Potential Distribution[mV]Current Density[A/m²]
CFRP AA2024
Electrolyte: 0.6 M NaCl Film Thickness: 40 µm
(b)(a)
Fig. 15. Plot of (a) current density and potential profile prediction by the model on the surface along the centre and across the model and (b) polarisation state of electrodesduring simulation for Case 12.
96 S. Palani et al. / Corrosion Science 78 (2014) 89–100
AA2024CFRP AA2024CFRP
(a) (b)
Fig. 16. Prediction of (a) current density and (b) potential distribution for Case 1 from modelling in 0.05 M NaCl concentrations and at electrolyte thickness of 13 lm.
S. Palani et al. / Corrosion Science 78 (2014) 89–100 97
reaction pattern from 1-dimensional at the central areas of the cell,to more 2-dimensional pattern at the top and bottom edges ofAA2024 close to CFRP.
5.3. Comparison of experiment with simulation
The modelling results were validated against the galvanic cou-pling current acquired from the validation experiment in NaClelectrolytes of three different concentrations and varying electro-lyte thickness. Fig. 17 shows that in general the modelling resultsare in good agreement with the experimental results and it isimportant to note, that overall, the model predicts a similar trendas the experiment.
Besides, almost all the modelling prediction of total current ismore conservative than the experimental results and most of themfall within the measured experimental scatter for all three chlorideconcentrations. However, the differences in total current betweenexperiment and model are increasing with thickness. This is likelycaused by the concentration built-up e.g. metal ion concentrationin the electrolyte layer and change in precipitation rate of corro-sion products on the AA2024. At higher film thickness, a is smallerwhich as consequence reduces the gravitational force on the film.This would reduce the film flow out velocity and increase the
Fig. 17. Comparison of total current result between experimental and modelling forvarying chloride concentrations and electrolyte thicknesses. The correspondingelectrode surface area for each of these measurements is 0.011931 m2.
probability for the built up of corrosion products on the surface.In contrast, during the acquisition of the input data for theAA2024, the electrolyte is well stirred and this would have reducedthe deposition of corrosion products on the electrode.
6. Discussion
6.1. Thin film validation setup
A general explanation was given on how the thin film validationsetup works in Section 5.2. Fig. 18 shows some detail on formationof the film being formed on the electrodes during the experiments.As mentioned before, the electrolyte film thickness formed on thesurface is defined by the electrolyte fog deposition/condensationrate and electrode inclination angle. The evaporation of the filmparticles is avoided by constant flow of the fog particles aboveand parallel to the electrode throughout the duration of eachexperiment. The figure also shows that the rate of evaporation ofthe film is lower than the rate of condensation/deposition sincethe air adjacent to the film surface is the flowing fog, which is ofhigh percentage of relative humidity (>90% R.H). It consists of veryfine electrolyte droplets which promotes deposition/condensationand suppresses evaporation. At the very start of the experiment,the film is most likely to be formed by means of both condensationand deposition due to initial temperature difference between theelectrode surface, Tw and the fog, Ts itself. As a function of time,the condensation will be reduced and only deposition will takeplace as there will be almost no temperature difference betweenthem. However, the increased rate of condensation/depositioncompared to evaporation does not affect the thickness stability ofthe formed film due to the dynamics of the film itself, which is con-stantly flowing down slowly out of the electrodes at a rate depend-ing on the inclination angle. This can be realised in Fig. 19 whichshows exemplarily a single point film thickness measurement asa function of time on CFRP electrode inclined at a = 30�. Here themeasurement starts on a pre-wetted electrode in which due toits inclination angle, the film thickness is seen to reduce drasticallyfrom initial thickness of around 70 lm, as the film flows down andevaporates. The fog system is turned on after 30 s, which causes aninitial increase in the formed film thickness. Nevertheless, thethickness of the film reaches an equilibrium point relatively fastaround 17 lm.
On the other hand, the way this film is made is such that thedissolving oxygen concentration is high and renewed in the filmby the fog particles condensing/depositing on the film since theyare very small and saturated with oxygen content. Due to this rea-son, the concentration of oxygen can be almost maintainedthroughout the period of each experiment. The oxygen concentra-tion profile in the film is assumed to be as illustrated in Fig. 18. In
Condensation of fog particle
Evaporation of film particle
Electrolyte particle
Electrode
Air (< 50% R.H)
> 90% R.H
z
y
xα
[O2]
Fig. 18. Illustration of close-up for thin film formation on an inclined flat electrode (red box indicated in Fig. 6).
Fig. 19. Electrolyte film formation as a function of time on an inclined CFRP surface.
98 S. Palani et al. / Corrosion Science 78 (2014) 89–100
any case, in the thin films like the one considered here, the refresh-ment of the electrolyte due to the flow conditions in this setup isnot expected to further increase the oxygen concentration at theelectrode surface. Here, the oxygen access is expected to be largerwhich would favour the oxygen reduction reactions. Moreover, thefilm flow velocity is very low and expected to be ideally zero at theelectrode surface. As for the modelling, the oxygen concentrationparameter is dictated by the polarisation curve created usingRDE, in which there is also a constant vertical flow of electrolytehigh in oxygen from the bulk towards the electrode surface duringthe measurement.
6.2. Potential and current density distribution
From Figs. 14 and 15 is to be interpreted that the current den-sity distribution on AA2024 is highly non-uniform especially for avery low electrolyte thickness compared to CFRP. For case 1, thepotential on AA2024 also varies only at areas close to CFRP i.e.up to 4 mm away from interface. The closest area shows the mostpositive potential of �470 mV. The rest of the area away from theinterface shows almost constant and uniformly distributed poten-tial (Fig. 16b). In case 12 there were almost no potential variationsfor areas of AA2024 around 10 mm away from the interface toCFRP. On the contrary, the potential of the CFRP varied most nega-tive closest to AA2024 and the most positive furthest from the
interface for both the cases due to the galvanic coupling. The shiftin the potential profile to more negative values in case 12 com-pared to case 1 is caused by the decrease in the pitting potentialof AA2024 with higher chloride content of the electrolyte.
Looking at the rest of the cases, one observes a very small catho-dic current on CFRP surface distant from AA2024. This is combinedwith relatively small potential variations especially when the elec-trolyte film gets thinner. For example in Fig. 14a, the regions ofCFRP which are around 40 mm away from the interface showsapparently the open circuit potential i.e. 0 mV, meaning theseareas are not contributing to the galvanic coupling with AA2024.This is also verified during experimental measurement, wherethere is no effect on the total current measured when the electro-lyte film on areas of CFRP away from the AA2024 is wiped off. Thisis due to the apparent reason that the galvanic corrosion is underohmic resistance control as the gap between the two electrodesis relatively big. In this study the gap is 2 mm and the electrodesize is macroscopic in scale compared to the electrolyte thickness.Therefore, the ohmic potential drop in the electrolyte composedmost of the potential difference between CFRP and AA2024. Onecould further support this with the polarisation status (seeFig. 14b) of the electrode for case 1 from the model, where an oh-mic (IR) drop around 85 mV due to electrolyte resistance and dis-tance can be visualised. In general, the model predicted that thecathodic reaction for all the investigated cases is kinetically lim-ited. However in case 12 (Fig. 15b), the cathodic reaction is foundto be at the transition between kinetic limited to mixed diffusionregime, at lease at the areas closest to AA2024. One could expectthis due to the minimal effect from electrolyte resistance and dis-tance in comparison to other tested cases.
In any case, the model considered here is predicting the integralvalues of current densities and potentials, and not the pitting ofAA2024 as such. But one could say that when the current densityexceeds a given value, the probability for pitting is very high. Theboundary conditions in Fig. 5 are an integral value of anodic disso-lution rate for a defined AA2024 surface area in different solutions.Similarly, the model prediction using these boundary conditionsfor the coplanar geometry also in principal shows the integral cor-rosion area on AA2024 in-terms of current density and potentialdistribution. As shown earlier, this is concentrated close to inter-face and CFRP. Implicitly it shows that pitting will be very highat these areas which are also inline with experimental findings.
Table 3List of maximum local anodic and cathodic current density values predicted by themodel.
Electrolyte concentration (M) Maximum local current density, jmax (A m�2)
Cathode Anode
0.05 �0.29 2.510.1 �0.42 5.220.6 �0.71 18.98
S. Palani et al. / Corrosion Science 78 (2014) 89–100 99
The particular concentration pattern is expected due to the effectof polarisation resistance of AA2024, geometry, electrolyte thick-ness and conductivity.
6.3. Electrolyte thickness
Generally, preceding literature states that the galvanic couplingcurrent under thin electrolyte conditions is dependent on the elec-trolyte thickness, as long as the layer is near to or smaller than thediffusion layer thickness. This is also evident from the measuredpolarisation curves as previously shown. However, this investiga-tion shows that galvanic current is the highest for the thickest elec-trolyte i.e. 40 lm in 0.6 M NaCl and lowest for the thinnestelectrolyte i.e. 13 lm in 0.05 M NaCl, simply due to the distancebetween the electrodes which is high in comparison to the electro-lyte thickness investigated and the cell size is macroscopic in scale.Consequently, a decrease in the electrolyte thickness will increasethe resistance of the galvanic cell and reduce the galvanic current,leading to a larger potential change on the CFRP electrode. In re-sult, increasing CFRP surface area to support oxygen reductionreaction, in-parallel would increase the ohmic resistance contribu-tion eventually changing the potential distribution, rendering twoopposite effects. However, through the FEM model prediction, thelatter is found to be more dominant in current investigation.
6.4. Electrolyte concentration
Electrolyte or the environmental conditions especially the elec-trolyte resistance, is a governing factor in galvanic corrosion.Fig. 17 depicts also the effect of NaCl concentration on the galvaniccoupling current of AA2024–CFRP for different electrolyte thick-nesses. The fluctuation in the galvanic coupling current in variouschloride concentrations shows the effect of anions on the reactionkinetics especially for the AA2024. The modelling prediction showsthat the potential on the CFRP is very much dependent on the resis-tance or concentration of the electrolyte. The increase in solutionresistance reduces the total current the cathode can provide. Theelectrolyte resistance in a simple 2D plan parallel cell arrangementcould be calculated using equation [1,6]:
Rel ¼L
rdwð8Þ
where L is the length of the cell or distance between AA2024 andCFRP, d the electrolyte thickness, w the electrode width at the inter-face and r the electrolyte conductivity. Electrolyte resistance, Rel isa determining element to the measured galvanic current and there-fore it can be deduced that Rel is directly influenced by distance be-tween the electrodes, and are inversely proportional to product ofelectrolyte thickness, electrode width and electrolyte conductivity.Therefore, if the product is kept at constant, the result will remainthe same for the same imposed boundary conditions: geometricalconfiguration and polarisation curve. In effect, shows that the elec-trolyte concentration and thickness has an equal effect on a givengalvanic coupling situation.
6.5. Polarisation status of CFRP and AA2024
The galvanic coupling current for macroscopic cell is found tobe mostly limited by ohmic resistance due to the distance betweenthe electrodes, electrolyte conductivity and thickness. On the CFRP,it is found from simulation (Figs. 14 and 15) that the maximum lo-cal cathodic current density, jmax for all cases investigated lies be-low �1 A m�2, as shown in Table 3.
Therefore in the present case, one could generally state that to-tal current density for CFRP, jtotal,CFRP is equal to only current den-sity due to charge transfer kinetics, jkinetics,CFRP and no mass
transfer effect i.e. jtotal,CFRP = jkinetics,CFRP. So, the CFRP exhibits onlycontributions in the kinetics region of the oxygen reduction whichis independent of rotation speed during the galvanic coupling.Hence for modelling, it gives us the possibility to employ a singlepolarisation curve from CFRP for all the 12 cases considered here.However, it may no longer be the case when the geometry is chan-ged, the gap between these electrodes is reduced tremendouslyand the conductivity of the electrolyte rises. In the event this oc-curs, the polarisation curve of AA2024 will be shifting to more neg-ative potentials and the ohmic resistance will also be reducing atthe same time, which means CFRP will already be in mixed kineticsand mass transfer regime, in which the diffusion rate of oxygenwill start dominating the cathodic current density.
7. Conclusion
An experimental set-up has been established for validation ofthe computational results on macroscopic co-planar bi-metallicgalvanic corrosion cell under very thin electrolyte layers. The prin-ciple of the experimental setup, homogeneity and reproducibilityof electrolyte film with no geometry size limitation achievedthrough this setup is the enabling factor for the validation activity.Next, a model considering a co-planar unpainted bi-material com-bination composed exemplarily of aluminium AA2024-T3 uncladand carbon fibre reinforced polymer (CFRP) had been developed.The main assumption made for both experimental and computa-tional model, is the conductivity of the thin electrolyte layer onthe bi-material combination is isotropic during each investigation.A FEM based predictive computational model for galvanic corro-sion under very thin electrolyte layers was validated for multi-material structures exposed to thin aqueous layer of NaCl electro-lytes in specific application case scenarios appearing in an aircraftenvironment. The results predicted by the developed computa-tional model for galvanic corrosion has been compared againstexperimental measurements. In total, 12 different cases wereinvestigated experimentally, in which the modelling results werevalidated in-terms of galvanic coupling current. These includesvariations in properties of the thin electrolyte film i.e. concentra-tion, thickness and complemented with some discussion on kinet-ics of oxygen reduction on cathodic current.
Generally, the trends and galvanic coupling current results ob-tained from the Elsyca Galvanic Master model are in good agree-ment with the experimental measurements. The galvanic currentis found to be under ohmic control, in which is sensitively depen-dent on concentration and thickness of the electrolyte layer. Whenconcentration and thickness of the electrolyte layer decreases, thecurrent density on AA2024 is concentrated at narrow edge, closestto the CFRP, resulting in a very steep distribution on AA2024.Hence, both model and experiment shows that most of the catho-dic current contribution from CFRP electrode is coming from areasup to a critical distance from AA2024, beyond which there is nofurther increase in galvanic coupling current under thin electrolyteconditions. On the other hand, it is observed from the model elec-trode polarisation status for all cases that the cathodic current den-sity from CFRP is almost just limited to charge transfer kinetics and
100 S. Palani et al. / Corrosion Science 78 (2014) 89–100
no mass transfer effects are seen during the galvanic coupling withAA2024.
In any case, the limitations and applicability of polarisation dataof the involved materials which acts as an input to the model mustbe well understood and known prior, to further exploit the model-ling results qualitative and quantitatively. The result of this inves-tigation, led to the development of an effective thin electrolytegalvanic cell for the purpose of validation of computational numer-ical model. In addition, it grants a basis for further investigation ongalvanic corrosion protection of multi-material structures sup-ported by good validation achieved for the cases considered. Thecomputational model can now be used for sensitivity studies in-or-der for a better understanding on the galvanic corrosion phenom-ena occurring under thin electrolytes for design of experimentsand also for practical reasons.
Acknowledgements
This work has been supported by the European Commission 6thFramework Program Project ‘‘SICOM’’ (Contract No. 030804) andAirbus Operations GmbH, Germany.
References
[1] H. Kaesche, Die Korrosion der Metalle, third ed., Springer Verlag, 1990.[2] P.R. Roberge, Corrosion Engineering Principles and Practice, first ed., McGraw-
Hill Professional, United States of America, 2008.[3] J.W. Oldfield, Electrochemical theory of galvanic corrosion, in: H.P. Hack (Ed.),
Galvanic Corrosion, ASTM STP 978, American Society for Testing and Materials,Philadelphia, 1988, pp. 5–22.
[4] J.R. Scully, H.P. Hack, Prediction of tube-tubesheet galvanic corrosion usingfinite element and Wagner number analyses, in: H.P. Hack (Ed.), GalvanicCorrosion, ASTM STP 978, American Society for Testing and Materials,Philadelphia, 1988, pp. 136–157.
[5] R.S. Munn, A mathematical model for galvanic anode cathodic protectionsystem, Mat. Per. 21 (1982) 29–41.
[7] R.A. Adey, S. Niku, Computer Modelling of Galvanic Corrosion, in: H.P. Hack(Ed.), Galvanic Corrosion, ASTM STP 978, American Society for Testing andMaterials, Philadelphia, 1988, pp. 96–117.
[8] R.G. Kelly, F. Cui, J. Presuel-Moreno, Computational modelling of cathodiclimitations on localized corrosion of wetted SS316L at room temperature,Corros. Sci. 47 (2005) 2987–3005.
[9] A. Atrens, J.X. Jia, G. Song, Experimental measurement and computersimulation of galvanic corrosion of magnesium coupled to steel, Adv. Eng.Mater. 9 (2007) 65–74.
[10] B. Vuillemin, F. Thébault, R. Oltra, C. Allely, K. Ogle, Modeling bimetalliccorrosion under thin electrolyte films, Corros. Sci. 53 (2011) 201–207.
[11] R. Oltra, N. Murer, B. Vuillemin, O. Néel, Numerical modelling of the galvaniccoupling in aluminium alloys: a discussion on the application of local probetechniques, Corros. Sci. 52 (2010) 130–139.
[12] J.-M. Lee, Numerical analysis of galvanic corrosion of Zn/Fe interface beneath athin electrolyte, Electrochim. Acta 51 (2006) 3256–3260.
[13] Mark. Verbrugge, Galvanic corrosion over a semi-infinite, planar surface,Corros. Sci. 48 (2006) 3489–3512.
[14] K.B. Deshpande, Validated numerical modelling of galvanic corrosion forcouples: magnesium alloy (AE44)-mild steel and AE44-aluminium alloy(AA6063) in brine solution, Corros. Sci. 52 (2010) 3514–3522.
[15] K. Amaya, S. Aoki, Effective boundary element methods in corrosion analysis,Eng. Anal. Boundary Elem. 27 (2003) 507–519.
[16] O.C. Zienkiewicz, The Finite Element Method, third ed., McGraw Hill, NewDelhi, 1977.
[17] G. Song, B. Johannesson, S. Hapugoda, D. St John, Galvanic corrosion ofmagnesium alloy AZ91D in contact with an aluminium alloy, steel and zinc,Corros. Sci. 46 (2004) 955–977.
[18] M. Yamashita, H. Nagano, R.A. Oriani, Dependence of corrosion potential andcorrosion rate of a low-alloy steel upon depth of aqueous solution, Corros. Sci.40 (1998) 1447–1453.
[19] J.T. Waber, M. Rosenbluth, Mathematical studies on galvanic corrosion, II.Coplanar electrodes with one electrode infinitely large with equal polarizationparameters, J. Electrochem. Soc. 102 (1955) 344–353.
[20] J.T. Waber, B. Fagan, Mathematical studies on galvanic corrosion, IV. Influenceof electrolyte thickness on potential and current distributions over coplanarelectrodes using polarization parameters, J. Electrochem. Soc. 103 (1956) 64–72.
[21] J.T. Waber, J. Morrissey, J. Ruth, Mathematical studies on galvanic corrosion V.Calculation of the average value of the corrosion current parameter, J.Electrochem. Soc. 103 (1956) 138–147.
[22] E. Kennard, J.T. Waber, Mathematical study on galvanic corrosion: equalcoplanar anode and cathode with unequal polarization parameters, J.Electrochem. Soc. 117 (1970) 880–885.
[23] R. Morris, W. Smyrl, Current and potential distribution in thin electrolyte layergalvanic cells, J. Electrochem. Soc. 136 (1989) 3229–3236.
[24] R. Morris, W. Smyrl, Galvanic interactions on random heterogeneous surfaces,J. Electrochem. Soc. 136 (1989) 3237–3248.
[25] A. de Rooij, L. Cavalli, Bimetallic compatibility for space applications, in: Proc.of the 10th ISMSE & 8th ICPMSE, Collioure, France, 2006.
[26] X.G. Zhang, E.M. Valeriote, Galvanic protection of steel and galvanic corrosionof zinc under thin layer electrolytes, Corros. Sci. 34 (1993) 1957–1972.
[27] A.P. Yadav, H. Katayama, K. Noda, H. Masuda, A. Nishikata, T. Tsuru, Surfacepotential distribution over a zinc/steel galvanic couple corroding under thinlayer of electrolyte, Electrochim. Acta 52 (2007) 3121–3129.
[28] Y.L. Cheng, Z. Zhang, F.H. Cao, J.F. Li, J.Q. Zhang, J.M. Wang, C.N. Cao, A study ofthe corrosion of aluminium alloy 2024-T3 under thin electrolyte layers, Corros.Sci. 46 (2004) 1649–1667.
[29] W. Kautek, The galvanic corrosion of steel coatings: aluminium in comparisonto cadmium and zinc, Corros. Sci. 28 (1988) 173–199.
[30] A.R.G. Brown, D.E. Coomber, Behaviour of couples of aluminium and plasticsreinforced with carbon fibre in aqueous salt solutions, Br. Corros. J. 7 (1972).
[31] B. Bozzini, A. Fanigliulo, An electrochemical investigation into the galvaniccorrosion of carbon steel coupled to carbon fibres, Mater. Corros. 53 (2002)875–885.
[32] A. Peratta, T. Hack, R. Adey, J. Baynham, H. Lohner, Eurocorr, 2009.[33] R. Adey, T. Hack, A. Peratta, S. Palani, H. Lohner, Macroscale galvanic corrosion
modelling of an aluminium alloy, in: J. DeRose, T. Suter, T. Hack, R.A. Adey(Eds.), Aluminium Alloy Corrosion of Aircraft Structures: Modelling andSimulation, WIT Press, Southampton, 2013, pp. 95–128.
[34] S. Palani, T. Hack, A. Peratta, R. Adey, H. Lohner, Modelling approach forgalvanic corrosion protection of multi-material aircraft structures, in: DoDCorrosion Conference, NACE International, California, 2011.
[35] L.C. Abodi, J.A. DeRose, S. Van Damme, A. Demeter, T. Suter, J. Deconinck,Modeling localized aluminum alloy corrosion in chloride solutions under non-equilibrium conditions: steps toward understanding pitting initiation,Electrochim. Acta 63 (2012) 169–178.
[36] J.T. Waber, Study of a size effect in galvanic corrosion, Corrosion 13 (1957) 95–102.
[37] C. Wagner, J. Electrochem. Soc. 98 (1951) 116.[38] V.G. Levich, Physicochemical Hydrodynamics, Prentice Hall, Englewood Cliffs,
NJ, 1962.[39] C.R. Wilke, P. Chang, Correlation of diffusion coefficients in dilute solutions,
AIChE J. 1 (1955) 264–270.[40] W.M. Haynes, CRC Handbook of Chemistry and Physics, 91st ed., CRC Press,
Florida, 2010–2011.[41] W. Nusselt, Die Oberflächenkondesation des Wasserdampfes, Z. Ver. Dt. Ing. 60
(1916) 541–546.[42] M.M. Chen, An analytical study of laminar film condensation, II: single and
multiple horizontal tubes, J. Heat Transfer 83 (1961) 55–60.[43] S.L. Chen, F.M. Gerner, C.L. Tien, General film condensation correlations, Exp.
Heat Transfer 1 (1987) 93–107.[44] L. Phan, A. Narain, Nonlinear stability of the classical Nusselt problem of film
condensation and wave effects, ASME J. Appl. Mech. (2007).[45] J.R. Thome, Engineering Data Handbook III, Wolverine Tube, Inc, 2010.[46] W.J. Schwerdtfeger, R.J. Manuele, Corrosion 19 (1963) 59–68.