Page 1
VALIDATION OF THE FACET SATISFACTON SCALE (FSS):
AN EVALUATIVE APPROACH TO ASSESSING
FACET JOB SATISFACTION
Terence Eng Siong Yeoh, M.S.
Dissertation Prepared for the Degree of
DOCTOR OF PHILOSOPHY
UNIVERSITY OF NORTH TEXAS
December 2011
APPROVEDD:
Linda L. Marshall, Major Professor Joseph W. Huff, Co-Major Professor Paul L. Lambert, Committee Member Clifton E. Watkins, Committee Member Vicki L. Campbell, Chair of the Department
of Psychology James D. Meernik, Acting Dean of the
Toulouse Graduate School
Page 2
Yeoh, Terence Eng Siong.Validation of the Facet Satisfaction Scale (FSS): An
Evaluative Approach to Assessing Facet Job Satisfaction. Doctor of Philosophy (Industrial and
Organizational Psychology), December 2011, 82 pp., 25 tables, 2 illustrations, references, 136
titles.
Job satisfaction has, and continues to be an important construct of interest to researchers
and practitioners alike. However, conflicting operational definitions and inconsistent
measurement systems have reduced the efficacy of the construct in predicting important job-
related outcomes for organizations and their employees. The Facet Satisfaction Scale (FSS) was
designed to overcome these deficiencies by creating a facet-based measure that assesses job
satisfaction in accordance with recent definitions of the construct. Reliability and validity
analyses were conducted on both the complete and shortened version of the scale. The FSS
exhibited evidence of reliability (ranging from .52 to .93 for the shortened FSS, and .53 to .96 for
the complete FSS). Evidence of scale validity was also obtained through the use of construct,
content, and criterion-related validity measures. Implications of the study on future research on
job satisfaction are discussed.
Page 3
ii
Copyright 2011
by
Terence Eng Siong Yeoh
Page 4
iii
TABLE OF CONTENTS
Page
LIST OF TABLES ......................................................................................................................... iv
LIST OF ILLUSTRATIONS ......................................................................................................... vi
1. INTRODUCTION ...................................................................................................................... 1
Validation of the Facet Satisfaction Scale (FSS): An Evaluative Approach to Assessing Facet Job Satisfaction ......................................................................................................... 1
Brief History of Job Satisfaction......................................................................................... 2
Defining Job Satisfaction .................................................................................................... 5
Measuring Job Satisfaction ............................................................................................... 10
Global Versus Facet Job Satisfaction ............................................................................... 11
Response Scale Selection .................................................................................................. 15
Use of Single Item Facet Measures .................................................................................. 17
Scale Validation ................................................................................................................ 21
Summary and Hypotheses ................................................................................................. 25
2. METHODS ............................................................................................................................... 28
Participants ........................................................................................................................ 28
Procedure .......................................................................................................................... 29
Measures ........................................................................................................................... 31
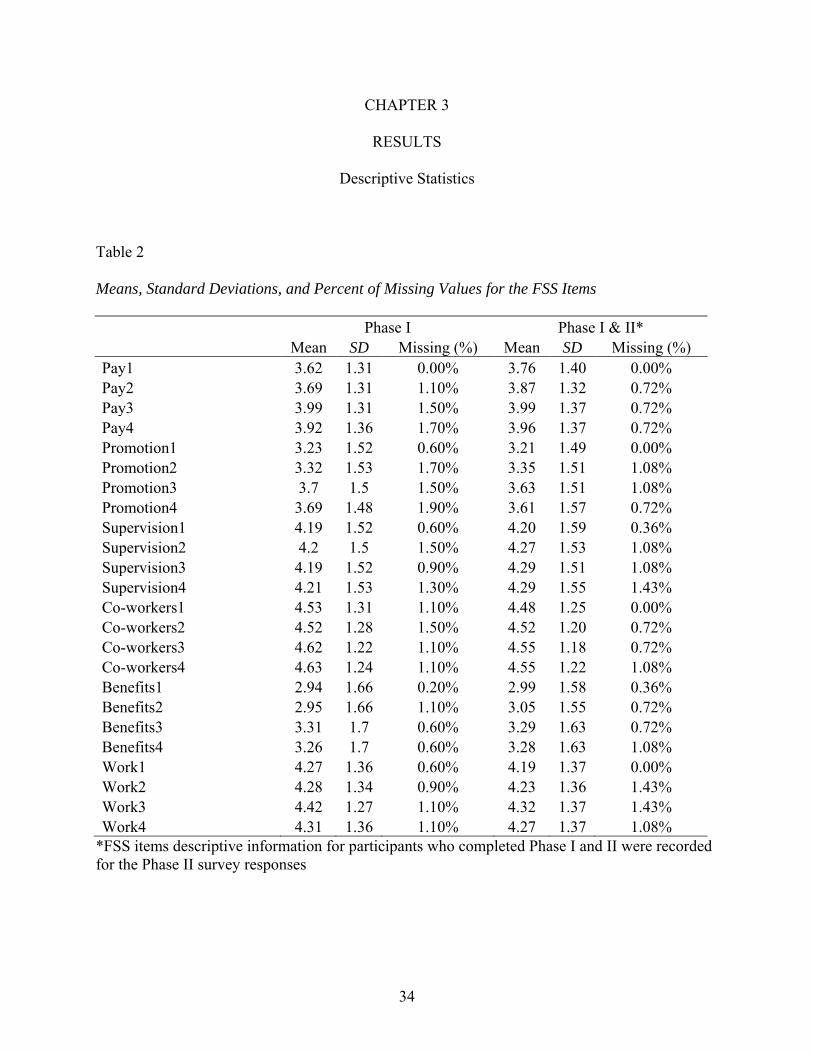
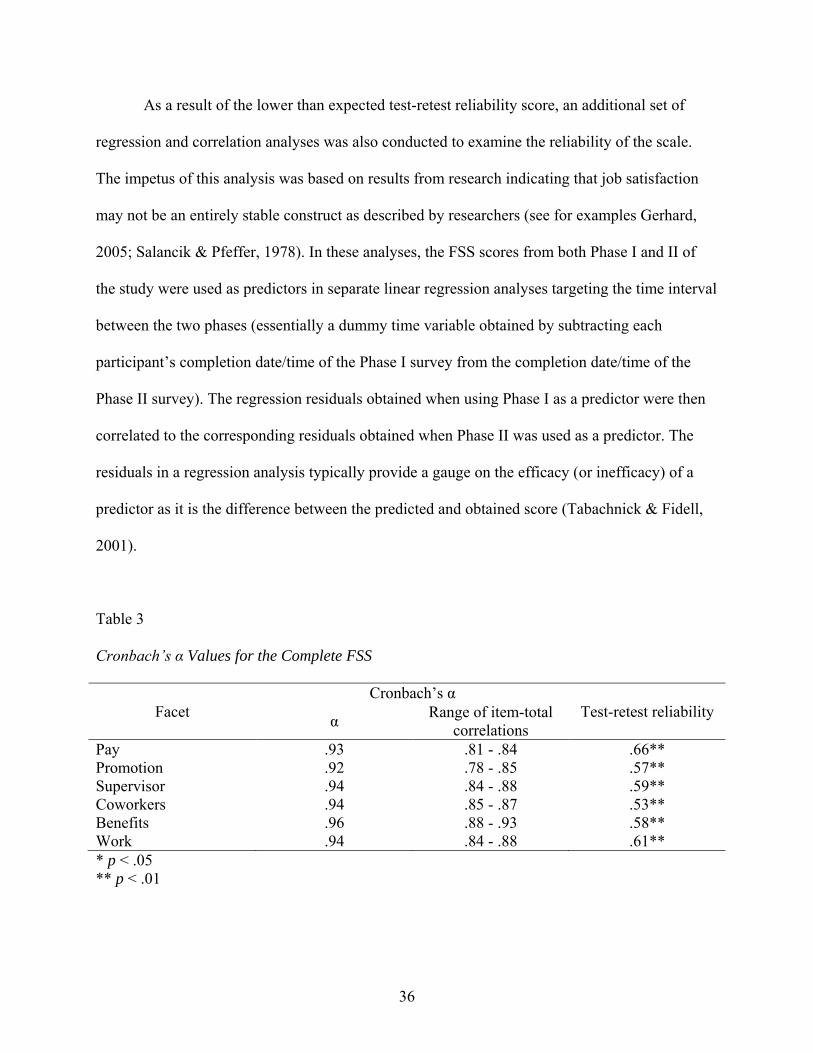
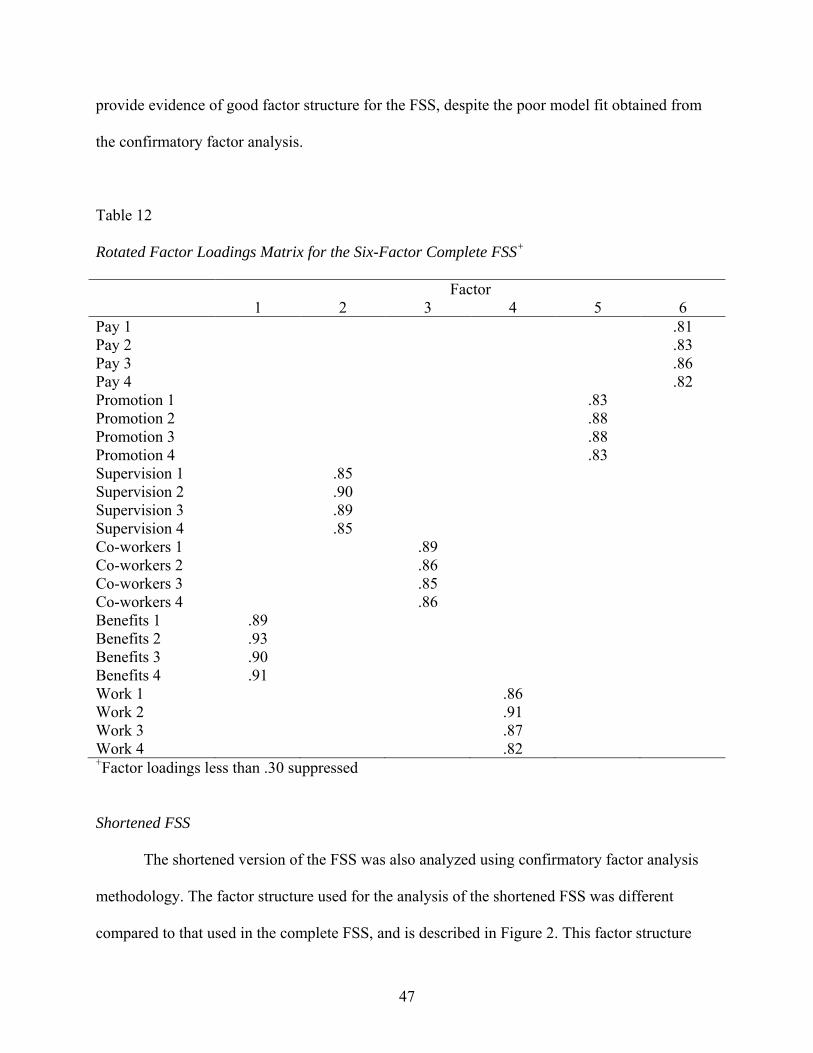
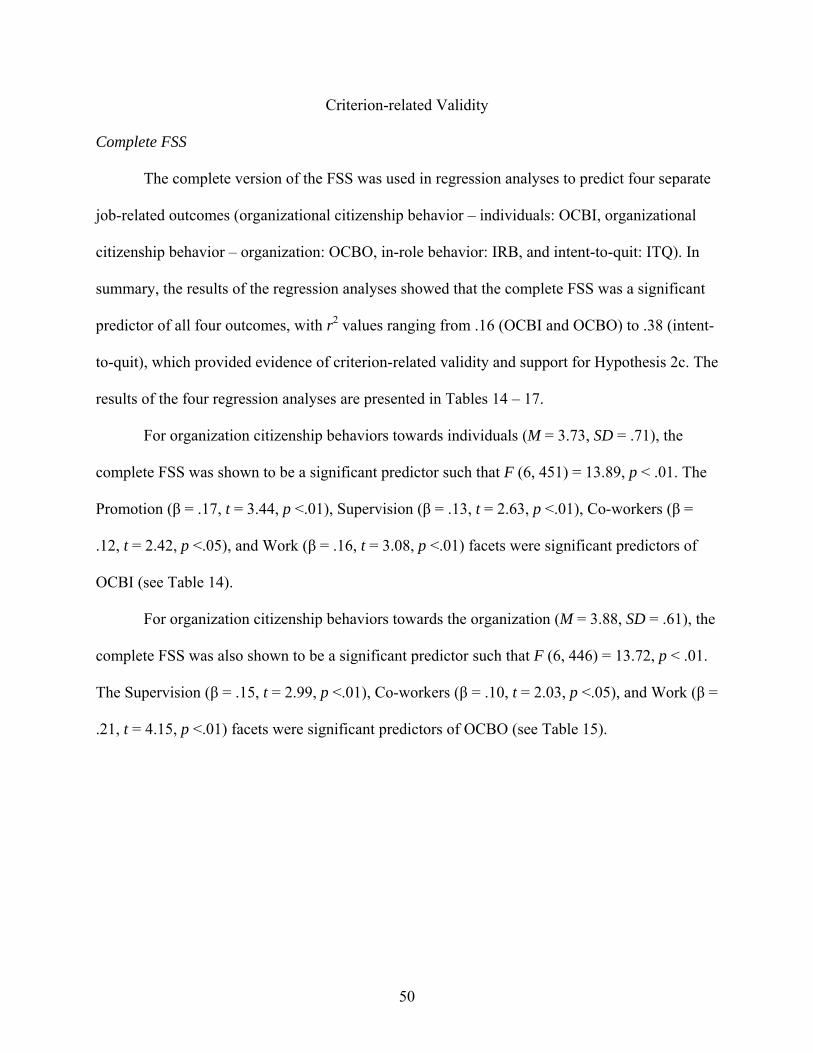
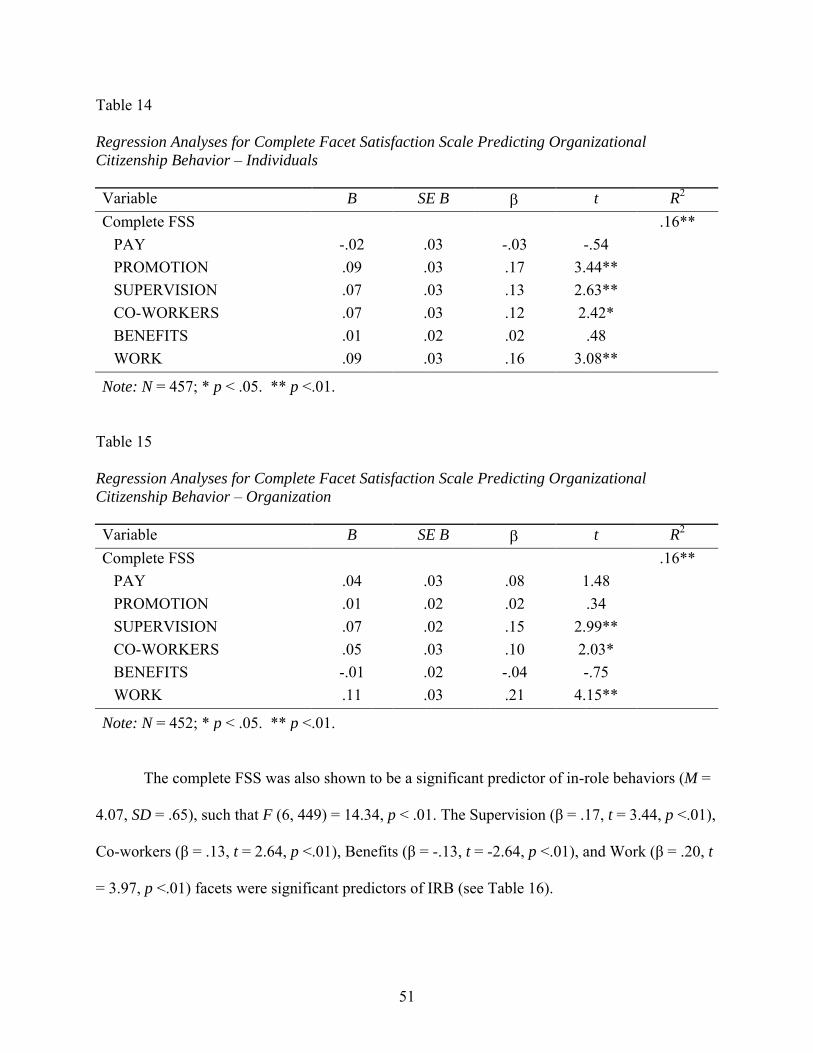
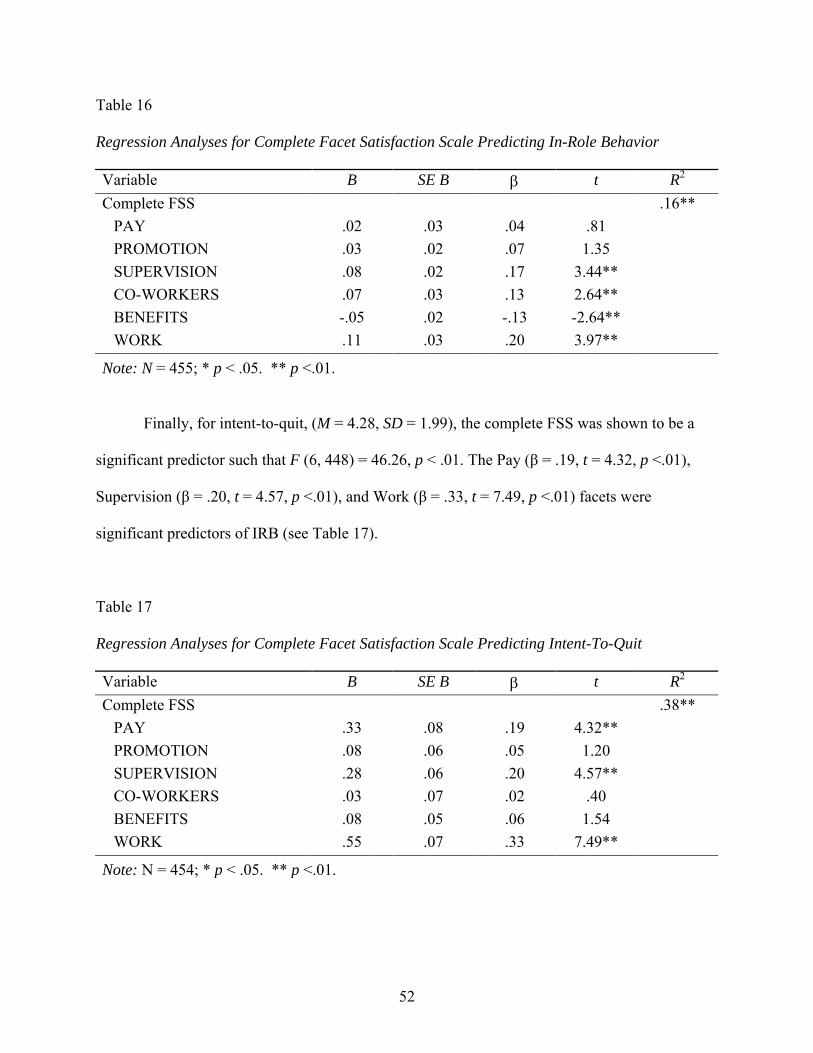
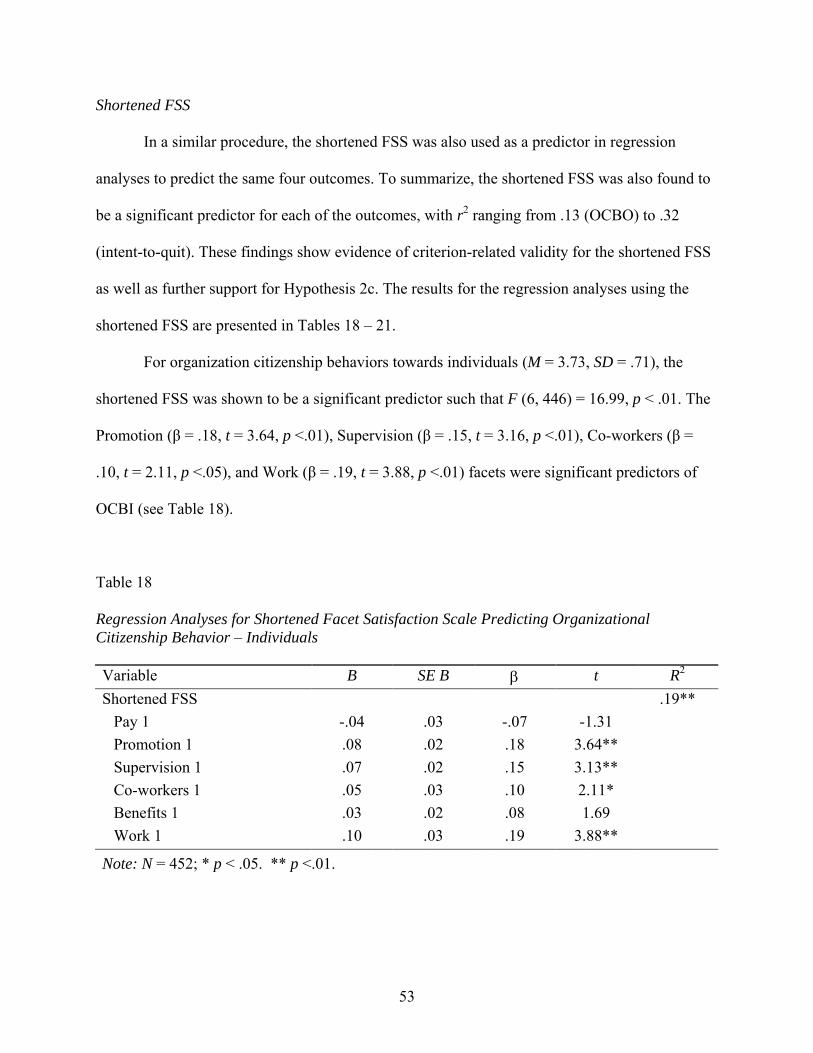
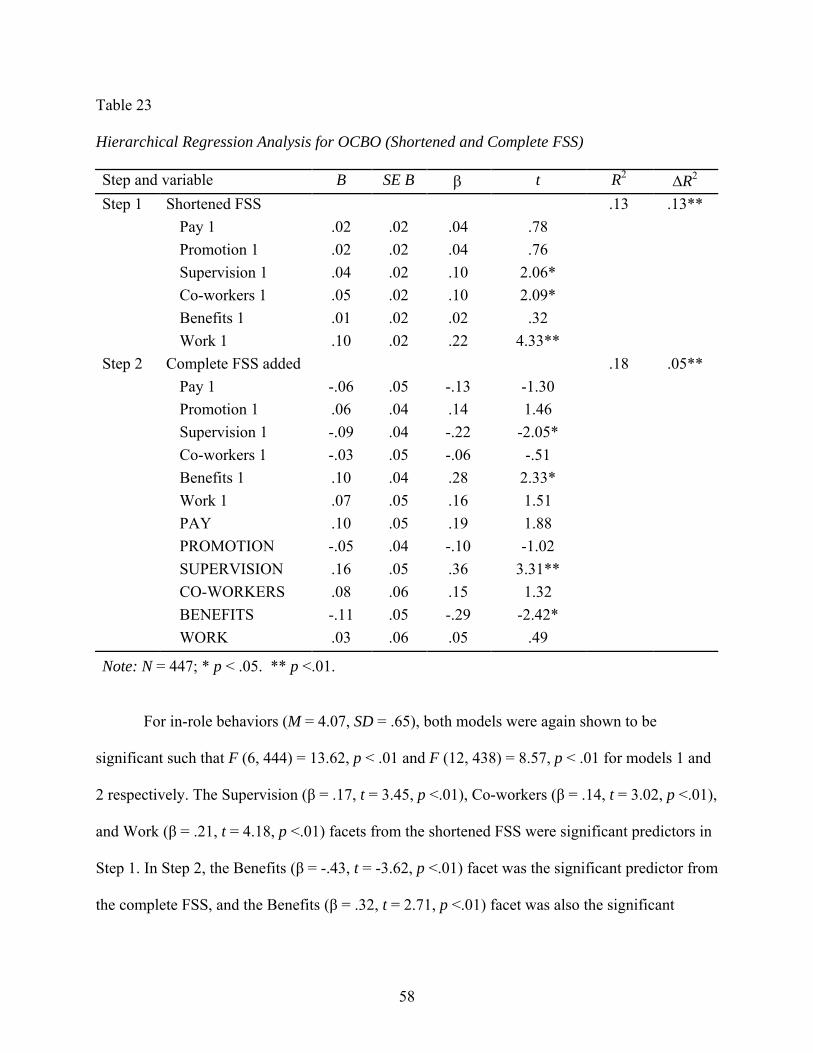
3. RESULTS ................................................................................................................................. 34
Descriptive Statistics ......................................................................................................... 34
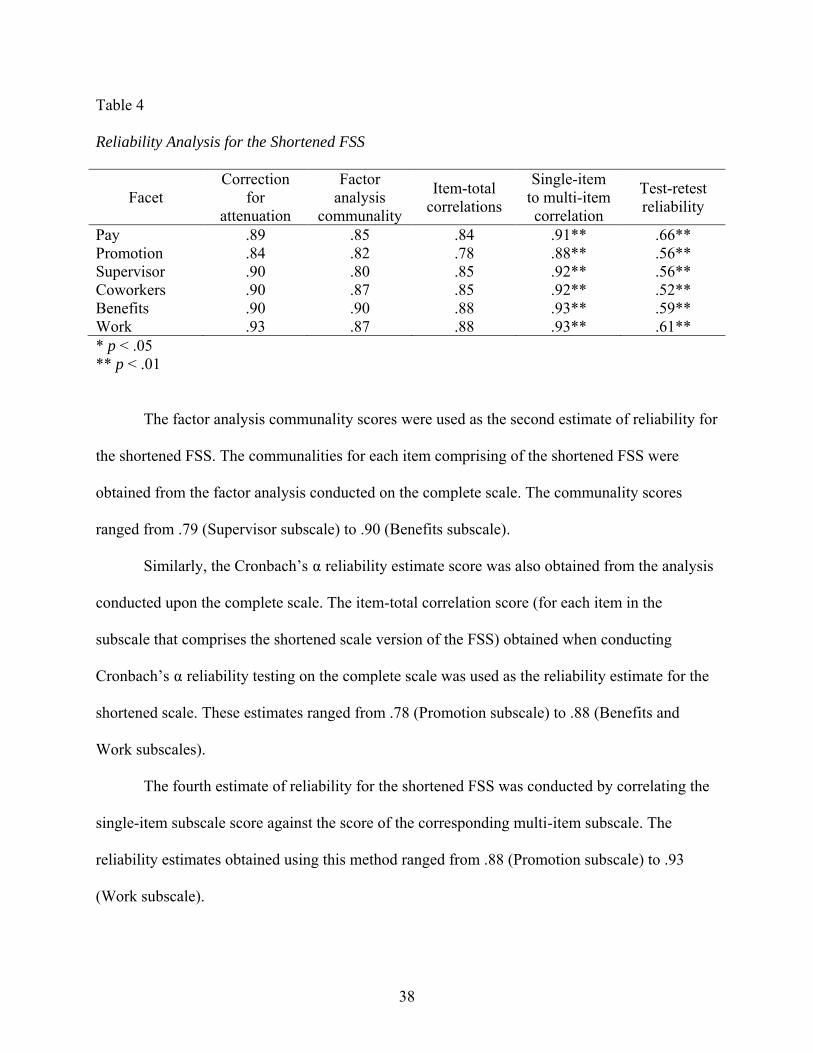
Reliability .......................................................................................................................... 35
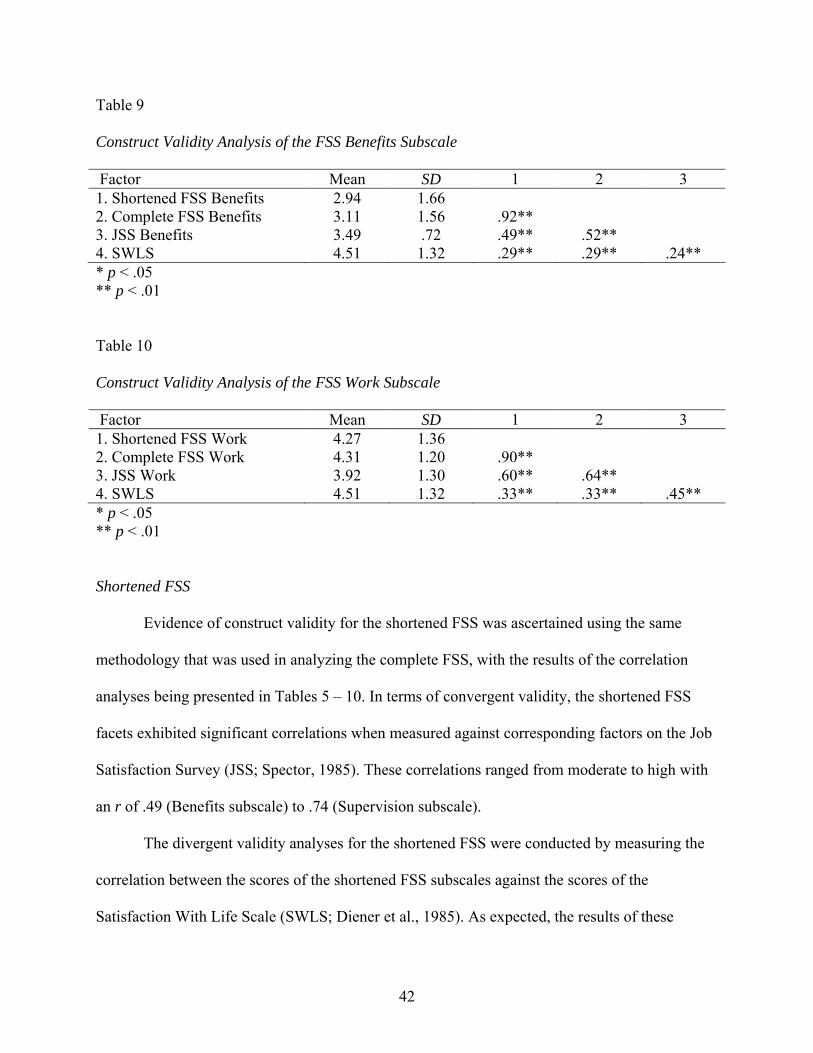
Construct Validity ............................................................................................................. 39
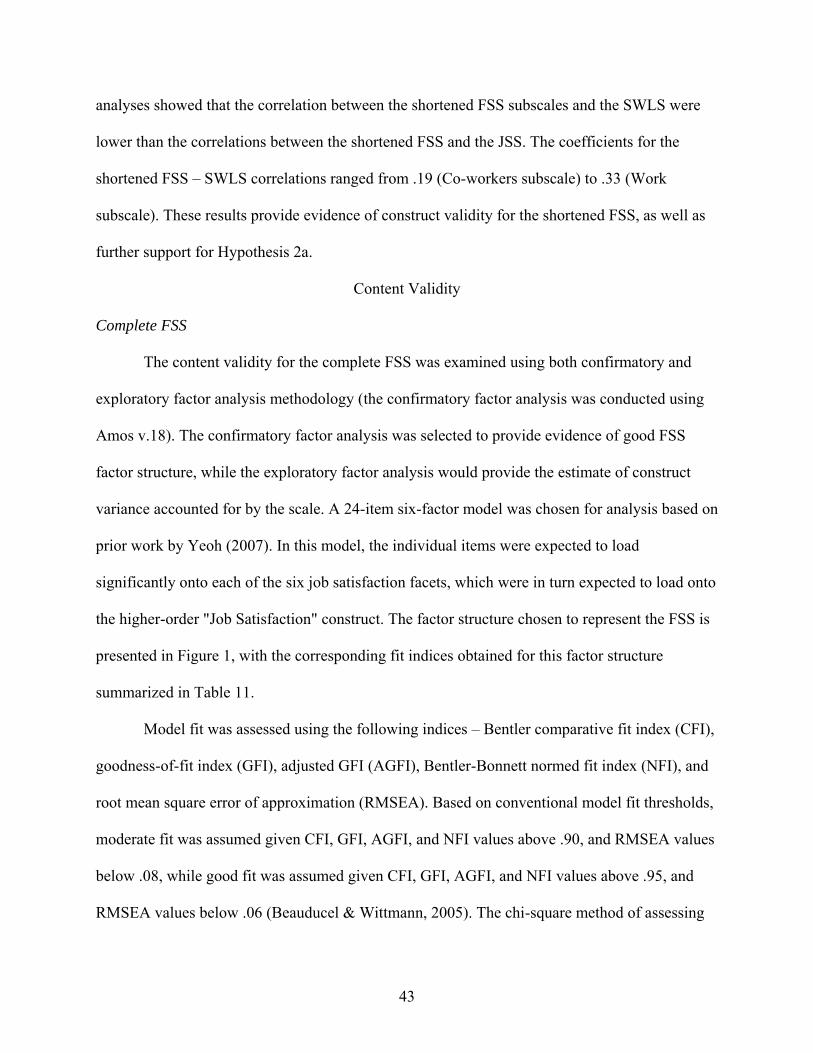
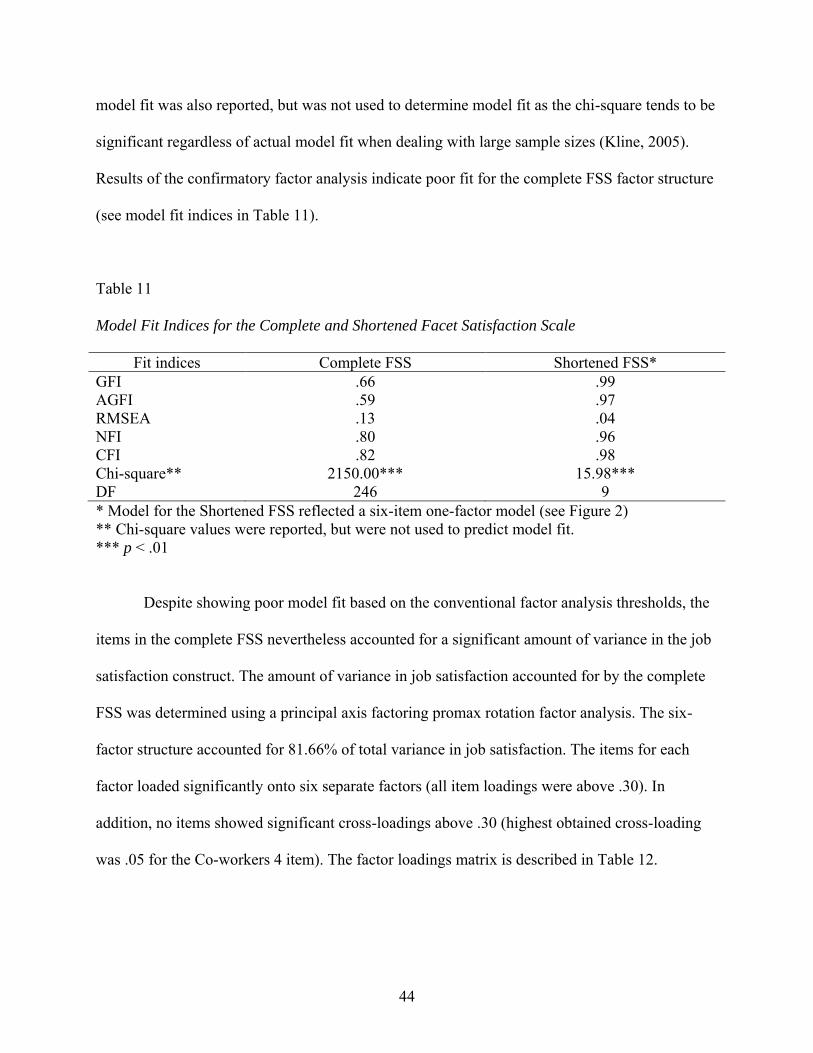
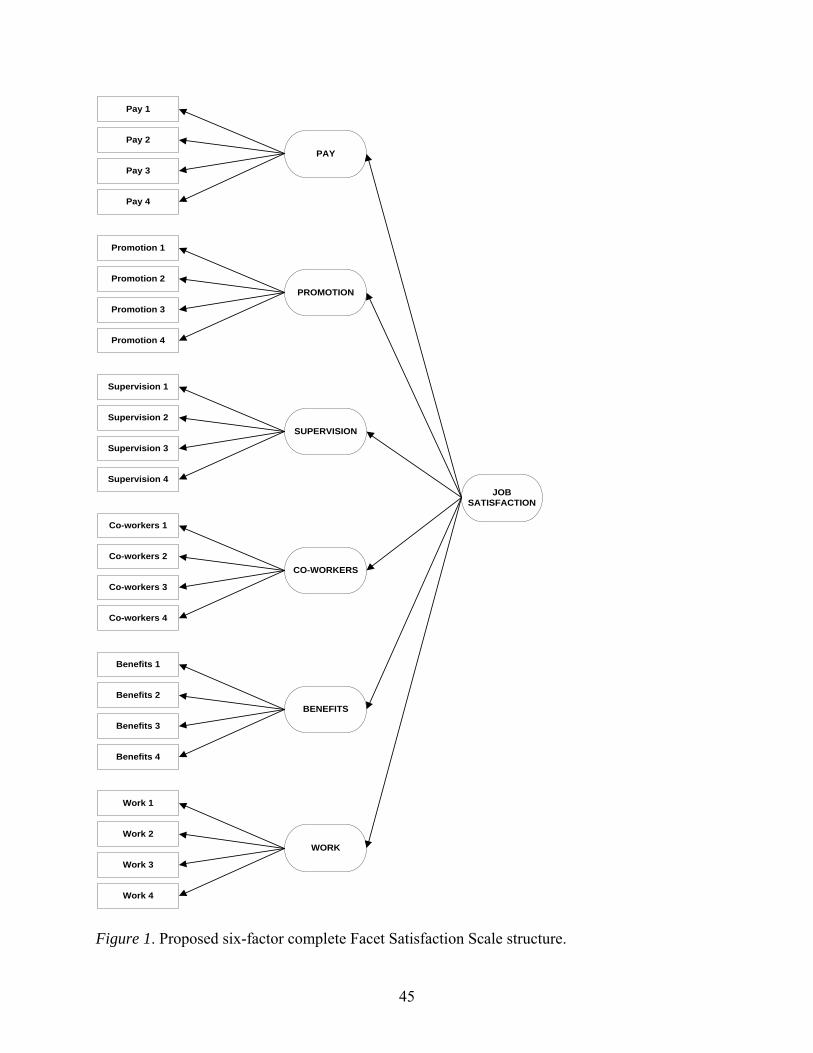
Content Validity ................................................................................................................ 43
Criterion-related Validity .................................................................................................. 50
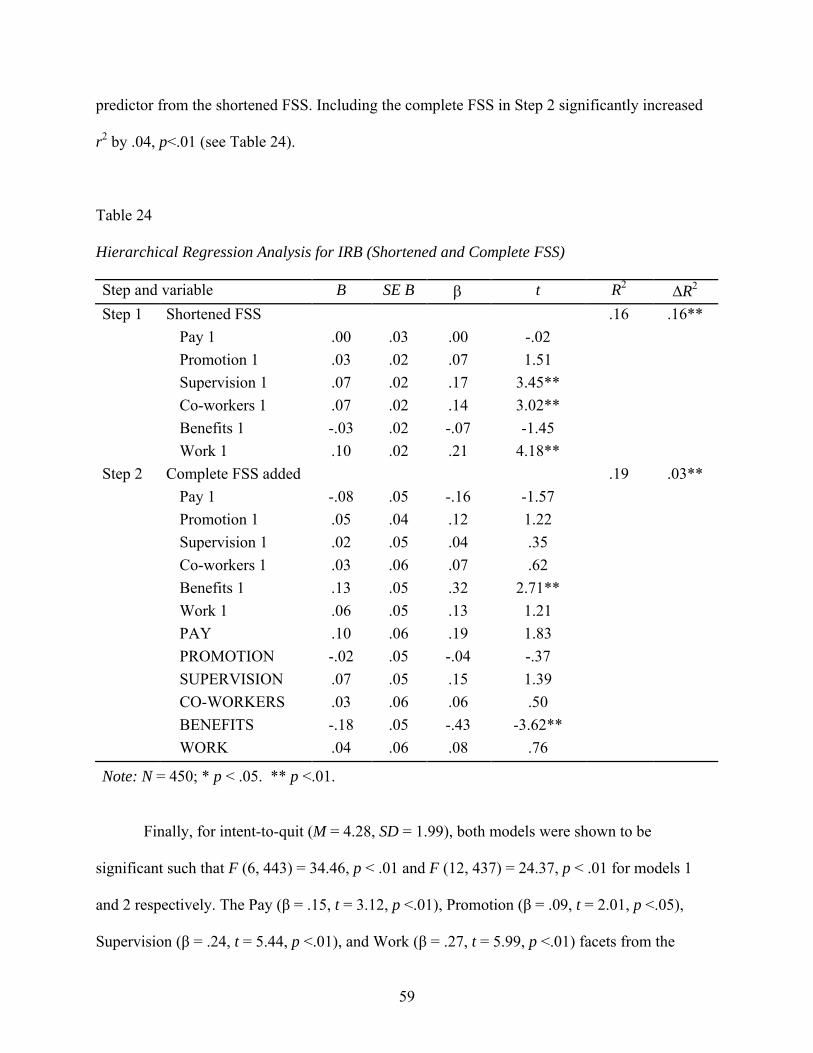
4. DISCUSSION ........................................................................................................................... 61
Summary of Results .......................................................................................................... 61
Scale Reliability ................................................................................................................ 61
Scale Validity .................................................................................................................... 63
Use of Single-item Scales ................................................................................................. 66
Summary and Conclusion ................................................................................................. 67
REFERENCES ............................................................................................................................. 69
Page 5
iv
LIST OF TABLES
Table Page 1 Means, Standard Deviations, and Percent of Missing Values for Participant Demographic
Information .............................................................................................................................29 2 Means, Standard Deviations, and Percent of Missing Values for the FSS Items ...................34 3 Cronbach’s α Values for the Complete FSS ...........................................................................36 4 Reliability Analysis for the Shortened FSS ............................................................................38 5 Construct Validity Analysis of the FSS Pay Subscale ............................................................40 6 Construct Validity Analysis of the FSS Promotion Subscale .................................................41 7 Construct Validity Analysis of the FSS Supervision Subscale ...............................................41 8 Construct Validity Analysis of the FSS Co-Workers Subscale ..............................................41 9 Construct Validity Analysis of the FSS Benefits Subscale ....................................................42 10 Construct Validity Analysis of the FSS Work Subscale .........................................................42 11 Model Fit Indices for the Complete and Shortened Facet Satisfaction Scale .........................44 12 Rotated Factor Loadings Matrix for the Six-Factor Complete FSS .......................................47 13 Rotated Factor Loadings Matrix for the Items from the FSS and JSS ....................................49 14 Regression Analyses for Complete Facet Satisfaction Scale Predicting Organizational
Citizenship Behavior – Individuals .........................................................................................51 15 Regression Analyses for Complete Facet Satisfaction Scale Predicting Organizational
Citizenship Behavior – Organization ......................................................................................51 16 Regression Analyses for Complete Facet Satisfaction Scale Predicting In-Role Behavior ...52 17 Regression Analyses for Complete Facet Satisfaction Scale Predicting Intent-To-Quit ........52 18 Regression Analyses for Shortened Facet Satisfaction Scale Predicting Organizational
Citizenship Behavior – Individuals .........................................................................................53
Page 6
v
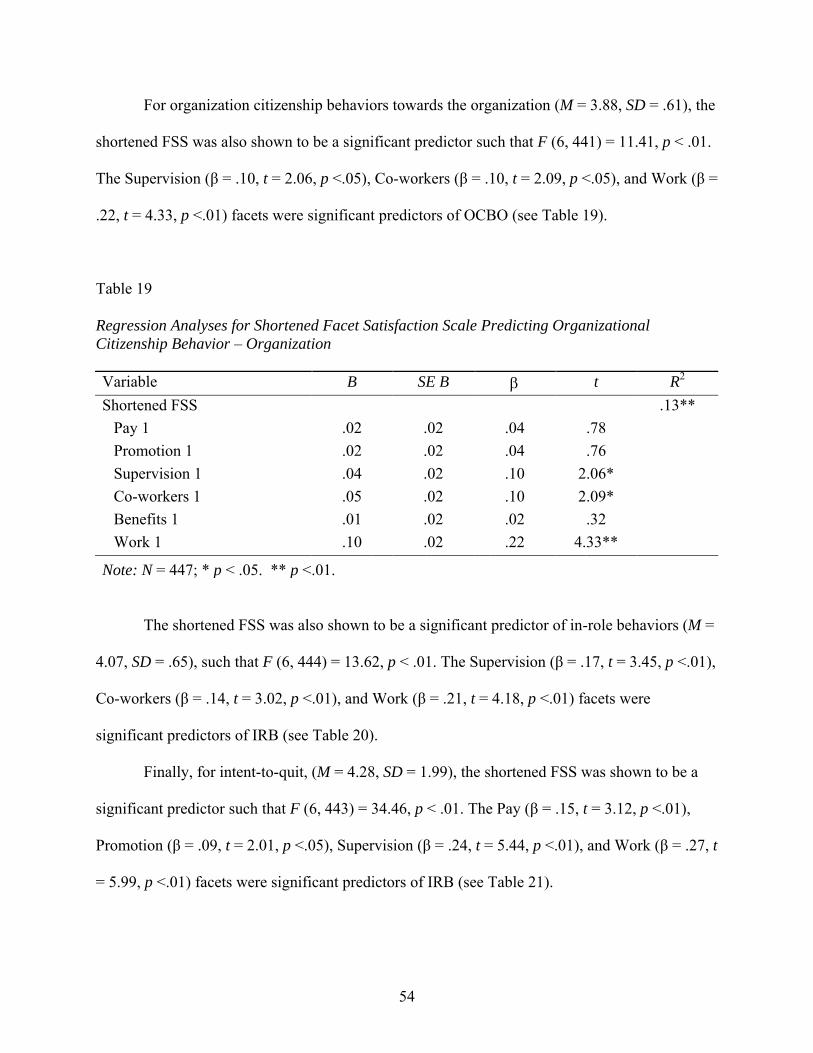
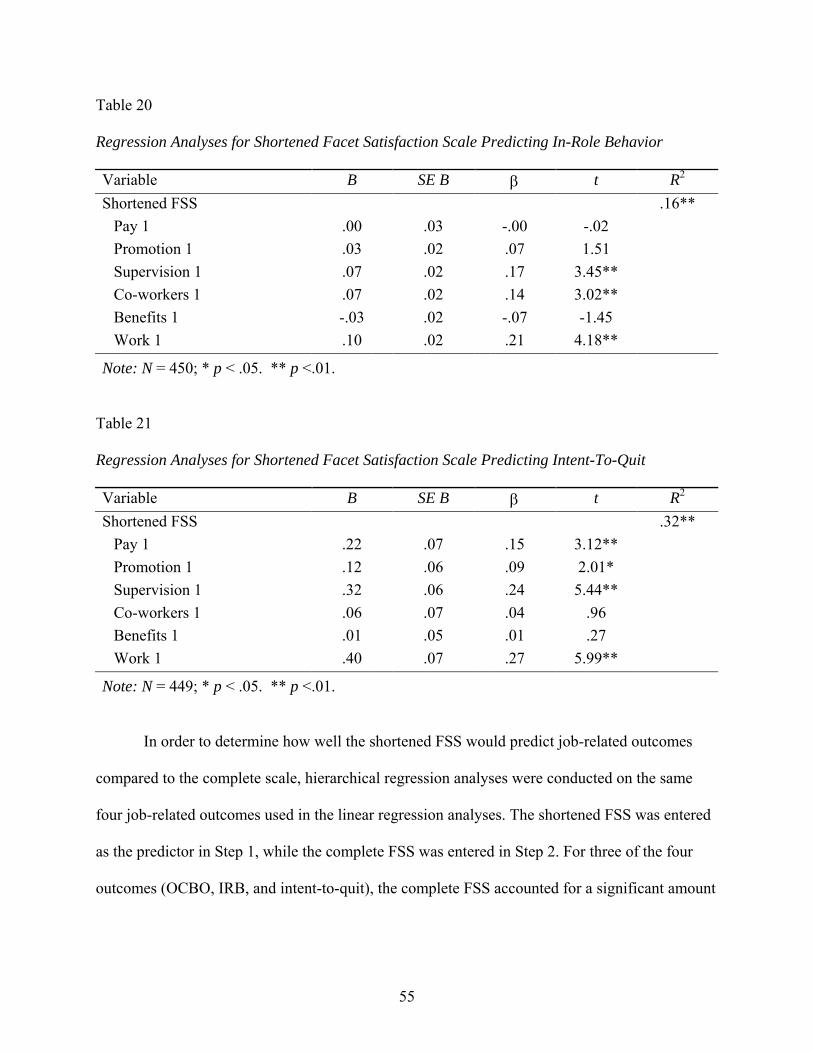
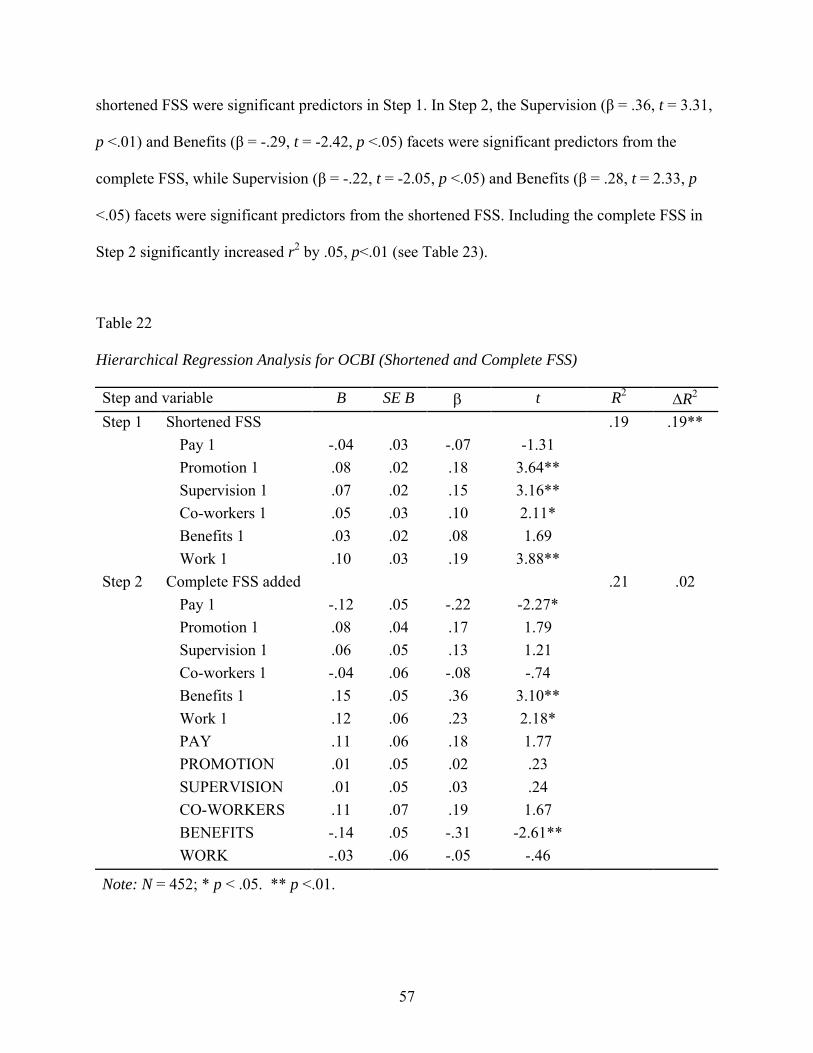
19 Regression Analyses for Shortened Facet Satisfaction Scale Predicting Organizational Citizenship Behavior – Organization ......................................................................................54
20 Regression Analyses for Shortened Facet Satisfaction Scale Predicting In-Role Behavior ...55 21 Regression Analyses for Shortened Facet Satisfaction Scale Predicting Intent-To-Quit .......55 22 Hierarchical Regression Analysis for OCBI (Shortened and Complete FSS .........................57 23 Hierarchical Regression Analysis for OCBO (Shortened and Complete FSS ........................58 24 Hierarchical Regression Analysis for IRB (Shortened and Complete FSS ............................59 25 Hierarchical Regression Analysis for ITQ (Shortened and Complete FSS ............................60
Page 7
vi
LIST OF ILLUSTRATIONS
Figure Page 1 Proposed six-factor complete Facet Satisfaction Scale structure. ...........................................45 2 Proposed six-item shortened Facet Satisfaction Scale structure. .............................................48
Page 8
1
CHAPTER 1
INTRODUCTION
Validation of the Facet Satisfaction Scale (FSS): An Evaluative
Approach to Assessing Facet Job Satisfaction
Job satisfaction has been, and continues to be, a popular construct that is studied by
researchers and practitioners alike, so much so that over 12,000 research studies had been
published on the topic by the turn of the millennia (Spector, 1997). Part of the reason for the
popularity of the construct may well derive from the “happy/productive worker thesis” that
postulates that happy workers are also more productive on the job (see Wright, Cropanzano, &
Bonnett, 2007). Researchers following this vein of thought have helped show statistical support
for this hypothesis. A meta-analysis by Iaffaldano and Muchinsky (1985) for example, found that
job satisfaction and job performance were related (r = .18). A follow-up study conducted by
Judge, Thoresen, Bono, and Patton (2001) found slightly stronger correlations between job
satisfaction and performance compared to the initial study (r = .30).
Beyond on-the-job performance, researchers have also found that job satisfaction is
related to other variables that positively impact the organization. Examples of these include
organizational citizenship behaviors (OCB) or contextual performance (Van Scotter, 2000;
Wagner & Rush, 2000), organizational commitment (Meyer, Allen, & Smith, 1993), and
motivation (Grant, 2008; Hackman & Oldham, 1976). On the other hand, the construct has also
been shown to be negatively related to variables that undesirably impact the organization.
Specifically, job satisfaction has been shown to be negatively related to employee withdrawal
behaviors such as absenteeism (Lambert, Edwards, Camp, & Saylor, 2005), intention-to-quit
(Campbell & Campbell, 2003), and turnover (Griffeth, Hom, & Gaertner, 2000). In addition,
Page 9
2
research has also shown that employees with lower levels of job satisfaction are more likely to
exhibit openly counterproductive work behaviors such as deviance, sabotage, theft, and
interpersonal aggression (Kulas, McInnerney, DeMuth, & Jadwinski, 2007; Chen & Spector,
1992).
While the variables described thus far focus primarily on the impact of job satisfaction on
the organization, the construct itself also has a wide-ranging influence on employee life outside
of their work environment. Among the impacts of job satisfaction on employee life includes
research showing a significant relationship between job satisfaction and life satisfaction
(Hochwarter, Perrewe, Meurs, & Kacmar, 2007) and work-life balance (McElwain, Korabik, &
Rosin, 2005; Mesmer-Magnus & Viswesvaran, 2005), although the causal direction of this
relationship may is not entirely clear (see Williams & Alliger, 1994). Finally, job satisfaction has
also been shown to be related to the manifestation of both the physical and behavioral symptoms
of stress among employees (Siu, Spector, Cooper, & Lu, 2005).
Brief History of Job Satisfaction
While we can now point to the numerous variables that are influenced by an employee’s
level of job satisfaction, this has not always been the case. Interest in examining the impact of
the person on the job for example, became increasingly focal with the publication of Taylor’s
scientific management theory during the turn of the 20th century, which clearly demarcated the
rights and roles of both management and the employees (Ichniowski, Kochan, Levine, Olson, &
Strauss, 1996). While it did revolutionize contemporary thinking on the structure of the
workplace, the use of the scientific management theory created low levels of autonomy and
increased stress on the employee, thus leading to lower levels of job satisfaction and
commitment (Steijn, 2001) due to employee fatigue and boredom. Nevertheless, Taylor’s ideas,
Page 10
3
along with findings from the Hawthorne studies (Roethlisberger & Dickson, 1939) conducted at
AT&T’s Western Electric plant, and separate work being done by Hoppock (1935) that showed a
strong correlation between the emotional adjustment of workers and their levels of job
satisfaction, helped researchers realize the importance of focusing upon the employee at work.
By the middle of the 20th century, this focus on the employee had kick started other
studies, particularly need theories focusing on motivation and job satisfaction, including
Maslow’s hierarchy of needs (Maslow, 1943) and McClelland’s theory of needs (McClelland,
1961). In truth, the popularity of need theories have persisted over the years, with more recent
expressions including Alderfer’s ERG theory, which condenses and builds upon Maslow’s work
(Alderfer, 1992; Alderfer, 1969). At the heart of these theories is the idea that humans have
fundamental needs and desires that transcend the boundaries of geography, race, society,
ethnicity, and religion, and that these needs fuel motivation until they are satisfied (Zalenski &
Raspa, 2006). The needs described by these theories can vary from basic physiological and
safety needs, to needs for power, achievement, and self-actualization (for more information, see
McClelland, 1961; Maslow, 1943).
These need theories had a significant impact on studies of job satisfaction not only of the
era, but also those going forward. Since these theories postulated that an employee’s job
satisfaction is increased if their needs are met, researchers began to focus their efforts on the
categories of needs of import to employees, and created measurement scales that assessed these
categories (see for example, Morgeson & Humphrey, 2006; Hackman & Oldham, 1976). In fact,
researchers familiar with studies of job satisfaction may see similarities between need categories
and the various job satisfaction facets that are assessed using modern-day job satisfaction scales.
When introducing the two-factor theory, for example, Herzberg (1966) argued that focus should
Page 11
4
be given to improving several areas (categories) of the job to enhance employee job satisfaction.
A recent review of the construct noted several of these key categories or focus areas, including
the work, recognition, responsibility, achievement, and opportunities for advancement (see
Latham & Budworth, 2007). Truth be told however, these categories are not new to researchers,
and a quick review shows that these categories were included as facets in studies dating back at
least to the Minnesota Satisfaction Questionnaire (Weiss, Dawis, England, & Lofquist, 1967),
which has been used by researchers and practitioners for decades. Another example of a job
satisfaction scale that is derived from assessing categories of employee needs or wants is the Job
Diagnostic Survey (Hackman & Oldham, 1976), which targets skill variety, task identity, task
significance, autonomy, and feedback derived from the job.
While the growth of interest in the employee and the advent of need theories helped give
job satisfaction a push forward, they do not specify how the construct should be defined nor what
measurement system to use. This is especially critical since some researchers remain skeptical as
to the importance of the construct despite evidence that job satisfaction is related to a wide
variety and number of important variables, only a few of which were discussed earlier in this
paper. This skepticism emerges primarily because the strength of these relationships (while
significant) are typically low to moderate, which has led some researchers to call job satisfaction
“one of the most enduring yet elusive constructs used in the study of industrial relations”
(Macdonald & MacIntyre, 1997, p.1). For example, the meta-analyses previously described only
reported r values ranging from .18 to .30 between job satisfaction and performance (Iaffaldano &
Muchinsky, 1985; and Judge et al., 2001, respectively). Other studies have also found similar
results using different variables thought to be correlated with job satisfaction, such as
absenteeism with r values ranging from -.13 to -.10 (Farrell & Stamm, 1988), citizenship
Page 12
5
behaviors targeting the organization (r = .25) and OCBs targeting individuals (r = .26)
(McNeely & Meglino, 1994). This seems to indicate that while there is a relationship between
job satisfaction and these outcomes, the strength of the relationship itself may only be weak to
moderate.
As a result, the moderate effect sizes described in these studies raises doubts about the
efficacy of using job satisfaction as a predictor in studies analyzing organizational constructs
(Huff, Tekell, & Yeoh, 2005). Thus, considering the primacy of the construct, researchers have
begun to propose various possible causes for the lower-than-expected correlation relationships.
These causes have typically been classified into two major categories: (1)
inconsistent/incomplete operational definitions of job satisfaction (Brief & Weiss, 2002), and (2)
job satisfaction measures that fail to assess the construct in concordance with how it is defined
(Brief & Roberson, 1989). This study was therefore designed to examine contemporary
definitions of job satisfaction and to measure it using methodology consistent with its definition,
with the goal of improving our understanding of the construct and consequently our ability to
predict outcome variables related to it.
Defining Job Satisfaction
Early research on job satisfaction typically focused on the affective component of the
construct (Spector, 1997). Two classic examples of affective-based definitions of job satisfaction
include Smith, Kendall, and Hulin (1969, p. 37), who defined job satisfaction as “persistent
feelings towards discriminable aspects of the job situation” and Locke (1976, p. 1300), who
called it a “pleasurable or positive emotional state resulting from the appraisal of one’s job or job
experiences.” These affective/emotional definitions of the construct tied in neatly with the need
theories of the time, for example, Maslow’s hierarchy of needs (Maslow, 1943) and Alderfer’s
Page 13
6
subsequent ERG theory (Alderfer, 1969). Essentially, these theories proposed that employees
had various levels of needs to be met, and failure to meet these needs would result in frustration
and dissatisfaction (negative emotive responses), whereas meeting these needs would generate
feelings of job satisfaction (positive emotions) among employees (see Scott, 1995 for a review).
These and other similar affect-based definitions of job satisfaction continue to remain
popular to this day. Cranny, Smith, and Stone (1992, p. 1) for example, operationalized job
satisfaction using a variant of Locke’s definition by describing the construct as “an affective
reaction to a job that results from the incumbent’s comparison of actual outcomes with those that
are desired.” No doubt the continued focus on affective reactions is based on research studies
showing that job satisfaction is correlated to both positive and negative affective experiences
(Fisher, 2002; Weiss & Cropanzano, 1996). While research has supported the correlation
between an employee’s emotions and his or her job satisfaction, using affective measures of job
satisfaction is problematic since “affective reactions are likely to be fleeting and episodic” (Hulin
& Judge, 2003, p. 256) thus leading to instabilities when measuring the construct.
In order to further support the use of affective definitions of job satisfaction, proponents
of this theoretical camp have linked the construct to the individual employee’s dispositional
affect or personality traits, thus providing evidence for stability over longer periods of time (see
for examples, Steel & Rentsch, 1997; Staw & Ross, 1985). Indeed, advocates of personality-
based measures note that these measures are more predictive of multiple instances of behavior
than behavior in a particular instance (Aries, Gold & Weigel, 1983). One of the earlier studies of
this personality/dispositional hypothesis was conducted by Staw and Ross (1985), who showed
that an individual’s job satisfaction, as measured using an employee’s dispositional affect,
remained relatively stable over a three- or five-year time period despite changes in the
Page 14
7
occupation or the employer, and can “predispose people to respond positively or negatively to
job contexts” (p. 471). In a more recent study, Steel and Rentsch (1997) found evidence for job
satisfaction stability over a ten-year time frame. These findings, coupled with research showing
that job satisfaction has, at least in part, a biological or genetic precursor (Arvey, Bouchard,
Segal, & Abraham, 1989) give credence to the belief that job satisfaction can be adequately
defined and measured using the affective dispositional approach.
Detractors of the affective dispositional approach, on the other hand, have found that
changes in the situational factors of a job (i.e. pay, complexity, etc.) have a significant impact on
job satisfaction beyond what is explained by personality alone (Gerhart, 1987). In addition, while
correlated, the change in employee job satisfaction (that occurred over time or as a result of
change in the work environment) as reported by proponents of the affective dispositional
approach is in itself indicative that situational effects have an important impact on the construct
(Gerhart, 2005). Specifically, Salancik and Pfeffer (1978) have shown that individuals take into
consideration short-term situational cues when providing an account of their levels of job
satisfaction. Thus it would seem that job satisfaction is not merely an affective reaction towards
the job as initially believed, forcing researchers to look beyond simply affect in order to fully
understand the construct.
Unfortunately, the argument on the use of affective dispositional methods to define and
measure job satisfaction continues to persist (see for counterpoints, Gerhart, 2005; Staw &
Cohen-Charash, 2005) leaving us with little in the way of a resolution. In order to sidestep this
issue, other researchers began to gravitate instead to a second definition of job satisfaction. By
the mid-1980s, researchers had begun emphasizing cognitive (as opposed to affective)
definitions of the construct (see for example, Organ & Near, 1985). Under this train of thought,
Page 15
8
researchers defined job satisfaction using “judgment-based, cognitive evaluations of jobs on
characteristics or features of jobs and generally ignored affective antecedents of evaluations of
jobs and episodic events that happens on jobs” (Hulin & Judge, 2003, p. 255). Further credence
for the use of cognitive definitions for job satisfaction surfaced when researchers found that
despite being defined using affective terms, job satisfaction was often measured using cognitive
scales (Brief & Roberson, 1989). In addition, using cognitive definitions of the construct
essentially allowed researchers to overcome the disagreement presented by the proponents and
detractors of the affective dispositional theory of job satisfaction.
The drawback of defining job satisfaction purely as cognition was that this definition
ignored the decades of research and findings that focused on the affective element of the
construct. Thus, in order to reconcile the voluminous data gathered from initial studies into
affective-dispositional job satisfaction with the newer cognitive approach, researchers proposed
instead an attitudinal conceptualization of job satisfaction containing at least an affective and a
cognitive component (see for examples, Fisher, 2000; Brief, 1998). After all, if it is assumed that
job attitudes are conceptually similar to social attitudes with only a different focus, there should
be little difficulty applying social attitudinal research to job satisfaction (Huff, 2000).
This view of job satisfaction as an attitude is not a new one either, with origins going
back at least to the early 1980s. Organ and Hamner (1982) for example, described job
satisfaction as a “complex assemblage of cognitions (beliefs or knowledge), emotions (feelings
or sentiments), and behavioral tendencies” (p. 287). Simply put, researchers have defined job
satisfaction as “an attitudinal variable that reflects how people feel about their jobs as well as
various aspects of them” (Spector, 2000, p. 197), or, more precisely, as an enduring attitude
shaped by social and interpersonal processes in the work environment (Dipboye, Smith, &
Page 16
9
Howell, 1994). Defining job satisfaction thusly has one key advantage of allowing researchers to
apply decades of social psychological attitudinal research to improve our understanding of the
construct (Brief, 1998; Organ & Near, 1985).
While often thought of using the tripartite definition with affective, cognitive, and
behavioral elements (for a review, see Franzoi, 2003), there is also a second school of thought on
the structure of attitudes that advocates a two-component model including only affective and
cognitive elements (Brief, 1998). In this model, the behavioral component of the attitude is
relegated instead to an outcome measure of the attitude (Franzoi, 2003). This conceptualization
of attitudes corresponds well to how outcome measures (e.g. job performance or absenteeism)
are typically said to be derived (or results) from an employee’s level of job satisfaction (i.e.
behaviors as the outcome of attitudes) (Siu et al., 2005; Judge et al., 2001).
More recently, researchers have taken the attitudinal definition of job satisfaction a step
further by focusing on the evaluative element of attitudes. Definitions of the construct have
begun to reflect this new conceptualization, including Motowidlo’s (1996, p. 176) “judgments
about the favorability of the work environment” and Brief’s (1998, p. 86) “… evaluating an
experienced job with some degree or favor or disfavor.” The efficacy of this new
conceptualization has been supported by an increasing amount of research evidence (see for
examples, Huff, Tekell, & Yeoh, 2005; Crites, Fabrigar, & Petty, 1994).
In a review of major theoretical models of job satisfaction, for example, Hulin and Judge
(2003) found that many of the job satisfaction models that they analyzed proposed a common
evaluator/comparator element that is used by employees to express their level of job satisfaction.
Other researchers have also found that adding an evaluative measure of job satisfaction creates a
better fitting model beyond using only affect and/or cognition (Huff, Tekell, & Yeoh, 2005).
Page 17
10
Based on a review of the existing literature, it was thus decided that job satisfaction would be
operationally defined in this study as an evaluation of the employee’s job, which is in line with
Weiss’s (2002, p. 6) conceptualization of job satisfaction as a “positive or negative evaluative
judgment one makes about one’s job or job situation.”
Measuring Job Satisfaction
With job satisfaction defined in evaluative terms, it was then possible to create an
effective measure of the construct. During the creation of the Job Descriptive Index (JDI), Smith
and her colleagues noted significantly that “measurement and theory should go hand in hand”
(Smith, Kendall, & Hulin, 1969, p. 1). No doubt, this can be said of attempts to measure any
construct, but is perhaps more critical in the case of job satisfaction due to findings by
researchers that this statute has often been ignored. For example, in a study examining three
popular measures of job satisfaction, Brief and Roberson (1989) discovered that only the Faces
Scale (Kunin, 1955) adequately captured both the affective and cognitive components of job
satisfaction. The two other scales analyzed – the Job Descriptive Index (Smith et al., 1969) and
the Minnesota Satisfaction Questionnaire (Weiss, Dawis, England, & Lofquist, 1967) – primarily
captured the cognitive component of the construct and not its affective component. A more
recent study conducted by Moorman (1993) found similar results, indicating that various
measures of job satisfaction do not always tap into the construct’s affective and cognitive
components equally.
The findings outlined by these researchers demonstrate part of the second reason for the
lower than expected relationships between job satisfaction and job-related outcomes – the
inconsistent measurement of job satisfaction. The call to create “well-researched, construct valid
instruments designed to measure job satisfaction” (O’Connor, Peters, & Gordon, 1978, p. 22) is
Page 18
11
not a new one (see also Macdonald & MacIntyre, 1997), and is one key reason that prompted this
line of inquiry to create a measurement scale of job satisfaction that is consistent with its
operational definition.
However, the inconsistency between the measurement and definition of job satisfaction is
not the only difficulty in terms of creating valid measures of the construct. Two other
psychometric issues must also be considered when creating a new measure of the construct: (1)
determining whether to focus on either global job satisfaction or facets of the construct, and (2)
deciding on the type of response scale to be used in the measure. In addition, in order to take
advantage of savings generated from reducing the number of items on a scale (see for examples,
Nagy, 2002; Wanous & Hudy, 2001), the use of single-item measures was also considered
during the creation of the Facet Satisfaction Scale (FSS: Yeoh, 2007).
Global Versus Facet Job Satisfaction
The issue of global versus facet measures of job satisfaction centers upon whether a
particular measure of job satisfaction assesses the construct holistically (i.e. global) or targets
individual aspects of job satisfaction such as pay, supervision, and promotion (i.e. facets) (see for
a review, Fields, 2002). In addition, job satisfaction researchers have also advocated means by
which facet measures of the construct can be combined to obtain an overall global job
satisfaction score (see for example, Locke, 1976). Unfortunately, more recent research has found
that global job satisfaction is not simply a linear function or summation of its facets (Johnson &
Johnson, 2000; Ferratt, 1981), and that “the relationship between facet and global measures of
job satisfaction is still in need of clarification” (Jackson & Corr, 2002, p. 1). One thing we do
know however, is that while overall job satisfaction may be more complex than the sum of the
facets that are currently being used to measure the construct, this method may be appropriate if
Page 19
12
the facet scale used is content valid (Scarpello & Campbell, 1983). Unfortunately, these findings
have done nothing but leave the two ideological camps arguing about the best way to measure
the construct.
Proponents of global measures of job satisfaction, such as the Faces scale (Kunin, 1955)
and the Job in General scale (Ironson, Smith, Brannick, Gibson, & Paul, 1989), cite that these
measures are more likely to better reflect individual differences rather than simply a person’s
response to specific items (Witt & Nye, 1992). Other studies have also found that using global
measures of job satisfaction accounts for a greater percentage of overall construct variance
compared to facet measures, which are limited to the number of facets included in a particular
measure (Scarpello & Campbell, 1983). Thus, while global measures of job satisfaction do not
specify the particular areas of the job in which an employee feels more or less satisfied, it does
allow researchers to compare the overall satisfaction levels between employees.
There are however, difficulties associated with using global measures of an attitudinal
construct such as job satisfaction. Social psychologists have noted since the early days of attitude
measurement that “an attitude is a complex affair which cannot be wholly described by any
single numerical index” (Thurston, 1931, p. 260). More importantly, using a measure of overall
job satisfaction does not provide researchers and practitioners with any information regarding the
source of an employee’s satisfaction or dissatisfaction (Murphy & Fraser, 1978). Also related to
determining the source of satisfaction, researchers have discovered that more specific measures
of job satisfaction “better reflect the changes in relevant situational factors because of the more
precise referent” (Gerhart, 1987, p. 371). In other words, facet measures essentially provide a
finer-toothed comb to determine the exact area of satisfaction/dissatisfaction to target with
change initiatives, as well as allowing for enhanced prediction of specific behaviors relevant to a
Page 20
13
particular facet of the construct. Reviews of the construct have also shown that it is multifaceted,
and that the various facets contribute uniquely to the overall construct (see for example, Howard
& Frink, 1996; Porter & Steers, 1973). Finally, research has also shown that the validity of facet
measures of job satisfaction to predict the overall domain of the construct increases as more
relevant facets are used (though the incremental r2 showed only minor increases from between
.02 to .06 depending upon the facet analyzed) (Highhouse & Becker, 1993).
Based on these findings, it was decided that the FSS would be developed as a facet-based
measure of job satisfaction. This decision however, prompted the need to determine how many
facets to include in the scale, and which specific facets to be analyzed. Considering that there are
dozens of facets that have been assessed using various job satisfaction scales in existence (see for
example, Spector, 2000; Dunham & Smith, 1979; Weiss et al., 1967), this can be a daunting task.
Fortunately, a review of the history of the construct provided some cues to help in this process.
Most early theories of job satisfaction tended to focus on a multiplicative method of
identifying which facets are more critical and thus should be included in facet measures of the
construct. According to Locke (1976) for example, job satisfaction facets should be measured
using a combination of facet descriptions (either by determining how satisfied an employee is or
through the use of a have-want differential) and facet importance, where highly important facets
allow for a fuller range of responding on a scale (highly satisfied to highly dissatisfied). More
recent studies however, have found that the impact or usefulness of facet importance is generally
inconclusive (Rice, Gentile, & McFarlin, 1991). Rice and his colleagues (McFarlin & Rice,
1992; Rice et al., 1991) discovered that facet importance does not moderate the relationship
between facet and overall job satisfaction, nor is it relevant when the goal of the study is to
predict job-related outcomes (as is the case for this study). As a result, the inclusion of a facet
Page 21
14
importance measure may not be as critical originally expected, and thus it was decided that the
focus of the FSS would remain on the measurement of job satisfaction facet descriptions.
While facet importance may not be relevant for the purposes of this study, determining
which facet to include in the creation of the FSS is critical for scale creation. Fortunately, the
evolution of need theories into facets of job satisfaction helped provide a clue into which facets
to include in the FSS. Researchers have previously separated job satisfaction facets into two
major categories: economic (for example, pay and benefits) and non-economic categories (such
as co-workers and supervisors) (see for examples, Kerber & Campbell, 1987; Murphy & Fraser,
1978), though the non-economic category can also be further refined to create a third, task-
related, category focusing on the work itself (Taber & Aliger, 1995).1 Within these major
categories are the areas or facets of job satisfaction that have been the target of various research
studies, such as the nine major facets (as identified by Locke, 1976) of the work itself, pay,
promotions, recognition, benefits, working conditions, supervision, coworkers, and
company/management (see also Johnson & Johnson, 2000; Taber & Aliger, 1995, for a list of
well-researched job satisfaction facets).
A review of the more popular facet-based job satisfaction scales currently in the public
domain helped to further funnel down the number of facets of import. Many of these scales used
at least five basic facets targeting (in one form or another) pay, promotion, supervision, co-
workers, and the work (see for examples, Hatfield, Robinson, & Huseman, 1985; Smith, Kendall,
& Hulin, 1969). While other scales may include additional facets, these five basic facets are
almost always included (see also, Spector, 1985; Dunham & Smith, 1979; Weiss, Dawis,
England, & Lofquist, 1967). As a result, the finalized version of the FSS was designed to
1 Alternatively, facets can also be categorized based on their intrinsic and extrinsic impacts on employee job satisfaction (MSQ; Weiss et al., 1967)
Page 22
15
measure these five facets, along with a facet targeting benefits, which was shown by Spector
(1985) and Locke (1976) to be an important facet worthy of inclusion in measures of the
construct.
Response Scale Selection
The second psychometric issue addressed in the creation of the FSS was the
determination of the type of response scale to be used in the scale. Three common techniques
have been developed over time by researchers in the field of social attitudes (see Krosnick, Judd,
& Wittenbrink, 2005 for a review). The first, and most time intensive, originated with Thurstone
(1928) whereby over 200 judges are typically asked to sort between 100 to 150 statements into
an evaluative continuum from positive to negative. Likert (1932) simplified attitude
measurement significantly by asking pretest participants to respond to 100 statements coded on a
five-point scale, typically ranging from strongly disagree to strongly agree. The items with the
lowest item-total correlations obtain from this pretest study would then be dropped leaving the
final set of scale items. The simplicity and ease of use of the Likert methodology compared to
that proposed by Thurstone has made it a popular scaling system for contemporary measures of
job satisfaction (Krosnick et al., 2005).
Finally, Osgood, Suci, and Tannenbaum (1957), developed a measurement technique
known as the semantic differential scale. Essentially, semantic differential scales have response
scale end-points that use pairs of adjectives representing an evaluative dimension of a particular
construct. Examples of these include good-bad, positive-negative, and pleasant-unpleasant.
These scales have been said to be “the simplest and easiest to administer of the landmark attitude
measurement techniques” (Krosnick et al., 2005, p. 33).
Page 23
16
Two key considerations were then used to decide on the final response scale method for
the FSS. First, while all three scaling techniques have been shown to have strong face validity
(Krosnick et al., 2005), the semantic differential method presented by Osgood and colleagues
(Osgood et al., 1957) was significantly less time intensive than the other two methods. In
addition, this method has often been used by social psychologists to address social attitudes (Yu,
Albaum, & Swenson, 2003). Considering then that job satisfaction has been operationally
defined as the evaluation of a job-related attitude, we should be able to borrow techniques used
by social psychology (in this case, semantic differential response scales) to measure the construct
(Huff, 2000).
Researchers who have used semantic differential scales in the area of job satisfaction do
provide two caveats for the use of this methodology. Since attitudes such as job satisfaction
include both affective and cognitive dimensions, Crites, Fabrigar, and Petty (1994) cautioned
against the use of semantic end-points that do not tap into both dimensions of the construct. In
addition, as the emphasis of the FSS is on the evaluative judgment of the job or job situation, it is
imperative that the end-points take on evaluative tone (i.e. positive-negative, good-bad) as
opposed to either just affective (i.e. love-hateful) or cognitive tone (i.e. useful-useless). As a
result, the evaluative end-points suggested by Crites and his colleagues (Crites et al., 1994) were
used as a basis to create the response scale on the FSS (Yeoh, 2007). Another note of caution
was provided by Shaeffer and his colleagues (Shaeffer, Krosnick, Langer, & Merkle, 2005), who
noted that the end-points of the scale should be properly balanced in order to ensure that the
questions do not bias the survey-takers’ responses (i.e. using scales with end-points of good-bad,
as opposed to an unbalanced scale with end-points running only from good-neutral). The FSS
was created with these concerns in mind, and coupled with the assessment of facets that are
Page 24
17
relatively homogenous and discriminably different from each other (Ironson et al., 1989), it has
been shown in an initial study to be a successful measure of the multifaceted construct of job
satisfaction (Yeoh, 2007).
Use of Single Item Facet Measures
A secondary goal of the FSS was the creation of a scale that would generate savings
through the use of single item measures to assess each facet of the construct. Existing measures
of job satisfaction can be long and time-consuming to administer (the MSQ, for example,
contains 100 questions in its full form). Therefore, in order to take advantage of the various
savings afforded by shorter scale measures (see for examples, Wanous, Reichers, & Hudy, 1997;
Nagy, 2002) an abridged version of the FSS was created using a single item to measure each
facet of the construct. The use of single item measures in job satisfaction research is not a new
technique. In fact, the Faces scale (Kunin, 1955) is a single-item overall job satisfaction measure
that has become one of the more often-used and valid measures of the construct over the past
fifty years (Brief & Roberson, 1989). Nevertheless, statistical techniques such as structural
equation modeling continue to encourage the use of multiple-item measures over those using
single items (Berkgvist & Rossiter, 2007). The use of multiple-item measures has been proposed
for good reason, not the least because single-item measures have been shown to “have serious
psychometric shortcomings and that they produce distorted results in field-collected data”
(Schriesheim, Hinkin, & Podsakoff, 1991, p. 106).
The shortcomings of single-item measures described by Schriesheim and colleagues
(Schriescheim et al., 1991) center around two primary issues which involve both a psychometric
and a theoretical or conceptual concern. These issues are (1) the inability to measure the internal
consistency reliability of single-item measures based on existing psychometric measures, and (2)
Page 25
18
the low levels of internal reliability of single-item measures (assuming that these can be
measured in the first place) due to the inadequacy of using single-item measures to analyze and
fully account for complex psychological constructs (for a more detailed review of these issues,
see Loo, 2002; Wanous & Hudy, 2001; Wanous, Reichers, & Hudy, 1997). Indeed, detractors of
single-item measures are adamant and cautioned that “practitioners and researchers are warned to
be wary of single-item measures” (Loo & Kells, 1998, p. 75).
Since Cronbach’s α, the most common measure of internal consistency, uses the average
inter-item correlation of multiple-item scales to determine internal consistency (DeVellis, 2003),
it is true that this measure cannot provide a value for the internal consistency of a single-item
scale. Nevertheless, researchers interested in the use of single-item measures have discovered
various methods in which to estimate its reliability, thus providing a range for the value of the
single-item scale’s reliability. Work by Wanous and Reichers (1996) for example, provided two
techniques to estimate the reliability of a single-item scale.
The first method proposed by Wanous and Reichers (1996) revolves around the
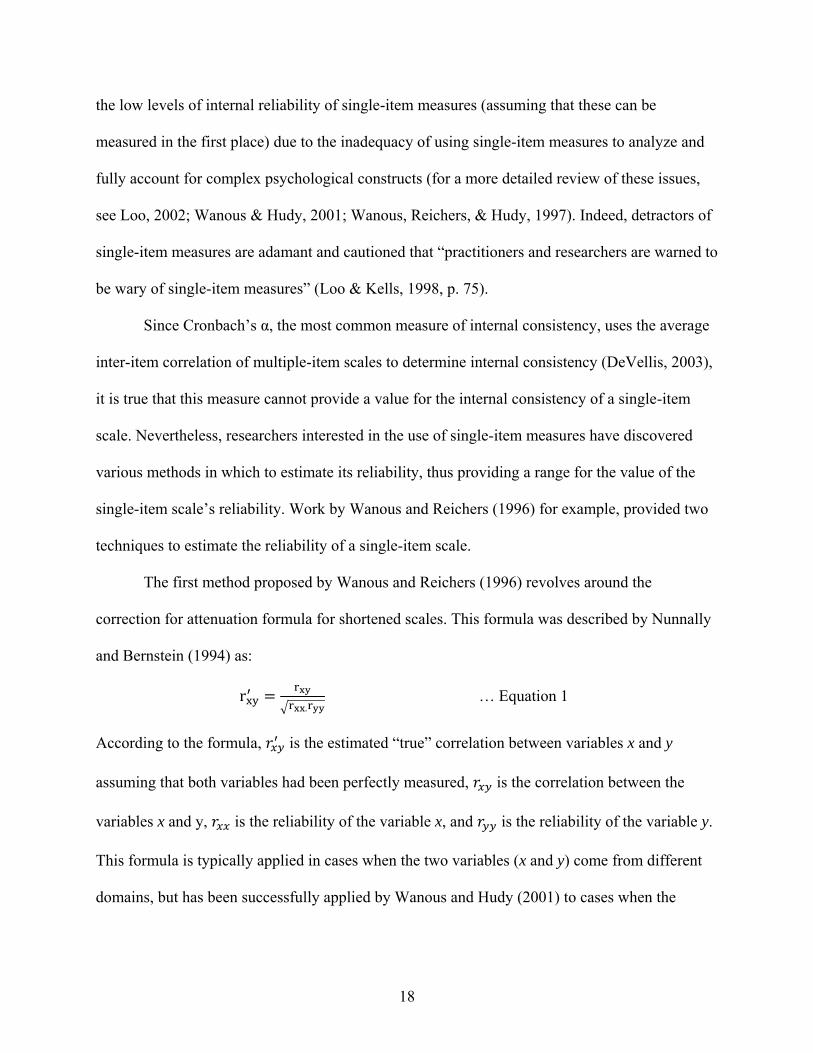
correction for attenuation formula for shortened scales. This formula was described by Nunnally
and Bernstein (1994) as:
√ … Equation 1
According to the formula, is the estimated “true” correlation between variables x and y
assuming that both variables had been perfectly measured, is the correlation between the
variables x and y, is the reliability of the variable x, and is the reliability of the variable y.
This formula is typically applied in cases when the two variables (x and y) come from different
domains, but has been successfully applied by Wanous and Hudy (2001) to cases when the
Page 26
19
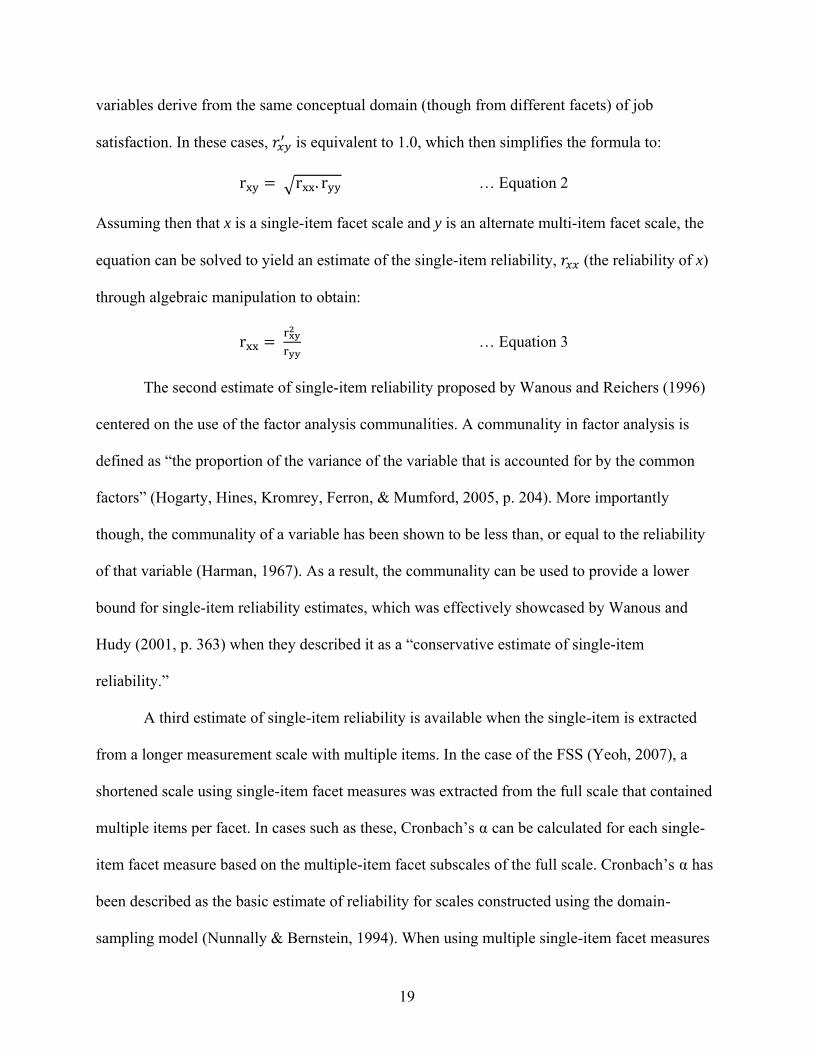
variables derive from the same conceptual domain (though from different facets) of job
satisfaction. In these cases, is equivalent to 1.0, which then simplifies the formula to:
√ … Equation 2
Assuming then that x is a single-item facet scale and y is an alternate multi-item facet scale, the
equation can be solved to yield an estimate of the single-item reliability, (the reliability of x)
through algebraic manipulation to obtain:
… Equation 3
The second estimate of single-item reliability proposed by Wanous and Reichers (1996)
centered on the use of the factor analysis communalities. A communality in factor analysis is
defined as “the proportion of the variance of the variable that is accounted for by the common
factors” (Hogarty, Hines, Kromrey, Ferron, & Mumford, 2005, p. 204). More importantly
though, the communality of a variable has been shown to be less than, or equal to the reliability
of that variable (Harman, 1967). As a result, the communality can be used to provide a lower
bound for single-item reliability estimates, which was effectively showcased by Wanous and
Hudy (2001, p. 363) when they described it as a “conservative estimate of single-item
reliability.”
A third estimate of single-item reliability is available when the single-item is extracted
from a longer measurement scale with multiple items. In the case of the FSS (Yeoh, 2007), a
shortened scale using single-item facet measures was extracted from the full scale that contained
multiple items per facet. In cases such as these, Cronbach’s α can be calculated for each single-
item facet measure based on the multiple-item facet subscales of the full scale. Cronbach’s α has
been described as the basic estimate of reliability for scales constructed using the domain-
sampling model (Nunnally & Bernstein, 1994). When using multiple single-item facet measures
Page 27
20
to describe a complex construct such as job satisfaction, Cronbach’s α can also serve as a
measure of internal reliability of the scale, and sets the upper limit for the reliability of the scale
(Nunnally & Bernstein, 1994).
A fourth estimate for single-item reliability was proposed by Nagy (2002), which focused
on the relationship between single-item and multi-item facet measures. While more typically
used in convergent validation studies (see Campbell & Fiske, 1959 for a review), correlating an
individual’s score on a single-item facet measure and a multiple-item scale measuring the same
facet can also provide an estimate for the reliability of the single-item measure. The assumption
of course is that the correlation between these two scores are high, thus indicating that the single-
item measure is a reliable assessor of the domain or construct (or in this case, a facet of the
overall construct of job satisfaction).
Finally, test-retest methodology can also be used to estimate the reliability of a single-
item scale. Essentially, test-retest reliability is estimated when the same test is administered to
the same participant at two different time periods, and the scores on both administrations are
correlated (Carmines & Zeller, 1979). Since job satisfaction has been defined as an evaluation
and was shown to be generally stable over time (Steel & Rentsch, 1997; Staw & Ross, 1985),
this reliability estimate should be practicable assuming no significant changes occur in the
participants’ working environment between the two phases (for more details about the
methodology, see Cohen & Swerdlik, 1999). While memory effects can also impact the
correlation scores in a test retest methodology, the number of questions involved in the reliability
and validity study of the FSS, as well as the duration between retest phases, will likely make it
difficult for participants to remember their individual item scores from the initial testing period
during retest (Nunnally & Bernstein, 1994).
Page 28
21
The second argument against the use of single-item scales revolves around the belief that
these measures will necessarily have lower levels of reliability as compared to multiple-item
scales assessing the same construct (see for a discussion, Loo & Kells, 1998; Thurstone, 1928).
Theoretically, this argument is accurate and has a basis in the domain sampling model stating
that the reliability of a scale increases as more items are used to measure the same domain
(Nunnally & Bernstein, 1994). The argument makes sense, especially considering that any single
item on a scale is viewed as an imperfect measure with a corresponding random error score. By
using multiple-item measures, the error of prediction is reduced, thus providing less biased
assessment of the construct.
However, if the domain is sufficiently narrowly defined (as is the case when measuring
facets of job satisfaction), it is quite feasible to expect that single-item measures would return
acceptable levels of reliability (Sackett & Larson, 1990) which, based on earlier discussion, can
be determined by the five estimates of single-item scale reliability. So despite being a complex
construct overall, facet measures of job satisfaction only focus on more specific and homogenous
domains within the overall construct (Ironson et al., 1989), theoretically allowing us to
effectively use single-item measures. Indeed, research has generated support for this view, with
single-item reliability estimates ranging from α = .70 to .80 for various facets of job satisfaction
(Nagy, 2002; Loo & Kells, 1998). During the initial phase of testing, the single-item facet
measures of the FSS demonstrated acceptable reliability estimate scores between .76 and .96
(Yeoh, 2007).
Scale Validation
Reliability alone (no matter how high the score) is an insufficient measure of the
“quality” of a scale. The concept of reliability focuses primarily on the repeatability or
Page 29
22
consistency of a measure (Nunnally & Bernstein, 1994). As a result “measures that are reliable
have only come half way toward achieving scientific acceptance” (Carmines & Zeller, 1979, p.
16). The other half of the journey towards scientific acceptance as described by Carmines and
Zeller involves the concept of scale validity, which “refers to a judgment concerning how well a
test does in fact measure what it purports to measure” (Cohen & Swerdlik, 1999, p. 175).
Validity itself is made up of three major components, which are (1) content validity, (2)
criterion-related or predictive validity, and (3) construct validity (Nunnally & Bernstein, 1994;
Carmines & Zeller, 1979). This tri-component view of validity has been the prevailing one in
psychology at least since the 1950s (Cohen & Swerdlik, 1999).
Content validity is described as the “judgment concerning how adequately a test samples
behavior representative of the universe of behaviors the test was designed to sample” (Cohen &
Swerdlik, 1999, p. 177). In other words, the concept of content validity has implications in test
construction in terms of ensuring that a scale was designed to adequately cover the entire
construct of interest. In assessing the content validity of a scale, the construct of interest must
first be fully specified, before being sampled by a test using items that represent the entire
domain of the construct (Carmines & Zeller, 1979).
In terms of the FSS, the construct of interest has already been defined as the evaluative
judgment one makes about one’s job or job situation. As a result, content validation of the FSS
should focus on the sampling and measurement of the construct itself. Designed as a facet
measure of job satisfaction, the question of sampling thus revolves around what facets to include
in the study. A review of the literature on job satisfaction facets provided a laundry list of facets
that have often been used to assess the construct (see for examples, Spector, 2000; Weiss, Dawis,
England, & Lofquist, 1967). The most common of these facets however, include those assessing
Page 30
23
pay, promotion, supervision, co-workers, and the work (see for example, the Job Diagnostic
Index, JDI: Smith, Kendall, & Hulin, 1969), along with a benefits facet included by Spector
(1985). While this list of six facets is in no way exhaustive, they have been shown to
significantly assess job satisfaction, with at least an estimated 42.7% of job satisfaction trait
variance accounted for by the first five facets of the JDI alone (Buckley, Carraher, & Cote,
1992).
The second validity component identified by researchers is criterion-related (also known
as predictive) validity. This component of validity is defined as the ability of a measurement
scale to infer or predict a test-taker’s standing on a criterion that is external to the scale itself
(Cohen & Swerdlik,1999; Nunnally & Bernstein, 1994). While some researchers make
distinctions in the types of criterion-related validity based on the temporal relations between the
administration of predictor and criterion measures, the logic and procedures behind criterion-
related validation remains the same (Nunnally & Bernstein 1994). In other words, criterion-
related validity “is determined by, and only by, the degree of correspondence between
predictor(s) and criterion” (Nunnally & Bernstein, 1994, p. 95).
Criterion-related validity is often measured by correlating the score of the scale with an
outcome that is related to the construct of interest (see for examples, Eby, Durley, Evans, &
Ragins, 2008; Lievens, De Corte, & Schollaert, 2008). In the case of a construct like job
satisfaction, researchers often associate the construct with job-related performance (Judge et al.,
2001; Iaffaldano & Muchinsky, 1985). In addition, performance of organizational citizenship
behaviors have also been shown to be a key outcome of satisfied employees (Payne & Webber,
2006; Organ & Ryan, 1995), thus making it possible to use these outcome measures for criterion-
related validation of the FSS. In truth, job satisfaction may be even more highly related to OCBs
Page 31
24
than actual contextual performance due to the voluntary nature of OCBs (see for a review Organ
& Hamner, 1982), although researchers continue to debate this point (Organ & Ryan, 1995).
An alternate measure of the criterion-related validity of the FSS would include assessing
how well the scale measured employee withdrawal behaviors such as absenteeism and turnover.
Job satisfaction has long been shown to be negatively related to these behaviors (see for
examples, Tett & Meyer, 1993; Tharenou, 1993). As a result, obtaining negative correlation
scores between the FSS against measures of employee withdrawal behaviors would provide
additional evidence for criterion-related validity for the scale.
The final component, construct validity, has been described in terms of how well a
particular measure relates to other measures that have been shown to assess that particular
construct (Carmines & Zeller, 1979). Since psychological constructs concern domains of
observables (similar to how an attitude can be inferred from observations of behaviors),
including more measures that adequately assess the construct is a key method to increasing
construct validity (see for a discussion, Nunnally & Bernstein, 1994). However, adding more
measures may not always be feasible (due to time, space, cost, or other constraints), so a measure
“can be thought of as having construct validity to the extent that results obtained from it would
remain the same if other measures in the domain were used” (Nunnally & Bernstein, 1994, p.
86).
As a result, construct validation of a scale should include evidence that the scale
measures a singular construct, and that the scale correlates with other scales that have been
shown over time to assess the construct in question (and by extension, evidence that it does not
relate to scales that do not assess the same construct) (Cohen & Swerdlik, 1999). The strong
correlation between two scales measuring the same construct has been termed convergent
Page 32
25
validity, while the low or lack of correlation between scales that do not measure the same
construct is known as divergent validity (Nunnally & Bernstein, 1994). In addition, construct
validity is not established from the results of a single study alone, but instead garners validity
evidence as more supporting research is conducted on a particular measurement scale (Carmines
& Zeller, 1979). In the case of the FSS, this study was designed to be the initial validation test of
the scale, with the goal of providing the first in a series of research evidence of the validity of the
scale.
Summary and Hypotheses
A review of the literature has shown that job satisfaction is significantly related to
important work-related outcomes, not just for the organization but for its employees as well
(Grant, 2008; Lambert et al., 2005; Judge et al., 2001; Griffeth et al., 2000). Unfortunately, the
relationship between job satisfaction and these outcomes are typically low to moderate (see
Judge et al., 2001; Iaffaldano & Muchinsky, 1985). Various reasons have been proposed for the
low relationships, including improper construct definitions and inconsistent measurement scales
(Huff, Tekell, & Yeoh, 2005; Brief & Weiss, 2002; Brief & Weiss, 1989).
An initial study by Yeoh (2007) was designed to address these issues through the creation
of the Facet Satisfaction Scale (FSS), a facet measure of job satisfaction that uses semantic
differential response scales to assess the construct as the evaluation of an attitude. This study was
conceived as a follow-up to the creation of the FSS. While the original study finalized the items
used in the FSS and assessed the reliability of the scale, this study instead focused on both
replicating the reliability study as well as adding a validation analysis of the FSS.
In order to adequately determine the validity of the FSS, several research hypotheses
were proposed. In regards to the replication of the FSS reliability study, the same methodology
Page 33
26
as Yeoh (2007) was used. Specifically, internal consistency reliability of the complete version of
the FSS was previously determined using Cronbach’s α, while four estimates of single-item
reliability were originally used to determine the scale reliability of the shortened FSS (Yeoh,
2007). These methods were reapplied as part of the replication study to determine FSS reliability,
but with the addition of a test-retest reliability measure added to both the complete and shortened
scale to further provide reliability evidence.
Hypothesis 1a: The complete FSS will demonstrate evidence of reliability (with an r of no less
than .70) as determined through the use of Cronbach’s α and test-retest
reliability measures.
Hypothesis 1b: The shortened FSS will demonstrate evidence of reliability (with an r of no less
than .70) as determined through five estimates of single-item reliability2
In addition to replicating the reliability analysis, this study also focused on determining
the validity of the FSS. Three major categories of validity were discussed, which were (1)
content validity, (2) criterion-related validity, and (3) construct validity. Each validity category
can be measured through different methods (see for discussions, Cohen & Swerdlik, 1999;
Nunnally & Bernstein, 1994; Carmines & Zeller, 1979). As a result, various validation methods
were used to examine the validity of both the complete and shortened versions of the FSS.
Hypothesis 2a: The complete and shortened versions of the FSS will demonstrate evidence of
construct validity through convergent and divergent validation against existing
scales measuring job and life satisfaction, where scores of the FSS will be
more strongly correlated to those of the JSS compared to the SWLS.
2 The five estimates of single-item reliability are (1) correction for attenuation, (2) factor analysis communalities, (3) Cronbach’s α, (4) correlations between single-item measures and a multi-item scale, and (5) test-retest as discussed in an earlier section of this paper.
Page 34
27
Hypothesis 2b: The complete and shortened versions of the FSS will demonstrate evidence of
content validity, and will account for more than the 43% of total construct
variance explained during validation of the JDI, through the use factor analysis.
Hypothesis 2c: The complete and shortened versions of the FSS will demonstrate evidence of
criterion-related validity through the scale’s ability to significantly predict
outcomes previously shown to be influenced by job satisfaction, including job
performance and organizational citizenship behavior, and employee
withdrawal behaviors.
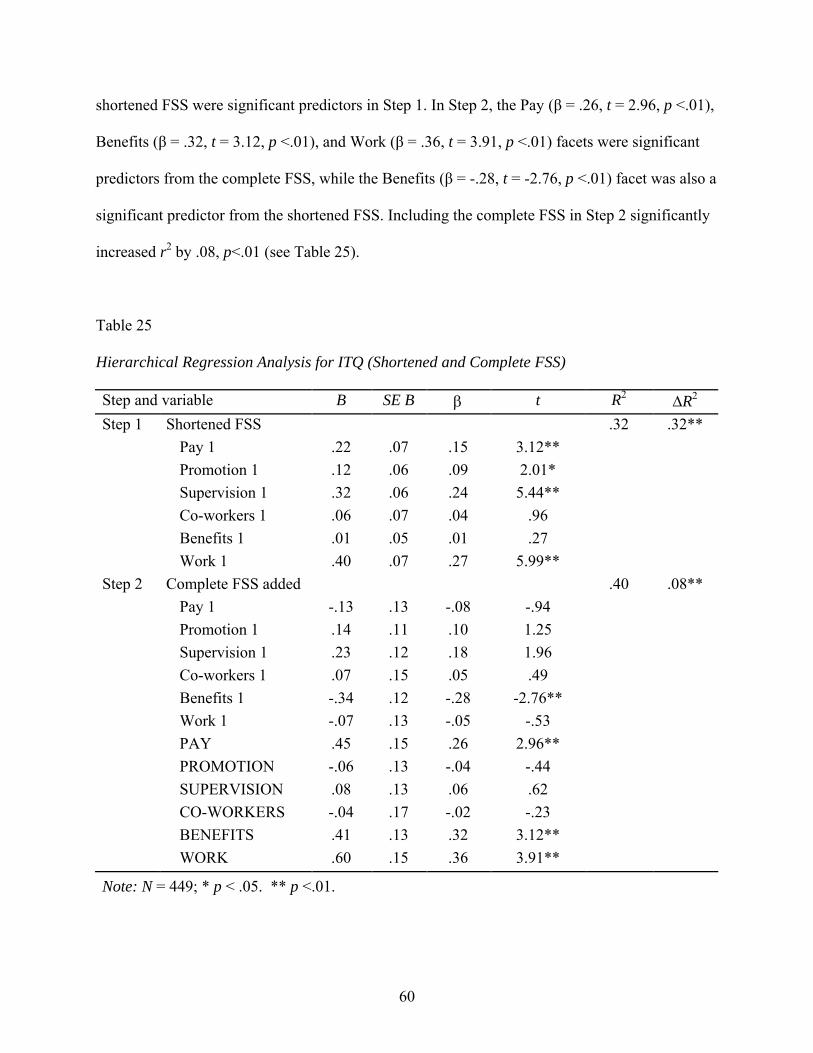
Page 35
28
CHAPTER 2
METHODS
Participants
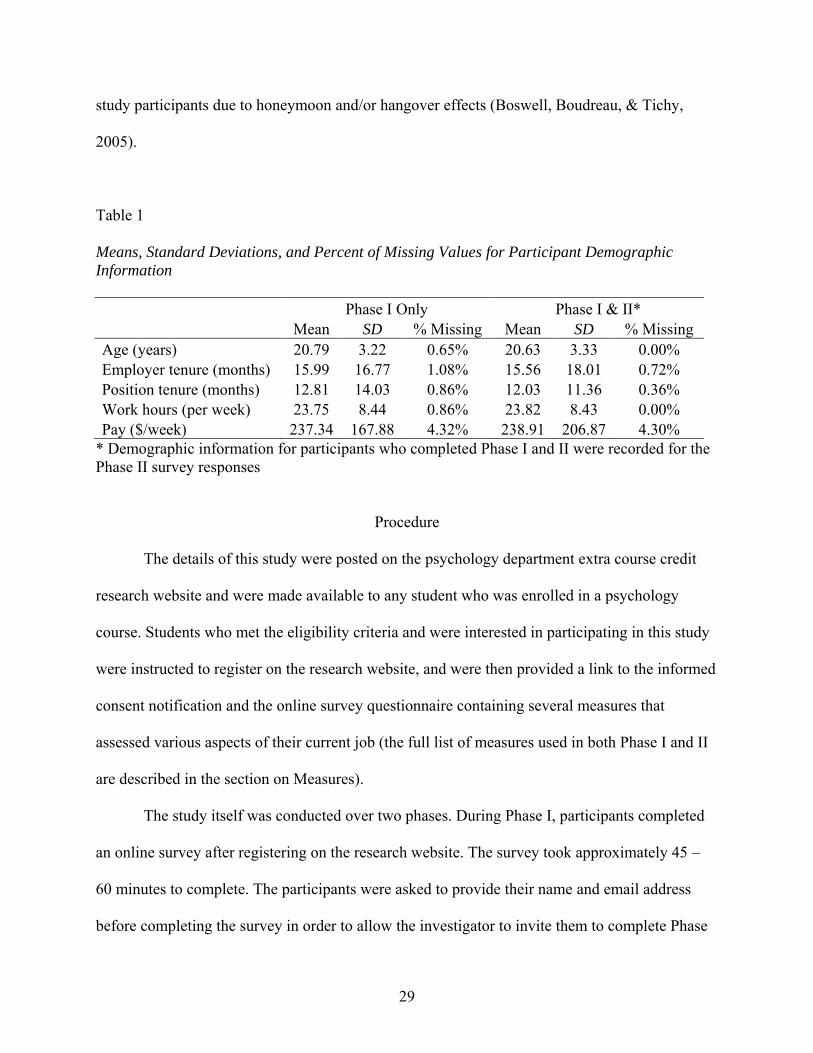
This study was conducted over two phases at a large southwestern public university. A
total of 742 students participated in this study. Of that total, 463 students completed only Phase I
of the study. The gender breakdown of the participants who completed only Phase I of the study
was 38.4% male and 60.9% female, with 3 participants (0.6%) declining to respond to this
question. The average age of these participants was 20.8 years, with an average organizational
and position tenure of 16.0 and 12.8 months respectively. These participants worked an average
of 23.8 hours per week, earning on average $237.34 per week.
An additional 279 students completed both Phase I and II of the study. The gender
breakdown for participants who completed both Phase I and II of the study was 23.3% male and
76.3% female, with one participant (0.4%) declining to respond to the question. At the point
when these participants complete the Phase II survey, they reported an average age of 20.5 years,
and had an average organizational and position tenure of 15.6 and 12.0 months respectively.
These participants worked an average of 23.8 hours a week at their current job, earning an
average of $238.91 per week. A summary of participant demographic information is presented in
Table 1.
Participants were required to have worked at their current employer for a period of at
least 30 days, at a rate of at least 15 hours a week or more in order to be eligible to participate in
this study. This eligibility requirement was put in place in order to ensure that the participants
have had adequate time to form complete attitudes about their jobs. Specifically, it was expected
that this requirement would help minimize any instabilities in the job-related attitudes of the
Page 36
29
study participants due to honeymoon and/or hangover effects (Boswell, Boudreau, & Tichy,
2005).
Table 1
Means, Standard Deviations, and Percent of Missing Values for Participant Demographic
Information
Phase I Only Phase I & II*
Mean SD % Missing Mean SD % Missing
Age (years) 20.79 3.22 0.65% 20.63 3.33 0.00% Employer tenure (months) 15.99 16.77 1.08% 15.56 18.01 0.72% Position tenure (months) 12.81 14.03 0.86% 12.03 11.36 0.36% Work hours (per week) 23.75 8.44 0.86% 23.82 8.43 0.00% Pay ($/week) 237.34 167.88 4.32% 238.91 206.87 4.30%
* Demographic information for participants who completed Phase I and II were recorded for the Phase II survey responses
Procedure
The details of this study were posted on the psychology department extra course credit
research website and were made available to any student who was enrolled in a psychology
course. Students who met the eligibility criteria and were interested in participating in this study
were instructed to register on the research website, and were then provided a link to the informed
consent notification and the online survey questionnaire containing several measures that
assessed various aspects of their current job (the full list of measures used in both Phase I and II
are described in the section on Measures).
The study itself was conducted over two phases. During Phase I, participants completed
an online survey after registering on the research website. The survey took approximately 45 –
60 minutes to complete. The participants were asked to provide their name and email address
before completing the survey in order to allow the investigator to invite them to complete Phase
Page 37
30
II of the study. Upon completion of the Phase I survey, the participants were awarded two (2)
extra credit points for research participation.
Participants who completed Phase I were sent an email invitation to complete Phase II of
the study one month after they completed the first phase. The email contained instructions and a
pass code that allowed the participant to register and complete the second phase of this study.
Phase II of this study took approximately 30 minutes to complete and the participants were
awarded an additional one (1) extra credit point for research participation.
Due to the need to match up survey participants from Phase I to Phase II, participants
were asked to provide their name and contact information (email address) during both phases of
the study. In addition, participants who wished to receive extra course credit for participating in
research studies were also asked to provide their university identification number. The
participants’ personally identifiable data were kept separate from the research data, and were
used solely for record-keeping purposes (to contact participants for the second phase of the
study, match up Phase I – Phase II responses, and to grant extra research credit). This procedure
was put in place to ensure participant anonymity.
The total number of participants who took part in this study was 742. Of these, 528 were
invited to participate in Phase II.3 The email invitation to participate in Phase II was sent at least
30 days after a participant completed Phase I. A reminder email was also sent one week after the
initial Phase II survey invitation to those participants who had not yet completed the Phase II
survey by that time. A total of 279 participants completed Phase II, for a response rate of 52.8%.
The response data for this study was then divided into two separate data sets. The responses for
participants who completed only Phase I of the study (463 responses) was used to conduct the
3 Only 528 of the total 742 participants who completed Phase I of this study were invited to complete the Phase II survey as the university academic semester came to an end before the 30-day interval was reached for the remaining participants.
Page 38
31
validity analyses, while responses for those who completed both Phase I and II (279 responses)
was used to conduct the reliability analyses.
It was originally estimated that the dropout rate between phases of the study would be
range between 15.8% and 16.4% (see for examples, Worthington, Navarro, Savoy, & Bielstein,
2008; Foa, Zoellner, Feeny, Hembree, & Alvarez-Conrad, 2002). Unfortunately, the dropout rate
for this study (47.2%) was much higher than originally expected, likely due to the email
invitation to the Phase II survey being caught in the participants’ email spam filter. As a result, in
order to obtain the required number of participant responses (it was expected that a minimum of
240 responses would be required for this study based on factor analysis requirements according
to Tabachnik and Fidell, 2001), email invitations were sent to participants who had completed
the Phase I survey until the end of the university academic semester. This resulted in a total of
279 participants who completed both Phase I and II of the study (a 10% buffer was included to
help offset possible duplicate and incomplete survey responses). This resulted in a total of 463
usable responses, after removal of duplicates and incomplete surveys (incomplete surveys were
defined as those survey responses where the participant abandoned/terminated the survey before
completing the final page of the web survey) gathered for Phase I only, and an additional 279
responses that were gathered for those participants who completed both Phase I and Phase II of
this study.
Measures
A brief description of the measurement scales used in this study are listed below.
Facet Satisfaction Scale
The Facet Satisfaction Scale (FSS: Yeoh, 2007) was developed to improve upon existing
measures of job satisfaction. FSS scale items were refined based on feedback after the initial
Page 39
32
study to better reflect evaluative dimensions. The final form of the FSS includes two different
versions of the scale – a complete FSS which uses 4-item subscales to measure each of the six
job satisfaction facets (pay, promotion, supervisors, co-workers, benefits, and the work itself),
and a shortened FSS which uses single-item subscales measuring the same six facets. Each item
on both the complete and shortened FSS is assessed using semantic differential scales, with item
stems and end points designed to elicit evaluative responses to the participants’ jobs in a manner
similar to the General Evaluative Scale (Crites, Fabrigar, & Petty, 1994). Reliability scores for
the facets of the complete and shortened FSS were reported at .89 to .95, and .85 to .95
respectively (Yeoh, 2007).
Faces Scale
The Faces Scale (Kunin, 1955) is a single-item measure of overall job satisfaction.
Participants are required to circle one of eleven faces that best corresponds to their feelings about
their job in general. The version of the Faces scale used in this study was slightly altered to
appear more androgynous (see Huff, 2000). Internal consistency reliability for the scale has been
estimated at .88 (Lau & Murnighan, 2005).
Job Satisfaction Survey
The Job Satisfaction Survey (JSS: Spector, 1985) is a facet measure of job satisfaction
measuring nine facets using 36 items (four items per facet). The facets measured by the JSS are
pay, promotion, supervisor, benefits, rewards, operating procedure, co-workers, work itself, and
communication (Fields, 2002). Response scale for the JSS is a 6-point Likert scale ranging from
disagree very much to agree very much. Overall scale reliability was reported at .91, with
internal consistency of the facets ranging from .60 to .82 (Spector, 1985).
Organizational Citizenship Behaviors
Page 40
33
The Organizational Citizenship Behaviors (OCB: Williams & Anderson, 1991) is a 21-
item scale measuring citizenship behaviors towards the organization, towards specific
individuals within the organization, and in-role behaviors with seven items measuring each of the
three subscales. The response scale is a 5-point Likert scale with end-points ranging from
strongly disagree to strongly agree. Coefficient alpha values for the subscales have been
reported ranging from .61 to .94 (Fields, 2002).
Satisfaction With Life Scale
The Satisfaction With Life Scale (SWLS: Diener, Emmons, Larsen, & Griffin, 1985) is a
5-item scale designed to measure an individual’s subjective well-being. The response scale is
based on a 7-point Likert scale ranging from strongly disagree to strongly agree. Coefficient α
for the scale was reported at .87, with test-retest reliability evidence of .82 over a two-month
time period (Diener et al., 1985).
Intent-to-Quit
Intent-to-quit was measured using a single-item derived from the Job Diagnostic Survey
(JDS: Hackman & Oldham, 1974). The response scale for this item is a 7-point Likert scale
ranging from disagree strongly to agree strongly.
Demographic Information
Participant demographic information was also collected at the end of the study. This
included information about the participants’ age, gender, level of education, position and
organizational tenure, average weekly work hours, and salary range.
Page 41
34
CHAPTER 3
RESULTS
Descriptive Statistics
Table 2
Means, Standard Deviations, and Percent of Missing Values for the FSS Items
Phase I Phase I & II*
Mean SD Missing (%) Mean SD Missing (%)
Pay1 3.62 1.31 0.00% 3.76 1.40 0.00% Pay2 3.69 1.31 1.10% 3.87 1.32 0.72% Pay3 3.99 1.31 1.50% 3.99 1.37 0.72% Pay4 3.92 1.36 1.70% 3.96 1.37 0.72% Promotion1 3.23 1.52 0.60% 3.21 1.49 0.00% Promotion2 3.32 1.53 1.70% 3.35 1.51 1.08% Promotion3 3.7 1.5 1.50% 3.63 1.51 1.08% Promotion4 3.69 1.48 1.90% 3.61 1.57 0.72% Supervision1 4.19 1.52 0.60% 4.20 1.59 0.36% Supervision2 4.2 1.5 1.50% 4.27 1.53 1.08% Supervision3 4.19 1.52 0.90% 4.29 1.51 1.08% Supervision4 4.21 1.53 1.30% 4.29 1.55 1.43% Co-workers1 4.53 1.31 1.10% 4.48 1.25 0.00% Co-workers2 4.52 1.28 1.50% 4.52 1.20 0.72% Co-workers3 4.62 1.22 1.10% 4.55 1.18 0.72% Co-workers4 4.63 1.24 1.10% 4.55 1.22 1.08% Benefits1 2.94 1.66 0.20% 2.99 1.58 0.36% Benefits2 2.95 1.66 1.10% 3.05 1.55 0.72% Benefits3 3.31 1.7 0.60% 3.29 1.63 0.72% Benefits4 3.26 1.7 0.60% 3.28 1.63 1.08% Work1 4.27 1.36 0.60% 4.19 1.37 0.00% Work2 4.28 1.34 0.90% 4.23 1.36 1.43% Work3 4.42 1.27 1.10% 4.32 1.37 1.43% Work4 4.31 1.36 1.10% 4.27 1.37 1.08%
*FSS items descriptive information for participants who completed Phase I and II were recorded for the Phase II survey responses
Page 42
35
Statistical analyses for this study were conducted using SPSS v.18 unless otherwise
specified. The means, standard deviations, and percent of missing values for the 24 items of the
Facet Satisfaction Scale (FSS) are presented in Table 2 (these values are reported separately for
participants who completed only Phase I of the study and those who completed both Phase I and
II). Missing values were not a significant issue for the FSS items across either phase of this
study, with less than 2% missing values reported for any single FSS item for both Phase I and
Phase II respondents.
Reliability
Complete FSS
Reliability for the Facet Satisfaction Scale (FSS) was assessed for both the complete (24-
item) and shortened (6-item) versions of the scale. The reliability for the complete FSS was
assessed using Cronbach’s α and test-retest methodology, with results reported in Table 3.
Cronbach’s α scores for each of the six subscales of the complete FSS scale were excellent
across the board (see Gliem & Gliem, 2003, for a brief review on interpretation of Cronbach’s α
scores) and ranged from .92 (Promotion subscale) to .96 (Benefits subscale). Inter-item
correlations ranged from .78 to .93 across the six subscales. Test-retest reliability scores for the
complete FSS were found to be lower than the Cronbach α internal consistency scores, but were
significant (at the p < .01 level) across the board nevertheless. The test-retest reliability scores,
which have been shown to be the lower boundary for reliability (see Guttman, 1945), ranged
from .53 to .66 across the two phases separated by at least 30 days (see Table 3). To summarize,
the Cronbach's α scores for the complete FSS was higher across the board than the hypothesized
level of .70, but the test-retest reliability scores were not.
Page 43
36
As a result of the lower than expected test-retest reliability score, an additional set of
regression and correlation analyses was also conducted to examine the reliability of the scale.
The impetus of this analysis was based on results from research indicating that job satisfaction
may not be an entirely stable construct as described by researchers (see for examples Gerhard,
2005; Salancik & Pfeffer, 1978). In these analyses, the FSS scores from both Phase I and II of
the study were used as predictors in separate linear regression analyses targeting the time interval
between the two phases (essentially a dummy time variable obtained by subtracting each
participant’s completion date/time of the Phase I survey from the completion date/time of the
Phase II survey). The regression residuals obtained when using Phase I as a predictor were then
correlated to the corresponding residuals obtained when Phase II was used as a predictor. The
residuals in a regression analysis typically provide a gauge on the efficacy (or inefficacy) of a
predictor as it is the difference between the predicted and obtained score (Tabachnick & Fidell,
2001).
Table 3
Cronbach’s α Values for the Complete FSS
Facet Cronbach’s α
Test-retest reliability α Range of item-total correlations
Pay .93 .81 - .84 .66** Promotion .92 .78 - .85 .57** Supervisor .94 .84 - .88 .59** Coworkers .94 .85 - .87 .53** Benefits .96 .88 - .93 .58** Work .94 .84 - .88 .61** * p < .05 ** p < .01
Page 44
37
In this instance however, using the same dummy variable as the dependent variable in the
regression analyses allowed for a direct comparison of the errors in prediction of an individual
respondent’s scores across both phases. The correlation between the unstandardized residuals
was .99, thus indicating that Phase I and Phase II scores generated the same or similar errors in
prediction of the dummy variable, and by extension shows evidence of a strong relationship
between the test scores on both phases.4 While this may not be the typical use for regression
residuals, the strong correlation here was taken to be indicative of a similarity in the participants’
scores from Phase I and Phase II, and thus evidence of test-retest reliability. The results of these
analyses thus showed support for Hypothesis 1a, that the complete FSS would show evidence of
scale reliability.
Shortened FSS
The reliability of the shortened version of the FSS was assessed using the five estimates
of single-item reliability (correction for attenuation, factor analysis communality, Cronbach’s α,
correlation between the shortened scale and complete scale, and test-retest). The results of the
single-item reliability analyses are presented in Table 4.
The correction for attenuation estimate (see Equation 3) for single-item reliability was
obtained by dividing the square of the correlation between the single-item and multi-item
subscale of the FSS by the reliability of the multi-item subscale (in this case, the internal
consistency score obtained using Cronbach’s α was used). This resulted in a reliability estimate
ranging from .84 (Promotion subscale) to .93 (Work subscale) for the various single-item
measures.
4 In addition, these results also imply support for the view that job satisfaction is not entirely stable across time.
Page 45
38
Table 4
Reliability Analysis for the Shortened FSS
Facet Correction
for attenuation
Factor analysis
communality
Item-total correlations
Single-item to multi-item correlation
Test-retest reliability
Pay .89 .85 .84 .91** .66** Promotion .84 .82 .78 .88** .56** Supervisor .90 .80 .85 .92** .56** Coworkers .90 .87 .85 .92** .52** Benefits .90 .90 .88 .93** .59** Work .93 .87 .88 .93** .61** * p < .05 ** p < .01
The factor analysis communality scores were used as the second estimate of reliability for
the shortened FSS. The communalities for each item comprising of the shortened FSS were
obtained from the factor analysis conducted on the complete scale. The communality scores
ranged from .79 (Supervisor subscale) to .90 (Benefits subscale).
Similarly, the Cronbach’s α reliability estimate score was also obtained from the analysis
conducted upon the complete scale. The item-total correlation score (for each item in the
subscale that comprises the shortened scale version of the FSS) obtained when conducting
Cronbach’s α reliability testing on the complete scale was used as the reliability estimate for the
shortened scale. These estimates ranged from .78 (Promotion subscale) to .88 (Benefits and
Work subscales).
The fourth estimate of reliability for the shortened FSS was conducted by correlating the
single-item subscale score against the score of the corresponding multi-item subscale. The
reliability estimates obtained using this method ranged from .88 (Promotion subscale) to .93
(Work subscale).
Page 46
39
Finally, test-retest methodology was used as the fifth estimate of single-item reliability
for the shortened FSS. The reliability estimates for the shortened FSS obtained via test-retest
ranged from .52 (Co-workers subscale) to .66 (Pay subscale). The test-retest correlation scores
for the shortened FSS were also significant across the board at the p < .01 level of significance.
A correlation analysis of the regression residuals (similar to the procedure conducted to
further examine the test-retest reliability of the complete FSS) was also conducted for the
shortened FSS. The correlation between the regression residuals for Phase I and Phase II for the
shortened FSS was also .99. This implied (as it also did for the complete FSS), that job
satisfaction for these participants may not be a stable construct whose reliability can accurately
be measured by test-retest methodology.
A quick review of the reliability analyses results indicated that the shortened FSS
exhibited evidence of scale reliability, with four of the five estimates of single-item reliability
returning scores above the hypothesized minimum of .70, thus providing support for Hypothesis
1b. A summary of the results of the reliability analysis for each single-item subscale of the FSS
is presented in Table 4.
Construct Validity
Complete FSS
In order to determine the construct validity of the complete FSS, both convergent and
divergent validation evidence are presented for the Facet Satisfaction Scale (the results of the
correlation analyses are presented in Tables 5 – 10). For convergent validation, a correlation
analysis was conducted where the subscales from the complete FSS was correlated to subscales
from the Job Satisfaction Survey (JSS; Spector, 1985) which purported to measure the same
facets. Results of the analyses showed significant correlations between the FSS and JSS
Page 47
40
subscales measuring the same facets, with r ranging from .52 (Benefits subscale) to .76
(Supervision subscale).
In terms of divergent validity evidence, the complete FSS was correlated with the
Satisfaction With Life Scale (SWLS; Diener, Emmons, Larsen, & Griffin, 1985). A measure of
life satisfaction (specifically subjective well-being) was selected for divergent validation as
research has shown that this construct typically has a weaker relationship to job satisfaction (see
for examples, Moser & Schuler, 2004; Judge et al., 2001). The result of the correlation analysis
indicated a weak relationship between the complete FSS subscales and the SWLS, with r ranging
from .16 (Co-workers subscale) to .33 (Work subscale). This generated support for the divergent
validity of the complete FSS. Taken together, the results of the convergent and divergent validity
analyses indicate that there is evidence of construct validity for the complete FSS, which
supports Hypothesis 2a.
Table 5
Construct Validity Analysis of the FSS Pay Subscale
Factor Mean SD 1 2 3 1. Shortened FSS Pay 3.62 1.31 2. Complete FSS Pay 3.81 1.16 .88** 3. JSS Pay 3.31 1.11 .58** .59** 4. SWLS 4.51 1.32 .27** .29** .33** * p < .05 ** p < .01
Page 48
41
Table 6
Construct Validity Analysis of the FSS Promotion Subscale
Factor Mean SD 1 2 3 1. Shortened FSS Promotion 3.23 1.52 2. Complete FSS Promotion 3.49 1.34 .88** 3. JSS Promotion 3.16 1.20 .60** .60** 4. SWLS 4.51 1.32 .25** .25** .24** * p < .05 ** p < .01
Table 7
Construct Validity Analysis of the FSS Supervision Subscale
Factor Mean SD 1 2 3 1. Shortened FSS Supervision 4.19 1.52 2. Complete FSS Supervision 4.20 1.38 .90** 3. JSS Supervision 4.47 1.19 .74** .76** 4. SWLS 4.51 1.32 .28** .30** .29** * p < .05 ** p < .01
Table 8
Construct Validity Analysis of the FSS Co-Workers Subscale
Factor Mean SD 1 2 3 1. Shortened FSS Co-workers 4.53 1.31 2. Complete FSS Co-workers 4.57 1.14 .91** 3. JSS Co-workers 4.44 .97 .62** .65** 4. SWLS 4.51 1.32 .19** .16** .25** * p < .05 ** p < .01
Page 49
42
Table 9
Construct Validity Analysis of the FSS Benefits Subscale
Factor Mean SD 1 2 3 1. Shortened FSS Benefits 2.94 1.66 2. Complete FSS Benefits 3.11 1.56 .92** 3. JSS Benefits 3.49 .72 .49** .52** 4. SWLS 4.51 1.32 .29** .29** .24** * p < .05 ** p < .01
Table 10
Construct Validity Analysis of the FSS Work Subscale
Factor Mean SD 1 2 3 1. Shortened FSS Work 4.27 1.36 2. Complete FSS Work 4.31 1.20 .90** 3. JSS Work 3.92 1.30 .60** .64** 4. SWLS 4.51 1.32 .33** .33** .45** * p < .05 ** p < .01
Shortened FSS
Evidence of construct validity for the shortened FSS was ascertained using the same
methodology that was used in analyzing the complete FSS, with the results of the correlation
analyses being presented in Tables 5 – 10. In terms of convergent validity, the shortened FSS
facets exhibited significant correlations when measured against corresponding factors on the Job
Satisfaction Survey (JSS; Spector, 1985). These correlations ranged from moderate to high with
an r of .49 (Benefits subscale) to .74 (Supervision subscale).
The divergent validity analyses for the shortened FSS were conducted by measuring the
correlation between the scores of the shortened FSS subscales against the scores of the
Satisfaction With Life Scale (SWLS; Diener et al., 1985). As expected, the results of these
Page 50
43
analyses showed that the correlation between the shortened FSS subscales and the SWLS were
lower than the correlations between the shortened FSS and the JSS. The coefficients for the
shortened FSS – SWLS correlations ranged from .19 (Co-workers subscale) to .33 (Work
subscale). These results provide evidence of construct validity for the shortened FSS, as well as
further support for Hypothesis 2a.
Content Validity
Complete FSS
The content validity for the complete FSS was examined using both confirmatory and
exploratory factor analysis methodology (the confirmatory factor analysis was conducted using
Amos v.18). The confirmatory factor analysis was selected to provide evidence of good FSS
factor structure, while the exploratory factor analysis would provide the estimate of construct
variance accounted for by the scale. A 24-item six-factor model was chosen for analysis based on
prior work by Yeoh (2007). In this model, the individual items were expected to load
significantly onto each of the six job satisfaction facets, which were in turn expected to load onto
the higher-order "Job Satisfaction" construct. The factor structure chosen to represent the FSS is
presented in Figure 1, with the corresponding fit indices obtained for this factor structure
summarized in Table 11.
Model fit was assessed using the following indices – Bentler comparative fit index (CFI),
goodness-of-fit index (GFI), adjusted GFI (AGFI), Bentler-Bonnett normed fit index (NFI), and
root mean square error of approximation (RMSEA). Based on conventional model fit thresholds,
moderate fit was assumed given CFI, GFI, AGFI, and NFI values above .90, and RMSEA values
below .08, while good fit was assumed given CFI, GFI, AGFI, and NFI values above .95, and
RMSEA values below .06 (Beauducel & Wittmann, 2005). The chi-square method of assessing
Page 51
44
model fit was also reported, but was not used to determine model fit as the chi-square tends to be
significant regardless of actual model fit when dealing with large sample sizes (Kline, 2005).
Results of the confirmatory factor analysis indicate poor fit for the complete FSS factor structure
(see model fit indices in Table 11).
Table 11
Model Fit Indices for the Complete and Shortened Facet Satisfaction Scale
Fit indices Complete FSS Shortened FSS* GFI .66 .99 AGFI .59 .97 RMSEA .13 .04 NFI .80 .96 CFI .82 .98 Chi-square** 2150.00*** 15.98*** DF 246 9 * Model for the Shortened FSS reflected a six-item one-factor model (see Figure 2) ** Chi-square values were reported, but were not used to predict model fit. *** p < .01
Despite showing poor model fit based on the conventional factor analysis thresholds, the
items in the complete FSS nevertheless accounted for a significant amount of variance in the job
satisfaction construct. The amount of variance in job satisfaction accounted for by the complete
FSS was determined using a principal axis factoring promax rotation factor analysis. The six-
factor structure accounted for 81.66% of total variance in job satisfaction. The items for each
factor loaded significantly onto six separate factors (all item loadings were above .30). In
addition, no items showed significant cross-loadings above .30 (highest obtained cross-loading
was .05 for the Co-workers 4 item). The factor loadings matrix is described in Table 12.
Page 52
45
Pay 1
Work 4
Work 3
Work 2
Work 1
Benefits 4
Benefits 3
Benefits 2
Benefits 1
Co-workers 4
Co-workers 3
Co-workers 2
Co-workers 1
Supervision 4
Supervision 3
Supervision 2
Supervision 1
Promotion 4
Promotion 3
Promotion 2
Promotion 1
Pay 4
Pay 3
Pay 2
PAY
WORK
BENEFITS
CO-WORKERS
SUPERVISION
PROMOTION
JOB
SATISFACTION
Figure 1. Proposed six-factor complete Facet Satisfaction Scale structure.
Page 53
46
Due to the incongruity between the results of the confirmatory and exploratory factor
analyses, one additional factor analysis study was conducted in an attempt to determine if the
FSS items truly loaded onto the correct facets. Specifically, a principal axis factoring promax
rotated factor analysis was conducted using all 24-items of the complete FSS as well as 24
additional items from the corresponding six facets of the JSS. It was proposed that the items
from the FSS and the items making up the corresponding facets of the JSS (a scale that has been
previously validated in research by Spector, 1985) would load onto the same factor. The
occurrence of this event would thus generate evidence of good factor structure for the FSS.
The results of the 48-item factor analysis are presented in Table 13. The items from the
Promotion, Supervision, Benefits, and Work scales of both the FSS and JSS loaded well onto
their corresponding facets with no cross loading reported above .30. In terms of the Pay and Co-
workers scales, the FSS items for these two subscales loaded onto two separate factors with no
evidence of cross-loadings above .30. The JSS items for these two subscales however, did not
exhibit as good a factor structure. Specifically, for the Pay subscale, two JSS items (Pay2 and
Pay3) did not show any significant loadings, while one JSS item (Pay4) was found to load onto
the Promotion facet instead of the Pay facet. For the Co-workers subscale, two items from the
JSS (Co-workers2 and Co-workers4) did not show any significant factor loadings above .30.
These results indicate that the FSS exhibits evidence of a good model fit since items from
four of the six job satisfaction facets measured (Promotion, Supervision, Benefits, and Work)
loaded onto the same factor as items from an established scale like the JSS. The items from the
FSS Pay and Co-workers facets also showed evidence of good factor loading by loading only
onto two separate factors (with no evidence of cross-loading above .30), while the corresponding
items from the JSS exhibited poorer factor loading scores for these two facets. These findings
Page 54
47
provide evidence of good factor structure for the FSS, despite the poor model fit obtained from
the confirmatory factor analysis.
Table 12
Rotated Factor Loadings Matrix for the Six-Factor Complete FSS+
Factor 1 2 3 4 5 6
Pay 1 .81 Pay 2 .83 Pay 3 .86 Pay 4 .82 Promotion 1 .83 Promotion 2 .88 Promotion 3 .88 Promotion 4 .83 Supervision 1 .85 Supervision 2 .90 Supervision 3 .89 Supervision 4 .85 Co-workers 1 .89 Co-workers 2 .86 Co-workers 3 .85 Co-workers 4 .86 Benefits 1 .89 Benefits 2 .93 Benefits 3 .90 Benefits 4 .91 Work 1 .86 Work 2 .91 Work 3 .87 Work 4 .82 +Factor loadings less than .30 suppressed
Shortened FSS
The shortened version of the FSS was also analyzed using confirmatory factor analysis
methodology. The factor structure used for the analysis of the shortened FSS was different
compared to that used in the complete FSS, and is described in Figure 2. This factor structure
Page 55
48
was proposed in order to bypass the need to include separate factors since the shortened FSS
includes only one item to represent each factor. The results of the confirmatory factor analysis
indicate good model fit for the shortened FSS (see Table 4 for model fit indices), which provides
support for Hypothesis 2b for the shortened FSS.
Pay 1
Work 1
Benefits 1
Co-workers 1
Supervision 1
Promotion 1
JOB
SATISFACTION
Figure 2. Proposed six-item shortened Facet Satisfaction Scale structure.
Page 56
49
Table 13
Rotated Factor Loadings Matrix for the Items from the FSS and JSS+
Factor 1 2 3 4 5 6
FSS Pay1 0.85 FSS Pay2 0.88 FSS Pay3 0.84 FSS Pay4 0.82 JSS Pay1 0.61 JSS Pay2 JSS Pay3 JSS Pay4 0.53 FSS Promotion1 0.88 FSS Promotion2 0.89 FSS Promotion3 0.80 FSS Promotion4 0.74 JSS Promotion1 0.66 JSS Promotion2 0.60 JSS Promotion3 0.60 JSS Promotion4 0.76 FSS Supervision1 0.89 FSS Supervision2 0.90 FSS Supervision3 0.82 FSS Supervision4 0.82 JSS Supervisor1 0.67 JSS Supervisor2 0.72 JSS Supervisor3 0.76 JSS Supervisor4 0.80 FSS Co-workers1 0.92 FSS Co-workers2 0.91 FSS Co-workers3 0.81 FSS Co-workers4 0.83 JSS Co-workers1 0.70 JSS Co-workers2 JSS Co-workers3 0.75 JSS Co-workers4 FSS Benefits1 0.90 FSS Benefits2 0.92 FSS Benefits3 0.87 FSS Benefits4 0.87 JSS Benefits1 0.59 JSS Benefits2 0.70 JSS Benefits3 -0.74 JSS Benefits4 0.60 FSS Work1 0.85 FSS Work2 0.89 FSS Work3 0.83 FSS Work4 0.81 JSS Work1 0.49 JSS Work2 0.80 JSS Work3 0.70 JSS Work4 0.73 +Factor loadings less than .30 suppressed
Page 57
50
Criterion-related Validity
Complete FSS
The complete version of the FSS was used in regression analyses to predict four separate
job-related outcomes (organizational citizenship behavior – individuals: OCBI, organizational
citizenship behavior – organization: OCBO, in-role behavior: IRB, and intent-to-quit: ITQ). In
summary, the results of the regression analyses showed that the complete FSS was a significant
predictor of all four outcomes, with r2 values ranging from .16 (OCBI and OCBO) to .38 (intent-
to-quit), which provided evidence of criterion-related validity and support for Hypothesis 2c. The
results of the four regression analyses are presented in Tables 14 – 17.
For organization citizenship behaviors towards individuals (M = 3.73, SD = .71), the
complete FSS was shown to be a significant predictor such that F (6, 451) = 13.89, p < .01. The
Promotion (β = .17, t = 3.44, p <.01), Supervision (β = .13, t = 2.63, p <.01), Co-workers (β =
.12, t = 2.42, p <.05), and Work (β = .16, t = 3.08, p <.01) facets were significant predictors of
OCBI (see Table 14).
For organization citizenship behaviors towards the organization (M = 3.88, SD = .61), the
complete FSS was also shown to be a significant predictor such that F (6, 446) = 13.72, p < .01.
The Supervision (β = .15, t = 2.99, p <.01), Co-workers (β = .10, t = 2.03, p <.05), and Work (β =
.21, t = 4.15, p <.01) facets were significant predictors of OCBO (see Table 15).
Page 58
51
Table 14
Regression Analyses for Complete Facet Satisfaction Scale Predicting Organizational
Citizenship Behavior – Individuals
Variable B SE B t R2
Complete FSS .16** PAY -.02 .03 -.03 -.54 PROMOTION .09 .03 .17 3.44** SUPERVISION .07 .03 .13 2.63** CO-WORKERS .07 .03 .12 2.42* BENEFITS .01 .02 .02 .48 WORK .09 .03 .16 3.08**
Note: N = 457; * p < .05. ** p <.01.
Table 15
Regression Analyses for Complete Facet Satisfaction Scale Predicting Organizational
Citizenship Behavior – Organization
Variable B SE B t R2
Complete FSS .16** PAY .04 .03 .08 1.48 PROMOTION .01 .02 .02 .34 SUPERVISION .07 .02 .15 2.99** CO-WORKERS .05 .03 .10 2.03* BENEFITS -.01 .02 -.04 -.75 WORK .11 .03 .21 4.15**
Note: N = 452; * p < .05. ** p <.01.
The complete FSS was also shown to be a significant predictor of in-role behaviors (M =
4.07, SD = .65), such that F (6, 449) = 14.34, p < .01. The Supervision (β = .17, t = 3.44, p <.01),
Co-workers (β = .13, t = 2.64, p <.01), Benefits (β = -.13, t = -2.64, p <.01), and Work (β = .20, t
= 3.97, p <.01) facets were significant predictors of IRB (see Table 16).
Page 59
52
Table 16
Regression Analyses for Complete Facet Satisfaction Scale Predicting In-Role Behavior
Variable B SE B t R2
Complete FSS .16** PAY .02 .03 .04 .81 PROMOTION .03 .02 .07 1.35 SUPERVISION .08 .02 .17 3.44** CO-WORKERS .07 .03 .13 2.64** BENEFITS -.05 .02 -.13 -2.64** WORK .11 .03 .20 3.97**
Note: N = 455; * p < .05. ** p <.01.
Finally, for intent-to-quit, (M = 4.28, SD = 1.99), the complete FSS was shown to be a
significant predictor such that F (6, 448) = 46.26, p < .01. The Pay (β = .19, t = 4.32, p <.01),
Supervision (β = .20, t = 4.57, p <.01), and Work (β = .33, t = 7.49, p <.01) facets were
significant predictors of IRB (see Table 17).
Table 17
Regression Analyses for Complete Facet Satisfaction Scale Predicting Intent-To-Quit
Variable B SE B t R2
Complete FSS .38** PAY .33 .08 .19 4.32** PROMOTION .08 .06 .05 1.20 SUPERVISION .28 .06 .20 4.57** CO-WORKERS .03 .07 .02 .40 BENEFITS .08 .05 .06 1.54 WORK .55 .07 .33 7.49**
Note: N = 454; * p < .05. ** p <.01.
Page 60
53
Shortened FSS
In a similar procedure, the shortened FSS was also used as a predictor in regression
analyses to predict the same four outcomes. To summarize, the shortened FSS was also found to
be a significant predictor for each of the outcomes, with r2 ranging from .13 (OCBO) to .32
(intent-to-quit). These findings show evidence of criterion-related validity for the shortened FSS
as well as further support for Hypothesis 2c. The results for the regression analyses using the
shortened FSS are presented in Tables 18 – 21.
For organization citizenship behaviors towards individuals (M = 3.73, SD = .71), the
shortened FSS was shown to be a significant predictor such that F (6, 446) = 16.99, p < .01. The
Promotion (β = .18, t = 3.64, p <.01), Supervision (β = .15, t = 3.16, p <.01), Co-workers (β =
.10, t = 2.11, p <.05), and Work (β = .19, t = 3.88, p <.01) facets were significant predictors of
OCBI (see Table 18).
Table 18
Regression Analyses for Shortened Facet Satisfaction Scale Predicting Organizational
Citizenship Behavior – Individuals
Variable B SE B t R2
Shortened FSS .19** Pay 1 -.04 .03 -.07 -1.31 Promotion 1 .08 .02 .18 3.64** Supervision 1 .07 .02 .15 3.13** Co-workers 1 .05 .03 .10 2.11* Benefits 1 .03 .02 .08 1.69 Work 1 .10 .03 .19 3.88**
Note: N = 452; * p < .05. ** p <.01.
Page 61
54
For organization citizenship behaviors towards the organization (M = 3.88, SD = .61), the
shortened FSS was also shown to be a significant predictor such that F (6, 441) = 11.41, p < .01.
The Supervision (β = .10, t = 2.06, p <.05), Co-workers (β = .10, t = 2.09, p <.05), and Work (β =
.22, t = 4.33, p <.01) facets were significant predictors of OCBO (see Table 19).
Table 19
Regression Analyses for Shortened Facet Satisfaction Scale Predicting Organizational
Citizenship Behavior – Organization
Variable B SE B t R2
Shortened FSS .13** Pay 1 .02 .02 .04 .78 Promotion 1 .02 .02 .04 .76 Supervision 1 .04 .02 .10 2.06* Co-workers 1 .05 .02 .10 2.09* Benefits 1 .01 .02 .02 .32 Work 1 .10 .02 .22 4.33**
Note: N = 447; * p < .05. ** p <.01.
The shortened FSS was also shown to be a significant predictor of in-role behaviors (M =
4.07, SD = .65), such that F (6, 444) = 13.62, p < .01. The Supervision (β = .17, t = 3.45, p <.01),
Co-workers (β = .14, t = 3.02, p <.01), and Work (β = .21, t = 4.18, p <.01) facets were
significant predictors of IRB (see Table 20).
Finally, for intent-to-quit, (M = 4.28, SD = 1.99), the shortened FSS was shown to be a
significant predictor such that F (6, 443) = 34.46, p < .01. The Pay (β = .15, t = 3.12, p <.01),
Promotion (β = .09, t = 2.01, p <.05), Supervision (β = .24, t = 5.44, p <.01), and Work (β = .27, t
= 5.99, p <.01) facets were significant predictors of IRB (see Table 21).
Page 62
55
Table 20
Regression Analyses for Shortened Facet Satisfaction Scale Predicting In-Role Behavior
Variable B SE B t R2
Shortened FSS .16** Pay 1 .00 .03 -.00 -.02 Promotion 1 .03 .02 .07 1.51 Supervision 1 .07 .02 .17 3.45** Co-workers 1 .07 .02 .14 3.02** Benefits 1 -.03 .02 -.07 -1.45 Work 1 .10 .02 .21 4.18**
Note: N = 450; * p < .05. ** p <.01.
Table 21
Regression Analyses for Shortened Facet Satisfaction Scale Predicting Intent-To-Quit
Variable B SE B t R2
Shortened FSS .32** Pay 1 .22 .07 .15 3.12** Promotion 1 .12 .06 .09 2.01* Supervision 1 .32 .06 .24 5.44** Co-workers 1 .06 .07 .04 .96 Benefits 1 .01 .05 .01 .27 Work 1 .40 .07 .27 5.99**
Note: N = 449; * p < .05. ** p <.01.
In order to determine how well the shortened FSS would predict job-related outcomes
compared to the complete scale, hierarchical regression analyses were conducted on the same
four job-related outcomes used in the linear regression analyses. The shortened FSS was entered
as the predictor in Step 1, while the complete FSS was entered in Step 2. For three of the four
outcomes (OCBO, IRB, and intent-to-quit), the complete FSS accounted for a significant amount
Page 63
56
of variance beyond the shortened FSS (see Tables 22 – 25 for the results of the hierarchical
regression analyses).
To summarize, the results of these hierarchical regression analyses showed that the
complete FSS did not account for any significant amount of variance in organizational
citizenship behaviors towards the organization beyond the shortened version of the scale. This
indicated that the shortened scale predicted OCBO just as well as the full version of the scale.
For the other three outcomes (OCBI, IRB, and intent-to-quit), the complete FSS accounted for a
significant amount of variance beyond the shortened FSS, with the change in r2 ranging from .03
to .08.
For organization citizenship behaviors towards individuals (M = 3.73, SD = .71), both
models were shown to be significant such that F (6, 446) = 16.99, p < .01 and F (12, 440) = 9.57,
p < .01 for models 1 and 2 respectively. The Promotion (β = .18, t = 3.64, p <.01), Supervision (β
= .15, t = 3.16, p <.01), Co-workers (β = .10, t = 2.11, p <.05), and Work (β = .19, t = 3.88, p
<.01) facets from the shortened FSS were significant predictors in Step 1. In Step 2, the Benefits
facet (β = -.31, t = -2.61, p <.01) was a significant predictor from the complete FSS, while Pay (β
= -.22, t = -2.27, p <.05), Benefits (β = .36, t = 3.10, p <.01), and Work (β = .23, t = 2.18, p <.05)
facets were significant predictors from the shortened FSS. While both the models were
significant, adding the complete FSS in Step 2 did not add any significant variance accounted for
in OCBI (see Table 22).
For organization citizenship behaviors towards the organization (M = 3.88, SD = .61),
both models were also shown to be significant such that F (6, 441) = 11.41, p < .01 and F (12,
435) = 8.17, p < .01 for models 1 and 2 respectively. The Supervision (β = .10, t = 2.06, p <.05),
Co-workers (β = .10, t = 2.09, p <.05), and Work (β = .22, t = 4.33, p <.01) facets from the
Page 64
57
shortened FSS were significant predictors in Step 1. In Step 2, the Supervision (β = .36, t = 3.31,
p <.01) and Benefits (β = -.29, t = -2.42, p <.05) facets were significant predictors from the
complete FSS, while Supervision (β = -.22, t = -2.05, p <.05) and Benefits (β = .28, t = 2.33, p
<.05) facets were significant predictors from the shortened FSS. Including the complete FSS in
Step 2 significantly increased r2 by .05, p<.01 (see Table 23).
Table 22
Hierarchical Regression Analysis for OCBI (Shortened and Complete FSS)
Step and variable B SE B t R2 R
2
Step 1 Shortened FSS .19 .19** Pay 1 -.04 .03 -.07 -1.31 Promotion 1 .08 .02 .18 3.64** Supervision 1 .07 .02 .15 3.16** Co-workers 1 .05 .03 .10 2.11* Benefits 1 .03 .02 .08 1.69 Work 1 .10 .03 .19 3.88** Step 2 Complete FSS added .21 .02 Pay 1 -.12 .05 -.22 -2.27* Promotion 1 .08 .04 .17 1.79 Supervision 1 .06 .05 .13 1.21 Co-workers 1 -.04 .06 -.08 -.74 Benefits 1 .15 .05 .36 3.10** Work 1 .12 .06 .23 2.18* PAY .11 .06 .18 1.77 PROMOTION .01 .05 .02 .23 SUPERVISION .01 .05 .03 .24 CO-WORKERS .11 .07 .19 1.67 BENEFITS -.14 .05 -.31 -2.61** WORK -.03 .06 -.05 -.46
Note: N = 452; * p < .05. ** p <.01.
Page 65
58
Table 23
Hierarchical Regression Analysis for OCBO (Shortened and Complete FSS)
Step and variable B SE B t R2 R
2
Step 1 Shortened FSS .13 .13** Pay 1 .02 .02 .04 .78 Promotion 1 .02 .02 .04 .76 Supervision 1 .04 .02 .10 2.06* Co-workers 1 .05 .02 .10 2.09* Benefits 1 .01 .02 .02 .32 Work 1 .10 .02 .22 4.33** Step 2 Complete FSS added .18 .05** Pay 1 -.06 .05 -.13 -1.30 Promotion 1 .06 .04 .14 1.46 Supervision 1 -.09 .04 -.22 -2.05* Co-workers 1 -.03 .05 -.06 -.51 Benefits 1 .10 .04 .28 2.33* Work 1 .07 .05 .16 1.51 PAY .10 .05 .19 1.88 PROMOTION -.05 .04 -.10 -1.02 SUPERVISION .16 .05 .36 3.31** CO-WORKERS .08 .06 .15 1.32 BENEFITS -.11 .05 -.29 -2.42* WORK .03 .06 .05 .49
Note: N = 447; * p < .05. ** p <.01.
For in-role behaviors (M = 4.07, SD = .65), both models were again shown to be
significant such that F (6, 444) = 13.62, p < .01 and F (12, 438) = 8.57, p < .01 for models 1 and
2 respectively. The Supervision (β = .17, t = 3.45, p <.01), Co-workers (β = .14, t = 3.02, p <.01),
and Work (β = .21, t = 4.18, p <.01) facets from the shortened FSS were significant predictors in
Step 1. In Step 2, the Benefits (β = -.43, t = -3.62, p <.01) facet was the significant predictor from
the complete FSS, and the Benefits (β = .32, t = 2.71, p <.01) facet was also the significant
Page 66
59
predictor from the shortened FSS. Including the complete FSS in Step 2 significantly increased
r2 by .04, p<.01 (see Table 24).
Table 24
Hierarchical Regression Analysis for IRB (Shortened and Complete FSS)
Step and variable B SE B t R2 R
2
Step 1 Shortened FSS .16 .16** Pay 1 .00 .03 .00 -.02 Promotion 1 .03 .02 .07 1.51 Supervision 1 .07 .02 .17 3.45** Co-workers 1 .07 .02 .14 3.02** Benefits 1 -.03 .02 -.07 -1.45 Work 1 .10 .02 .21 4.18** Step 2 Complete FSS added .19 .03** Pay 1 -.08 .05 -.16 -1.57 Promotion 1 .05 .04 .12 1.22 Supervision 1 .02 .05 .04 .35 Co-workers 1 .03 .06 .07 .62 Benefits 1 .13 .05 .32 2.71** Work 1 .06 .05 .13 1.21 PAY .10 .06 .19 1.83 PROMOTION -.02 .05 -.04 -.37 SUPERVISION .07 .05 .15 1.39 CO-WORKERS .03 .06 .06 .50 BENEFITS -.18 .05 -.43 -3.62** WORK .04 .06 .08 .76
Note: N = 450; * p < .05. ** p <.01.
Finally, for intent-to-quit (M = 4.28, SD = 1.99), both models were shown to be
significant such that F (6, 443) = 34.46, p < .01 and F (12, 437) = 24.37, p < .01 for models 1
and 2 respectively. The Pay (β = .15, t = 3.12, p <.01), Promotion (β = .09, t = 2.01, p <.05),
Supervision (β = .24, t = 5.44, p <.01), and Work (β = .27, t = 5.99, p <.01) facets from the
Page 67
60
shortened FSS were significant predictors in Step 1. In Step 2, the Pay (β = .26, t = 2.96, p <.01),
Benefits (β = .32, t = 3.12, p <.01), and Work (β = .36, t = 3.91, p <.01) facets were significant
predictors from the complete FSS, while the Benefits (β = -.28, t = -2.76, p <.01) facet was also a
significant predictor from the shortened FSS. Including the complete FSS in Step 2 significantly
increased r2 by .08, p<.01 (see Table 25).
Table 25
Hierarchical Regression Analysis for ITQ (Shortened and Complete FSS)
Step and variable B SE B t R2 R
2
Step 1 Shortened FSS .32 .32** Pay 1 .22 .07 .15 3.12** Promotion 1 .12 .06 .09 2.01* Supervision 1 .32 .06 .24 5.44** Co-workers 1 .06 .07 .04 .96 Benefits 1 .01 .05 .01 .27 Work 1 .40 .07 .27 5.99** Step 2 Complete FSS added .40 .08** Pay 1 -.13 .13 -.08 -.94 Promotion 1 .14 .11 .10 1.25 Supervision 1 .23 .12 .18 1.96 Co-workers 1 .07 .15 .05 .49 Benefits 1 -.34 .12 -.28 -2.76** Work 1 -.07 .13 -.05 -.53 PAY .45 .15 .26 2.96** PROMOTION -.06 .13 -.04 -.44 SUPERVISION .08 .13 .06 .62 CO-WORKERS -.04 .17 -.02 -.23 BENEFITS .41 .13 .32 3.12** WORK .60 .15 .36 3.91**
Note: N = 449; * p < .05. ** p <.01.
Page 68
61
CHAPTER 4
DISCUSSION
Summary of Results
The current study was designed as a follow-up to Yeoh (2007), with the goal of not only
replicating the reliability analysis study for the Facet Satisfaction Scale (FSS), but also
incorporating a validation analysis of the scale. Since the FSS was specifically designed as both a
complete version (24-item, six-factor) and shortened (six-item, six-factor) scale, the reliability
and validity analyses conducted in this study were repeated for both versions of the scale.
The results of the analyses indicated general support for the research hypotheses that the
complete and shortened versions of the FSS would exhibit evidence of reliability and validity.
This section will thus focus on the implications of the analyses results, focusing primarily on the
psychometric issues of scale reliability and validity. The use of single-item measures is also
discussed, especially since the shortened version of the FSS was designed to take advantage of
the savings generated from reducing the length of a measurement scale.
Scale Reliability
The results of this study showed general support for the research hypotheses. In terms of
scale reliability, the results indicated that both the shortened and complete FSS exhibited
evidence of scale reliability (using the various measures and estimates of scale reliability
discussed in the introduction of this study). However, two issues must be addressed in terms of
the reliability of the FSS, which are (1) the lower reliability scores of the shortened FSS
compared to the complete FSS, and (2) the lower than expected test-retest reliability scores of
both the shortened and complete FSS.
Page 69
62
In terms of the lower reliability scores for the shortened FSS compared to the complete
FSS, this is only to be expected as researchers have cautioned against the lower reliability scores
of single-item measures (Loo & Kells, 1998; Schriescheim et al., 1991). In addition, classical test
theory has shown that the reliability of a scale increases as more items are used to measure a
construct of interest (Nunnally & Bernstein, 1994), which is also reflected in this study as the
complete FSS exhibited higher reliability scores compared to the shortened version of the scale.
Nevertheless, one of the goals of this study was to show that even a single-item measure,
when designed to target a specific factor or construct, can demonstrate adequate levels of
reliability. In terms of the shortened FSS, the estimates of single-item reliability (test-retest
reliability excluded) were found to vary in the range of .78 to .93, which is described by (George
& Mallory, 2003) as ranging from acceptable to excellent. Simply put, while the current study
does reflect historical research indicating that single-item scales do suffer from lower levels of
reliability compared to multi-item scales, it also provides evidence that single-item measures can
still be reliable measures of a construct, and that the shortened version of the FSS is a reliable
scale measuring job satisfaction (see also Yeoh, 2007). The reliability scores obtained in this
study, coupled with the potential savings (time, monetary cost, resources, etc.) generated by
using single-item measures (see for examples, Wanous & Hudy, 2001; Wanous, Reichers, &
Hudy, 1997), provides further support for the applicability of single-item measures in research.
The second issue of contention in terms of scale reliability is the lower than expected
levels of test-retest reliability for the FSS. The results obtained during this study showed that
test-retest reliability for both the shortened FSS (r ranging from .52 to .66) and complete FSS (r
ranging from .53 to .66) fell short of the .70 “good” cutoff described by Nunnally (1978). Since
research has shown that job satisfaction may fluctuate over time due to various changes in an
Page 70
63
employee’s job or job environment (Gerhart, 2005; Salancik & Pfeffer, 1978), it is possible that
these changes had a significant impact on the participants’ Phase II survey scores and thus
reduced the correlation of scores between the two phases. While correlation analyses conducted
on the regression residuals for Phase I and Phase II scores did indicate that errors in predictions
are strongly related across both phases of study (possibly indicating that the low test-retest
correlation reported in this study was due to changes in the participants' levels of job
satisfaction), it is clear that additional research must be conducted to determine if the lower test-
retest correlation is indeed due to changes in the employees’ job environment or due to the types
of jobs held by the employees.
Scale Validity
Scale validation is separated into three different validity components: (1) construct, (2)
content, and (3) criterion-related validity (Nunnally & Bernstein, 1994). The Facet Satisfaction
Scale was examined for all three forms of validity, starting with convergent and divergent
validity evidence, which provides an estimate of the scale’s construct validity. Specifically, both
the shortened and complete FSS subscales were shown to correlate well against their
corresponding subscales on the Job Satisfaction Survey (Spector, 1985), which provided
evidence for convergent validation. In addition, while both versions of the FSS did correlate
significantly with the Satisfaction With Life Scale (SWLS; Diener, Emmons, Larsen, & Griffin,
1985), the strength of these correlations were typically low. As the JSS is a measure of job
satisfaction, it was expected that both the shortened and complete FSS would correlate more
strongly with this scale when compared to the SWLS, which is a measure of life satisfaction
(specifically subjective well-being) – a variable which typically has a significant but weaker
correlation to job satisfaction (see for example, Moser & Schuler, 2004).
Page 71
64
The results of the correlation analyses were thus in-line with expectations that the FSS
subscale scores were more strongly correlated to the JSS subscale scores compared to the SWLS
scores. These results indicates that the FSS shows evidence of convergent and divergent validity,
and by extension construct validity, as described in psychometric theories addressing validation
(see for examples, Cohen & Swerdlik, 1999; Nunnally & Bernstein, 1994; Carmines & Zeller,
1979).
In regards to content validity, the FSS was conceived as a six-factor scale, measuring job
satisfaction in terms of pay, promotion, supervision, co-workers, benefits, and work. When the
survey responses were analyzed using exploratory factor analysis, it appeared as if the six-factor
structure did indeed hold up well with items loading onto the expected factors and no cross-
loadings above .30. The 24-items of the complete FSS also accounted for 81.66% of variance in
the construct, which provided evidence supporting the content validity of the scale.
When further analyzed using confirmatory factor analysis however, evidence emerged to
show that the proposed six factor structure may not be the ideal choice for the scale items.
Specifically, the confirmatory factor analysis results showed that the six factor model was a poor
fit for the study results based on commonly accepted model fit indices (see Brown, 2006;
Beauducel & Wittmann, 2005). A follow-up analysis was conducted where the FSS and JSS
items were entered into an exploratory factor analysis, with the expectation that items from the
FSS would load onto the same factors as JSS items measuring the same facets. Results from this
analysis helped provide evidence that the FSS items loaded onto similar factors as those of the
JSS, a scale that has been previously validated by job satisfaction researchers.
Despite this evidence of proper factor loading, the poor fitting models has made it
apparent that additional research must be conducted to improve the content validity of the FSS. It
Page 72
65
is possible that the set of participants (comprised of university students who mostly worked only
part time) differs significantly from members of the full-time workforce. Recent research for
example, has found that an individual’s job satisfaction (both facets and overall) can vary
depending on the type of work done, whether blue-collar vs. white-collar or part-time vs. full-
time (see for example Hu, Kaplan, & Dalal, 2010; Levine, Harrison, Mechaber, Philips, &
Gallagher, 2008). In terms of both job type and job tenure, the current sample may well be
significantly different from the population as a whole, thus affecting the results of the
confirmatory factor analyses and the model fit. As a result, it is proposed that additional research
be conducted to create a revised version of the FSS that is robust and adapts well to a larger
variation of sample and/or population characteristics while yet maintaining adequate model fit.
Finally, the findings for the third form of validity – criterion-related validity – for the FSS
demonstrated much more robust support for the research hypotheses. When entered separately
into regression analyses to predict job-related outcomes (organizational citizenship behaviors
towards individuals and the organization, in-role performance, and intent-to-quit), both the
shortened and complete versions of the FSS were found to be significant predictors of each of the
four outcomes. In addition, results of hierarchical regression analyses predicting the same four
outcomes (for the purposes of these hierarchical regression analyses, the shortened FSS was
entered in Step 1 and the complete FSS in Step 2), were promising whereby the complete FSS
added significantly to the prediction equation for three of the four outcomes (OCBO, IRB, and
intent-to-quit). The results of these regression analyses indicated that the FSS could be a useful
tool in predicting outcomes that were important to an organization, with anywhere between
15.6% and 38.3% of variance in these outcomes accounted for by the scale.
Page 73
66
In addition to the providing support for the criterion-related validity of the FSS, the
regression results also indicated that certain facets of job satisfaction may be more effective in
predicting certain job-related outcomes. For example, results for both the shortened and complete
FSS found that pay, supervision, and work facets significantly predicted an individual’s intent to
quit, while supervision, co-workers, and work facets were significant predictors of citizenship
behaviors towards the organization. These results provide support for recent findings in the field
of job satisfaction that the various differing facets of job satisfaction relate differently to different
job-related outcome measures (Edwards, Bell, Arthur, & Decuir, 2008). In summary then, it can
be said that the Facet Satisfaction Scale shows evidence of scale validity as measured through
the three components of validity - content, criterion-related, and construct.
Use of Single-item Scales
In addition to analyzing the psychometric properties of the FSS, results from this study
also helped to generate support for the use of single-item measures in research and industry.
Single-item (and shorter scales in general) have been noted to provide various savings (cost,
time, end-user fatigue, etc.) to the individual and organization (see Nagy, 2002; Wanous,
Reichers, & Hudy, 1997). The results of this study also showed that single-item measures can
predict organization-relevant outcomes just as well as longer measures. Specifically, the
complete FSS did not account for any significant amount of variance beyond the shortened FSS
in a hierarchical regression analysis predicting organizational citizenship behaviors towards the
organization.
The complete FSS did, however, account for additional variance beyond the shortened
FSS when entered into hierarchical regression analyses predicting citizenship behaviors towards
individuals, in-role behaviors, and intent-to-quit. In this study, the amount of additional variance
Page 74
67
in the outcomes accounted for by the complete FSS ranged from .03 to .08 which while
significant, comprised of less than 10% of total variance. In other words, moving from a scale
with six-items to one with 24-items only added less than 10% to the overall predictive ability of
the scale. While some may argue for the maximization of the amount of variance accounted for
by a measurement scale, it is hoped that this study has shown that when a quick evaluation of an
employee’s level of job satisfaction is required, a shortened scale can still be an adequate
measure a construct.
Summary and Conclusion
Job satisfaction has long been studied by organizational sciences researchers, and has
been shown over time to be related to numerous outcomes important to the organization (see for
a review, Brief & Weiss, 2002). Unfortunately, the various studies of the construct have created
a state of confusion for both definitions and measurement of the construct (see for examples,
Eagly & Chaiken, 1993; Brief & Roberson, 1989; Organ & Near, 1985; Locke, 1976). As a
result, the current study was conceived with a two-fold purpose – to define the construct in
accordance to more recent research of job satisfaction and to finalize the construction of a new
scale of measurement of the construct that is in line with this definition.
Based on a review of existing literature, an evaluative definition of the job satisfaction
construct was employed similar to that proposed by Weiss (2002). The Facet Satisfaction Scale
(FSS), a facet-based measure of the construct, was initially conceived to measure job satisfaction
in accordance with this definition (Yeoh, 2007). However, additional modifications to the scale
were made based on previous research, and thus updated reliability and validity analyses were
conducted on this new version of the scale.
Page 75
68
The results of the analyses found evidence of reliability of the both the complete and
shortened versions of the scale. The validity evidence for the scale were mixed however, as the
confirmatory factor analysis of the FSS structure did not find a good fitting model. Nevertheless,
the scale did account for a significant amount of variance in the construct and showed evidence
of construct, content, and criterion-related validity. While additional analysis should be
conducted to further refine the FSS model structure and improve the applicability of the scale
across a wider range of jobs and tenure, the results from this follow-up study indicate that the
FSS shows promise as a measurement scale for job satisfaction.
Page 76
69
REFERENCES
Alderfer, C. P. (1969). An empirical test of a new theory of human needs. Organizational
Behavior and Human Performance, 4(2), 142-175.
Alderfer, C. P. (1992). Changing race relations embedded in organizations: Report on a long-
term project with the XYZ corporation. In S. E. Jackson (Ed.), Diversity in the workplace:
human resource initiatives (pp. 138-166). New York, NY: Guilford Press.
Aries, E. J., Gold, C., & Weigel, R. H. (1983). Dispositional and situational influences on
dominance behavior in small groups. Journal of Personality and Social Psychology, 44(4),
779-786.
Arvey, R. D., Bouchard, T. J., Segal, N. L., & Abraham, L. M. (1989). Job satisfaction:
Environmental and genetic components. Journal of Applied Psychology, 74(2), 187-192.
Beauducel, A. & Wittmann, W. (2005). Simulation study on fit indices in confirmatory factor
analysis based on data with slightly distorted simple structure. Structural Equation Modeling,
12(1), 41–75.
Bergkvist, L. & Rossiter, J. R. (2007). The predictive validity of multiple-item versus single-item
measures of the same constructs. Journal of Marketing Research, 44(2), 175-184.
Boswell, W. R., Boudreau, J. W., & Tichy, J. (2005). The relationship between employee job
change and job satisfaction: The honeymoon-hangover effect. Journal of Applied
Psychology, 90(5), 882-892.
Brief, A. P. (1998). Attitudes in and around organizations. Thousand Oaks, CA: Sage
Publications.
Brief, A. P. & Roberson, L. (1989). Job attitude organization: An exploratory study. Journal of
Applied Social Psychology, 19(9), 717-727.
Page 77
70
Brief, A. P. & Weiss, H. M. (2002). Organizational behavior: Affect in the workplace. Annual
Review of Psychology, 53(1), 279-307.
Brown, T. A. (2006). Confirmatory factor analysis for applied research. New York, NY: The
Guildford Press.
Buckley, M. R., Carraher, S. M., & Cote, J. A. (1992). Measurement issues concerning the use of
inventories of job satisfaction. Educational and Psychological Measurement, 52(3), 529-543.
Campbell, D. J. & Campbell, K. M. (2003). Global versus facet predictors of intention to quit:
Differences in a sample of male and female Singaporean managers and non-managers.
International Journal of Human Resource Management, 14(7), 1152-1177.
Campbell, D. T. & Fiske, D. W. (1959). Convergent and discriminant validation of the multitrait-
multimethod matrix. Psychological Bulletin, 56(2), 81-105.
Carmines, E. G. & Zeller, R. A. (1979). Reliability and validity assessment. Thousand Oaks, CA:
Sage.
Chen, P. Y. & Spector, P. E. (1992). Relationship of work stressors with aggression, withdrawal,
theft, and substance abuse: An exploratory study. Journal of Occupational and
Organizational Psychology, 64, 177-184.
Cohen, R. J. & Swerdlik, M. E. (1999). Psychological testing and assessment: An introduction to
tests and measurement. Mountain View, CA: Mayfield Publishing Company.
Cranny, C. J., Smith, C. P., & Stone, E. F. (1992). Job satisfaction: How people feel about their
jobs and how it affects their performance. New York, NY: Lexington Books.
Crites, S. L., Fabrigar, L. R., & Petty, R. E. (1994). Measuring the affective and cognitive
properties of attitudes: Conceptual and methodological issues. Personality and Social
Psychology Bulletin, 20(6), 619-634.
Page 78
71
DeVellis, R. F. (2003). Scale development: Theory and applications. Thousand Oaks, CA: Sage.
Dipboye, R. L., Smith, C. S., & Howell, W. C. (1994). Understanding industrial and
organizational psychology: An integrated approach. Orlando, FL: Harcourt Brace & Co.
Diener, E., Emmons, R. A., Larsen, R. J., & Griffin, S. (1985). The Satisfaction With Life Scale.
Journal of Personality Assessment, 49(1), 71-75.
Dunham, R. B. & Smith, F. J. (1979). Organizational surveys: An internal assessment of
organizational health. Glenview, IL: Scott, Foresman and Company.
Eagly, A. H. & Chaiken, S. (1993). The psychology of attitudes. Fort Worth, TX: Harcourt Brace
Jovanovich College Publishers.
Eby, L. T., Durley, J. R., Evans, S. C., & Ragins, B. R. (2008). Mentors’ perceptions of negative
mentoring experiences: Scale development and nomological validation. Journal of Applied
Psychology, 93(2), 358-373.
Edwards, B. D., Bell, S. T., Arthur Jr., W., & Decuir, A. D. (2008). Relationship between facets
of job satisfaction and task and contextual performance. Applied Psychology: An
International Review, 57(3), 441-465.
Farrell, D. & Stamm, C. L. (1988). Meta-analysis of the correlates of employee absence. Human
Relations, 41(3), 211-227.
Ferratt, T. W. (1981). Overall job satisfaction: Is it a linear function of facet satisfaction? Human
Relations, 34(6), 463-473.
Fields, D. L. (2002). Taking the measure of work: A guide to validated scales for organizational
research and diagnosis. Thousand Oaks, CA: Sage Publications.
Fisher, C. D. (2000). Mood and emotions while working: missing pieces of job satisfaction?
Journal of Organizational Behavior, 21, 185-202.
Page 79
72
Fisher, C. D. (2002). Antecedents and consequences of real-time affective reactions at work.
Motivation and Emotion, 26(1), 3-30.
Foa, E. B., Zoellner, L. A., Feeny, N. C., Hembree, E. A., Alvarez-Conrad, J. (2002). Does
imaginal exposure exacerbate PTSD symptoms? Journal of Consulting and Clinical
Psychology, 70(4), 1022-1028.
Franzoi, S. L. (2003). Social psychology. New York: McGraw-Hill.
George, D. & Mallery, P. (2003). SPSS for Windows step by step: A simple guide and reference.
11.0 update (4th ed.). Boston: Allyn & Bacon.
Gerhart, B. (1987). How important are dispositional factors as determinants of job satisfaction?
Implications for job design and other personnel programs. Journal of Applied Psychology,
72(3), 366-373.
Gerhard, B. (2005). The (affective) dispositional approach to job satisfaction: sorting out the
policy implications. Journal of Organizational Behavior, 26, 79-97.
Gliem, J. and Gliem, R. (2003). Calculating, interpreting, and reporting Cronbach's alpha
reliability coefficient for likert-type scales. Unpublished paper presented at the 2003 Midwest
Research to Practice Conference in Adult, Continuing and Community Education, Columbus,
OH.
Grant, A. M. (2008). Does intrinsic motivation fuel the prosocial fire? Motivational synergy in
predicting persistence, performance, and productivity. Journal of Applied Psychology, 93(1),
48-58.
Griffeth, R. W., Hom, P. W., & Gaertner, S. (2000). A meta-analysis of antecedents and
correlates of employee turnover: Update, moderator tests, and research implications for the
next millennium. Journal of Management, 26(3), 463-488.
Page 80
73
Guttman, L. (1945). A basis for analyzing test-retest reliability. Psychometrika, 10(4), 255-282.
Hackman, J. R. & Oldham, G. R. (1974). The Job Diagnostic Survey: An instrument for the
diagnosis of jobs and the evaluation of job redesign projects (Tech. Rep. No. 4). New Haven,
CT: Yale University.
Hackman, J. R. & Oldham, G. R. (1976). Motivation through the design of work. Organizational
Behavior and Human Design Processes, 16(2), 250-279.
Harman, H. H. (1967). Modern factor analysis. Chicago, IL: The University of Chicago Press.
Hatfield, J., Robinson, R. B., & Huseman, R. C. (1985). An empirical evaluation of a test for
assessing job satisfaction. Psychological Reports, 56, 39-45.
Herzberg, F. I. (1966). Work and the nature of man. Oxford, England: World.
Highhouse, S. & Becker, A. S. (1993). Facet measures and global job satisfaction. Journal of
Business and Psychology, 8(1), 117-127.
Hochwarter, W. A., Perrewe, P. L., Meurs, J. A., & Kacmar, C. (2007). The interactive effects of
work-induced guilt and ability to manage resources on job and life satisfaction. Journal of
Occupational Health Psychology, 12(2), 125-135.
Hogarty, K. Y., Vines, C. V., Kromrey, J. D., Ferron, J. M., & Mumford, K. R. (2005). The
quality of factor solutions in exploratory factor analysis: The influence of sample size,
communality, and overdetermination. Educational and Psychological Measurement, 65(2),
202-226.
Hoppock, R. (1935). Job satisfaction. New York, NY: Harper.
Howard, J. L. & Frink, D. D. (1996). The effects of organizational restructure on employee
satisfaction. Group and Organizational Management, 21(3), 278-303.
Page 81
74
Hu, X., Kaplan, S., & Dalal, R. S. (2010). An examination of blue- versus white-collar workers’
conceptualization of job satisfaction facets. Journal of Vocational Behavior, 76, 317-325.
Huff, J. W. (2000). Application of attitude strength to job satisfaction: The moderating role of
attitude strength in the prediction of organizational outcomes from job satisfaction.
Unpublished doctoral dissertation, Northern Illinois University, DeKalb.
Huff, J. W., Tekell, J., & Yeoh, T. (2005, April). Measuring job satisfaction: Are all measures
created equal? Poster presented at the annual conference of the Society for Industrial and
Organizational Psychology, Los Angeles, CA.
Hulin, C. L. & Judge, T. A. (2003). Job attitudes. In W. C. Borman, R. Klimonski, and D. Ilgen
(Eds.), Handbook of psychology: Industrial and organizational psychology (Vol. 12, pp. 255-
276). New York: John Wiley & Sons, Inc.
Iaffaldano, M. T. & Muchinsky, P. M. (1985). Job satisfaction and job performance: A meta-
analysis. Psychological Bulletin, 97(2), 251-273.
Ichniowski, C., Kochan, T. A., Levine, D., Olson, C., & Strauss, G. (1996). What works at work:
Overview and assessment. Industrial Relations, 35(3), 299-333.
Ironson, G. H., Smith, P. C., Brannick, M. T., Gibson, W. M., & Paul, K. P. (1989). Constitution
of a Job in General Scale: A comparison of global, composite, and specific measures.
Journal of Applied Psychology, 74, 193-200.
Jackson, C. J. & Corr, P. J. (2002). Global job satisfaction and facet description: The moderating
role of facet importance. European Journal of Psychological Assessment, 18(1), 1-8.
Johnson, G. J. & Johnson, W. R. (2000). Perceived overqualification and dimensions of job
satisfaction: A longitudinal analysis. The Journal of Psychology, 134(5), 537-555.
Page 82
75
Judge, T. A., Thoresen, C. J., Bono, J. E., & Patton, G. K. (2001). The job satisfaction-job
performance relationship: A qualitative and quantitative review. Psychological Bulletin,
127(3), 376-407.
Kerber, K. W. & Campbell, J. P. (1987). Job satisfaction: Identifying the important parts among
computer sales and service personnel. Journal of Business and Psychology, 1(4), 337-352.
Kline, R. B. (2005). Principles and practice of structural equation modeling. New York, NY:
The Guilford Press.
Krosnick, J. A., Judd, C. M., & Wittenbrink, B. (2005). The measurement of attitudes. In D.
Albarracin, B. T. Johnson, & M. P. Zanna (Eds.), The handbook of attitudes (pp. 21-86).
Mahwah, NJ: Lawrence Erlbaum Associates.
Kulas, J. T., McInnerney, J. E., DeMuth, R. F., & Jadwinski, V. (2007). Employee satisfaction
and theft: Testing climate perceptions as a mediator. The Journal of Psychology, 141(4), 389-
402.
Kunin, T. (1955). The construction of a new type of attitude measure. Personnel Psychology, 8,
65-77.
Lambert, E. G., Edwards, C., Camp, S. D., & Saylor, W. G. (2005). Here today, gone tomorrow,
back again the next day: Antecedents of correctional absenteeism. Journal of Criminal
Justice, 33, 165-175.
Latham, G. P. & Budworth, M-H, (2007). The study of work motivation in the 20th century. In L.
L. Koppes (Ed.), Historical perspectives in industrial and organizational psychology (pp.
353-381). Mahwah, NJ: Lawrence Erlbaum.
Lau, D. C. & Murnighan, J. K. (2005). Interactions within groups and subgroups: The effects of
demographic faultlines. Academy of Management Journal, 48(4), 645-659.
Page 83
76
Levine, R. B., Harrison, R. A., Mechaber, H. F., Phillips, C., & Gallagher, T. H. (2008).
Professional characteristics and job satisfaction among SGIM members: A comparison of
part-time and full-time physician members. Journal of General Internal Medicine, 23(8),
1218-1221.
Lievens, F., De Corte, W., & Schollaert, E. (2008). A closer look at the frame-of-reference effect
in personality scale scores and validity. Journal of Applied Psychology, 93(2), 268-279.
Likert, R. (1932). A technique for the measurement of attitudes. Archives of Psychology,
22(140), 55.
Locke, E. A. (1976). The nature and causes of job satisfaction. In M. D. Dunnette (Ed.),
Handbook of industrial and organizational psychology (pp. 1297-1343). Chicago: Rand
McNally.
Loo, R. (2002). A caveat on using single-item versus multiple-item scales. Journal of
Managerial Psychology, 17(1), 68-75.
Loo, R. & Kells, P. (1998). A caveat on using single-item measures. Employee Assistance
Quarterly, 14(2), 75-80.
Macdonald, S. & MacIntyre, P. (1997). The generic job satisfaction scale: Scale development
and its correlates. Employee Assistance Quarterly, 13(2), 1-16.
Maslow, A. H. (1943). A theory of human motivation. Psychological Review, 50(4), 370-396.
McClelland, D. C. (1961). The achieving society. Oxford, England: Van Nostrand.
McElwain, A. K., Korabik, K., & Rosin, H. M. (2005). An examination of gender differences in
work-family conflict. Canadian Journal of Behavioral Science, 37(4), 283-298.
McFarlin, D. B. & Rice, R. W. (1992). The role of facet importance as a moderator in job
satisfaction processes. Journal of Organizational Behavior, 13, 41-54.
Page 84
77
McNeely, B. L. & Meglino, B. M. (1994). The role of dispositional and situational antecedents in
prosocial organizational behavior: An examination of the intended beneficiaries of prosocial
behavior. Journal of Applied Psychology, 79(6), 836-844.
Mesmer-Magnus, J. R. & Viswesvaran, C. (2005). Convergence between measures of work-to
family and family-to-work conflict: A meta-analytic examination. Journal of Vocational
Behavior, 67, 215-232.
Meyer, J. P., Allen, N. J., & Smith, C. A. (1993). Commitment to organizations and occupations:
Extension and test of a three-component conceptualization. Journal of Applied Psychology,
78, 538-551.
Moorman, R. H. (1993). The influence of cognitive and affective based job satisfaction measures
on the relationship between satisfaction and organizational citizenship behavior. Human
Relations, 46(6), 759-776.
Morgeson, F. P. & Humphrey, S. E. (2006). The Work Design Questionnaire (WDQ):
Developing and validating a comprehensive measure for assessing job design and the nature
of work. Journal of Applied Psychology, 91(6), 1321-1339.
Moser, K. & Schuler, H. (2004). Is involvement a suppressor of the job satisfaction-life
satisfaction relationship? Journal of Applied Social Psychology, 34(11), 2377-2388.
Motowidlo, S. J. (1996). Orientation toward the job and organization. In K. R. Murphy (Ed.),
Individual differences and behavior in organizations (pp. 175-208). San Francisco: Jossey-
Bass.
Murphy, G. C. & Fraser, B. J. (1978). Intuitive-theoretical scales of content and context
satisfaction. Personnel Psychology, 31, 485-494.
Page 85
78
Nagy, M. S. (2002). Using a single-item approach to measure facet job satisfaction. Journal of
Occupational and Organizational Psychology, 75, 77-86.
Nunnally, J. C. (1978). Psychometric theory. New York: McGraw-Hill.
Nunnally, J. C. & Bernstein, I. H. (1994). Psychometric theory. New York: McGraw-Hill.
O’Connor, E. J., Peters, L. H., & Gordon, S. M. (1978). The measurement of job satisfaction:
Current practices and future considerations. Journal of Management, 4(2), 17-26.
Organ, D. W. & Hamner, W. C. (1982). Organizational behavior: An applied psychological
approach. Plano, TX: Business Publications, Inc.
Organ, D. W. & Near, J. P. (1985). Cognition vs affect in measures of job satisfaction.
International Journal of Psychology, 20, 241-253.
Organ, D. W. & Ryan, K. (1995). A meta-analytic review of attitudinal and dispositional
predictors of organizational citizenship behaviors. Personnel Psychology, 48(4), 775-802.
Osgood, C. E., Suci, G. J., & Tannenbaum, P. H. (1957). The measurement of meaning.
Champaign, IL: University of Illinois Press.
Payne, S. C. & Weber, S. S. (2006). Effects of service provider attitudes and employment status
on citizenship behaviors and customers’ attitude and loyalty behavior. Journal of Applied
Psychology, 91(2), 365-378.
Porter, L. W. & Steers, R. M. (1973). Organizational, work, and personal factors in employee
turnover and absenteeism. Psychological Bulletin, 80(2), 151-176.
Rice, R. W., Gentile, D. A., & McFarlin, D. B. (1991). Facet importance and job satisfaction.
Journal of Applied Psychology, 76(1), 31-39.
Roethlisberger, F. J. & Dickson, W. J. (1939). Management and the worker. Oxford, England:
Harvard University Pres.
Page 86
79
Sackett, P. R. & Larson, J. R. Jr. (1990). Research strategies and tactics in industrial and
organizational psychology. In M. D. Dunnette & L. M. Hough (Eds.), Handbook of industrial
and organizational psychology (Vol. 1, pp. 419-489). Palo Alto, CA: Consulting
Psychologist Press, Inc.
Salancik, G. R. & Pfeffer, J. (1978).A social information processing approach to job attitudes
and task design. Administrative Science Quarterly, 23(2), 224-253.
Scarpello, V. & Campbell, J. P. (1983). Job satisfaction: Are all the parts there? Personnel
Psychology, 36(3), 577-600.
Schriesheim, C. A., Hinkin, T. R., & Podsakoff, P. M. (1991). Can ipsative and single-item
measures produce erroneous results in field studies of French and Raven’s (1959) Five Bases
of Power? An empirical investigation. Journal of Applied Psychology, 76(1), 106-114.
Scott, J. T. (1995). The concise handbook of management: A practitioner’s approach.
Birmingham, NY: Hawthorne.
Shaeffer, E. M., Krosnick, J. A., Langer, G. E., & Merkle, D. M. (2005). Comparing the quality
of data obtained by minimally balanced and fully balanced attitude questions. Public Opinion
Quarterly, 69(3), 417-428.
Siu, O., Spector, P. E., Cooper, C. L., & Lu, C. (2005). Work stress, self-efficacy, Chinese work
values, and work well-being in Hong Kong and Beijing. International Journal of Stress
Management, 12(3), 274-288.
Smith, P. C., Kendall L. M., & Hulin, C. L. (1969). The measurement of satisfaction in work and
retirement: A strategy for the study of attitudes. Oxford, England: Rand McNally.
Spector, P. E. (1985). Measurement of human service staff satisfaction: Development of the Job
Satisfaction Survey. American Journal of Community Psychology, 13, 693-713.
Page 87
80
Spector, P. E. (1997). Job satisfaction: Application, assessment, causes, and consequences.
Thousand Oaks, CA: Sage Publications.
Spector, P. E. (2000). Industrial and organizational psychology: Research and practice. New
York, NY: John Wiley & Sons.
Staw, B. M., & Cohen-Charash, Y. (2005). The dispositional approach to job satisfaction: More
than a mirage, but not yet an oasis. Journal of Organizational Behavior, 26, 59-78.
Staw, B. M., & Ross, J. (1985). Stability in the midst of change: A dispositional approach to job
attitudes. Journal of Applied Psychology, 70(3), 469-480.
Steel, R. P. & Rentsch, J. R. (1997). The dispositional model of job attitudes revisited: Findings
of a 10-year study. Journal of Applied Psychology, 82(6), 873-879.
Steijn, B. (2001). Work systems, quality of working life and attitudes of workers: An empirical
study towards the effects of team and non-teamwork. New Technology, Work and
Employment, 16(3), 191-203.
Tabachnik, B. G. & Fidell, L. S. (2001). Using multivariate statistics (4th ed.). Needlam Heights,
MA: Allyn & Bacon.
Taber, T. D. & Aliger, G. M. (1995). A task-level assessment of job satisfaction. Journal of
Organizational Behavior, 16, 101-121.
Tett, R. P. & Meyer, J. P. (1993). Job satisfaction, organizational commitment, turnover
intention, and turnover: Path analysis based on meta-analytic findings. Personnel
Psychology, 46, 259-293.
Tharenou, P. (1993). A test of reciprocal causality for absenteeism. Journal of Organizational
Behaviors, 14(3), 269-287.
Page 88
81
Thurstone, L. L. (1928). Attitudes can be measured. American Journal of Sociology, 33, 529-
554.
Thurstone, L. L. (1931). The measurement of social attitudes. The Journal of Abnormal and
Social Psychology, 26(3), 249-269.
Van Scotter, J. R. (2000). Relationships of task performance and contextual performance with
turnover, job satisfaction, and affective commitment. Human Resource Management Review,
10(1), 79-95.
Wagner, S. L. & Rush, M. C. (2000). Altruistic organizational citizenship behavior: Context,
disposition, and age. The Journal of Social Psychology, 140(3), 379-391.
Wanous, J. P. & Hudy, M. J. (2001). Single-item reliability: A replication and extension.
Organizational Research Methods, 4(4), 361-375.
Wanous, J. P. & Reichers, A. E. (1996). Estimating the reliability of a single-item measure.
Psychological Reports, 78(2), 631-634.
Wanous, J. P. Reichers, A. E., & Hudy, M. J. (1997). Overall job satisfaction: How good are
single-item measures? Journal of Applied Psychology, 82(2), 247-252.
Weiss, D. J., Dawis, R., England, G., & Lofquist, L. (1967). Manual for the Minnesota
Satisfaction Questionnaire (Minnesota Studies on Vocational Behavior, Vol. 22).
Minneapolis: University of Minnesota, Industrial Relations Center.
Weiss, H. M. (2002). Deconstructing job satisfaction: Separating evaluations, beliefs, and
affective experiences. Human Resource Management Review, 12, 173 - 194.
Weiss, H. M. & Cropanzano, R. (1996). Affective Events Theory: A theoretical discussion of the
structure, causes and consequences of affective experiences at work. In B. M. Staw & L. L.
Page 89
82
Cummings (Eds.), Research in organizational behavior: An annual series of analytical
essays and critical reviews (Vol. 18, pp. 1-74). Berkeley, CA: Elsevier.
Williams, L. J. & Anderson, S. E. (1991). Job satisfaction and organizational commitment as
predictors of organizational citizenship and in-role behaviors. Journal of Management, 17(3),
601-617.
Williams, K. J. & Alliger, G. M. (1994). Role stressors, mood spillovers, and perceptions of
work-family conflict in employed parents. Academy of Management Journal, 37(4), 837-868.
Witt, L. A. & Nye, L. G. (1992). Gender and the relationship between perceived fairness of pay
or promotion and job satisfaction. Journal of Applied Psychology, 77(6), 910-917.
Worthington, R. L., Navarro, R. L., Savoy, H. B., & Hampton, D. (2008). Development,
reliability, and validity of the Measure of Sexual Identity Exploration and Commitment
(MoSIEC). Developmental Psychology, 44(1), 22-33.
Wright, T. A., Cropanzano, R., & Bonett, D. G. (2007). The moderating role of employee
positive well being on the relationship between job satisfaction and job performance. Journal
of Occupational Health Psychology, 12(2), 93-104.
Yeoh, T. (2007). The Facet Satisfaction Scale: Enhancing the measurement of job satisfaction.
Unpublished master’s thesis, University of North Texas, Denton.
Yu, J. H., Albaum, G., & Swenson, M. (2003). Is a central tendency error inherent in the use of
semantic differential scales in different cultures? International Journal of Market Research,
45, 213-228.
Zalenski, R. J. & Raspa, R. (2006). Maslow’s Hierarchy of needs: A framework for achieving
human potential in hospice. Journal of Palliative Medicine, 9(5), 1120-1127.