Geoinformation Issues Vol. 9, No 1 (9), 15–26/2017 Introduction The Global Terrestrial Observing System (GTOS) identified 13 land Essential Climate Variables (ECV), considered to be technically and economi- cally feasible for systematic observations (GCOS, 2011). Among them the Leaf Area Index (LAI), referring to the amount of leaf material in ecosys- tems, is recognized as one of the most important variables for monitoring the development and con- dition of vegetation. Therefore, numerous efforts were undertaken in research centers in the past Validation of the LAI biophysical product derived from Sentinel-2 and Proba-V images for winter wheat in western Poland Zbigniew Bochenek Institute of Geodesy and Cartography, 27 Jacka Kaczmarskiego St., 02-679, Warsaw, Poland Tel.: +48 22 3291977, Fax: +48 22 3291950, E-mail: [email protected]Katarzyna Dąbrowska-Zielińska Institute of Geodesy and Cartography, 27 Jacka Kaczmarskiego St., 02-679, Warsaw, Poland Tel.: +48 22 3291974, Fax: +48 22 3291950, E-mail: [email protected]Radosław Gurdak University of Warsaw, Faculty of Geography and Regional Studies, Department of Geoinformatics, Cartography and Remote Sensing, 30 Krakowskie Przedmieście St., 00-927 Warsaw, Poland; Institute of Geodesy and Cartography, 27 Jacka Kaczmarskiego St., 02-679, Warsaw, Poland Tel.: +48 22 3291978, Fax: +48 22 3291950, E-mail: [email protected]Fabrizio Niro ESA-ESRIN, Via Galileo Galilei, 00044 Frascati, Italy Tel: +39 06 941-88387, Email: [email protected]Maciej Bartold University of Warsaw, Faculty of Geography and Regional Studies, Department of Geoinformatics, Cartography and Remote Sensing Institute of Geodesy and Cartography, 27 Jacka Kaczmarskiego St., 02-679, Warsaw, Poland Tel.: +48 22 3291978, Fax: +48 22 3291950, E-mail: [email protected]Patryk Grzybowski Institute of Geodesy and Cartography, 27 Jacka Kaczmarskiego St., 02-679, Warsaw, Poland Tel.: +48 22 3291989, Fax: +48 22 3291950, E-mail: [email protected]Abstract: The main objective of the work presented is to assess applicability of new-generation satellite data for deriving Leaf Area Index (LAI) information. Two types of data were used in the study: Sentinel-2 and Proba-V images. Various vegetation indices were derived from these data and correlated with ground mea- sured LAI values. The results of the study revealed that there is a good relationship between satellite based indices – Normalized Difference Vegetation Index (NDVI), Normalized Difference Infrared Index (NDII), and Disease Water Stress Index (DSWI) – and ground based LAI, but the strength of this relationship depends on the phase of crop development. It was also found that the accuracy of LAI determination with the use of the vegetation index derived from Sentinel-2 and Proba-V data is similar when applying the image acquisition at the proper date – the heading stage for winter wheat. Keywords: Leaf Area Index, Sentinel-2, Proba-V, validation, winter wheat Received: 15 November 2017 / Accepted: 23 February 2018
Transcript
Geoinformation IssuesVol. 9, No 1 (9), 15–26/2017
Introduction
The Global Terrestrial Observing System (GTOS) identified 13 land Essential Climate Variables (ECV), considered to be technically and economi-cally feasible for systematic observations (GCOS,
2011). Among them the Leaf Area Index (LAI), referring to the amount of leaf material in ecosys-tems, is recognized as one of the most important variables for monitoring the development and con-dition of vegetation. Therefore, numerous efforts were undertaken in research centers in the past
Validation of the LAI biophysical product derived from Sentinel-2 and Proba-V images for winter wheat in western PolandZbigniew BochenekInstitute of Geodesy and Cartography, 27 Jacka Kaczmarskiego St., 02-679, Warsaw, Poland Tel.: +48 22 3291977, Fax: +48 22 3291950, E-mail: [email protected] Dąbrowska-ZielińskaInstitute of Geodesy and Cartography, 27 Jacka Kaczmarskiego St., 02-679, Warsaw, Poland Tel.: +48 22 3291974, Fax: +48 22 3291950, E-mail: [email protected]ław GurdakUniversity of Warsaw, Faculty of Geography and Regional Studies, Department of Geoinformatics, Cartography and Remote Sensing, 30 Krakowskie Przedmieście St., 00-927 Warsaw, Poland;Institute of Geodesy and Cartography, 27 Jacka Kaczmarskiego St., 02-679, Warsaw, Poland Tel.: +48 22 3291978, Fax: +48 22 3291950, E-mail: [email protected] NiroESA-ESRIN, Via Galileo Galilei, 00044 Frascati, ItalyTel: +39 06 941-88387, Email: [email protected] BartoldUniversity of Warsaw, Faculty of Geography and Regional Studies, Department of Geoinformatics, Cartography and Remote SensingInstitute of Geodesy and Cartography, 27 Jacka Kaczmarskiego St., 02-679, Warsaw, Poland Tel.: +48 22 3291978, Fax: +48 22 3291950, E-mail: [email protected] GrzybowskiInstitute of Geodesy and Cartography, 27 Jacka Kaczmarskiego St., 02-679, Warsaw, Poland Tel.: +48 22 3291989, Fax: +48 22 3291950, E-mail: [email protected]
Abstract: The main objective of the work presented is to assess applicability of new-generation satellite data for deriving Leaf Area Index (LAI) information. Two types of data were used in the study: Sentinel-2 and Proba-V images. Various vegetation indices were derived from these data and correlated with ground mea-sured LAI values. The results of the study revealed that there is a good relationship between satellite based indices – Normalized Difference Vegetation Index (NDVI), Normalized Difference Infrared Index (NDII), and Disease Water Stress Index (DSWI) – and ground based LAI, but the strength of this relationship depends on the phase of crop development. It was also found that the accuracy of LAI determination with the use of the vegetation index derived from Sentinel-2 and Proba-V data is similar when applying the image acquisition at the proper date – the heading stage for winter wheat.
Keywords: Leaf Area Index, Sentinel-2, Proba-V, validation, winter wheat
Received: 15 November 2017 / Accepted: 23 February 2018
16
Zbigniew Bochenek, Katarzyna Dąbrowska-Zielińska, Radosław Gurdak, Fabrizio Niro, Maciej Bartold, Patryk Grzybowski
Geoinformation IssuesVol. 9, No 1 (9), 15–26/2017
decades to prepare effective methods for deriving this variable from satellite data (Price, 1993; Friedl et al., 1994; Carlson and Ripley, 1997; Turner et al., 1999; Lee et al., 2004; Berterretche et al., 2005; Heis-kanen, 2006; Zheng and Moskal, 2009; Aboelghar et al., 2010; Li and Guo, 2010; Frampton et al., 2013; Shen et al., 2014; Jiang et al., 2016). As a result of research work undertaken within the Geoland 2 project the algorithm for deriving the LAI global product was prepared by Baret et al. (2007). This algorithm was based on training a neural network over SAIL+PROSPECT radiative transfer model simulation, using 1 km SPOT VEGETATION data for generating the LAI product. This algorithm was next adapted within the Copernicus Global Land Service, in order to generate the Leaf Area Index product based on Proba-V images at 1 km and 300 m resolution. The product is intended to be used for vegetation studies at a global scale; its application for assessing the condition of vegetation at a local scale is somewhat limited due to the coarse resolu-tion. Therefore, the main objective of the present work was to examine the usefulness of the new generation of high-resolution satellite images for generating LAI information. Two types of satellite data were considered: Sentinel-2 images (Drusch et al., 2012) and Proba-V data (Diercks et al., 2014) at 100 m spatial resolution. The relationships be-tween satellite-based and ground measured LAI values were studied in a temporal profile and con-clusions on the precision of remotely sensed LAI estimation were drawn.
2. Study areaThe agricultural area located in western Poland – Wielkopolska region – was selected as the test site for the research work. This area is characte rized by a mixture of agricultural crops, with winter wheat, rape and maize as dominant species. The field pat-tern is composed of large fields dominating within the test site intermixed with small fields. In order to match properly satellite information with ground data only large fields exceeding 100 m in width were taken into account. Winter wheat fields, which dominate within the study area were used for per-forming the analyses presented in this article. Ground measurements of the Leaf Area Index were conducted within these fields, having set up pre-viously a network of measurement points.
3. Materials and methods
3.1. Satellite data
Two types of satellite data were used for the re-search work:
– Sentinel-2 satellite images, collected at 10 m, 20 m and 60 m resolution in 12 spectral bands;
– Proba-V satellite images, collected at 100 m resolution in 4 spectral bands.
Spectral characteristics of both sensors are given in Table 1.
Table 1. Spectral characteristics of Sentinel-2 and Proba-V sensors
SensorSpatial
resolution [m]
Band number
Central wavelength
[nm]
Bandwidth[nm]
Sentinel-2
10
2 499.6 983 560.0 454 664.5 388 835.1 145
20
5 703.9 196 740.2 187 782.5 28
8a 864.8 3311 1613.7 14312 2202.4 2421 443.9 27
609 945.0 26
10 1373.5 75
Proba-V 100
1 450.0 422 645.0 703 834.0 1214 1665.0 89
Sentinel-2 images were collected over the agri-cultural test site three times over the growing season related to cereals; on 6 May, 5 June and 25 June 2016. Proba-V images were acquired on the same dates in order to ensure comparability of the results. At the preliminary stage of the work six vegetation indices, which characterize different aspects of crop condition and development, were derived from Sentinel-2 data. They can be arranged into two groups:
17
Validation of the LAI biophysical product derived from Sentinel-2 and Proba-V images for winter wheat in western Poland
Geoinformation IssuesVol. 9, No 1 (9), 15–26/2017
In the case of Proba-V images, three vegetation indices, i.e. NDVI, NDII and EVI, based on avail-able red, near infrared and shortwave infrared bands, were derived.
3.2. Ground-based data
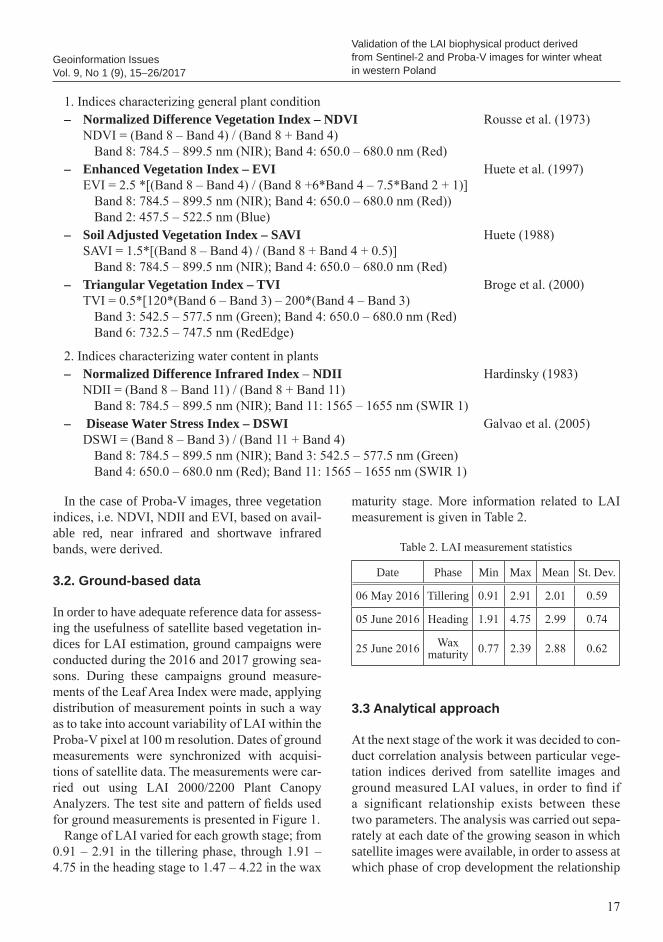
In order to have adequate reference data for assess-ing the usefulness of satellite based vegetation in-dices for LAI estimation, ground campaigns were conducted during the 2016 and 2017 growing sea-sons. During these campaigns ground measure-ments of the Leaf Area Index were made, applying distribution of measurement points in such a way as to take into account variability of LAI within the Proba-V pixel at 100 m resolution. Dates of ground measurements were synchronized with acquisi-tions of satellite data. The measurements were car-ried out using LAI 2000/2200 Plant Canopy Analyzers. The test site and pattern of fields used for ground measurements is presented in Figure 1.
Range of LAI varied for each growth stage; from 0.91 – 2.91 in the tillering phase, through 1.91 – 4.75 in the heading stage to 1.47 – 4.22 in the wax
maturity stage. More information related to LAI measurement is given in Table 2.
3.3 Analytical approach
At the next stage of the work it was decided to con-duct correlation analysis between particular vege-tation indices derived from satellite images and ground measured LAI values, in order to find if a significant relationship exists between these two parameters. The analysis was carried out sepa-rately at each date of the growing season in which satellite images were available, in order to assess at which phase of crop development the relationship
1. Indices characterizing general plant condition– Normalized Difference Vegetation Index – NDVI Rousse et al. (1973)
NDVI = (Band 8 – Band 4) / (Band 8 + Band 4)Band 8: 784.5 – 899.5 nm (NIR); Band 4: 650.0 – 680.0 nm (Red)
– Enhanced Vegetation Index – EVI Huete et al. (1997)EVI = 2.5 *[(Band 8 – Band 4) / (Band 8 +6*Band 4 – 7.5*Band 2 + 1)]
Band 8: 784.5 – 899.5 nm (NIR); Band 4: 650.0 – 680.0 nm (Red))Band 2: 457.5 – 522.5 nm (Blue)
– Soil Adjusted Vegetation Index – SAVI Huete (1988)SAVI = 1.5*[(Band 8 – Band 4) / (Band 8 + Band 4 + 0.5)]
Band 8: 784.5 – 899.5 nm (NIR); Band 4: 650.0 – 680.0 nm (Red)– Triangular Vegetation Index – TVI Broge et al. (2000)
2. Indices characterizing water content in plants– Normalized Difference Infrared Index – NDII Hardinsky (1983)
NDII = (Band 8 – Band 11) / (Band 8 + Band 11)Band 8: 784.5 – 899.5 nm (NIR); Band 11: 1565 – 1655 nm (SWIR 1)
– Disease Water Stress Index – DSWI Galvao et al. (2005)DSWI = (Band 8 – Band 3) / (Band 11 + Band 4)
Band 8: 784.5 – 899.5 nm (NIR); Band 3: 542.5 – 577.5 nm (Green)Band 4: 650.0 – 680.0 nm (Red); Band 11: 1565 – 1655 nm (SWIR 1)
Table 2. LAI measurement statistics
Date Phase Min Max Mean St. Dev.
06 May 2016 Tillering 0.91 2.91 2.01 0.59
05 June 2016 Heading 1.91 4.75 2.99 0.74
25 June 2016 Wax maturity 0.77 2.39 2.88 0.62
18
Zbigniew Bochenek, Katarzyna Dąbrowska-Zielińska, Radosław Gurdak, Fabrizio Niro, Maciej Bartold, Patryk Grzybowski
Geoinformation IssuesVol. 9, No 1 (9), 15–26/2017
is the strongest, enabling reliable estimation of LAI on the basis of satellite data. The second goal of the analysis was to determine which vegetation indices are the best for LAI assessment. Linear re-gression was assumed in the correlation analysis. The whole set of ground measurement points and related satellite based indices was divided into two parts: a training set for determining the relation-ship (17 points) and a test set for verifying the established relations (9 points). The regression equations obtained as a result of the correlation analysis were next applied to generate LAI values at the test points. Finally, those values were com-pared with the ground LAI measurements and differences between these two datasets were com-puted and statistically assessed.
In addition, separate LAI estimation was per-formed, using SNAP software for this purpose. The algorithm for LAI determination within SNAP software mainly consists in generating a compre-hensive database of vegetation characteristics and the associated Sentinel-2 top of canopy (TOC) re-flectances. Neural networks are then trained to es-timate the canopy characteristics from the TOC reflectances along with a set of corresponding
angles defining the observational configuration. The neural network is composed of the following:
– one input layer, made of 11 normalized input data, consisting of the Sentinel-2 radiometry in the relevant bands (B3, B4, B5, B6, B7, B8a, B11, B12) and the associated illumination and viewing conditions: cos(viewing zenith), cos(sun_zenith), cos(relative_azimuth_angle);
– one hidden layer with 5 neurons with tangent sigmoid transfer functions;
– one output layer with a linear transfer function.The actual algorithm running in SNAP runs the
prediction step of the neural network, from the set of pre-computed coefficients computed during the training phase. Both approaches of LAI determina-tion – based on vegetation indices and on the Neural Network – were compared in order to draw conclu-sions on their performance.
4. Results and discussion4.1. Analysis of Sentinel-2 data
Correlation analysis between ground measured LAI and LAI derived from the selected S-2 based
Fig. 1. Agricultural test site – Wielkopolska region
19
Validation of the LAI biophysical product derived from Sentinel-2 and Proba-V images for winter wheat in western Poland
Geoinformation IssuesVol. 9, No 1 (9), 15–26/2017
vegetation indices was performed separately for each phase of the growing season and for particu-lar vegetation indices. The aim of the analysis was to study temporal variation in the precision of LAI estimation and to determine, which indices are most suited to remote sensing based LAI estimation. In 2016 the study was conducted for three phases of the development stages of winter wheat: tillering (beginning of May), heading (beginning of June) and wax maturity (end of June), using 17 measure-ment points for regression analysis. Results of the analysis are presented in Table 3.
The following conclusions can be drawn from the presented analysis:
1. High correlation between ground measured LAI and all vegetation indices (except TVI) exists at the beginning of May and at the begin-ning of June (r = 0.898 for NDVI, r = 0.889 for DSWI).
2. Lower correlation with ground measured LAI appears for all vegetation indices at the end of June (r = 0.679 for NDII).
3. The highest correlation between ground mea-sured LAI and vegetation indices appears for NDVI, DSWI and NDII indices.
The conclusions are supported by the phenologi-cal behaviour of winter wheat, which is related to water content in plants. In the stage of wax matu-rity the level of water content is lower (60%) than in the preceding stages of development (80% – 90%), this implies lower LAI values with subsequent re-duction in the correlation with vegetation indices. This is especially true for DSWI and NDII indices, which are sensitive to water content in plants, being based on the use of the SWIR band.
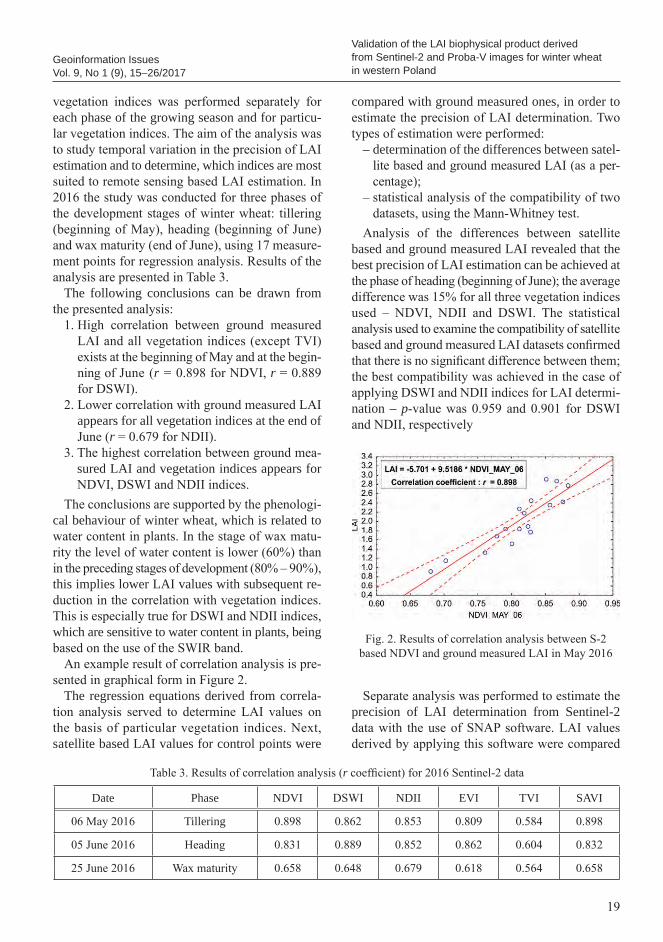
An example result of correlation analysis is pre-sented in graphical form in Figure 2.
The regression equations derived from correla-tion analysis served to determine LAI values on the basis of particular vegetation indices. Next, satellite based LAI values for control points were
compared with ground measured ones, in order to estimate the precision of LAI determination. Two types of estimation were performed:
– determination of the differences between satel-lite based and ground measured LAI (as a per-centage);
– statistical analysis of the compatibility of two datasets, using the Mann-Whitney test.
Analysis of the differences between satellite based and ground measured LAI revealed that the best precision of LAI estimation can be achieved at the phase of heading (beginning of June); the average difference was 15% for all three vegetation indices used – NDVI, NDII and DSWI. The statistical analysis used to examine the compatibility of satellite based and ground measured LAI datasets confirmed that there is no significant difference between them; the best compatibility was achieved in the case of applying DSWI and NDII indices for LAI determi-nation – p-value was 0.959 and 0.901 for DSWI and NDII, respectively
Separate analysis was performed to estimate the precision of LAI determination from Sentinel-2 data with the use of SNAP software. LAI values derived by applying this software were compared
Fig. 2. Results of correlation analysis between S-2 based NDVI and ground measured LAI in May 2016
Table 3. Results of correlation analysis (r coefficient) for 2016 Sentinel-2 data
Date Phase NDVI DSWI NDII EVI TVI SAVI
06 May 2016 Tillering 0.898 0.862 0.853 0.809 0.584 0.898
05 June 2016 Heading 0.831 0.889 0.852 0.862 0.604 0.832
Zbigniew Bochenek, Katarzyna Dąbrowska-Zielińska, Radosław Gurdak, Fabrizio Niro, Maciej Bartold, Patryk Grzybowski
Geoinformation IssuesVol. 9, No 1 (9), 15–26/2017
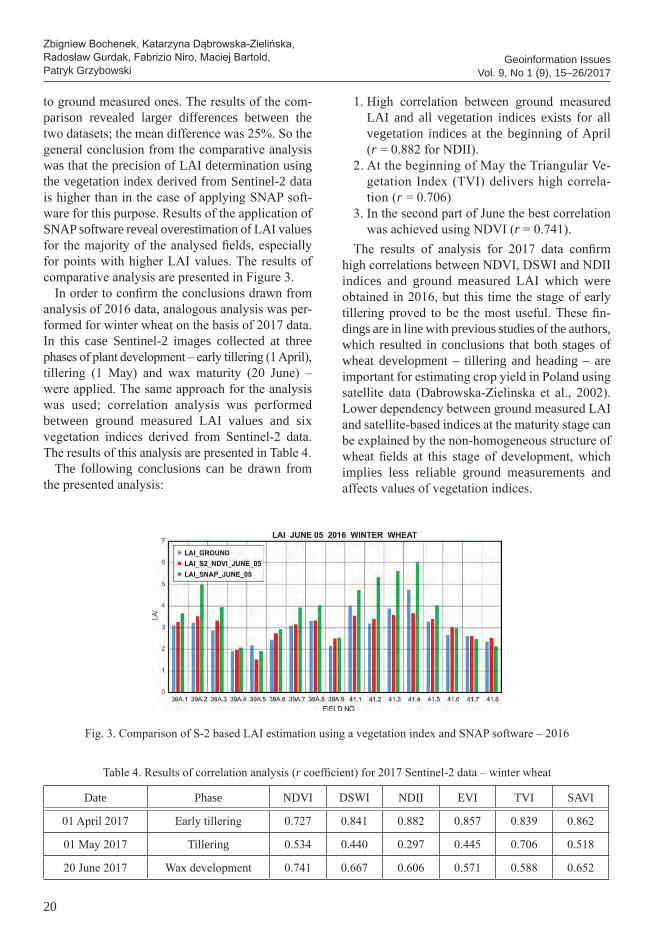
to ground measured ones. The results of the com-parison revealed larger differences between the two datasets; the mean difference was 25%. So the general conclusion from the comparative analysis was that the precision of LAI determination using the vegetation index derived from Sentinel-2 data is higher than in the case of applying SNAP soft-ware for this purpose. Results of the application of SNAP software reveal overestimation of LAI values for the majority of the analysed fields, especially for points with higher LAI values. The results of comparative analysis are presented in Figure 3.
In order to confirm the conclusions drawn from analysis of 2016 data, analogous analysis was per-formed for winter wheat on the basis of 2017 data. In this case Sentinel-2 images collected at three phases of plant development – early tillering (1 April), tillering (1 May) and wax maturity (20 June) – were applied. The same approach for the analysis was used; correlation analysis was performed between ground measured LAI values and six vegetation indices derived from Sentinel-2 data. The results of this analysis are presented in Table 4.
The following conclusions can be drawn from the presented analysis:
1. High correlation between ground measured LAI and all vegetation indices exists for all vegetation indices at the beginning of April (r = 0.882 for NDII).
2. At the beginning of May the Triangular Ve-getation Index (TVI) delivers high correla-tion (r = 0.706)
3. In the second part of June the best correlation was achieved using NDVI (r = 0.741).
The results of analysis for 2017 data confirm high correlations between NDVI, DSWI and NDII indices and ground measured LAI which were obtained in 2016, but this time the stage of early tillering proved to be the most useful. These fin-dings are in line with previous studies of the authors, which resulted in conclusions that both stages of wheat development – tillering and heading – are important for estimating crop yield in Poland using satellite data (Dabrowska-Zielinska et al., 2002). Lower dependency between ground measured LAI and satellite-based indices at the maturity stage can be explained by the non-homogeneous structure of wheat fields at this stage of development, which implies less reliable ground measurements and affects values of vegetation indices.
Fig. 3. Comparison of S-2 based LAI estimation using a vegetation index and SNAP software – 2016
Table 4. Results of correlation analysis (r coefficient) for 2017 Sentinel-2 data – winter wheat
Date Phase NDVI DSWI NDII EVI TVI SAVI
01 April 2017 Early tillering 0.727 0.841 0.882 0.857 0.839 0.862
01 May 2017 Tillering 0.534 0.440 0.297 0.445 0.706 0.518
20 June 2017 Wax development 0.741 0.667 0.606 0.571 0.588 0.652
21
Validation of the LAI biophysical product derived from Sentinel-2 and Proba-V images for winter wheat in western Poland
Geoinformation IssuesVol. 9, No 1 (9), 15–26/2017
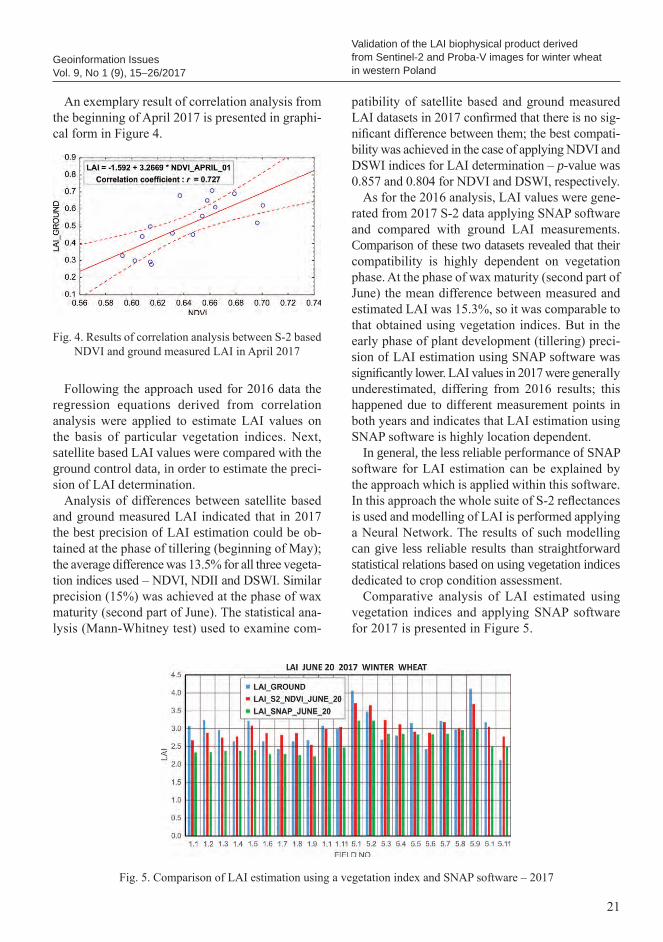
An exemplary result of correlation analysis from the beginning of April 2017 is presented in graphi-cal form in Figure 4.
Following the approach used for 2016 data the regression equations derived from correlation analysis were applied to estimate LAI values on the basis of particular vegetation indices. Next, satellite based LAI values were compared with the ground control data, in order to estimate the preci-sion of LAI determination.
Analysis of differences between satellite based and ground measured LAI indicated that in 2017 the best precision of LAI estimation could be ob-tained at the phase of tillering (beginning of May); the average difference was 13.5% for all three vegeta-tion indices used – NDVI, NDII and DSWI. Similar precision (15%) was achieved at the phase of wax maturity (second part of June). The statistical ana-lysis (Mann-Whitney test) used to examine com-
patibility of satellite based and ground measured LAI datasets in 2017 confirmed that there is no sig-nificant difference between them; the best compati-bility was achieved in the case of applying NDVI and DSWI indices for LAI determination – p-value was 0.857 and 0.804 for NDVI and DSWI, respectively.
As for the 2016 analysis, LAI values were gene-rated from 2017 S-2 data applying SNAP software and compared with ground LAI measurements. Comparison of these two datasets revealed that their compatibility is highly dependent on vegetation phase. At the phase of wax maturity (second part of June) the mean difference between measured and estimated LAI was 15.3%, so it was comparable to that obtained using vegetation indices. But in the early phase of plant development (tillering) preci-sion of LAI estimation using SNAP software was significantly lower. LAI values in 2017 were generally underestimated, differing from 2016 results; this happened due to different measurement points in both years and indicates that LAI estimation using SNAP software is highly location dependent.
In general, the less reliable performance of SNAP software for LAI estimation can be explained by the approach which is applied within this software. In this approach the whole suite of S-2 reflectances is used and modelling of LAI is performed applying a Neural Network. The results of such modelling can give less reliable results than straightforward statistical relations based on using vegetation indices dedicated to crop condition assessment.
Comparative analysis of LAI estimated using vegetation indices and applying SNAP software for 2017 is presented in Figure 5.
Fig. 4. Results of correlation analysis between S-2 based NDVI and ground measured LAI in April 2017
Fig. 5. Comparison of LAI estimation using a vegetation index and SNAP software – 2017
22
Zbigniew Bochenek, Katarzyna Dąbrowska-Zielińska, Radosław Gurdak, Fabrizio Niro, Maciej Bartold, Patryk Grzybowski
Geoinformation IssuesVol. 9, No 1 (9), 15–26/2017
4.2. Analysis of Proba-V data
In parallel to the analysis of Sentinel-2 images analogous analysis of Proba-V images at 100 m resolution was performed. Three vegetation indices derived from Proba-V – NDVI, NDII and EVI – were used for the analysis on two available dates in 2016: 05 June (heading phase) and 25 June (wax maturity phase) as well as on three dates in 2017 (23 May, 01 June, and 19 June). The results of corre-lation analysis between ground measured LAI and vegetation indices are presented in Table 5.
Table 5. Results of correlation analysis (r coefficient) for Proba-V data collected in 2016 and 2017
Date Phase NDVI NDII EVI
05 June 2016 Heading 0.469 0.695 0.425
25 June 2016 Wax maturity 0.304 0.315 0.061
23 May 2017 Heading 0.291 0.617 0.259
01 June 2017 Heading 0.243 0.482 0,248
19 June 2017 Wax maturity 0.416 0.332 0,379
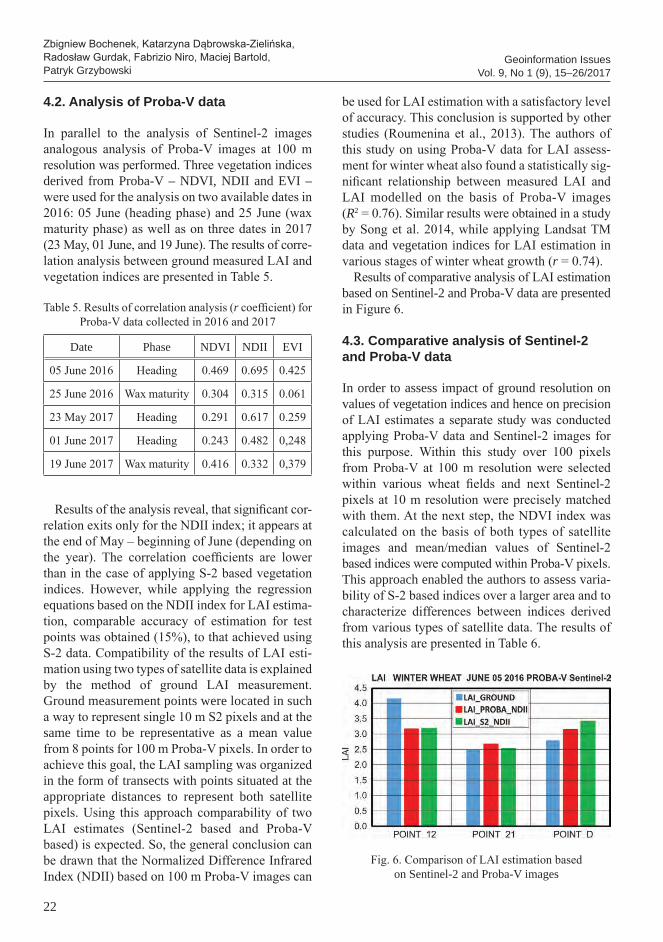
Results of the analysis reveal, that significant cor-relation exits only for the NDII index; it appears at the end of May – beginning of June (depending on the year). The correlation coefficients are lower than in the case of applying S-2 based vegetation indices. However, while applying the regression equations based on the NDII index for LAI estima-tion, comparable accuracy of estimation for test points was obtained (15%), to that achieved using S-2 data. Compatibility of the results of LAI esti-mation using two types of satellite data is explained by the method of ground LAI measurement. Ground measurement points were located in such a way to represent single 10 m S2 pixels and at the same time to be representative as a mean value from 8 points for 100 m Proba-V pixels. In order to achieve this goal, the LAI sampling was organized in the form of transects with points situated at the appropriate distances to represent both satellite pixels. Using this approach comparability of two LAI estimates (Sentinel-2 based and Proba-V based) is expected. So, the general conclusion can be drawn that the Normalized Difference Infrared Index (NDII) based on 100 m Proba-V images can
be used for LAI estimation with a satisfactory level of accuracy. This conclusion is supported by other studies (Roumenina et al., 2013). The authors of this study on using Proba-V data for LAI assess-ment for winter wheat also found a statistically sig-nificant relationship between measured LAI and LAI modelled on the basis of Proba-V images (R2 = 0.76). Similar results were obtained in a study by Song et al. 2014, while applying Landsat TM data and vegetation indices for LAI estimation in various stages of winter wheat growth (r = 0.74).
Results of comparative analysis of LAI estimation based on Sentinel-2 and Proba-V data are presented in Figure 6.
4.3. Comparative analysis of Sentinel-2 and Proba-V data
In order to assess impact of ground resolution on values of vegetation indices and hence on precision of LAI estimates a separate study was conducted applying Proba-V data and Sentinel-2 images for this purpose. Within this study over 100 pixels from Proba-V at 100 m resolution were selected within various wheat fields and next Sentinel-2 pixels at 10 m resolution were precisely matched with them. At the next step, the NDVI index was calculated on the basis of both types of satellite images and mean/median values of Sentinel-2 based indices were computed within Proba-V pixels. This approach enabled the authors to assess varia-bility of S-2 based indices over a larger area and to characterize differences between indices derived from various types of satellite data. The results of this analysis are presented in Table 6.
Fig. 6. Comparison of LAI estimation based on Sentinel-2 and Proba-V images
23
Validation of the LAI biophysical product derived from Sentinel-2 and Proba-V images for winter wheat in western Poland
Geoinformation IssuesVol. 9, No 1 (9), 15–26/2017
The following conclusions can be drawn from the presented analysis:
1. NDVI variability within Proba-V pixels, cha-racterized by standard deviation of S-2 based NDVI values, is dependent on field heteroge-neity, ranging from 0.005 to 0.094.
2. Compatibility of NDVI values derived from Proba-V and S-2 images depends on the phase of plant development, being high at the heading stage (mean difference between both indices is 2.5% on average) and lower at the tillering and wax maturity stages (5% and 6.8% differ-ence, respectively).
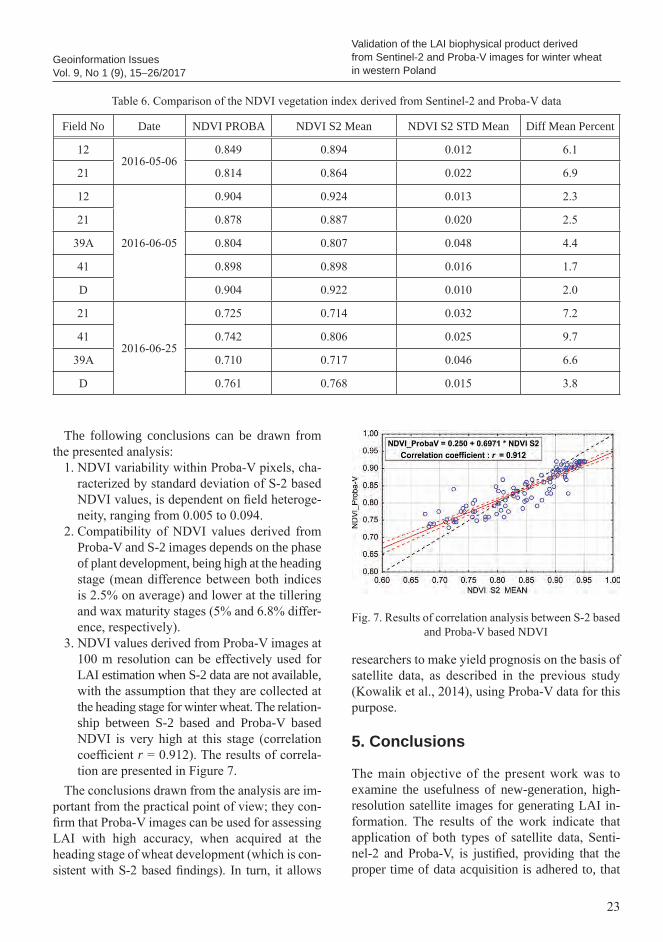
3. NDVI values derived from Proba-V images at 100 m resolution can be effectively used for LAI estimation when S-2 data are not available, with the assumption that they are collected at the heading stage for winter wheat. The relation-ship between S-2 based and Proba-V based NDVI is very high at this stage (correlation coefficient r = 0.912). The results of correla-tion are presented in Figure 7.
The conclusions drawn from the analysis are im-portant from the practical point of view; they con-firm that Proba-V images can be used for assessing LAI with high accuracy, when acquired at the heading stage of wheat development (which is con-sistent with S-2 based findings). In turn, it allows
researchers to make yield prognosis on the basis of satellite data, as described in the previous study (Kowalik et al., 2014), using Proba-V data for this purpose.
5. Conclusions
The main objective of the present work was to examine the usefulness of new-generation, high-resolution satellite images for generating LAI in-formation. The results of the work indicate that application of both types of satellite data, Senti-nel-2 and Proba-V, is justified, providing that the proper time of data acquisition is adhered to, that
Fig. 7. Results of correlation analysis between S-2 based and Proba-V based NDVI
Table 6. Comparison of the NDVI vegetation index derived from Sentinel-2 and Proba-V data
Field No Date NDVI PROBA NDVI S2 Mean NDVI S2 STD Mean Diff Mean Percent
122016-05-06
0.849 0.894 0.012 6.1
21 0.814 0.864 0.022 6.9
12
2016-06-05
0.904 0.924 0.013 2.3
21 0.878 0.887 0.020 2.5
39A 0.804 0.807 0.048 4.4
41 0.898 0.898 0.016 1.7
D 0.904 0.922 0.010 2.0
21
2016-06-25
0.725 0.714 0.032 7.2
41 0.742 0.806 0.025 9.7
39A 0.710 0.717 0.046 6.6
D 0.761 0.768 0.015 3.8
24
Zbigniew Bochenek, Katarzyna Dąbrowska-Zielińska, Radosław Gurdak, Fabrizio Niro, Maciej Bartold, Patryk Grzybowski
Geoinformation IssuesVol. 9, No 1 (9), 15–26/2017
appropriate vegetation indices derived from original satellite data are applied and that the proper sam-pling strategy for LAI ground-based measurements is used. It was found that accuracy of LAI estima-tion on the basis of vegetation indices is the highest in the heading stage of winter wheat. Three vegeta-tion indices derived from Sentinel 2 data – Nor-malized Difference Vegetation Index (NDVI), Normalized Difference Infrared Index (NDII) and Disease Water Stress Index (DSWI) – are the most suitable for estimating LAI with high accuracy; their precision for LAI determination is very similar. LAI derived from S-2 data using SNAP software should be considered as less reliable, because it delivers overestimated outputs at some stages of plant development.
Vegetation indices derived from Proba-V data at 100 m resolution also proved to be efficient for LAI estimation. The precision of LAI determina-tion is similar to that obtained from the use of S-2 based vegetation indices. Our study revealed that aggregation of information caused by the coarser Proba-V pixel does not greatly affect final values of vegetation indices and hence LAI estimates.
Acknowledgments
The research work was conducted within the pro-ject financed by the European Space Agency under ESRIN Contract No. 4000116440/16/I-SBo, titled “Land Products Validation and Characterisation in support to Proba-V, S-2 and S-3 missions”.
References
Aboelghar M., Arafat S., Saleh A., Naeem S., Shirbeny M., Belal A., (2013): Retrieving Leaf Area Index from SPOT4 satellite data, The Egyptian Journal of Remote Sensing and Space Science (2010), 13, pp. 121–127.
Baret F., Hagolle O., Geiger B., Bicheron P., Miras B. et al. (2007): LAI, fAPAR and fCOVER CYCLO-PES global products derived from VEGETATION Part 1: Principles of the algorithm, Remote Sen-sing of Environment, 2007, 110, pp. 275–286.
Berterretche M., Hudak A.T., Cohen W.B., Maier-spenger T.K., Gower S.T., Dungan J., (2005): Com-parison of regression and geostatistical methods
for mapping Leaf Area Index with Landsat ETM+ data over a boreal forest, Remote Sen-sing of Environment, 96, pp. 49–61.
Broge N.H., Leblanc E., (2000): Comparing pre-diction power and stability of broadband and hyperspectral vegetation indices for estimation of green leaf area index and canopy chlorophyll density, Remote Sensing of Environment, Vol. 76, Issue 2, pp. 156–172.
Carlson T.N., Ripley D.A., (1997): On the relation between NDVI, Fractional Vegetation Cover and Leaf Area Index, Remote Sensing of Envi-ronment 62; pp. 241–252.
Dabrowska-Zielinska K., Kogan F., Ciolkosz A., Gruszczynska M., Kowalik W., (2002): Model-ling crop growth conditions and crop yield in Poland using AVHRR-based indices, Interna-tional Journal of Remote Sensing, Vol. 23, No. 6, pp. 1109–1123.
Diercks W., Stercks S., Benhadj I., Livens S., Duhoux G., Van Achteren T., Francois M., Mel-lab K., Saint G., (2014): PROBA_V mission for global vegetation monitoring: standard pro-ducts and image quality, International Journal of Remote Sensing, Vol. 35, Issue 7, pp. 2589–2614.
Drusch M., Del Bello U., Carkier S., Colin O., Gascon F.F., Hoersch B., Isola C., Laberinti P., Martimort P., Meygret A., Spoto F., Sy O., Mar-chese F., Bargellini P., (2012): Sentinel-2 ESA’s optical high-resolution mission for GMES ope-rational services, Remote Sensing of Environ-ment, Vol. 120, 15 May 2012, pp. 25–36.
Frampton W.J. Dash J., Watmough G., Milton E.J., (2013): Evaluating the capabilities of Sentinel-2 for quantitative estimation of biophysical variables in vegetation, ISPRS Journal of Photogrammetry and Remote Sensing 82 (2013), pp. 83–92.
Friedl M.A., Schimel D.S., Michaelsen J., Davis F.W., Walker H., (1994): Estimating grassland bio-mass and Leaf Area Index using ground and satellite data, International Journal of Remote Sensing, Vol. 15, Issue 7, pp. 1401–1420.
Galvão L.S., Formaggio A.R., Tisot D.A., (2005): Discrimination of sugarcane varieties in South-eastern Brazil with EO-1 Hyperion data, Re-mote Sensing of Environment, Vol. 94, Issue 4, pp. 523–534.
GCOS, (2011): Systematic observation require-ments for satellite-based products for climate, 2011 update, WMO GCOS Rep. 154, 127 pp.
25
Validation of the LAI biophysical product derived from Sentinel-2 and Proba-V images for winter wheat in western Poland
Geoinformation IssuesVol. 9, No 1 (9), 15–26/2017
Hardinsky M.A.; Lemas V., (1983): The influence of soil salinity, growth form, and leaf moisture on the spectral reflectance of Spartina alternifolia canopies, Photogrammetric Engineering and Re-mote Sensing, Vol. 49, pp.77–83.
Heiskanen J., (2006): Estimating above ground tree biomass and Leaf Area Index in a mountain birch forest using satellite data, International Journal of remote Sensing, Vol. 27, No. 6, March 2006, pp. 1135–1158.
Huete A.R., (1988): A soil-adjusted vegetation index (SAVI), Remote Sensing of Environment, vol. 25, issue 3, pp. 259–309. DOI: 10.1016/0034-4257(88)90106-X
Huete A.R., Liu H., Batchily K., Leeuwen W., (1997): A comparison of vegetation indices over a global set of TM images for EOS-MODIS, Remote Sensing of Environment, No 59(3), pp. 440–451.
Jiang J., Xiao Z., Wang J., Song J., (2016): Multiscale estimation of Leaf Area Index from satellite ob-servations based on an ensemble multiscale filter, Remote Sensing 2016, 8, pp. 229; doi:10.3390/rs8030229
Kowalik W., Dabrowska-Zielinska K., Meroni M., Raczka T.U., de Wit A., (2014): Yield estimation using SPOT-VEGETATION products: A case study of wheat in European countries, Interna-tional Journal of Applied Earth Observation and Geoinformation 32, pp. 228–239.
Lee K.S., Cohen W.B., Kennedy R.E., Maiersper-ger T.K., Gower S.T., (2004): Hyperspectral versus multispectral data for estimating Leaf Area Index in four different biomes, Remote Sensing of Environment 91, pp. 508–520.
Li Z., Guo X., (2011): A suitable vegetation index for quantifying temporal variation of Leaf Area Index (LAI) in semiarid mixed grassland, Cana-dian Journal of remote Sensing, 36, pp. 709–721.
Price J.C., (1993): Estimating Leaf Area Index from satellite data, IEEE Transactions on Geo-science and Remote Sensing, Vol. 31, Issue 3, May 1993, pp. 727–734.
Roumenina E., Kazandijev V., Dimitrow P., Fil-chev L., Jelev G., (2013): Validation of LAI and assessment of winter wheat status using spectral data and vegetation indices from SPOT VEGE-TATION and simulated PROBA-V images, In-ternational Journal of Remote Sensing, Vol. 34, Issue 8, pp. 2888–2904, doi.org/10.1080/01431161.2012.755276
Rousse J.W., Haas R.H., Schell J.A., Deering D.W., (1973): Monitoring vegetation systems in the Great Plains with ERTS, Third ERTS Symposium, NASA SP-351 I, pp. 309–317.
Shen L., Li Z., Guo X., (2014): Remote Sensing of Leaf Area Index (LAI) and a spatiotemporally parameterized model for mixed grasslands, Inter-national Journal of Applied Science and Tech-nology, Vol. 4, No. 1, January 2014, pp. 46–61.
Song X., Ciu B., Yang G., Feng H., (2014): Com-parison of winter wheat growth with multi-tem-poral remote sensing imagery. 35th International Symposium on Remote Sensing of Environment, IOP Conf. Series: Earth and Environmental Science 17 (2014) 012044 doi:10.1088/1755-1315/17/1/012044
Turner D.P.; Cohen W.B.; Kennedy R.E., Fass-nacht K.S.; Briggs J.M., (1999): Relationships between leaf area index and Landsat TM spec-tral vegetation indices across three temperate zone sites, Remote Sensing of Environment 1999, 70, pp. 52–68.
Zheng G., Moskal L.M., (2009): Retrieving Leaf Area Index (LAI) using remote sensing; theo-ries, methods and sensors, Sensors 2009, 9, pp. 2719–2745.
26
Geoinformation IssuesVol. 9, No 1 (9), 15–26/2017
Zbigniew Bochenek, Katarzyna Dąbrowska-Zielińska, Radosław Gurdak, Fabrizio Niro, Maciej Bartold, Patryk Grzybowski
Walidacja produktu biofizycznego LAI generowanego na podstawie obrazów satelitarnych Sentinel-2 i Proba-V dla pszenicy ozimej w zachodniej PolsceZbigniew BochenekInstytut Geodezji i Kartografii, ul. Jacka Kaczmarskiego 27, 02-679 WarszawaTel.: +48 22 3291977, Fax: +48 22 3291950, E-mail: [email protected] Dąbrowska-ZielińskaInstytut Geodezji i Kartografii, ul. Jacka Kaczmarskiego 27, 02-679 Warszawa Tel.: +48 22 3291974, Fax: +48 22 3291950, E-mail: [email protected] NiroESA-ESRIN, Via Galileo Galilei, 00044 Frascati, WłochyTel: +39 06 941-88387, Email: [email protected]ław GurdakUniwersytet Warszawski, Wydział Geografii i Studiów Regionalnych, Zakład Geoinformatyki, Kartografii i Teledetekcji, ul. Krakowskie Przedmieście 30, 00-927 WarszawaInstytut Geodezji i Kartografii, ul. Jacka Kaczmarskiego 27, 02-679 WarszawaTel.: +48 22 3291978, Fax: +48 22 3291950, E-mail: [email protected] BartoldUniwersytet Warszawski, Wydział Geografii i Studiów Regionalnych, Zakład Geoinformatyki, Kartografii i Teledetekcji Instytut Geodezji i Kartografii, ul. Jacka Kaczmarskiego 27, 02-679 WarszawaTel.: +48 22 3291978, Fax: +48 22 3291950, E-mail: [email protected] GrzybowskiInstytut Geodezji i Kartografii, ul. Jacka Kaczmarskiego 27, 02-679 WarszawaTel.: +48 22 3291989, Fax: +48 22 3291950, E-mail: [email protected]
Streszczenie: Głównym celem prezentowanej pracy jest ocena możliwości wykorzystania obrazów sateli-tarnych nowej generacji dla określania wskaźnika pokrycia liśćmi LAI. W badaniach wykorzystano dwa typy danych satelitarnych: Sentinel-2 oraz Proba-V. Na ich podstawie wygenerowano różne wskaźniki roślinności i skorelowano je z wartościami LAI pomierzonymi w terenie. W wyniku przeprowadzonych analiz stwierdzono dobre zależności pomiędzy wskaźnikami NDVI, NDII i DSWI a naziemnymi wartościami LAI; okazało się również, że siła tych zależności zależy od fazy rozwojowej roślin. Stwierdzono także, że dokładność wyzna-czania wartości LAI za pomocą wskaźników roślinnych generowanych na podstawie obrazów satelitarnych Sentinel-2 oraz Proba-V jest zbliżona, pod warunkiem wykorzystania danych z odpowiedniego okresu wege-tacji roślin – fazy kłoszenia dla pszenicy ozimej.
Słowa kluczowe: Wskaźnik Powierzchni Liści, Sentinel-2, Proba-V, walidacja, pszenica ozima