Validation of the Spatial Accuracy of the
ExacTrac® Adaptive Gating System
Gregory Twork
Department of Medical Physics
McGill University, Montreal, QC
August 2011
A thesis submitted to McGill University in partial fulfillment of the requirements
of the degree of Master of Science in Medical Physics
© Gregory Twork 2011
ii
Acknowledgements
The research for this thesis was done in the Medical Physics Unit and
Radiation Oncology Department of the Montreal General Hospital under the
auspices of McGill University, Montreal, Quebec, Canada.
Firstly I would like to thank my supervisor, Horacio Patrocinio, for all of
his time, effort, and knowledge he contributed to my thesis. Also, my project
would not have been possible without the support of Dr. David Roberge. I would
also like to thank Dr. Emily Poon and Dr. Emilie Soisson for all their help giving
me the clinical experience to complete my work.
I want to thank several other members of the staff and students who
helped with discussions, information, and friendship over the past few years. In
particular, William Parker, Dr. Jan Seuntjens, Naomi Shin, Rafael
Khatchadourian, and Eunah Chung have helped out tremendously.
Lastly, I would like to thank my parents, John and Sherilyn, and my two
sisters, Monica and Elizabeth for their love and support through everything.
iii
Abstract Stereotactic body radiation therapy (SBRT) is a method of treatment that
is used in extracranial locations, including the abdominal and thoracic cavities, as
well as spinal and paraspinal locations. At the McGill University Health Centre,
liver SBRT treatments include gating, which places the treatment beam on a duty
cycle controlled by tracking of fiducial markers moving with the patient’s
breathing cycle. Respiratory gated treatments aim to spare normal tissue, while
delivering a dose properly to a moving target.
The ExacTrac® system (BrainLAB AG Germany) is an image-guided
radiotherapy system consisting of a combination of infra-red (IR) cameras and
dual kilovoltage (kV) X-ray tubes. The IR system is used to track patient
positioning and respiratory motion, while the kV X-rays are used to determine a
positional shift based on internal anatomy or fiducial markers.
In order to validate the system’s ability to treat under gating conditions,
each step of the SBRT process was evaluated quantitatively. Initially the system
was tested under ideal static conditions, followed by a study including gated
parameters. The uncertainties of the isocenters, positioning algorithm, planning
computed tomography (CT) and four dimensional CT (4DCT) scans, gating
window size and tumor motion were evaluated for their contributions to the total
uncertainty in treatment.
The mechanical isocenter and 4DCT were found to be the largest sources
of uncertainty. However, for tumors with large internal amplitudes (>2.25 cm)
that are treated with large gating windows (>30%) the gating parameters can
contribute more than 1.1 ± 1.8 mm.
iv
Abrégé
La radiochirurgie stéréotaxique corporelle (RCSC) est une modalité de
traitement utilisée sur les lésions extracraniales, tels que les cavités abdominaux et
thoraciques, ainsi que les lésions situées à l’intérieure ou l’extérieure de l’épine
dorsale. Au Centre Universitaire de Santé de McGill (CUSM), les traitements de
la foie par RCSC se basent sur la synchronisation respiratoire qui permet de
contrôler le faisceau de photons à l’aide de marqueurs référencés du cycle
respiratoire du patient. L’objectif des traitements par synchronisation respiratoire
est de limiter le dommage au tissue normal tout en transmettant la dose appropriée
à la cible en mouvement.
Le système ExacTrac® (BrainLab AG Allemagne) est un système de
radiothérapie guidée par image comprenant une caméra infrarouge (IR) et deux
tubes à rayons-x à l’échelle des kilovolts (kV). Le système IR suit le
positionnement des patients et le mouvement respiratoire, alors que les rayons-x
kV déterminent la variation des positions basées sur l’anatomie interne ou les
marqueurs référencés. Afin de valider la capacité d’opération du système sous les
conditions de synchronisations respiratoires, chaque étape du RCSC a été évaluée
quantitativement. Initialement, le système fut testé sous les conditions statiques
idéales, suivi par une étude incluant les paramètres de synchronisations. Les
incertitudes de l’isocentre, l’algorithme de positionnement, la planification de la
tomodensitométrie (CT) et les balayages par tomodensitométrie à quatre
dimensions (4DCT), la période de synchronisation, et le mouvement de la tumeur
furent évalués et la contribution de chacun des facteurs à l’erreur totale du
traitement déterminée. L’isocentre mécanique et le 4DCT s’avèrent être les
sources d’incertitudes majeures. Cependant, pour les tumeurs à large amplitude
interne (>2.25 cm) qui sont traitées avec de larges périodes de synchronisations (>
30%), les paramètres de synchronisations peuvent aussi avoir des contributions
supérieures à 1.1 ± 1.8 mm.
v
Table of Contents
Acknowledgements ................................................................................................. ii
Abstract .................................................................................................................. iii
Abrégé .................................................................................................................... iv
List of Figures ...................................................................................................... viii
List of Tables ......................................................................................................... xi
Chapter 1: Introduction ........................................................................................... 1
1.1 Stereotactic Radiosurgery and Radiotherapy .............................................. 1
1.1.1 History.................................................................................................... 1
1.1.2 General SRS Requirements.................................................................... 3
1.2 General SBRT Concepts and Process ........................................................... 3
1.2.1 Organ Motion ......................................................................................... 4
1.2.2 Dose Prescription and Fractionation ...................................................... 5
1.2.3 Clinical SBRT Process at the MUHC .................................................... 5
1.2.3.1 Internal Fiducial Markers ................................................................. 6
1.2.3.2 Patient Immobilization and Organ Motion ...................................... 7
1.2.3.3 Four-Dimensional Computed Tomography Scan ............................ 8
1.2.3.4 Treatment Planning and Dose Prescription...................................... 9
1.2.3.5 Patient Positioning ......................................................................... 10
1.2.3.6 Treatment Delivery ........................................................................ 11
1.2.3.7 Image Guidance ............................................................................. 12
1.2.3.8 Daily Quality Assurance and Calibration ...................................... 12
1.3 Uncertainty Tests: A Literature Review ..................................................... 13
1.3.1 Phantom Studies................................................................................... 14
1.3.2 Patient Studies ...................................................................................... 17
1.4 Purpose and Organization of the Thesis ..................................................... 17
Chapter 2: Theory ................................................................................................. 23
2.1 Radiation Therapy Target Volumes ............................................................ 23
2.2 Theory of Uncertainties .............................................................................. 24
2.3 Isocenters .................................................................................................... 28
2.4 Respiratory Gating ...................................................................................... 30
vi
2.4.1 The Breath Trace and Surrogate Correlation ....................................... 30
2.4.2 Respiratory Gating Benefits and Issues ................................................... 32
2.5 Imaging Modalities ..................................................................................... 33
2.5.1 Computed Tomography ....................................................................... 33
2.5.2 BrainLAB ExacTrac® 6D Image Guidance System ........................... 35
2.6 Combination of Uncertainties and Summary of Theory ......................... 39
Chapter 3: Matierals and Methods ........................................................................ 42
3.1 Equipment ................................................................................................... 42
3.1.1 CT and RPM ........................................................................................ 42
3.1.2 Treatment Planning Software .............................................................. 43
3.1.3 Linac .................................................................................................... 43
3.1.4 ExacTrac® and Accessories ................................................................ 43
3.1.5 Phantoms .............................................................................................. 44
3.1.6 Film QA ............................................................................................... 48
3.2 Isocenter Evaluation Experiments .............................................................. 50
3.2.1 IR Tracking of Couch Movement ........................................................ 50
3.2.2 ExacTrac® X-ray Tracking of Couch Movement ............................... 51
3.2.3 Daily Winston Lutz Check ................................................................... 51
3.2.4 The Hidden Target Test ....................................................................... 53
3.2.5 Coordinate Deviation of the ExacTrac® System ................................. 54
3.3 Image Fusion Experiments ......................................................................... 55
3.3.1 Relative Comparison of Fusion Methods on a Static Phantom ........... 56
3.3.2 Relative Comparison of Fusion Methods on a Static Anthropomorphic
Phantom .................................................................................................... 56
3.4 Computed Tomography Experiments ......................................................... 57
3.4.1 Effect of Slice Thickness Using a Static CT ........................................ 57
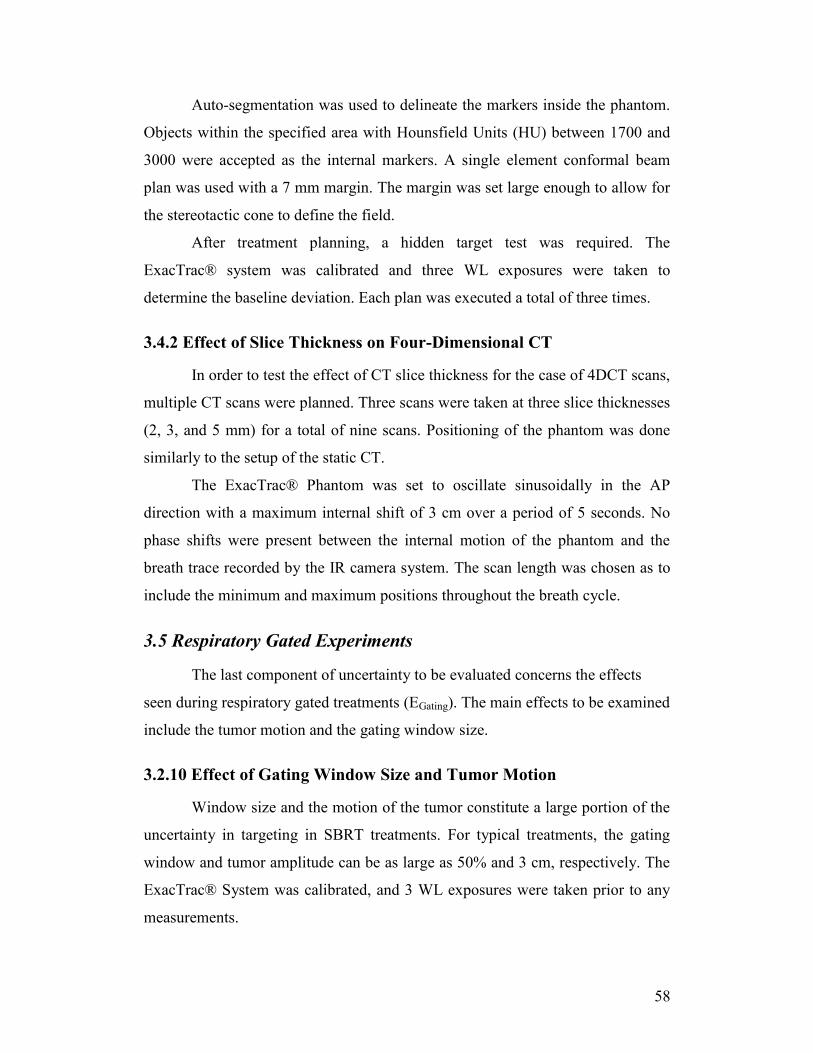
3.4.2 Effect of Slice Thickness on Four-Dimensional CT ............................ 58
3.5 Respiratory Gated Experiments .................................................................. 58
3.2.10 Effect of Gating Window Size and Tumor Motion ........................... 58
3.6 Patient Study ............................................................................................... 59
Chapter 4: Results and Discussion ........................................................................ 63
vii
4.1 Isocenter Evaluation.................................................................................... 63
4.1.1 IR Tracking of Couch Movement ........................................................ 63
4.1.2 X-ray Tracking of Couch Movement ................................................... 64
4.1.3 Evaluation of Daily WL Films ............................................................. 66
4.1.4 Coordinate Deviation of the ExacTrac® System ................................. 68
4.2 Image Fusion ............................................................................................... 68
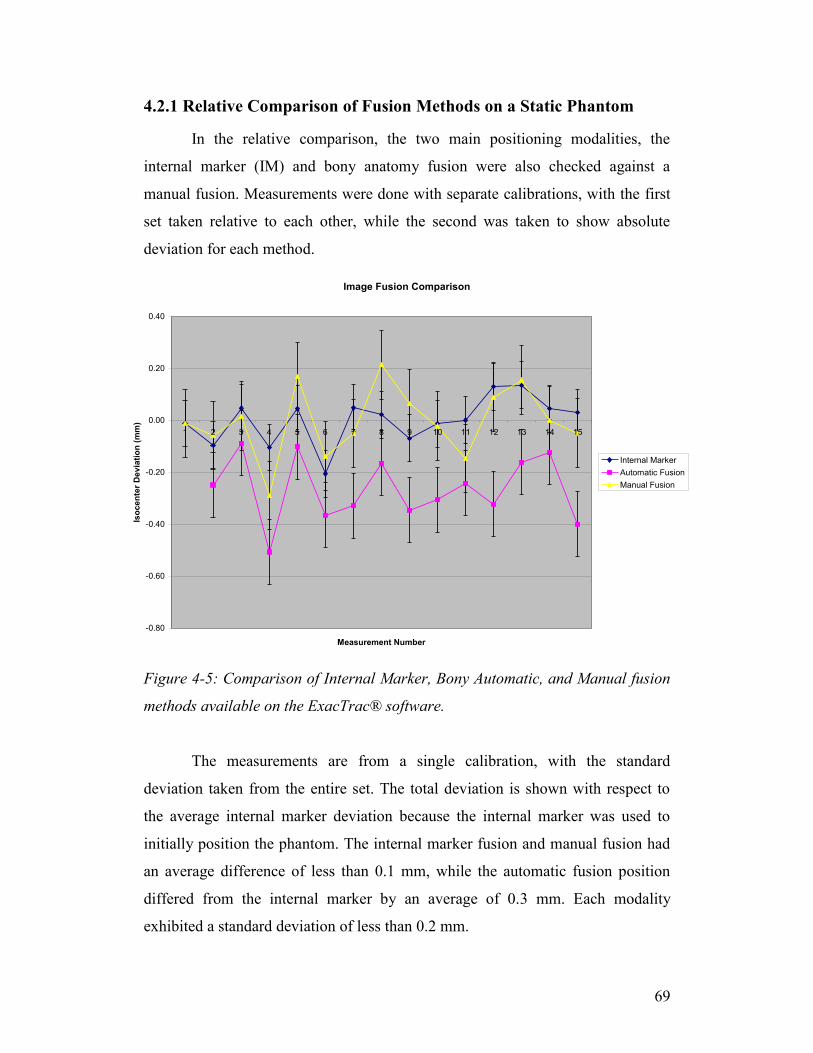
4.2.1 Relative Comparison of Fusion Methods on a Static Phantom ........... 69
4.2.2 Comparison of Image Fusion Methods for a Static Gating Phantom .. 71
4.2.3 Comparison of Fusion Methods on a Static Anthro. Phantom ............ 72
4.3 Computed Tomography .......................................................................... 77
4.3.1 Effect of Slice Thickness Using a Static CT ........................................ 77
4.3.2 Effect of Slice Thickness on a Four-Dimensional CT ......................... 78
4.4 Respiratory Gated Effects ........................................................................... 79
4.4.1 Comparison of Treatment Plans using End-to-End Test ..................... 79
4.4.2 Tumor Amplitude................................................................................. 82
4.4.3 Effect of Gating Window Size and Tumor Motion ............................. 83
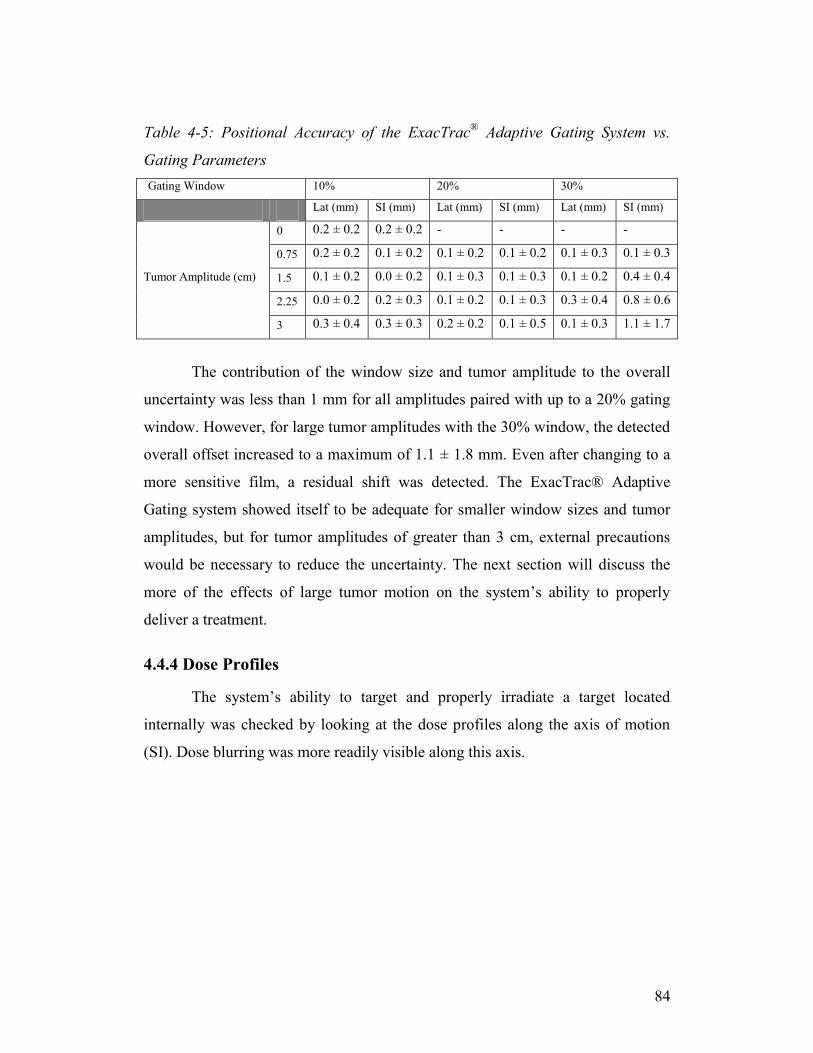
4.4.4 Dose Profiles ........................................................................................ 84
4.5 Patient Study and Summary ........................................................................ 85
4.5.1 Patient Study ........................................................................................ 86
4.5.2 Comparison of Spatial Accuracy on a Phantom vs. Patient ................. 87
Chapter 5: Conclusion........................................................................................... 91
5.1 Summary of Thesis ..................................................................................... 91
5.2 Future Work ............................................................................................ 92
BIBLIOGRAPHY ................................................................................................. 97
viii
List of Figures
Figure 1-1: ITV treatment (A) versus gated treatment (B) including a setup
margin. The red area denotes the treatment field. ................................................... 4
Figure 1-1: Two implanted fiducials for a liver SBRT patient. The fiducials are
chosen to give high contrast on an X-ray of the patient. ........................................ 7
Figure 1-2: Vacuum bag used for placing patient in a reproducible position on
both the planning CT and the treatment couch. ...................................................... 8
Figure 1-3: The Varian® RPM system consists of an IR camera and screen (A),
which relays the respiratory information to the RPM interface (B). ...................... 9
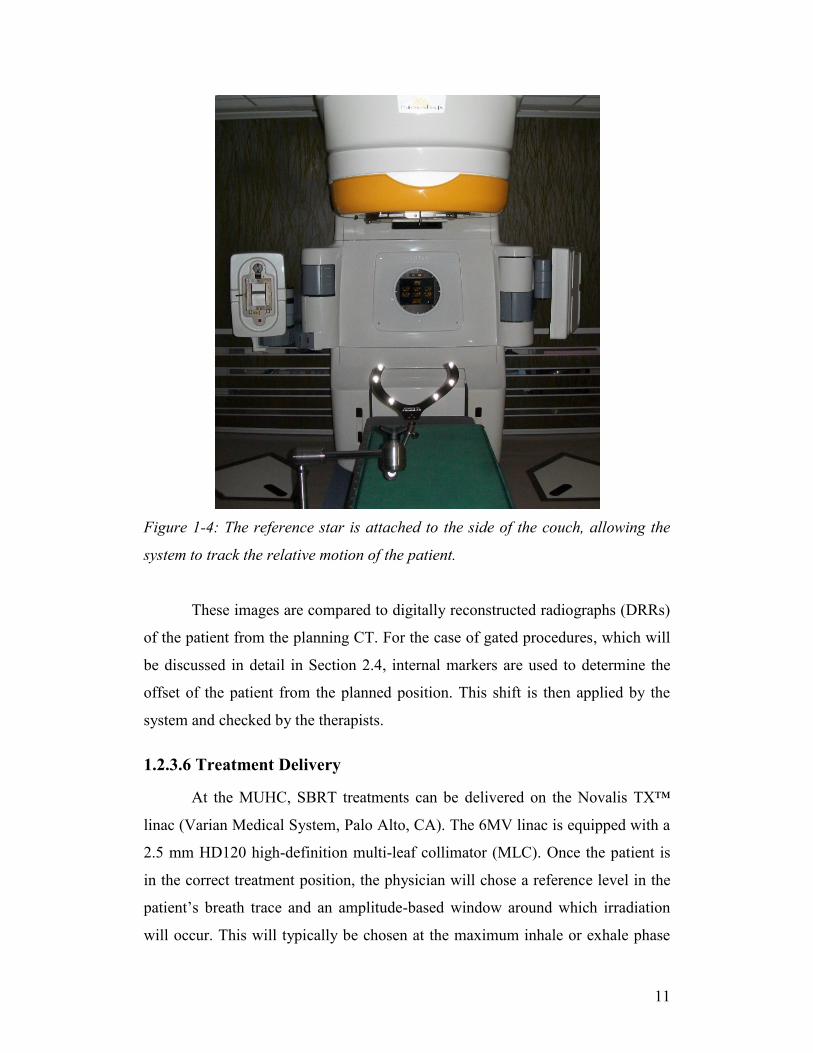
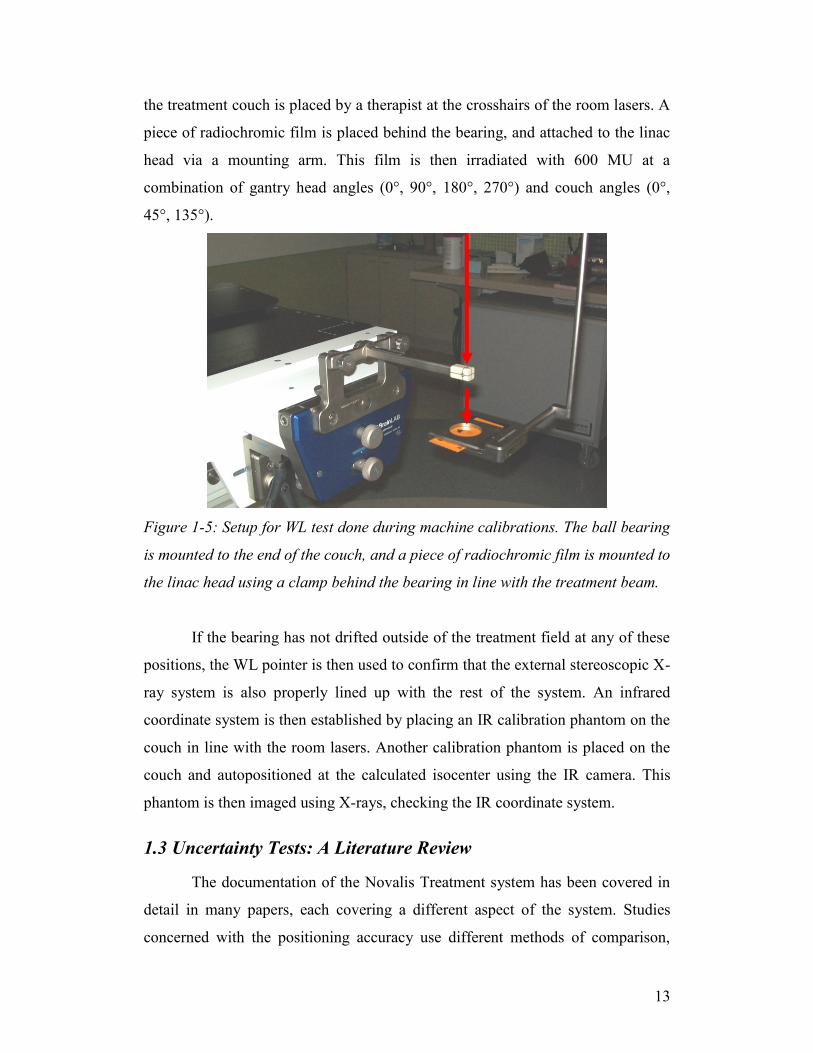
Figure 1-4: The reference star is attached to the side of the couch, allowing the
system to track the relative motion of the patient. ................................................ 11
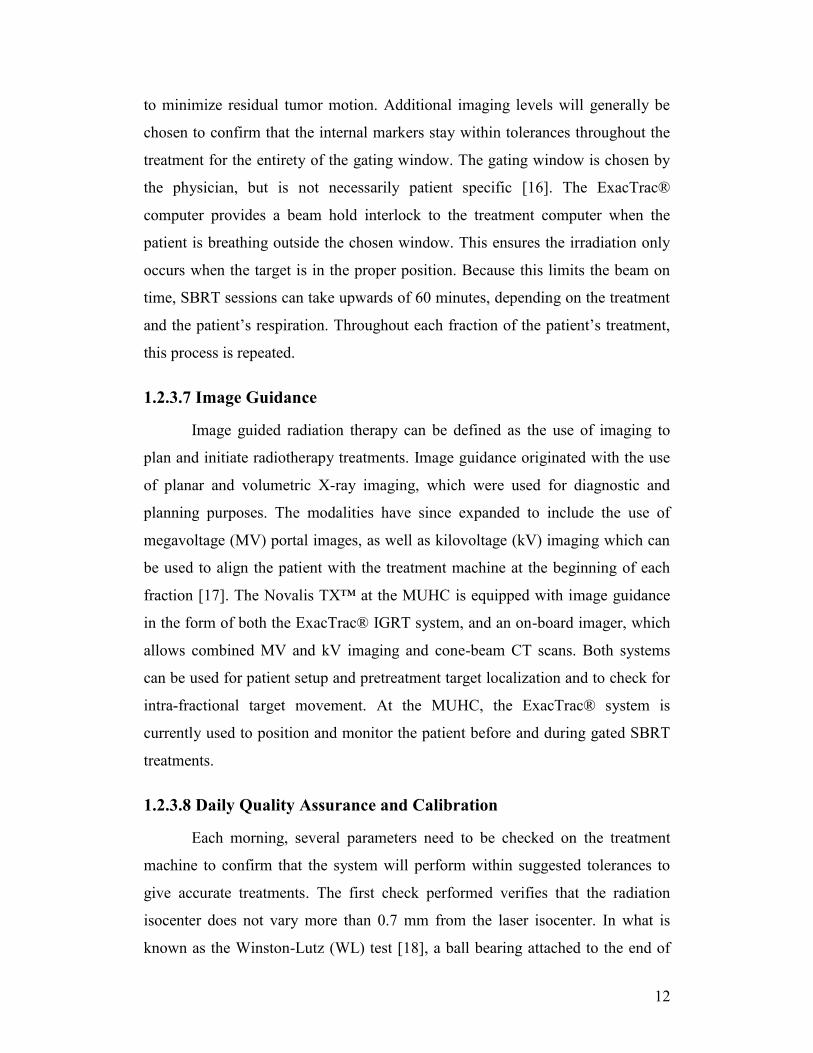
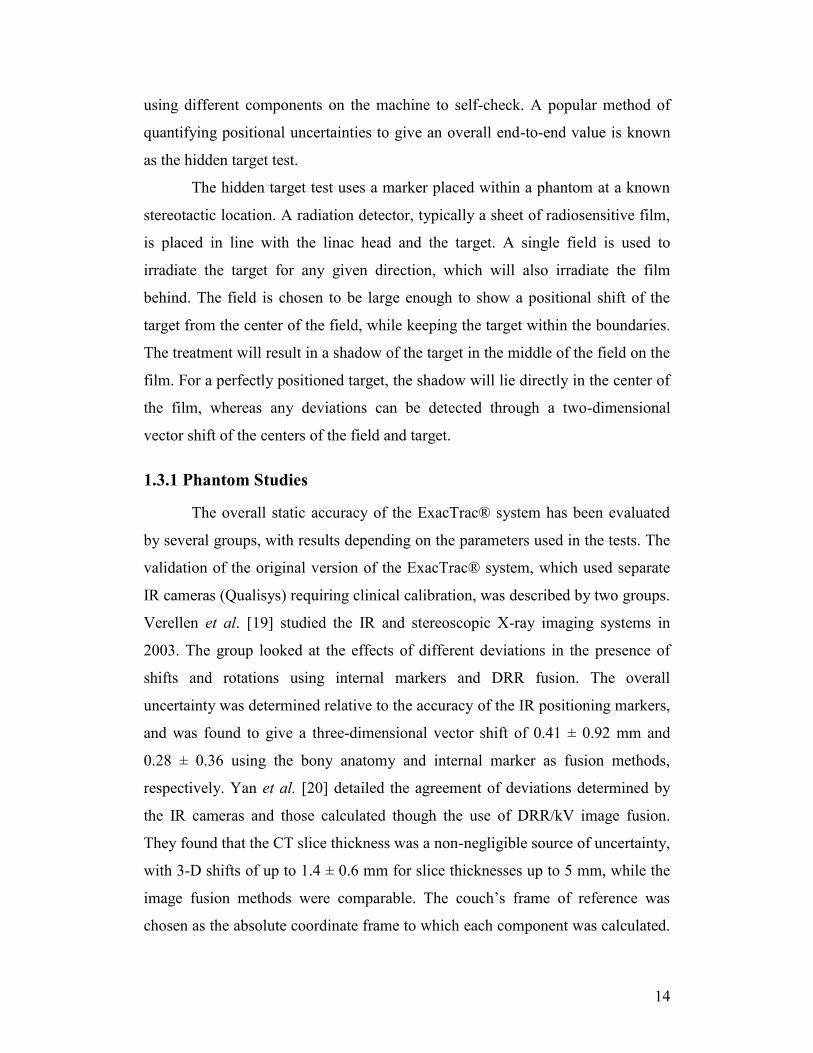
Figure 1-5: Setup for WL test done during machine calibrations. The ball bearing
is mounted to the end of the couch, and a piece of radiochromic film is mounted
to the linac head using a clamp behind the bearing in line with the treatment
beam. ..................................................................................................................... 13
Figure 2-1: Target volume definitions, as described by the International
Commission on Radiation Units and Measurements. ........................................... 24
Figure 2-2: Allowable tolerance of spatial uncertainties through the course of a
typical treatment using the ExacTrac® system for positioning. ........................... 25
Figure 2-3: Flowchart describing the method used to check the different
isocenters and coordinate systems. The radiation isocenter is compared to the
laser isocenter, which is then used to set up the IR coordinate system. The IR
system is then used to check that the ExacTrac® X-ray isocenter is accurate.
Finally, the X-rays are then compared to the original WL pointer to check that the
radiation isocenter and the ExacTrac® isocenter coincide within tolerance. ....... 28
Figure 2-4: Diagram of a ‘star pattern’ exposure, useful in determining the
variability of the radiation isocenter. .................................................................... 29
Figure 2-5: Typical breath trace of a patient with a consistent rhythm over a 60
second period. ....................................................................................................... 31
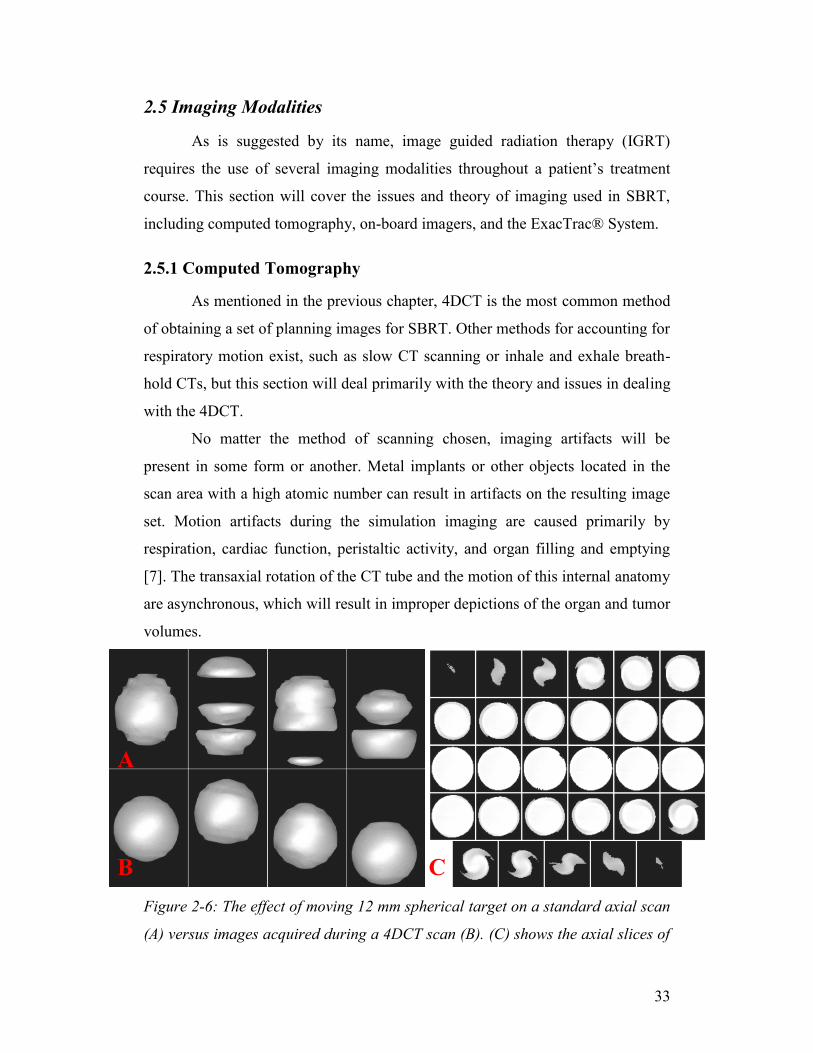
Figure 2-6: The effect of moving 12 mm spherical target on a standard axial scan
(A) versus images acquired during a 4DCT scan (B). (C) shows the axial slices of
a 4DCT of a moving spherical target. The spiral pattern results from the
reconstructions over a full rotation of the CT, and show a decreased density
around the outer surface, due to averaging effects. Reproduced from [42]. ......... 33
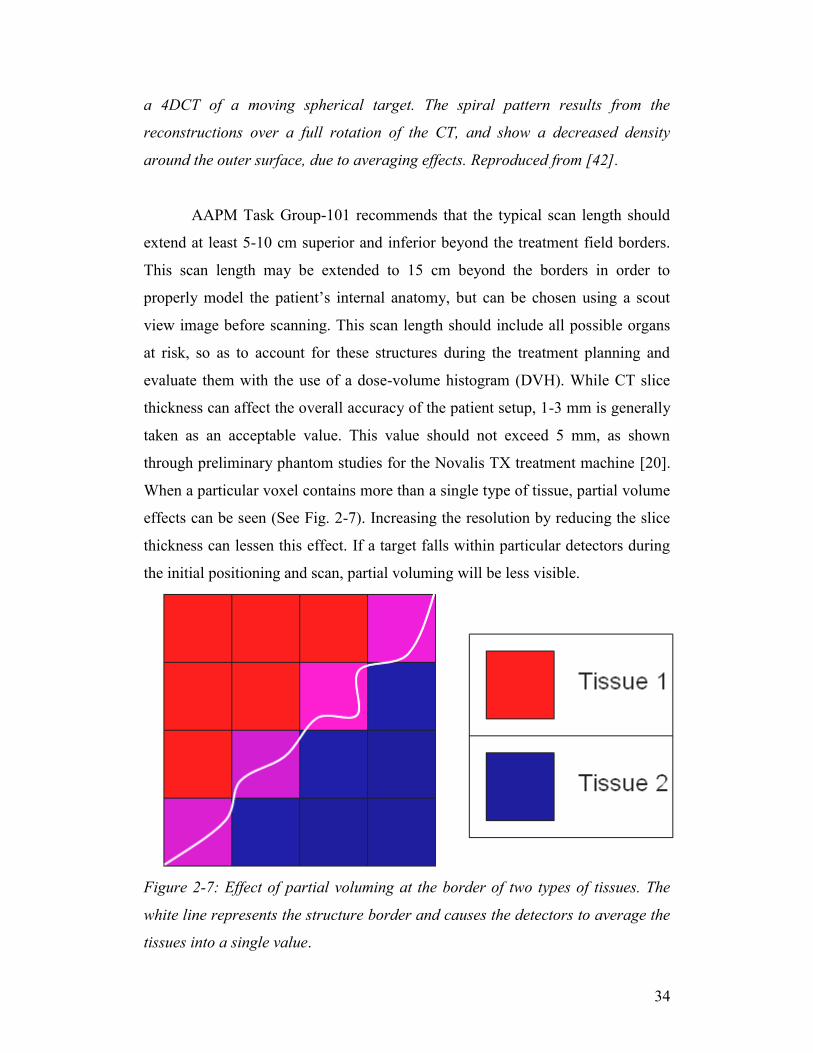
Figure 2-7: Effect of partial voluming at the border of two types of tissues. The
white line represents the structure border and causes the detectors to average the
tissues into a single value ...................................................................................... 34
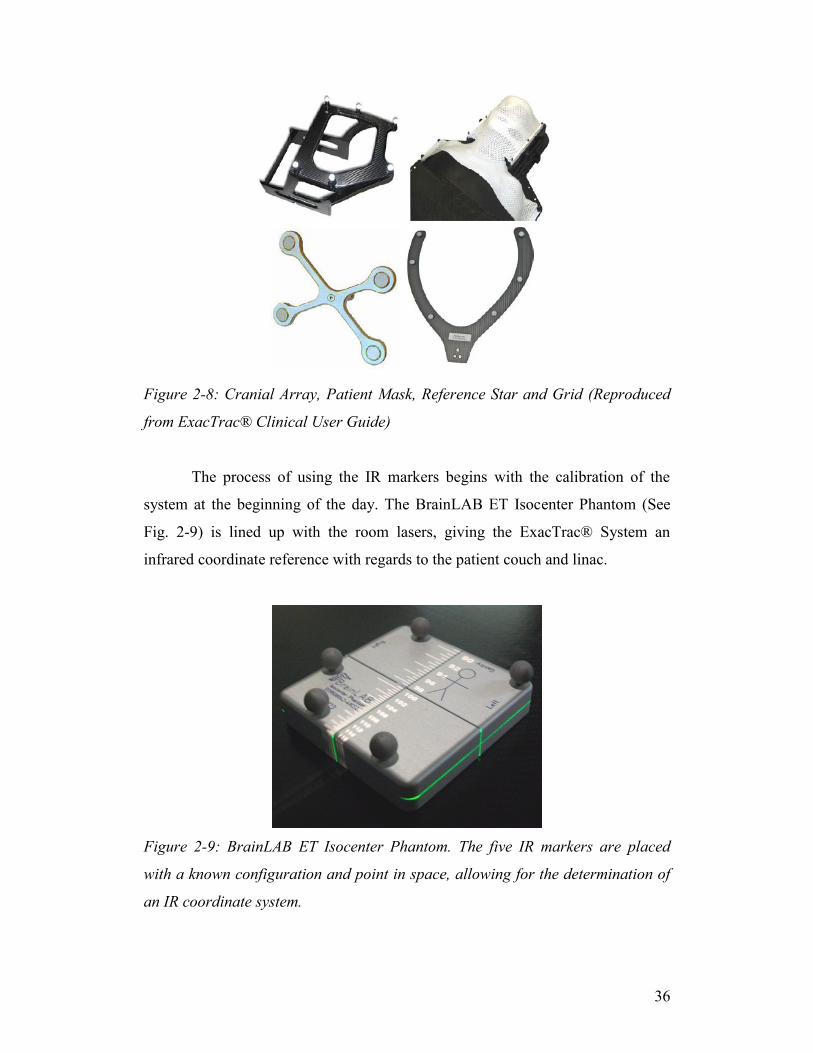
Figure 2-8: Cranial Array, Patient Mask, Reference Star and Grid (Reproduced
from ExacTrac® Clinical User Guide) ................................................................. 36
Figure 2-9: BrainLAB ET Isocenter Phantom. The five IR markers are placed
with a known configuration and point in space, allowing for the determination of
an IR coordinate system. ....................................................................................... 36
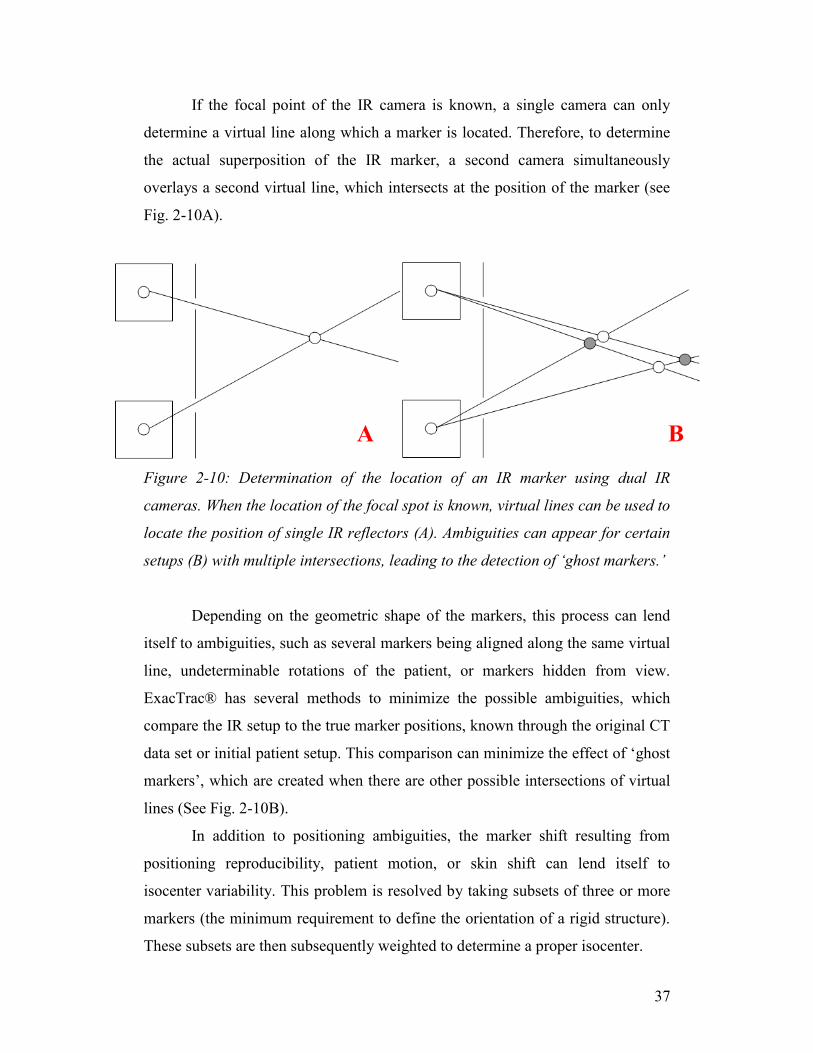
Figure 2-10: Determination of the location of an IR marker using dual IR
cameras. When the location of the focal spot is known, virtual lines can be used to
locate the position of single IR reflectors (A). Ambiguities can appear for certain
ix
setups (B) with multiple intersections, leading to the detection of ‘ghost markers.’
............................................................................................................................... 37
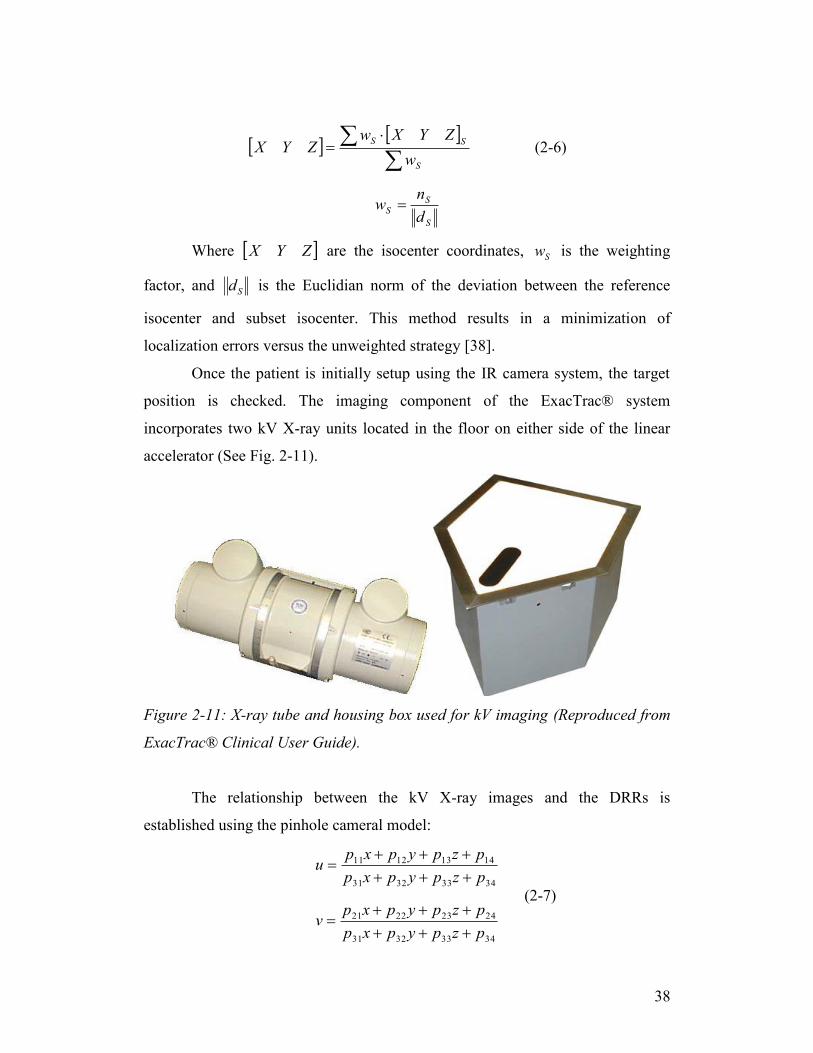
Figure 2-11: X-ray tube and housing box used for kV imaging (Reproduced from
ExacTrac® Clinical User Guide). ......................................................................... 38
Figure 3-1: Both the cranial array (A) and the reference array (B) are outfitted
with six IR markers. .............................................................................................. 44
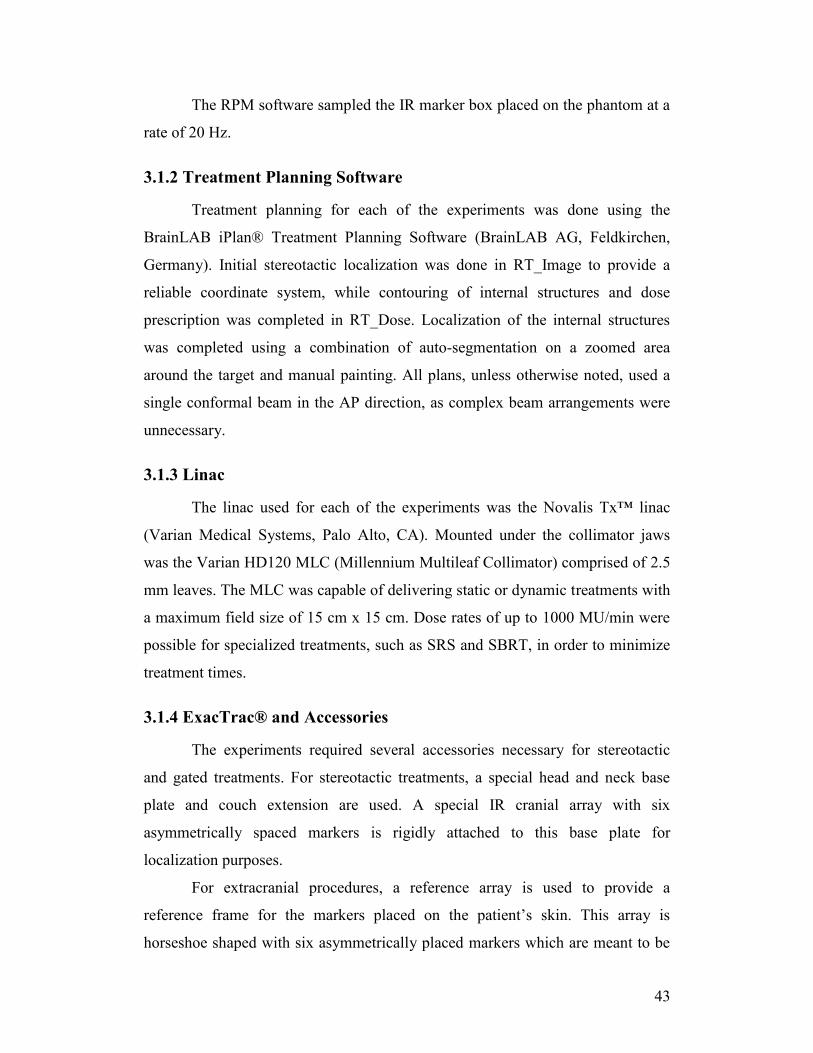
Figure 3-2: PMMA phantom. Each slice can contain a number of slots or internal
markers, allowing for a unique configuration specific for the user’s purpose. ..... 45
Figure 3-4: The ET Gating Phantom. The longitudinally moving platform (A) and
the vertical marker plate (B) simulate the internal and external motion of a SBRT
patient. ................................................................................................................... 46
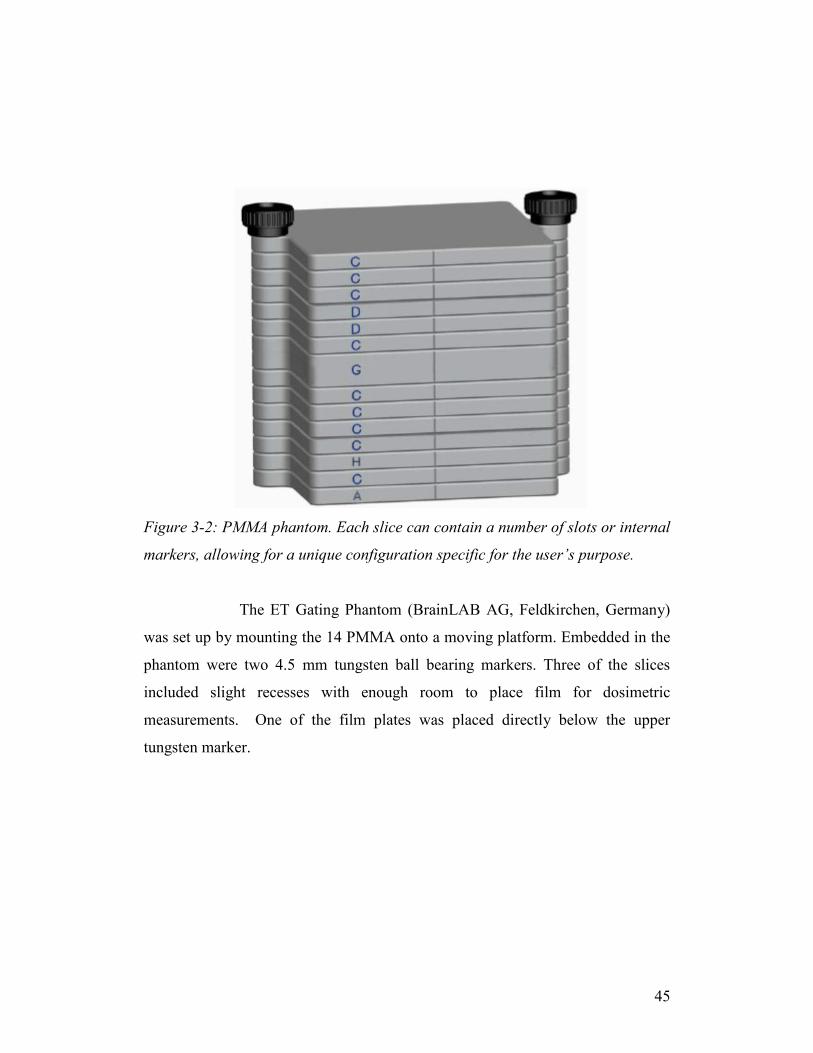
Figure 3-3: Anthropomorphic head phantom used for testing positioning fusion
algorithms. The lighter colored pegs placed in an array could be removed and
replaced with markers, dosimeters, or different density inserts............................ 47
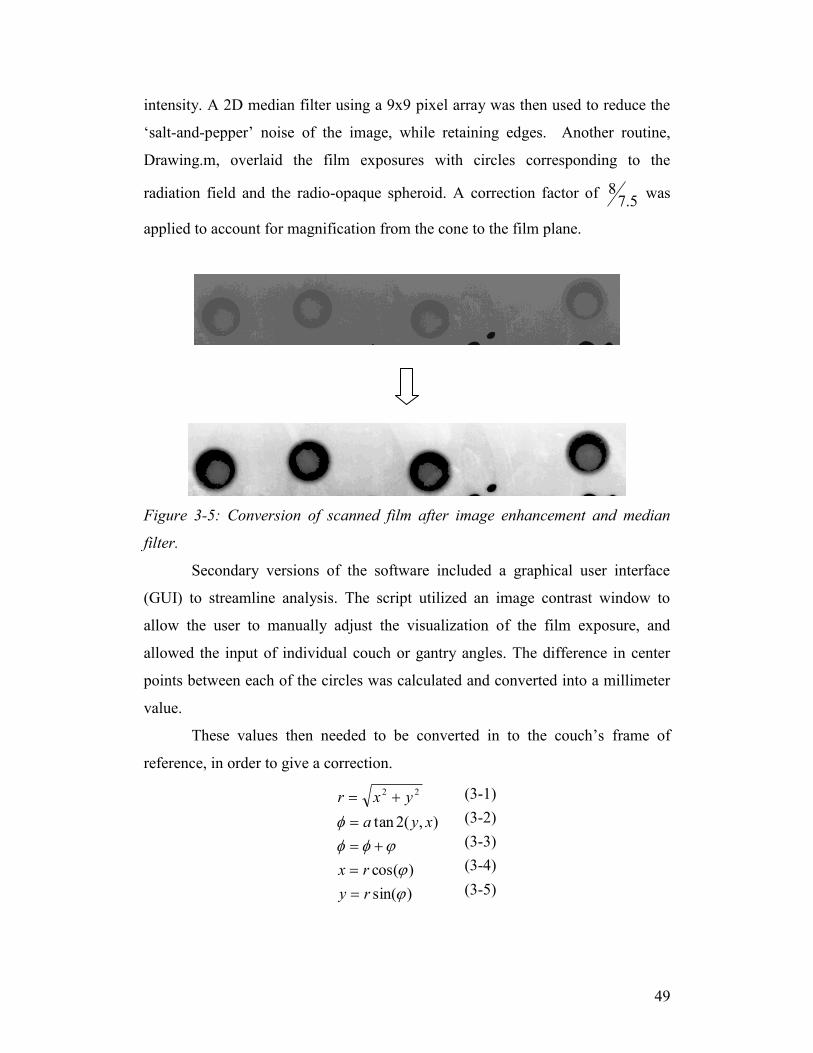
Figure 3-5: Conversion of scanned film after image enhancement and median
filter. ...................................................................................................................... 49
Figure 3-6: Preparation for alignment of WL pointer (A) with lasers. Precision
positioning knobs (B) are used to shift the pointer along the lateral and vertical
axes. A properly aligned WL pointer can be seen on the right. ............................ 52
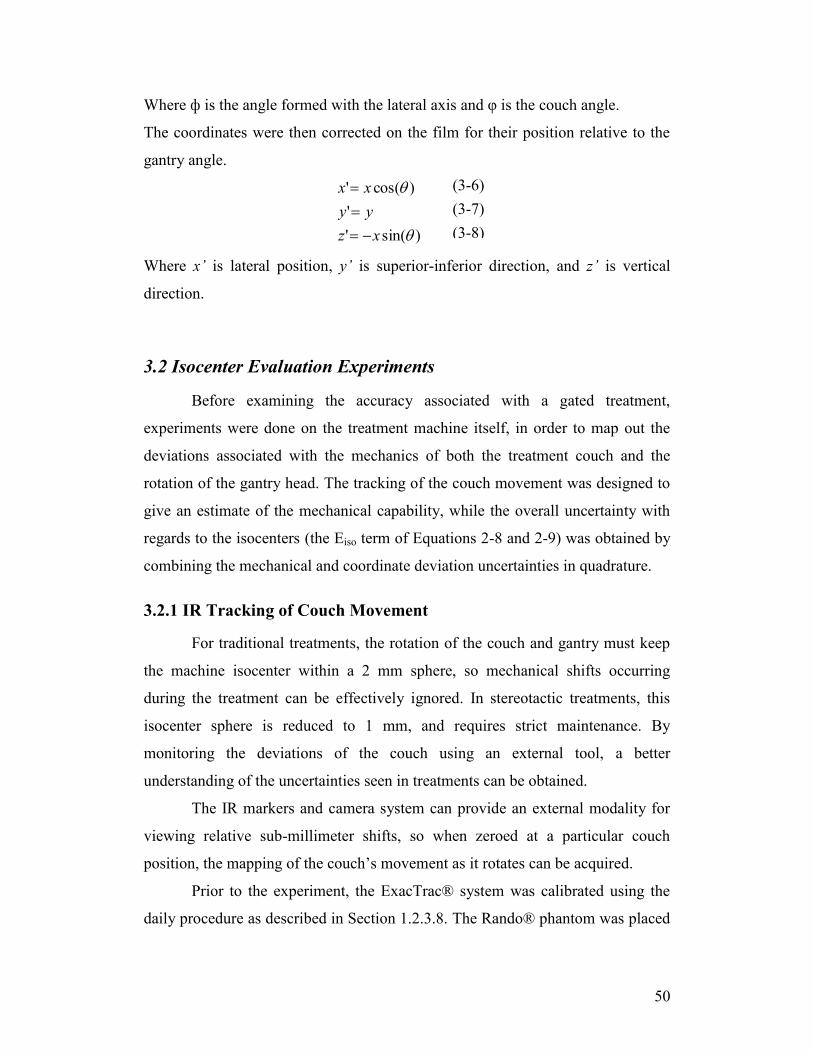
Figure 3-7: Stereotactic cones (A) used for treatment and calibration procedures.
Cones are placed into a mount (B) directly beneath the linac head. ..................... 54
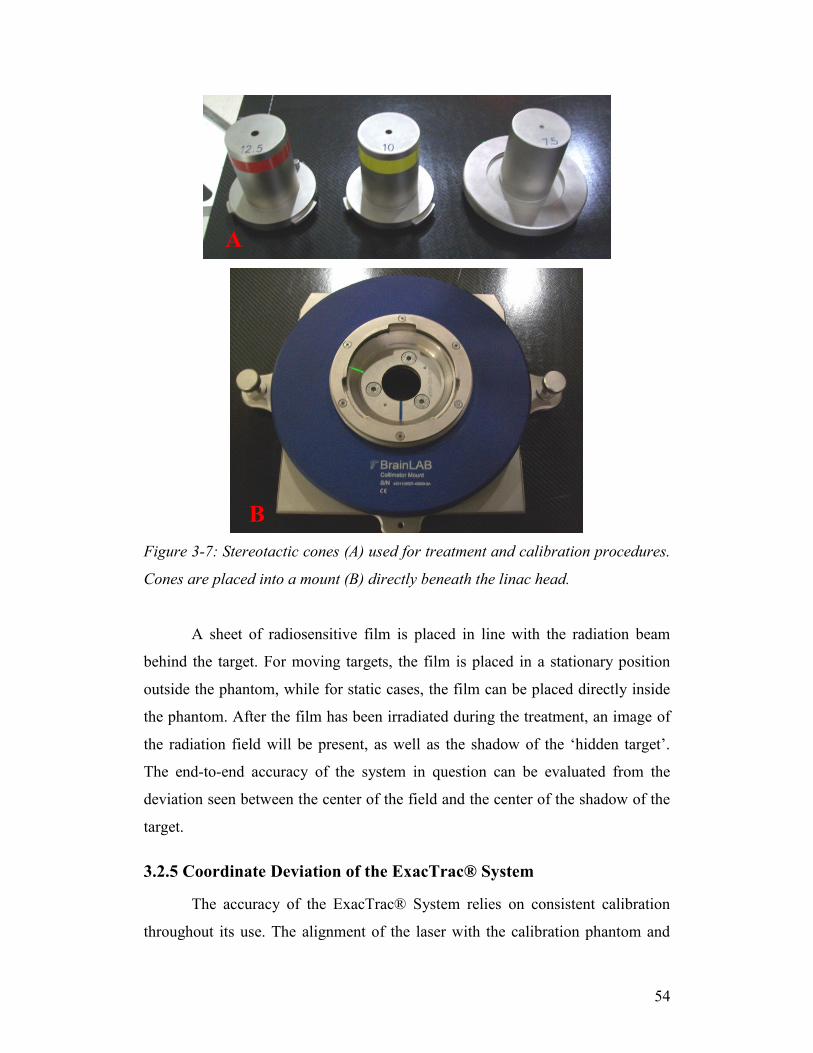
Figure 3-8: X-ray image of WL pointer from Tube 1. The embedded sphere and
expected center are compared in the ExacTrac® software. .................................. 55
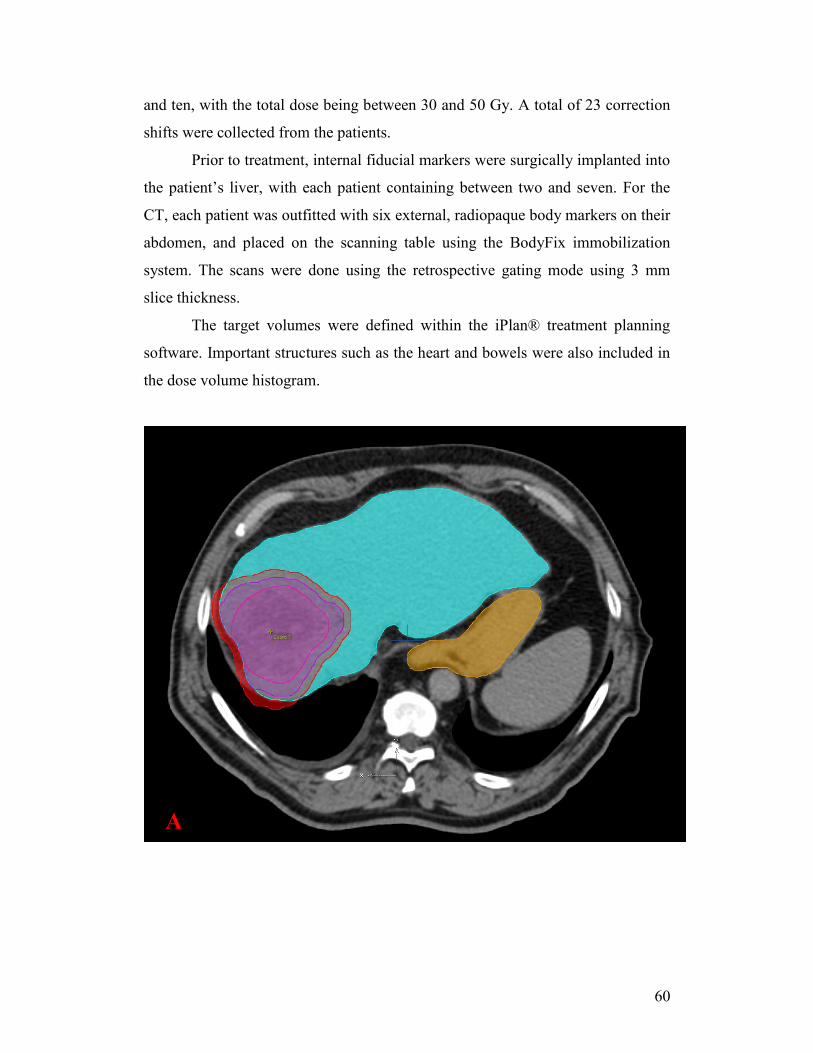
Figure 3-9: Treatment planning portion of the liver SBRT patients. Figure A
shows the contouring of the target volumes (GTV – pink, CTV – purple, PTV –
red). Figure B shows the beam configuration around the targeted area, as well as
the heart (orange), small bowel (yellow), and the healthy liver (blue). ................ 61
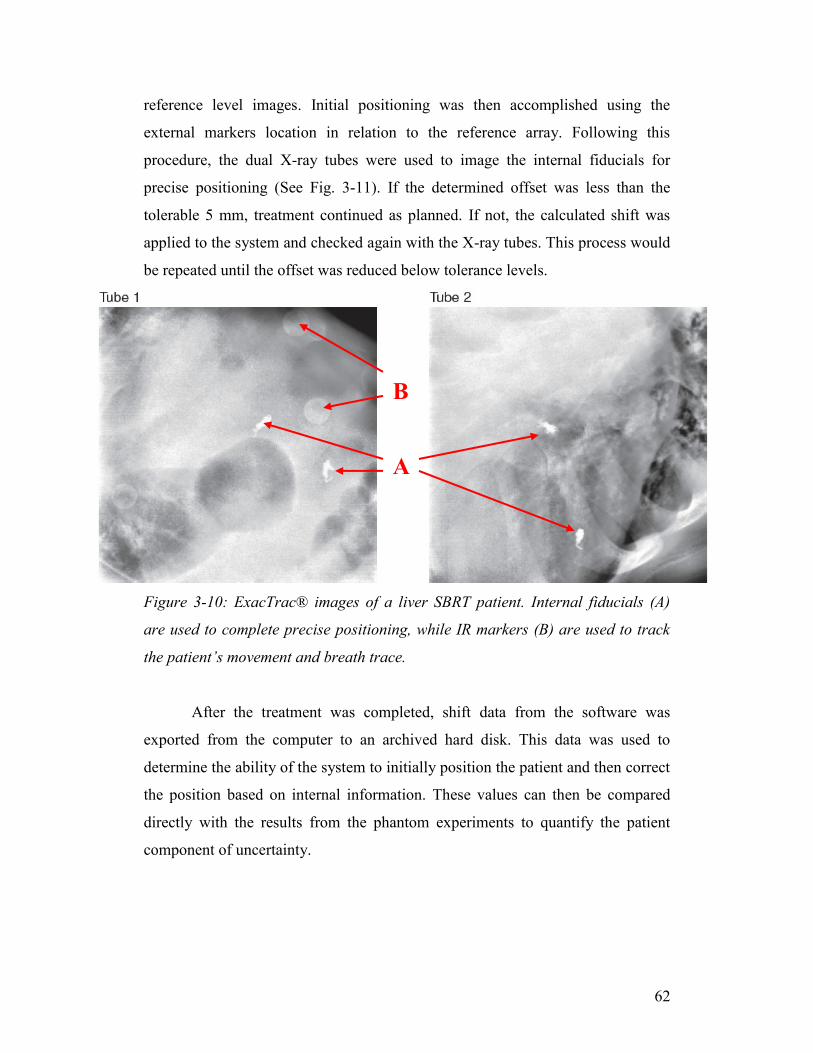
Figure 3-10: ExacTrac® images of a liver SBRT patient. Internal fiducials (A) are
used to complete precise positioning, while IR markers (B) are used to track the
patient’s movement and breath trace. ................................................................... 62
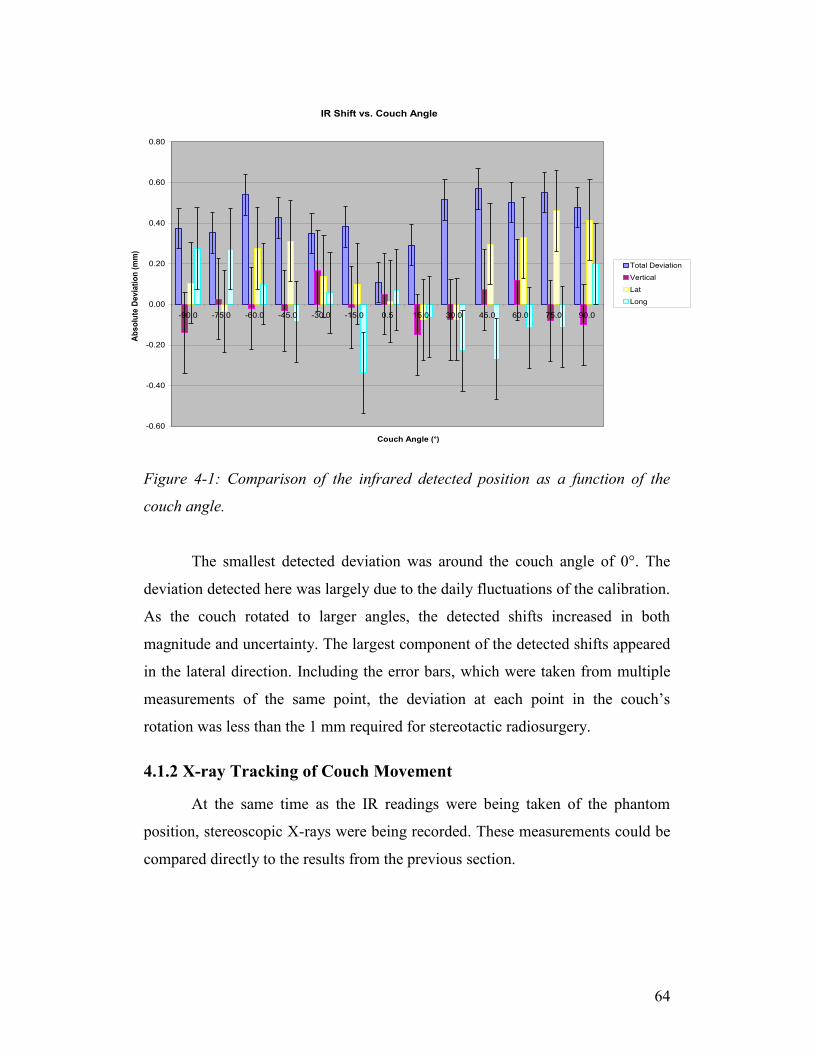
Figure 4-1: Comparison of the infrared detected position as a function of the
couch angle. .......................................................................................................... 64
Figure 4-2: Comparison of total deviation detected by the two image fusion
methods. The blue points represent the internal marker fusion, while the pink
shows the bony fusion method. ............................................................................. 65
Figure 4-3: Scatter plot for the daily Winston-Lutz film exposures during the
month of October 2010. The blue points represent a couch position of 0°, and
multiple gantry angles. The red points represent a gantry angle of 0° and couch
angles of 45° and 315°. ......................................................................................... 66
Figure 4-4: Scatter plot of the daily Winston-Lutz exposures for the month of
October 2010. The points have been organized by the measured deviation at the
individual couch or gantry angles and rotated into the couch’s frame of reference.
............................................................................................................................... 67
Figure 4-5: Comparison of Internal Marker, Bony Automatic, and Manual fusion
methods available on the ExacTrac® software..................................................... 69
x
Figure 4-6: Comparison of the Internal Marker, Bony Automatic, and Manual
fusion methods using a separate calibration of the ExacTrac® system. ............... 70
Figure 4-7: Plot showing the total detected offset from planning position on a
static anthropomorphic phantom. The pink shows the results of the bony fusion,
while the blue shows the results of the internal marker. ....................................... 73
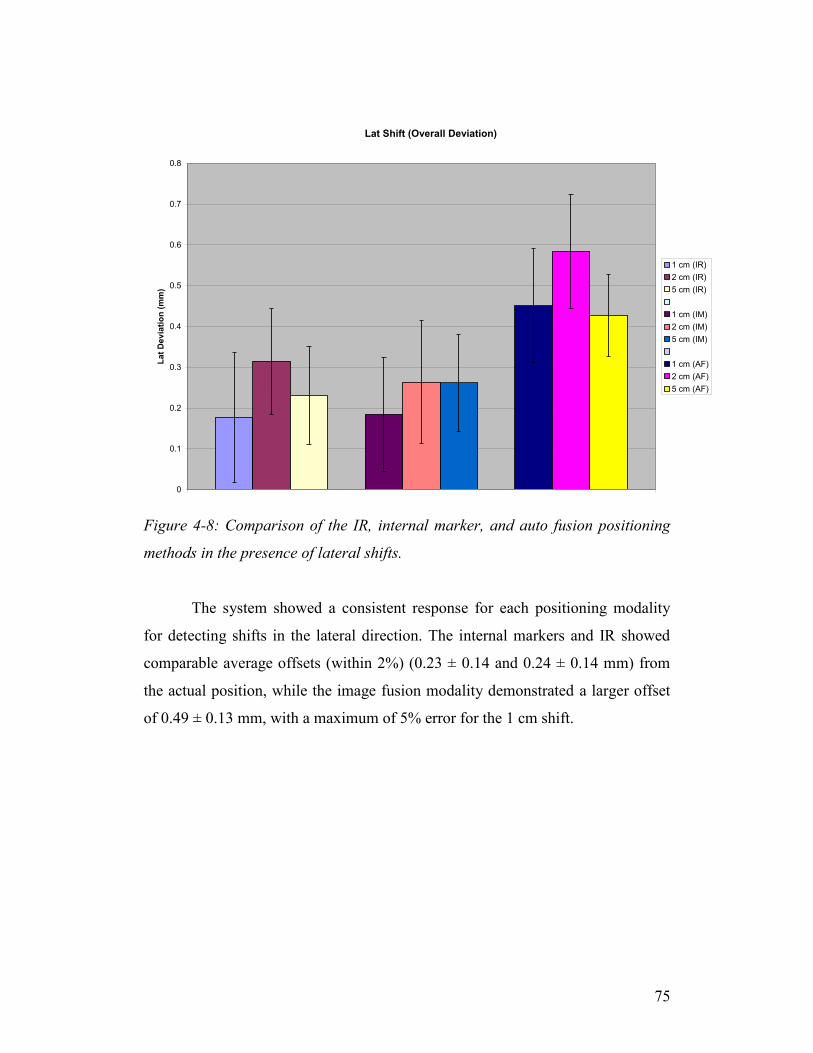
Figure 4-8: Comparison of the IR, internal marker, and auto fusion positioning
methods in the presence of lateral shifts. .............................................................. 75
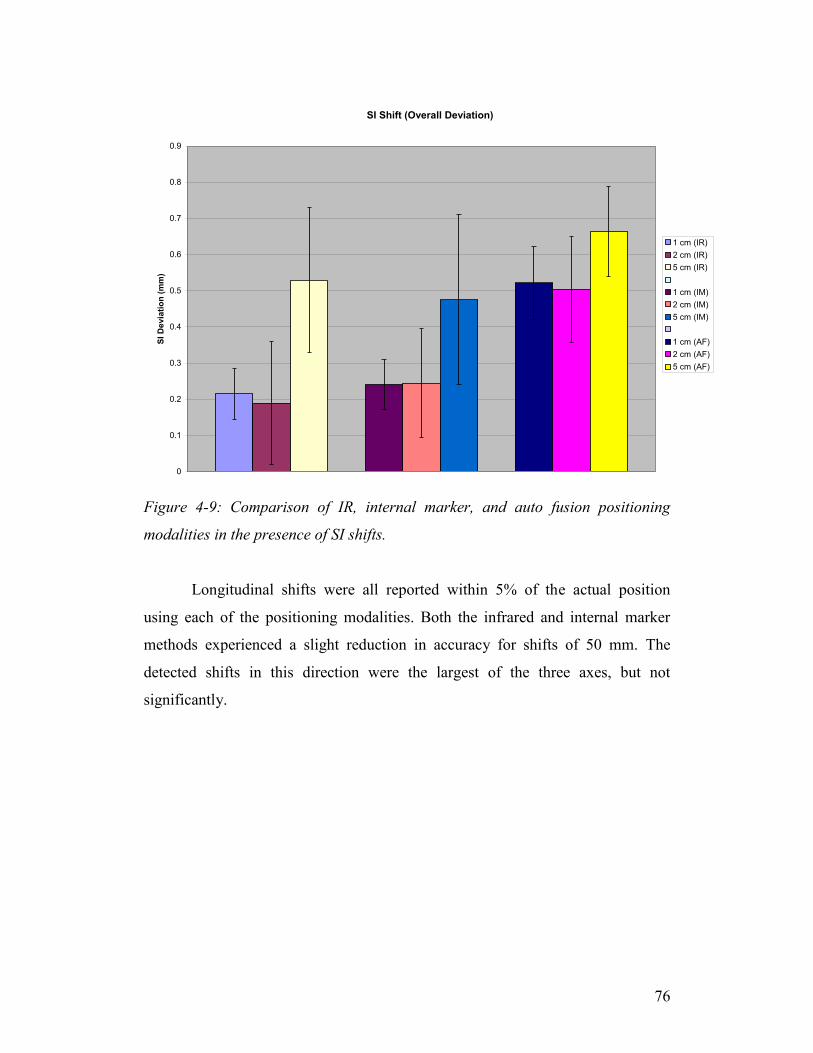
Figure 4-9: Comparison of IR, internal marker, and auto fusion positioning
modalities in the presence of SI shifts. ................................................................. 76
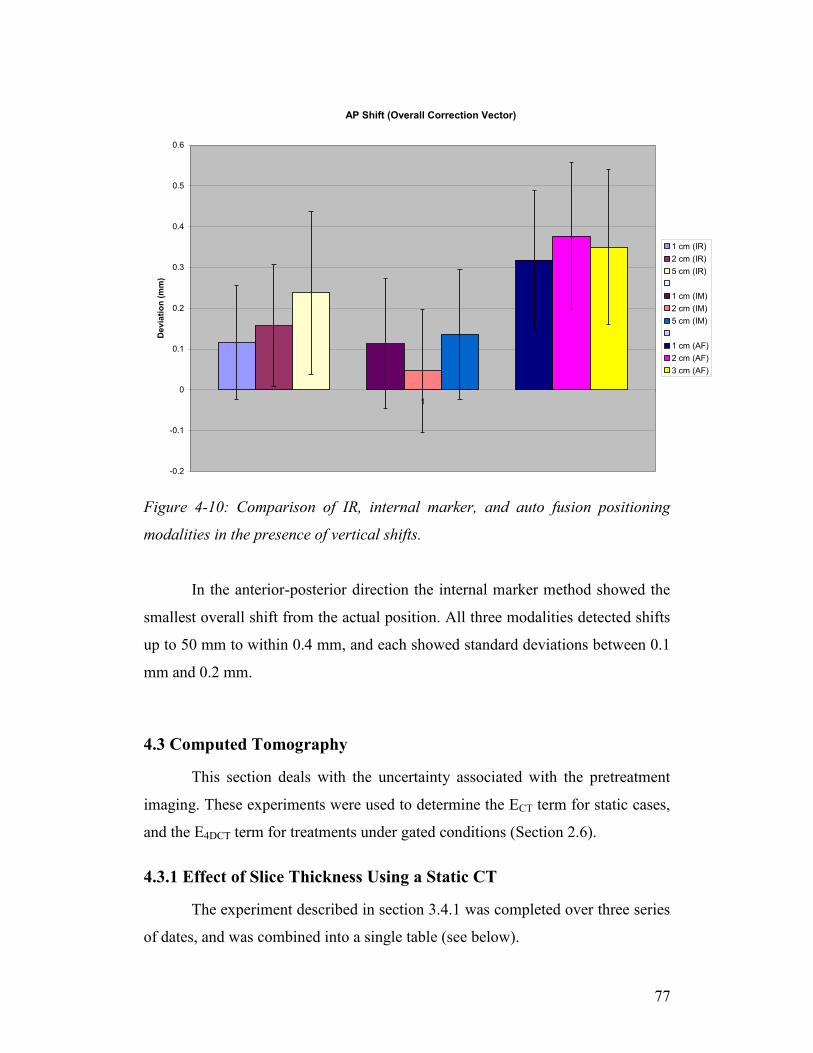
Figure 4-10: Comparison of IR, internal marker, and auto fusion positioning
modalities in the presence of vertical shifts. ......................................................... 77
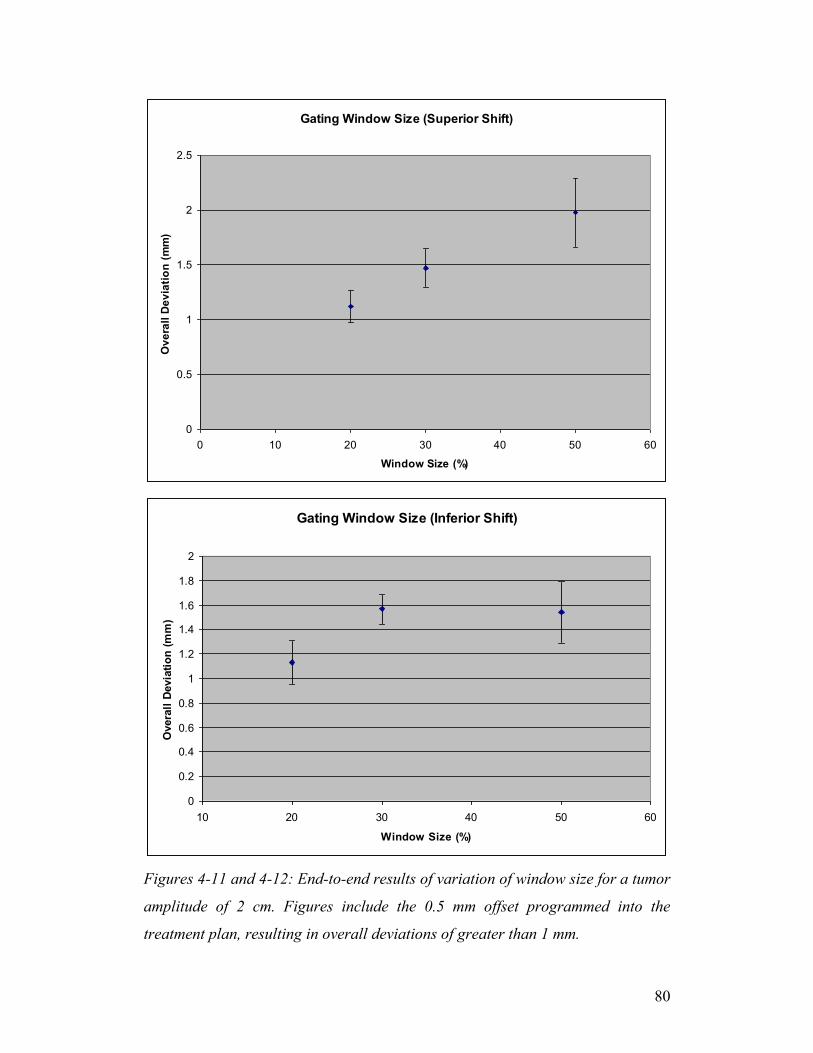
Figures 4-11 and 4-12: End-to-end results of variation of window size for a tumor
amplitude of 2 cm. Figures include the 0.5 mm offset programmed into the
treatment plan, resulting in overall deviations of greater than 1 mm. .................. 80
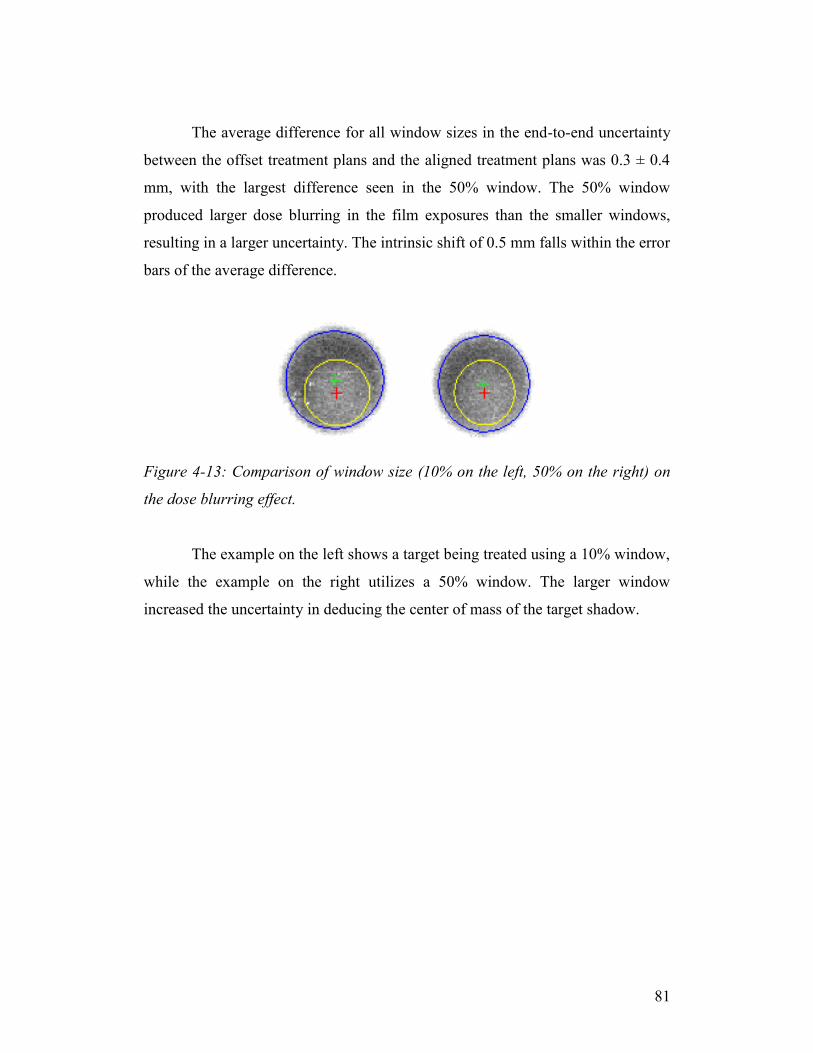
Figure 4-13: Comparison of window size (10% on the left, 50% on the right) on
the dose blurring effect. ........................................................................................ 81
Figure 4-14: Overall plot of comparison of gating window sizes for a tumor
amplitude of 2 cm. ................................................................................................ 82
Figure 4-15: Plot showing the relative offset of the hidden target as a function of
tumor amplitude. ................................................................................................... 83
Figure 4-16: Comparison of dose profiles for a target moving over a 5-second
breath cycle. .......................................................................................................... 85
Figure 4-17: Two patient positioning X-rays of the same patient on different
treatment days. A well contrasted image (A) shows the implanted markers clearly
on a background of the patient anatomy. An improperly warmed up X-ray tube
(B) can result in a salt-and-pepper images that can cause difficulty in localizing
the implanted markers. .......................................................................................... 88
Figure 4-18: Two patient positioning X-rays of same patient on different
treatment days, showing effect of beam energy. Correctly chosen beam
parameters (kV, ms, mA) will result in a contrasted image, where implanted
markers can be detected easily (A). Improperly selected parameters can result in
an oversaturated image, where markers are not readily visible against the anatomy
of the patient. ........................................................................................................ 88
xi
List of Tables
Table 2-1: Relationship between the confidence interval, and the confidence level.
............................................................................................................................... 27
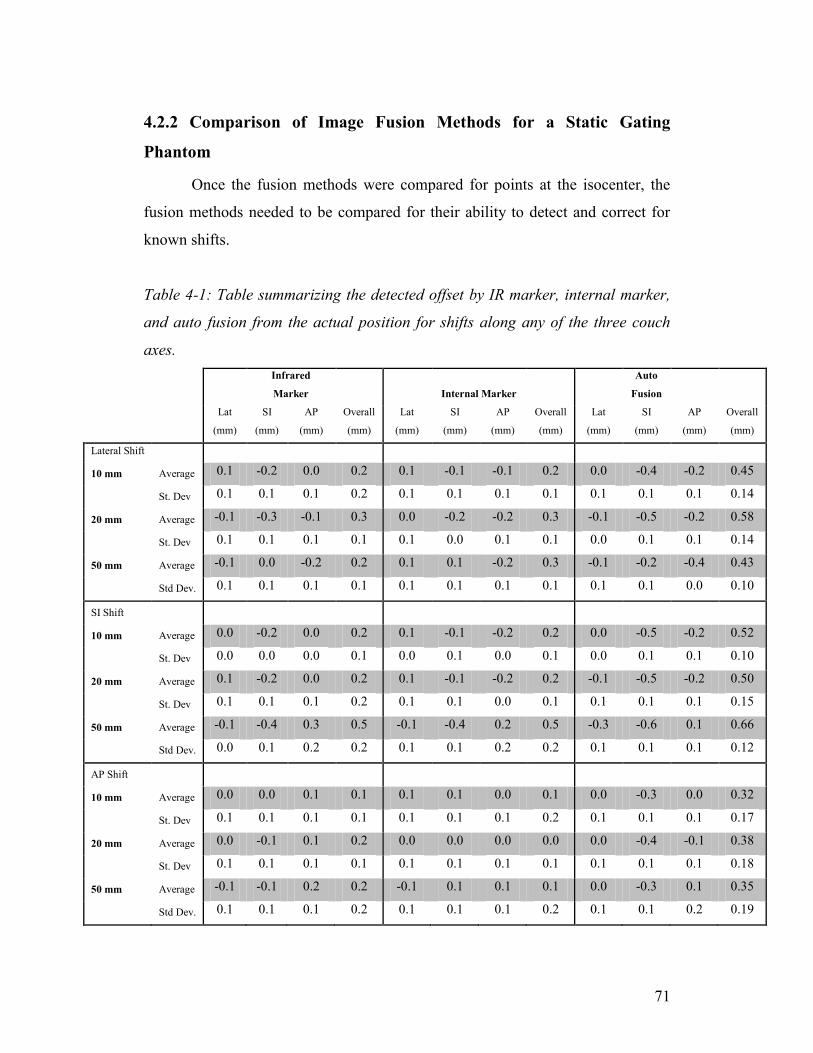
Table 4-1: Table summarizing the detected offset by IR marker, internal marker,
and auto fusion from the actual position for shifts along any of the three couch
axes. ...................................................................................................................... 71
Table 4-2: Summary of the anthropomorphic phantom’s average deviations from
its actual position based on magnitude of the shift from planned isocenter. ........ 74
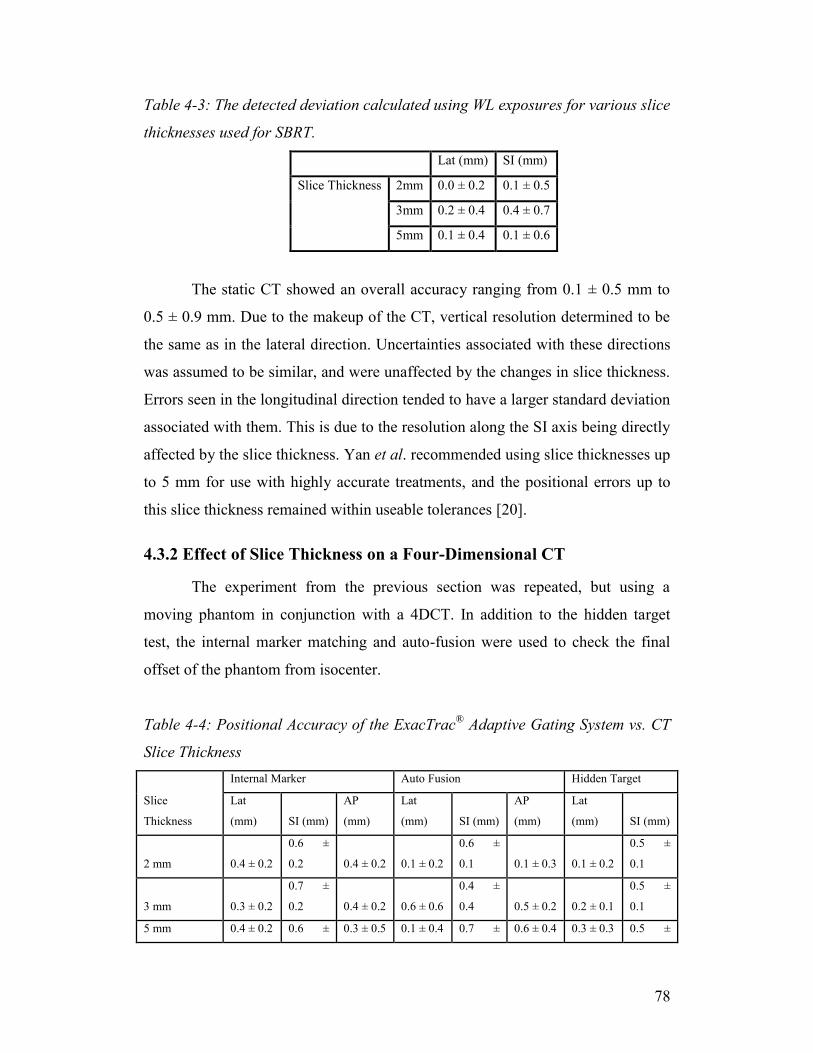
Table 4-3: The detected deviation calculated using WL exposures for various slice
thicknesses used for SBRT. .................................................................................. 78
Table 4-4: Positional Accuracy of the ExacTrac® Adaptive Gating System vs. CT
Slice Thickness ..................................................................................................... 78
Table 4-5: Positional Accuracy of the ExacTrac® Adaptive Gating System vs.
Gating Parameters ................................................................................................. 84
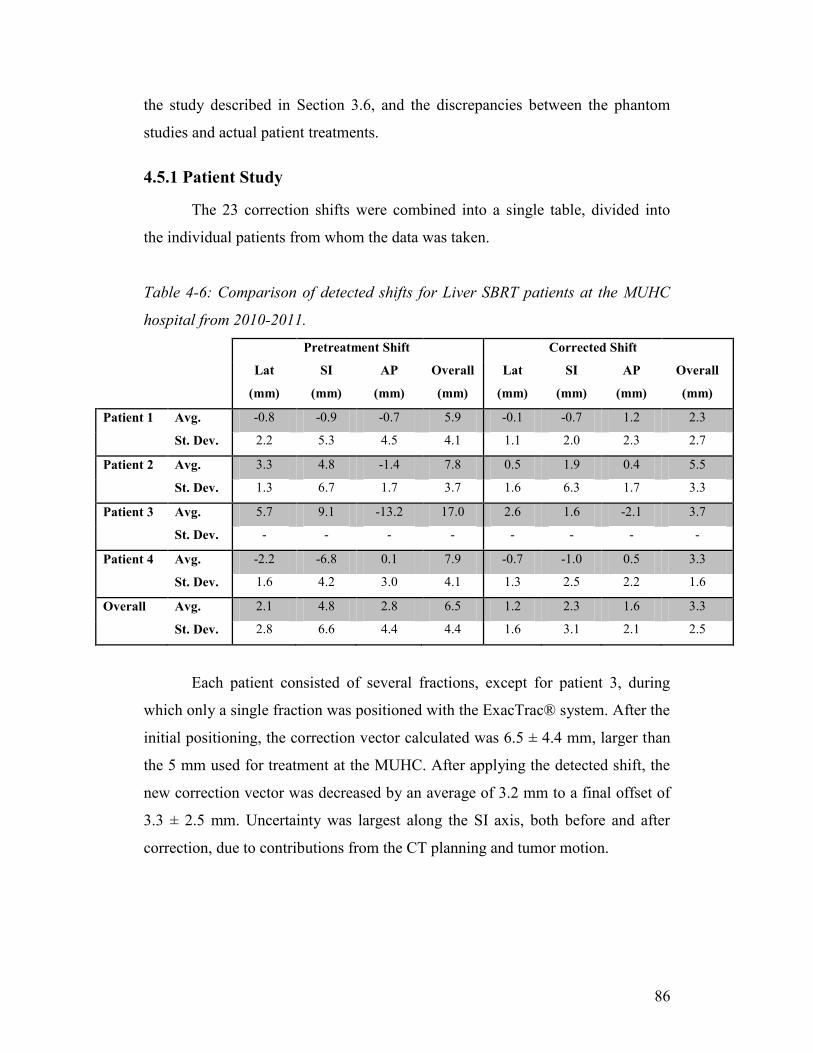
Table 4-6: Comparison of detected shifts for Liver SBRT patients at the MUHC
hospital from 2010-2011. ...................................................................................... 86
1
Chapter 1
Introduction
The Canadian Cancer Society estimates in 2010 that 76,200 deaths will
occur due to cancers, as well as approximately 173,800 new cases. Based on
current rates, 40% of Canadian women and 45% of Canadian men will develop
cancer at some point in their lifetime, of which an estimated one out of four is
expected to die [1]. Cancer treatments typically include chemotherapy, radiation
therapy (RT), or surgery, and the method of choice will vary based on the location
and type of cancer.
External beam radiation therapy deals with energy deposited within a patient
originating from a radiation source that is located outside the patient. When
delivering the prescribed dose to a localized lesion which is defined in a three-
dimensional (3D) plane, the technique is referred to as external beam stereotactic
irradiation.
1.1 Stereotactic Radiosurgery and Radiotherapy
Stereotactic techniques in radiation therapy require the precise location of the
target to be treated within the body in a 3D coordinate system, and can be further
categorized by dose fractionation; either the total dose is delivered in a single
fraction, stereotactic radiosurgery (SRS), or over the course of multiple fractions,
referred to as stereotactic radiotherapy (SRT). Due to the nature of SRS, patients
must be immobilized with invasive frames, whereas in SRT, non-invasive setups
are preferred. These setups can vary greatly in variety, but the goal of properly
imaging, planning, and treating a patient’s maladies remains the same.
1.1.1 History
SRS first came about in the late 1940’s as an attempt by Lars Leksell to
treat localized areas in the brain using 200 kVp x-rays [2]. He defined the
2
technique as a single high dose of radiation, stereotactically directed to an
intracranial region of interest. Over the next decade it became possible to use
more penetrating beams to better deliver the high dose required for treatments.
Initially proton beams produced in a cyclotron were used, and in 1968 Leksell
released a paper describing the use of focused Cobalt-60 gamma rays for a
thalamotomy [3]. Stereotactic radiosurgery has since expanded from the use of the
original orthovoltage x-rays to specialized treatment equipment including the
GammaKnife®, CyberKnife®, TomoTherapy® machines, and linear accelerators.
The GammaKnife® uses 201 cobalt-60 sources arranged in a circular array above
a patients head. The sources can be individually directed to target lesions in a
patient’s brain. The CyberKnife® uses a 6 MV linac mounted on a robotic arm,
which can be maneuvered in three-dimensions about the treatment site.
TomoTherapy® accomplishes stereotactic treatments by using a rotating radiation
source about the target area, and treating the patient in millimeter sized slices.
Particularly relevant to this thesis, linear accelerators can accomplish stereotactic
treatments by utilizing the rotation of the gantry head in conjunction with the
treatment couch.
Stemming from the SRS techniques, stereotactic body radiation therapy
(SBRT) is a relatively recent innovation in radiotherapy that is effective in
controlling oligometastatic cancers in extracranial locations, such as the
abdominal and thoracic cavities, as well as spinal and paraspinal locations. SBRT
treatments began in the early 1990’s, with the first clinical patient results being
published in 1995 [4]. Up until 2003, studies were concerned primarily with lung
and liver tumors, when the first presentation of spinal lesion patients was
published [5].
As opposed to typical radiation therapy treatments, which will deliver up
to 3 Gy per fraction, for anywhere between 10-30 fractions, SBRT attempts to
deliver a larger dose over a shorter period of time. Normal treatments will require
6-30 Gy per fraction over the course of 1-5 fractions. Due to the nature of SBRT
requiring a fewer number of fractions, treatment accuracy must be carefully
monitored to take into account the organ motion.
3
1.1.2 General SRS Requirements
According to AAPM Report No. 54 [6], the basic requirements for SRS
are accurate localization, mechanical precision, accurate and optimal dose
distribution, and patient safety. The accurate localization requires that the
stereotactic system be able to determine the coordinates of a well-defined object
within a framed coordinate system to within 1 mm for angiography and 2 mm for
CT and MRI. A pointer or ball bearing is commonly used as the target object
during the localization procedure.
The element of mechanical precision relies on the alignment of the frame-
based coordinate system with the coordinate system of the treatment linac. The
isocenter of the couch, gantry and collimator need to coincide within a 1 mm
radius sphere for all possible angles.
1.2 General SBRT Concepts and Process
SBRT treatment setup accuracy requirements are equivalent to those of
SRS, but also entails a strictly enforced maintenance of high spatial targeting
accuracy for the entire treatment, through the use of immobilization and patient
position monitoring. SBRT also requires the highest need for respiratory motion
management as well as redundancy in geometric verification [7]. Treatments are
typically applied using one of two approaches: treatments which irradiate during
the entire breathing cycle (see Fig. 1-1A), over the entire internal target volume
(ITV) plus a setup margin, or gated treatments (see Fig. 1-1B), which limit the
irradiation of the target to a certain area of the breath cycle.
4
Figure 1-1: ITV treatment (A) versus gated treatment (B) including a setup
margin. The red area denotes the treatment field.
While ITV treatments are more common due to less planning and
treatment complications, gated treatments are becoming more available to treat
mobile tumors.
1.2.1 Organ Motion
In addition to internal organ and tissue motion, the target can also change
shape and size. These changes will happen during a single fraction (intra-
fractional) and over the entire course of treatment (inter-fractional) [8].
Respiratory effects in particular will be discussed in Section 2.4.1.
Both intra- and inter-fractional motion can have an adverse effect on the
treatment. The issues can involve:
(1) The imaging modality on which the treatment plan is based will be less than
accurate, and give a false representation of the anatomy.
(2) A larger field could be needed than the size of the tumor and its microscopic
extensions would seem to require, causing more healthy tissue to become
irradiated.
(3) Fields may be designed too small if the extent of the tumor motion is not fully
recognized, leading to underdosing of the target [8].
A B
5
The patient’s internal anatomy, specifically the target volume, will move
and change volume throughout the treatment, as well as over the course of the
entire treatment. The extent of this motion varies greatly based on the location of
the lesion [9], but can be as large as 50 mm in lung [10] and liver [11] cases. This
motion occurs primarily in the SI direction for abdominal tumors, with movement
along the other axes being less than 2 mm [12].
Because invasive immobilization is not an option, frameless setups are
becoming more common, and treatment setups and imaging are fast being
improved to accommodate the need for specialized treatments such as SBRT and
gated treatments. These improvements include four-dimensional computed
tomography (4DCT) and image guided radiation therapy (IGRT), which will be
discussed later this chapter.
1.2.2 Dose Prescription and Fractionation
According to the report of AAPM Task Group 101, when prescribing
dose, two conditions are considered [7]:
(1) A limited volume, containing the gross tumor and its close vicinity, is targeted
for treatment through exposure to a very high dose per fraction, and hotspots
within the target are often deemed to be acceptable [7, 13].
(2) The volume of normal tissue receiving high doses outside the target volume
should be minimized to limit the risk of treatment toxicity. Thus, the gradient
describing the dose fall-off outside the target should be sharp [7].
Following these conditions, dose prescriptions are often given at low
isodoses (for example 80% isodose) with small margins for beam penumbra at the
target edge. This is done in order to improve the dose fall-off and improve normal
tissue sparing [7]. This will also increase dose heterogeneity inside the target,
which has been surmised to be beneficial in eliminating radioresistant hypoxic
cells [14].
1.2.3 Clinical SBRT Process at the MUHC
In 2007, McGill University Health Centre began treating patients using
stereotactic body radiation therapy. The addition of the Novalis TX radiosurgery
6
system in 2010 has added many options for improvements in the treatment of
these patients.
While the array of treatment plans and tumor locations may vary, the
clinical process remains much the same for each different case. This section will
cover the daily quality assurance and calibration, the implantation of internal
fiducial markers, the patient immobilization, the four-dimensional planning
computed tomography scan, the treatment planning, the final patient positioning,
and the treatment delivery.
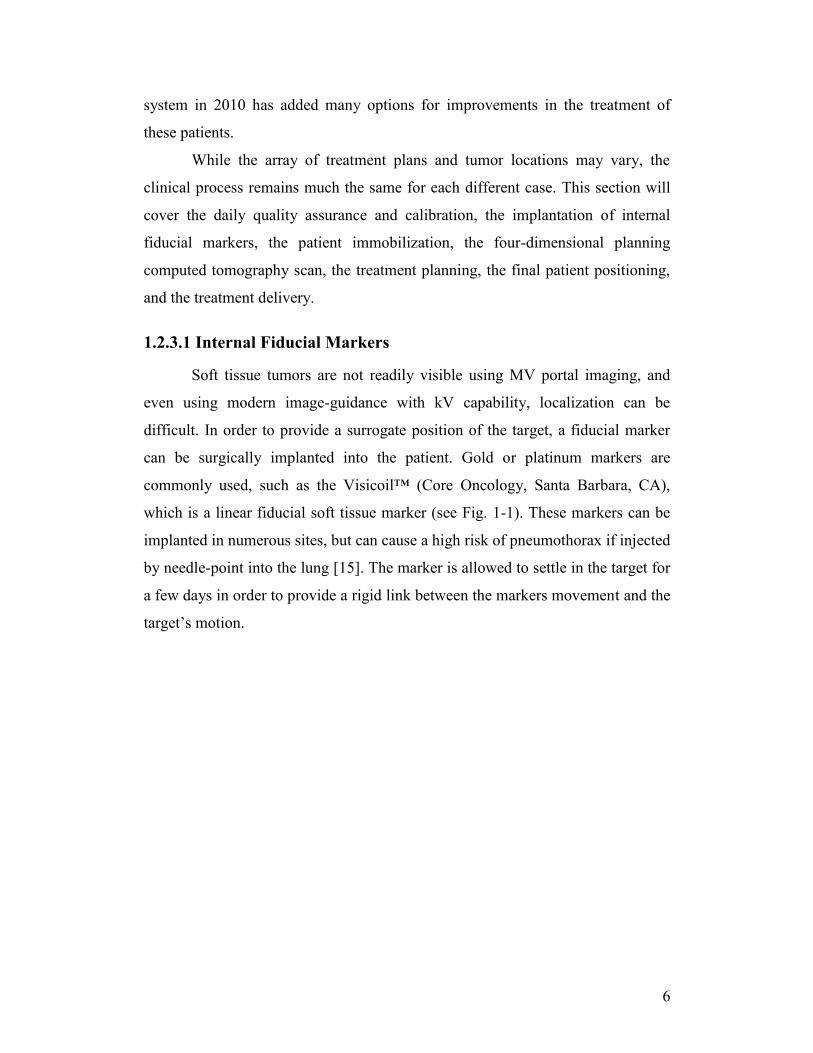
1.2.3.1 Internal Fiducial Markers
Soft tissue tumors are not readily visible using MV portal imaging, and
even using modern image-guidance with kV capability, localization can be
difficult. In order to provide a surrogate position of the target, a fiducial marker
can be surgically implanted into the patient. Gold or platinum markers are
commonly used, such as the Visicoil™ (Core Oncology, Santa Barbara, CA),
which is a linear fiducial soft tissue marker (see Fig. 1-1). These markers can be
implanted in numerous sites, but can cause a high risk of pneumothorax if injected
by needle-point into the lung [15]. The marker is allowed to settle in the target for
a few days in order to provide a rigid link between the markers movement and the
target’s motion.
7
Figure 1-1: Two implanted fiducials for a liver SBRT patient. The fiducials are
chosen to give high contrast on an X-ray of the patient.
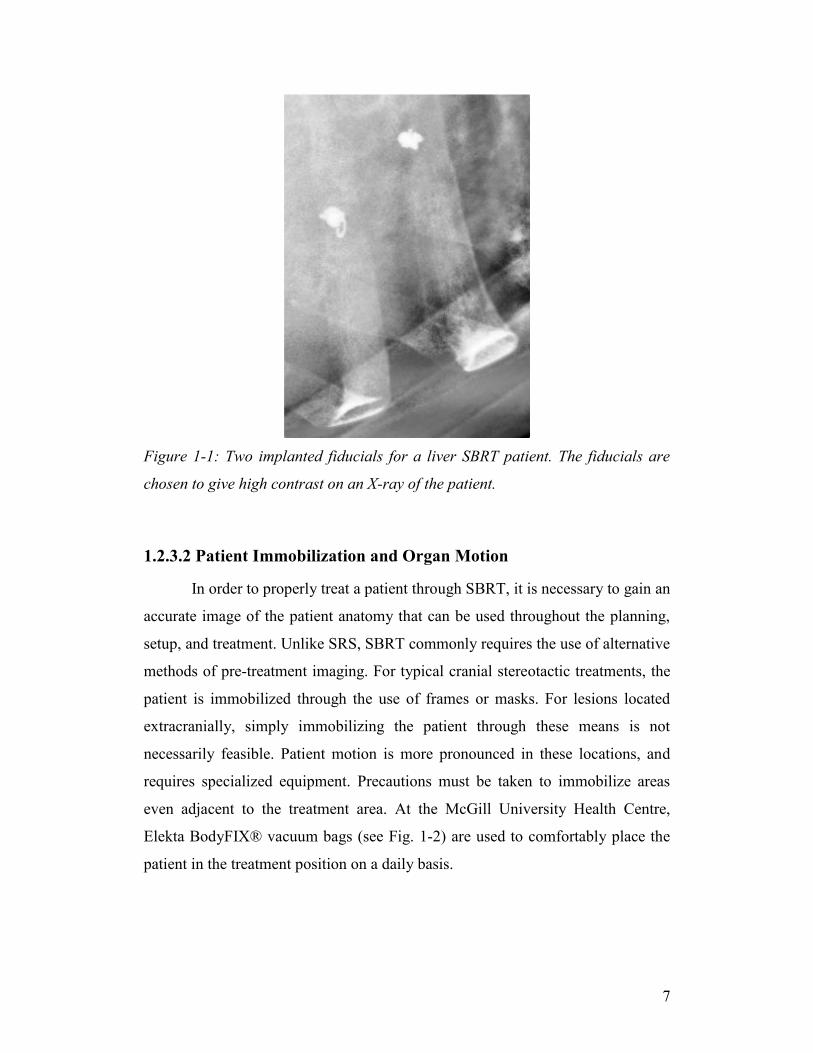
1.2.3.2 Patient Immobilization and Organ Motion
In order to properly treat a patient through SBRT, it is necessary to gain an
accurate image of the patient anatomy that can be used throughout the planning,
setup, and treatment. Unlike SRS, SBRT commonly requires the use of alternative
methods of pre-treatment imaging. For typical cranial stereotactic treatments, the
patient is immobilized through the use of frames or masks. For lesions located
extracranially, simply immobilizing the patient through these means is not
necessarily feasible. Patient motion is more pronounced in these locations, and
requires specialized equipment. Precautions must be taken to immobilize areas
even adjacent to the treatment area. At the McGill University Health Centre,
Elekta BodyFIX® vacuum bags (see Fig. 1-2) are used to comfortably place the
patient in the treatment position on a daily basis.
8
Figure 1-2: Vacuum bag used for placing patient in a reproducible position on
both the planning CT and the treatment couch.
Other immobilization options can include compression plates or
respiratory belts that attempt to restrict the patient’s maximum breath intake,
thereby minimizing target shifts.
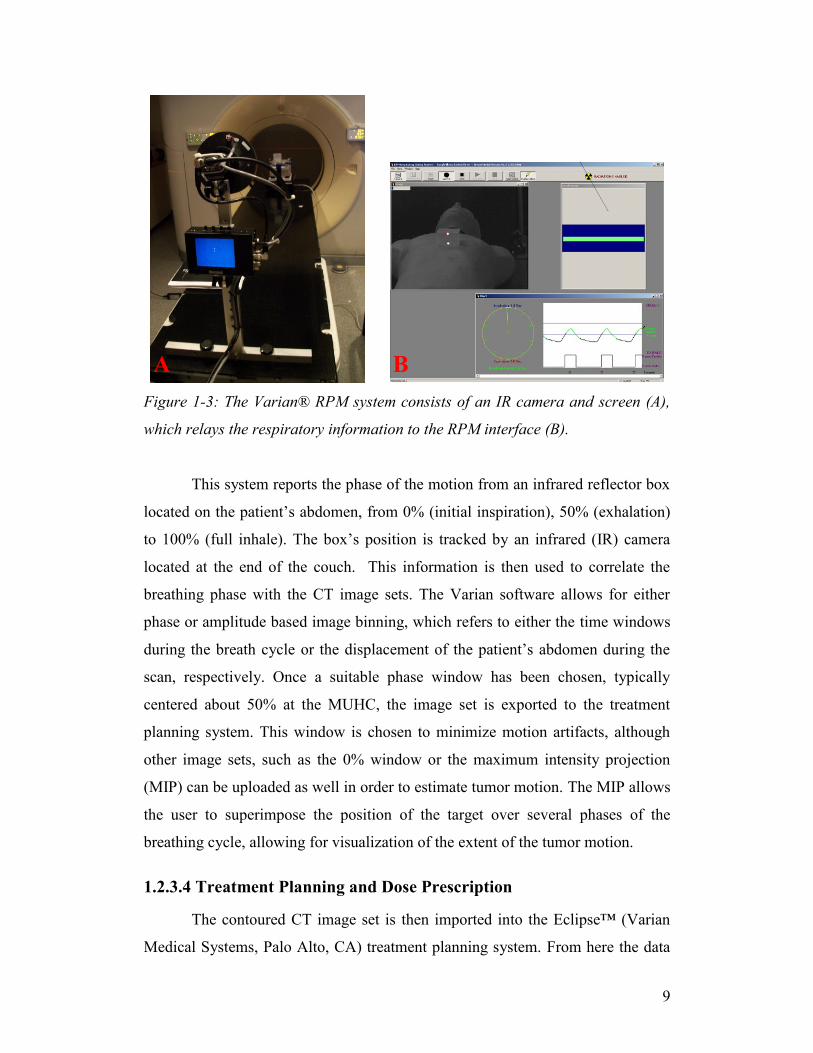
1.2.3.3 Four-Dimensional Computed Tomography Scan
With the use of respiratory gating treatments, 4DCT or respiration-
correlated CT has become the most widely used method and is the current method
of gaining a planning image set at the MUHC. This method oversamples at each
couch position to gain multiple images for each slice. The correlation between
each of the image sets and the corresponding respiratory phase is determined
using an external tracking system, such as the Varian® Real-time Positioning
Management (RPM) System (Varian Medical Systems, Palo Alto, CA) (see Fig.
1-3).
9
Figure 1-3: The Varian® RPM system consists of an IR camera and screen (A),
which relays the respiratory information to the RPM interface (B).
This system reports the phase of the motion from an infrared reflector box
located on the patient’s abdomen, from 0% (initial inspiration), 50% (exhalation)
to 100% (full inhale). The box’s position is tracked by an infrared (IR) camera
located at the end of the couch. This information is then used to correlate the
breathing phase with the CT image sets. The Varian software allows for either
phase or amplitude based image binning, which refers to either the time windows
during the breath cycle or the displacement of the patient’s abdomen during the
scan, respectively. Once a suitable phase window has been chosen, typically
centered about 50% at the MUHC, the image set is exported to the treatment
planning system. This window is chosen to minimize motion artifacts, although
other image sets, such as the 0% window or the maximum intensity projection
(MIP) can be uploaded as well in order to estimate tumor motion. The MIP allows
the user to superimpose the position of the target over several phases of the
breathing cycle, allowing for visualization of the extent of the tumor motion.
1.2.3.4 Treatment Planning and Dose Prescription
The contoured CT image set is then imported into the Eclipse™ (Varian
Medical Systems, Palo Alto, CA) treatment planning system. From here the data
A B
10
can be imported into the BrainLAB iPlan® RT Treatment Planning Software
(BrainLAB AG, Feldkirchen, Germany) in the Digital Imaging and
Communications in Medicine (DICOM) formatting. Once the import wizard has
begun, the user can select which image series they would like to use, depending
on the type of treatment modality. This is where the user would choose to use the
gated images or MIP for planning.
The images are then viewed and confirmed to be suitable, after which
localization can be started. The localization defines a set of markers used to
determine a frame of reference for the image set. This can be done using either the
CT body markers or a localization box for the case of cranial lesions. A physician
is then placed in charge of contouring the treatment target and the relevant critical
structures.
Beam configurations, conformal shapes, prescribed dose, and all other
treatment parameters are then selected before the plan can be approved by a
medical physicist and a physician. Five to ten nonoverlapping beams are generally
required to provide the high dose gradient required for SBRT. In addition to being
exported to the treatment delivery system, image sets need to be loaded into the
ExacTrac® computer for patient positioning purposes.
1.2.3.5 Patient Positioning
The patient is positioned on the treatment table using the immobilization
device, similarly to the planning step. IR markers are placed on the patient’s chest
or abdomen to track the patient’s movement and respiration pattern. An IR
reference star (see Fig. 1-4) is attached to the couch to provide a reference frame
for the moving IR markers on the patient’s chest. Using these markers the patient
is roughly positioned at the treatment isocenter using a weighted marker
algorithm, which will be described in Chapter 2. Orthogonal x-ray tubes located
in the floor of the treatment room are then used to image the internal anatomy of
the patient.
11
Figure 1-4: The reference star is attached to the side of the couch, allowing the
system to track the relative motion of the patient.
These images are compared to digitally reconstructed radiographs (DRRs)
of the patient from the planning CT. For the case of gated procedures, which will
be discussed in detail in Section 2.4, internal markers are used to determine the
offset of the patient from the planned position. This shift is then applied by the
system and checked by the therapists.
1.2.3.6 Treatment Delivery
At the MUHC, SBRT treatments can be delivered on the Novalis TX™
linac (Varian Medical System, Palo Alto, CA). The 6MV linac is equipped with a
2.5 mm HD120 high-definition multi-leaf collimator (MLC). Once the patient is
in the correct treatment position, the physician will chose a reference level in the
patient’s breath trace and an amplitude-based window around which irradiation
will occur. This will typically be chosen at the maximum inhale or exhale phase
12
to minimize residual tumor motion. Additional imaging levels will generally be
chosen to confirm that the internal markers stay within tolerances throughout the
treatment for the entirety of the gating window. The gating window is chosen by
the physician, but is not necessarily patient specific [16]. The ExacTrac®
computer provides a beam hold interlock to the treatment computer when the
patient is breathing outside the chosen window. This ensures the irradiation only
occurs when the target is in the proper position. Because this limits the beam on
time, SBRT sessions can take upwards of 60 minutes, depending on the treatment
and the patient’s respiration. Throughout each fraction of the patient’s treatment,
this process is repeated.
1.2.3.7 Image Guidance
Image guided radiation therapy can be defined as the use of imaging to
plan and initiate radiotherapy treatments. Image guidance originated with the use
of planar and volumetric X-ray imaging, which were used for diagnostic and
planning purposes. The modalities have since expanded to include the use of
megavoltage (MV) portal images, as well as kilovoltage (kV) imaging which can
be used to align the patient with the treatment machine at the beginning of each
fraction [17]. The Novalis TX™ at the MUHC is equipped with image guidance
in the form of both the ExacTrac® IGRT system, and an on-board imager, which
allows combined MV and kV imaging and cone-beam CT scans. Both systems
can be used for patient setup and pretreatment target localization and to check for
intra-fractional target movement. At the MUHC, the ExacTrac® system is
currently used to position and monitor the patient before and during gated SBRT
treatments.
1.2.3.8 Daily Quality Assurance and Calibration
Each morning, several parameters need to be checked on the treatment
machine to confirm that the system will perform within suggested tolerances to
give accurate treatments. The first check performed verifies that the radiation
isocenter does not vary more than 0.7 mm from the laser isocenter. In what is
known as the Winston-Lutz (WL) test [18], a ball bearing attached to the end of
13
the treatment couch is placed by a therapist at the crosshairs of the room lasers. A
piece of radiochromic film is placed behind the bearing, and attached to the linac
head via a mounting arm. This film is then irradiated with 600 MU at a
combination of gantry head angles (0°, 90°, 180°, 270°) and couch angles (0°,
45°, 135°).
Figure 1-5: Setup for WL test done during machine calibrations. The ball bearing
is mounted to the end of the couch, and a piece of radiochromic film is mounted to
the linac head using a clamp behind the bearing in line with the treatment beam.
If the bearing has not drifted outside of the treatment field at any of these
positions, the WL pointer is then used to confirm that the external stereoscopic X-
ray system is also properly lined up with the rest of the system. An infrared
coordinate system is then established by placing an IR calibration phantom on the
couch in line with the room lasers. Another calibration phantom is placed on the
couch and autopositioned at the calculated isocenter using the IR camera. This
phantom is then imaged using X-rays, checking the IR coordinate system.
1.3 Uncertainty Tests: A Literature Review
The documentation of the Novalis Treatment system has been covered in
detail in many papers, each covering a different aspect of the system. Studies
concerned with the positioning accuracy use different methods of comparison,
14
using different components on the machine to self-check. A popular method of
quantifying positional uncertainties to give an overall end-to-end value is known
as the hidden target test.
The hidden target test uses a marker placed within a phantom at a known
stereotactic location. A radiation detector, typically a sheet of radiosensitive film,
is placed in line with the linac head and the target. A single field is used to
irradiate the target for any given direction, which will also irradiate the film
behind. The field is chosen to be large enough to show a positional shift of the
target from the center of the field, while keeping the target within the boundaries.
The treatment will result in a shadow of the target in the middle of the field on the
film. For a perfectly positioned target, the shadow will lie directly in the center of
the film, whereas any deviations can be detected through a two-dimensional
vector shift of the centers of the field and target.
1.3.1 Phantom Studies
The overall static accuracy of the ExacTrac® system has been evaluated
by several groups, with results depending on the parameters used in the tests. The
validation of the original version of the ExacTrac® system, which used separate
IR cameras (Qualisys) requiring clinical calibration, was described by two groups.
Verellen et al. [19] studied the IR and stereoscopic X-ray imaging systems in
2003. The group looked at the effects of different deviations in the presence of
shifts and rotations using internal markers and DRR fusion. The overall
uncertainty was determined relative to the accuracy of the IR positioning markers,
and was found to give a three-dimensional vector shift of 0.41 ± 0.92 mm and
0.28 ± 0.36 using the bony anatomy and internal marker as fusion methods,
respectively. Yan et al. [20] detailed the agreement of deviations determined by
the IR cameras and those calculated though the use of DRR/kV image fusion.
They found that the CT slice thickness was a non-negligible source of uncertainty,
with 3-D shifts of up to 1.4 ± 0.6 mm for slice thicknesses up to 5 mm, while the
image fusion methods were comparable. The couch’s frame of reference was
chosen as the absolute coordinate frame to which each component was calculated.
15
However, this study did not conduct absolute measurements comparing the
radiation isocenter and treatment isocenter, and did not include errors due to
gantry or couch rotations.
The current version of the ExacTrac® implements an upgraded IR camera
geometry (Polaris), which comes at a precalibrated distance. One of the initial
studies of this system was done in 2009 by Hayashi et al. [21]. Hayashi combined
several uncertainties, including those of the ExacTrac® coordinate deviation, the
CT slice thickness, the registration error of the verification system, the marker
detection. These uncertainties were combined in quadrature to give a total
geometric uncertainty of 1.36 ± 0.32 mm.
Takakura et al. [22] reported an overall geometric uncertainty of 0.31 ±
0.77 mm using a static anthropomorphic head and neck phantom, but evaluated
only the effects of couch accuracy, the mechanical isocenter, and the difference in
position of the mechanical isocenter with the ExacTrac® isocenter. Wurm et al
[23] determined an overall system accuracy of a static phantom using frameless
positioning to be 1.04 ± 0.47 mm, with an average translational error of 0.31 ±
0.26 mm in any given direction.
In 2011, Kim et al. [24] extended the static tests to verify localization
accuracy in an anthropomorphic pelvic phantom. The system accuracy was
checked using a pair of orthogonal portal images and was found to be 1.15 ± 0.49,
and was found to be comparable to using OBI cone-beam CT for image-guided
localization. This comparison was also studied with similar results by Ma et al.
[25] in 2009, showing a root mean square difference of less than 0.5 mm in a
static phantom.
Several of these studies have gone on to break the system uncertainty into
components, the first being the IR tracking system. Wang et al [26] first described
the feasibility of using IR markers and cameras as a tracking method. Wang
concluded that using weighted subsets from at least 5 markers, the IR detection
system is capable of accuracy better than 0.3 mm. However, using a hidden target
test, Verellen et al. [19] determined that the average deviation of the Qualisys
type camera system with respect to the treatment isocenter was 0.24 ± 0.33, 0.45
16
± 0.55, and -0.49 ± 0.59 mm in the vertical, longitudinal, and lateral directions,
respectively. Uncertainty in CT marker positioning and marker repositioning also
contribute to these results. The effect of this positioning uncertainty is relatively
unimportant, as the final position in the ExacTrac® IGRT system is determined
by the X-ray images and fusion the internal markers or bony fusion of the
corresponding DRR images.
Phantom tests of uncertainty in the bony anatomy image fusion can
depend on several factors, including the type of anatomy, CT slice thickness [20],
and the X-ray contrast [21]. Variation of these dependencies can result in
uncertainties of up to 1.3 mm [19, 20]. For SBRT, internal fiducial markers are
used for patient positioning, which allows for a direct calculation of the correction
vector. Using internal markers results in smaller translational errors and standard
deviations [19]. This method will be discussed in chapter 2.
In stereotactic radiosurgery, using the smallest slice thickness for planning
CT scans will also result in the most accurate treatment. SBRT scans are typically
done with 2 mm slice thickness for the sake of time and convenience for the
patient. Yan et al. determined that slice thicknesses between 2 and 5 mm were
suitable for SBRT treatments.
For non-static SBRT treatments, moving phantoms have been
implemented for use with the ExacTrac® Gating System. The treatments are
gated based on the simulated breathing motion of the phantom. In addition to the
sources of uncertainty for static cases, the overall geometrical accuracy of gated
treatments is primarily affected by the speed of the target, and the size of the
gating window [27, 28]. The linac latency also affects the ability of the system to
accurately target a moving tumor and is calculated during commissioning.
The shape of the patients breath trace and at what point in the cycle the
patient is being treated can also affect the accuracy of the treatment. Most patients
are modeled using either a sinusoidal breath trace, or more accurately a
parametric characterization of breathing induced organ motion [29] which will be
described in Section 2.4.1. Both models have amplitudes at which treating a
patient would be more beneficial, as the target will tend to spend more time at the
17
endpoints. By placing the gating level closer to the end exhale position when
gating can maximize the amount of time a target stays within the treatment beam
and minimize latency errors from a quickly moving target. Even for patients with
less reproducible breathing patterns, a gating level should still be chosen near the
end exhale where it will consistently be crossed by the breath trace [27].
1.3.2 Patient Studies
The accuracy of the treatments in the clinic can vary from measurements
done on phantoms, due to skin shift, patient motion, irregular breathing, and
tumor motion or shrinkage. Inter- and intra-fractional patient set-up shifts can be
more than 30 mm along any given axis, and image guidance allows these errors to
be minimized. Initial tests with the ExacTrac® Adaptive Gating System show that
the average marker positional deviation from the expected position can be
reduced to less than 4 mm using verification imaging [30].
1.4 Purpose and Organization of the Thesis
SBRT has become an emerging radiotherapy method capable of increased
tumor control for early stage primary and oligometastatic tumors in thoracic,
abdominal, spinal, and paraspinal regions. This is accomplished through the
delivery of large doses in a few fractions. The reduction in fractionation calls for a
high level of confidence in the accuracy of the treatment delivery procedure, to
ensure that healthy tissue complications are minimized.
In order to properly treat a lesion, the patient needs to be accurately
positioned in relation to the treatment isocenter before and during each fraction of
their therapy. The ExacTrac® IGRT system aims to give this confidence through
the use of intrafractional X-ray imaging, coupled with an IR tracking system.
A main purpose of this work was to simulate an extracranial treatment as
closely as possible to obtain a clinical understanding of the accuracy of the
ExacTrac® positioning system. In order to do this, a quantitative method of
determining the accuracy needed to be calculated through each step of the
18
treatment process. This included the daily machine calibration, CT scanning,
treatment planning, patient positioning using the ExacTrac® X-ray image
guidance system, and the treatment delivery. Parameters affecting the system
accuracy were first determined for a static setup, which were then extended to
include gated treatment parameters, such as gating window amplitude and tumor
motion.
The second chapter of this thesis will deal with the theory behind the
hardware used, as well as mathematical descriptions of methods used. The third
chapter will go through the experiments and measurements used to determine the
system accuracy, which will then be discussed with the results in the fourth
chapter. Lastly, the conclusions of the work will be covered, as well as future
work.
19
REFERENCES
[1] L. Marrett, Canadian Cancer Society's Steering Committee: Canadian Cancer
Statistics 2010. Toronto: Canadian Cancer Society, 2010., in, 2010.
[2] L. Leksell, The stereotaxic method and radiosurgery of the brain, Acta Chir
Scand, 102 (1951) 316-319.
[3] L. Leksell, Cerebral radiosurgery. I. Gammathalanotomy in two cases of
intractable pain, Acta Chir Scand, 134 (1968) 585-595.
[4] H. Blomgren, I. Lax, I. Naslund, R. Svanstrom, Stereotactic high dose fraction
radiation therapy of extracranial tumors using an accelerator. Clinical experience
of the first thirty-one patients, Acta Oncol, 34 (1995) 861-870.
[5] S. Ryu, F. Fang Yin, J. Rock, J. Zhu, A. Chu, E. Kagan, L. Rogers, M.
Ajlouni, M. Rosenblum, J.H. Kim, Image-guided and intensity-modulated
radiosurgery for patients with spinal metastasis, Cancer, 97 (2003) 2013-2018.
[6] M.C. Schell, F.J. Bova, L.D. A., L.D. D., AAPM Report No. 54 Stereotactic
Radiosurgery Report of Task Group 42, 1995.
[7] S.H. Benedict, K.M. Yenice, D. Followill, J.M. Galvin, W. Hinson, B.
Kavanagh, P. Keall, M. Lovelock, S. Meeks, L. Papiez, T. Purdie, R. Sadagopan,
M.C. Schell, B. Salter, D.J. Schlesinger, A.S. Shiu, T. Solberg, D.Y. Song, V.
Stieber, R. Timmerman, W.A. Tome, D. Verellen, L. Wang, F.F. Yin, Stereotactic
body radiation therapy: the report of AAPM Task Group 101, Med Phys, 37
(2010) 4078-4101.
[8] T. Naruke, T. Goya, R. Tsuchiya, K. Suemasu, Prognosis and survival in
resected lung carcinoma based on the new international staging system, J Thorac
Cardiovasc Surg, 96 (1988) 440-447.
[9] M. Goitein, Radiation oncology : a physicist's-eye view, Springer, New York,
2008.
[10] Y. Seppenwoolde, H. Shirato, K. Kitamura, S. Shimizu, M. van Herk, J.V.
Lebesque, K. Miyasaka, Precise and real-time measurement of 3D tumor motion
in lung due to breathing and heartbeat, measured during radiotherapy, Int J Radiat
Oncol Biol Phys, 53 (2002) 822-834.
20
[11] Q.S. Chen, M.S. Weinhous, F.C. Deibel, J.P. Ciezki, R.M. Macklis,
Fluoroscopic study of tumor motion due to breathing: facilitating precise radiation
therapy for lung cancer patients, Med Phys, 28 (2001) 1850-1856.
[12] P.J. Keall, G.S. Mageras, J.M. Balter, R.S. Emery, K.M. Forster, S.B. Jiang,
J.M. Kapatoes, D.A. Low, M.J. Murphy, B.R. Murray, C.R. Ramsey, M.B. Van
Herk, S.S. Vedam, J.W. Wong, E. Yorke, The management of respiratory motion
in radiation oncology report of AAPM Task Group 76, Med Phys, 33 (2006)
3874-3900.
[13] S.C. Davies, A.L. Hill, R.B. Holmes, M. Halliwell, P.C. Jackson, Ultrasound
quantitation of respiratory organ motion in the upper abdomen, Br J Radiol, 67
(1994) 1096-1102.
[14] R.M. Cardinale, Q. Wu, S.H. Benedict, B.D. Kavanagh, E. Bump, R. Mohan,
Determining the optimal block margin on the planning target volume for
extracranial stereotactic radiotherapy, Int J Radiat Oncol Biol Phys, 45 (1999)
515-520.
[15] J.F. Fowler, W.A. Tome, J.D. Fenwick, M.P. Mehta, A challenge to
traditional radiation oncology, Int J Radiat Oncol Biol Phys, 60 (2004) 1241-
1256.
[16] N.M. Wink, M. Chao, J. Antony, L. Xing, Individualized gating windows
based on four-dimensional CT information for respiration-gated radiotherapy,
Phys Med Biol, 53 (2008) 165-175.
[17] R. Timmerman, L. Xing, Image-Guided and Adaptive Radiation Therapy, 1st
ed., Lippincott Williams & Wilkins, Philadelphia, PA, 2010.
[18] W. Lutz, K.R. Winston, N. Maleki, A system for stereotactic radiosurgery
with a linear accelerator, Int J Radiat Oncol Biol Phys, 14 (1988) 373-381.
[19] D. Verellen, G. Soete, N. Linthout, S. Van Acker, P. De Roover, V. Vinh-
Hung, J. Van de Steene, G. Storme, Quality assurance of a system for improved
target localization and patient set-up that combines real-time infrared tracking and
stereoscopic X-ray imaging, Radiother Oncol, 67 (2003) 129-141.
[20] H. Yan, F.F. Yin, J.H. Kim, A phantom study on the positioning accuracy of
the Novalis Body system, Med Phys, 30 (2003) 3052-3060.
21
[21] N. Hayashi, Y. Obata, Y. Uchiyama, Y. Mori, C. Hashizume, T. Kobayashi,
Assessment of spatial uncertainties in the radiotherapy process with the Novalis
system, Int J Radiat Oncol Biol Phys, 75 (2009) 549-557.
[22] T. Takakura, T. Mizowaki, M. Nakata, S. Yano, T. Fujimoto, Y. Miyabe, M.
Nakamura, M. Hiraoka, The geometric accuracy of frameless stereotactic
radiosurgery using a 6D robotic couch system, Phys Med Biol, 55 (2010) 1-10.
[23] R.E. Wurm, S. Erbel, I. Schwenkert, F. Gum, D. Agaoglu, R. Schild, L.
Schlenger, D. Scheffler, M. Brock, V. Budach, Novalis frameless image-guided
noninvasive radiosurgery: initial experience, Neurosurgery, 62 (2008) A11-17;
discussion A17-18.
[24] J. Kim, J.Y. Jin, N. Walls, T. Nurushev, B. Movsas, I.J. Chetty, S. Ryu,
Image-guided localization accuracy of stereoscopic planar and volumetric
imaging methods for stereotactic radiation surgery and stereotactic body radiation
therapy: a phantom study, Int J Radiat Oncol Biol Phys, 79 (2011) 1588-1596.
[25] J. Ma, Z. Chang, Z. Wang, Q. Jackie Wu, J.P. Kirkpatrick, F.F. Yin,
ExacTrac X-ray 6 degree-of-freedom image-guidance for intracranial non-
invasive stereotactic radiotherapy: comparison with kilo-voltage cone-beam CT,
Radiother Oncol, 93 (2009) 602-608.
[26] L.T. Wang, T.D. Solberg, P.M. Medin, R. Boone, Infrared patient positioning
for stereotactic radiosurgery of extracranial tumors, Comput Biol Med, 31 (2001)
101-111.
[27] S.E. Tenn, T.D. Solberg, P.M. Medin, Targeting accuracy of an image
guided gating system for stereotactic body radiotherapy, Phys Med Biol, 50
(2005) 5443-5462.
[28] T.R. Willoughby, A.R. Forbes, D. Buchholz, K.M. Langen, T.H. Wagner,
O.A. Zeidan, P.A. Kupelian, S.L. Meeks, Evaluation of an infrared camera and X-
ray system using implanted fiducials in patients with lung tumors for gated
radiation therapy, Int J Radiat Oncol Biol Phys, 66 (2006) 568-575.
[29] A.E. Lujan, E.W. Larsen, J.M. Balter, R.K. Ten Haken, A method for
incorporating organ motion due to breathing into 3D dose calculations, Med Phys,
26 (1999) 715-720.
22
[30] R.E. Wurm, F. Gum, S. Erbel, L. Schlenger, D. Scheffler, D. Agaoglu, R.
Schild, B. Gebauer, P. Rogalla, M. Plotkin, K. Ocran, V. Budach, Image guided
respiratory gated hypofractionated Stereotactic Body Radiation Therapy (H-
SBRT) for liver and lung tumors: Initial experience, Acta Oncol, 45 (2006) 881-
889.
23
Chapter 2
Theory
This section will deal primarily with the theory and background behind
SBRT treatments and the experiments done for this thesis. First, the target
volumes used for treatment will be defined and discussed, followed by the theory
of uncertainties and isocenters. The last few sections of this chapter will deal with
respiratory gating and the imaging modalities required.
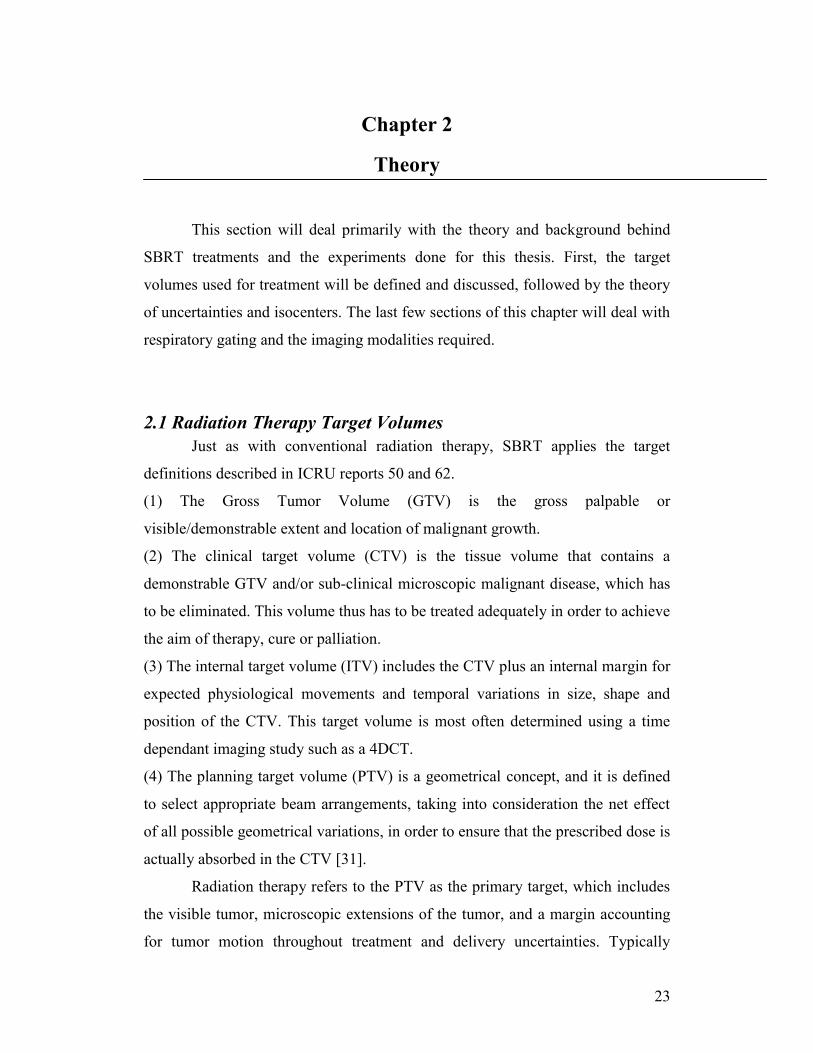
2.1 Radiation Therapy Target Volumes
Just as with conventional radiation therapy, SBRT applies the target
definitions described in ICRU reports 50 and 62.
(1) The Gross Tumor Volume (GTV) is the gross palpable or
visible/demonstrable extent and location of malignant growth.
(2) The clinical target volume (CTV) is the tissue volume that contains a
demonstrable GTV and/or sub-clinical microscopic malignant disease, which has
to be eliminated. This volume thus has to be treated adequately in order to achieve
the aim of therapy, cure or palliation.
(3) The internal target volume (ITV) includes the CTV plus an internal margin for
expected physiological movements and temporal variations in size, shape and
position of the CTV. This target volume is most often determined using a time
dependant imaging study such as a 4DCT.
(4) The planning target volume (PTV) is a geometrical concept, and it is defined
to select appropriate beam arrangements, taking into consideration the net effect
of all possible geometrical variations, in order to ensure that the prescribed dose is
actually absorbed in the CTV [31].
Radiation therapy refers to the PTV as the primary target, which includes
the visible tumor, microscopic extensions of the tumor, and a margin accounting
for tumor motion throughout treatment and delivery uncertainties. Typically
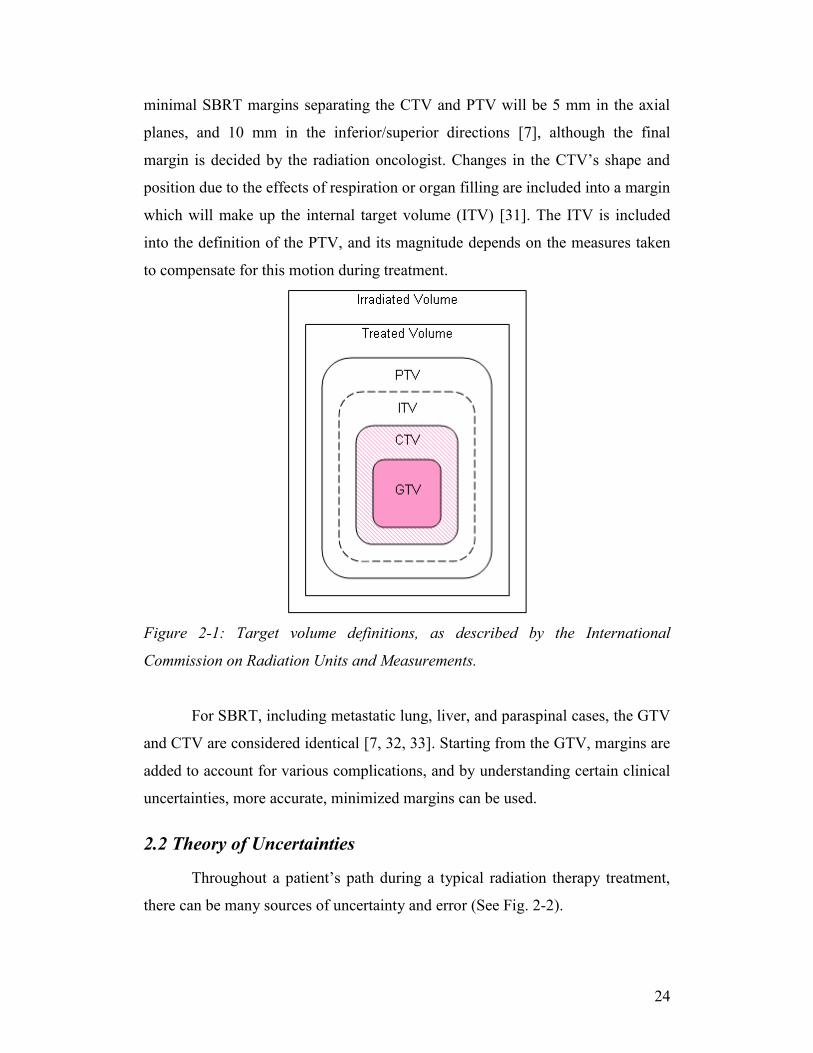
24
minimal SBRT margins separating the CTV and PTV will be 5 mm in the axial
planes, and 10 mm in the inferior/superior directions [7], although the final
margin is decided by the radiation oncologist. Changes in the CTV’s shape and
position due to the effects of respiration or organ filling are included into a margin
which will make up the internal target volume (ITV) [31]. The ITV is included
into the definition of the PTV, and its magnitude depends on the measures taken
to compensate for this motion during treatment.
Figure 2-1: Target volume definitions, as described by the International
Commission on Radiation Units and Measurements.
For SBRT, including metastatic lung, liver, and paraspinal cases, the GTV
and CTV are considered identical [7, 32, 33]. Starting from the GTV, margins are
added to account for various complications, and by understanding certain clinical
uncertainties, more accurate, minimized margins can be used.
2.2 Theory of Uncertainties
Throughout a patient’s path during a typical radiation therapy treatment,
there can be many sources of uncertainty and error (See Fig. 2-2).
25
Figure 2-2: Allowable tolerance of spatial uncertainties through the course of a
typical treatment using the ExacTrac® system for positioning.
The initial diagnosis depends on evaluating the patient histology and
stage, but even when properly dealt with results in some uncertainty in the
diagnosis. Imaging of the patient constitutes another source of uncertainty, due to
artifacts, spatial distortions, or even misinterpretation. Once the planning images
have been taken, the target and organs at risk need to be delineated. The
prescription and treatment plan development bring about another level of
uncertainty. Finally, the patient handling and actual treatment delivery also have
an intrinsic level of uncertainty associated with them due to patient and organ
motion, positioning, or machine configurations. It is impossible to completely
eradicate the uncertainty, but through a proper examination of their source and
cause, one can minimize them to a clinically acceptable level, or at least
incorporate the uncertainty into the best possible result [8].
The goal of validating the ExacTrac® system was to determine the ability
of the system to accurately and precisely position the patient for a gated treatment
on a day-to-day basis. In order to properly understand the evaluation of this
system, one must be familiar with the terminology and theory behind each of the
measurements.
When measurements are repeated over a large sampling, the resulting
frequency plot will typically result in a Gaussian distribution, as uncertainty
values will generally be spread around a mean value. The variation in this
26
distribution is the result of what is known as random error. A systematic error
occurs when bias occurs in these measurements. This materializes when the mean
of the measurement set differs from the actual value of the variable in question.
SBRT requires localization that is both accurate and precise. These two concepts
correspond with each of the two types of error: accuracy with systematic error,
and precision with random error.
The International Organization for Standardization (ISO) and the National
Institute of Standards and Technology (NIST) recommend referring to these
values as type A and type B uncertainties. Type A uncertainties refers to
numerical values which are evaluated by statistical methods, and type B are those
which are evaluated by other means [34]. While commonly used interchangeably,
error and uncertainty refer to different properties of the measurement. When a
measurement is made, an error can be made inadvertently. The magnitude of this
error can then be evaluated and expressed as an uncertainty of the measured
value. By this logic, a measurement with a large uncertainty can in turn have a
negligible error.
A distribution of uncertainties is known as the probability density
function. When measurements are made up of predominately random errors, the
PDF will be represented by a Gaussian, as per the central limit theorem. The mean
of the measurement (μ) refers to the central axis of the curve, or the average of the
function. The shape of the Gaussian is dependent on the variance (σ2), which
describes the dispersion of the measurements. For a limited sample size, these
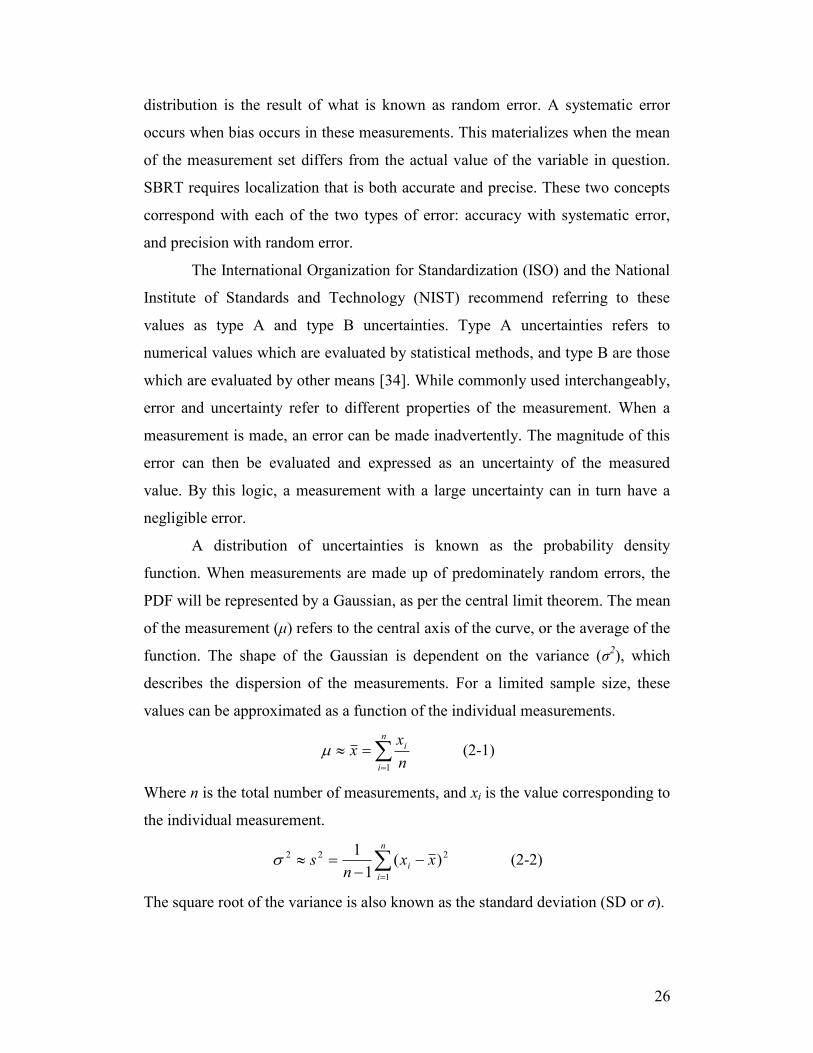
values can be approximated as a function of the individual measurements.
n
i
i
n
xx
1
(2-1)
Where n is the total number of measurements, and xi is the value corresponding to
the individual measurement.
n
i
i xxn
s1
222 )(1
1 (2-2)
The square root of the variance is also known as the standard deviation (SD or σ).
27
Using the standard deviation, a confidence interval (CI) can be described.
The CI is used to evaluate the reliability of a measurement estimate. For example,
a CI with 95% likelihood would give a range of measurements of 2x . This
can also be interpreted in that 95% of measured values would lie within two
standard deviations of the mean of the function. Other useful confidence intervals
can be seen in Table 2.1.
Table 2-1: Relationship between the confidence interval, and the confidence level.
Confidence
Interval
Confidence
Level (%)
675.0x 50
x 68.3
64.1x 90
2x 95
3x 99.7
As is the case with the final accuracy of the ExacTrac® System, there are
a number of contributing factors. In order to calculate the combined standard
uncertainty, NIST recommends combining the standard deviations using the law
of propagation of uncertainty, also known as the root-sum-of-squares.
22
2
2
1 ... ncombined UUUU (2-3)
Where n is the total number of sources of uncertainty. This formula assumes that
independence of all of the factors.
When combining uncertainties of different types, the confidence levels
must be the same. The type A uncertainties can then be combined in quadrature,
separately from the type B uncertainties being combined in quadrature. The type
A and type B uncertainties can then be combined to create the combined standard
uncertainty [8, 34-36].
28
2.3 Isocenters
In minimizing the positional uncertainties associated with the ExacTrac®
System, one must gain an understanding of the different isocenters that play a role
in the calibration of the machine and the treatment of the patient. An isocenter can
be described as the point or volume at the focal point of a specific coordinate
system. There are four isocenters that need to coincide in a properly calibrated
treatment machine equipped with the ExacTrac® System.
Figure 2-3: Flowchart describing the method used to check the different
isocenters and coordinate systems. The radiation isocenter is compared to the
laser isocenter, which is then used to set up the IR coordinate system. The IR
system is then used to check that the ExacTrac® X-ray isocenter is accurate.
Finally, the X-rays are then compared to the original WL pointer to check that the
radiation isocenter and the ExacTrac® isocenter coincide within tolerance.
The mechanical isocenter is defined as the intersection point of the axis of
rotation of collimator and the axis of rotation of the linac gantry. Uncertainty in
this isocenter results from mechanical limitations and slight shifts in the gantry
frame due to its weight [37].
29
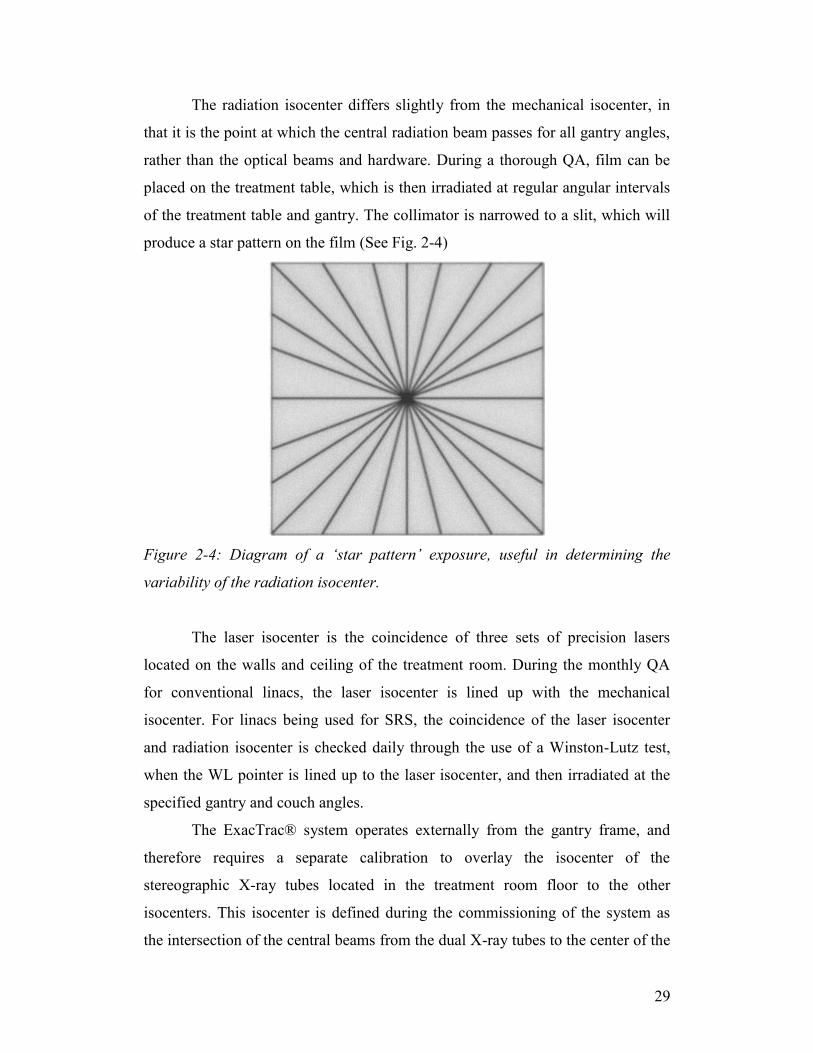
The radiation isocenter differs slightly from the mechanical isocenter, in
that it is the point at which the central radiation beam passes for all gantry angles,
rather than the optical beams and hardware. During a thorough QA, film can be
placed on the treatment table, which is then irradiated at regular angular intervals
of the treatment table and gantry. The collimator is narrowed to a slit, which will
produce a star pattern on the film (See Fig. 2-4)
Figure 2-4: Diagram of a ‘star pattern’ exposure, useful in determining the
variability of the radiation isocenter.
The laser isocenter is the coincidence of three sets of precision lasers
located on the walls and ceiling of the treatment room. During the monthly QA
for conventional linacs, the laser isocenter is lined up with the mechanical
isocenter. For linacs being used for SRS, the coincidence of the laser isocenter
and radiation isocenter is checked daily through the use of a Winston-Lutz test,
when the WL pointer is lined up to the laser isocenter, and then irradiated at the
specified gantry and couch angles.
The ExacTrac® system operates externally from the gantry frame, and
therefore requires a separate calibration to overlay the isocenter of the
stereographic X-ray tubes located in the treatment room floor to the other
isocenters. This isocenter is defined during the commissioning of the system as
the intersection of the central beams from the dual X-ray tubes to the center of the
30
detectors mounted to the treatment room ceiling. The isocenter is a function of
immobile components, and therefore will ideally not move. The coincidence of
this isocenter with the mechanical, radiation, and laser isocenters is paramount to
the usefulness of IGRT, and is checked daily. Before the ExacTrac® isocenter can
be inspected, the infrared coordinate system must be created. This is done by
lining up a phantom outfitted with IR markers at the laser isocenter. Another
phantom equipped with internal markers is then moved to the newly defined
origin of the IR coordinate system. The phantom is imaged using the dual floor
mounted X-ray tubes, checking that the IR coordinate system and the X-ray tubes
are aligned within tolerance.
The daily variation in the ExacTrac® isocenter is defined directly by the
ability to line a phantom up with the laser isocenter.
2.4 Respiratory Gating
Respiratory gating refers to the process of irradiation during a specified
portion of the patient’s breathing cycle. The duty cycle of the radiation will
typically be between 30% and 50% [17] and chosen to be around a point which
will minimize tumor motion. The internal tumor position can be inferred from an
external respiration signal or directly through internal marker imaging. This
section will discuss the theory behind the patient’s breath trace and the benefits
and issues with gated treatments.
2.4.1 The Breath Trace and Surrogate Correlation
The patient breath trace summarizes the patient’s movement along the
anterior/posterior (AP) direction. This is typically done using external trackers
placed on the patient’s abdomen. During the inhale phase, the patient’s lungs
expand with the contraction of the diaphragm. This, in turn, causes the chest wall
to elevate in the AP direction. A breath cycle is not perfectly symmetric, and the
inhalation phase is typically longer than the expiration phase. The shape of this
curve is typically modeled using a sinusoid, but can more accurately be modeled
using a parametric characterization of breathing induced organ motion [29]:
31
tbyty n2
0 cos)( (2-4)
Where b is the peak-to-peak amplitude, τ is the breathing period, is the
starting phase, and n is an asymmetry factor.
Other considerations for pulmonary tumors include the hysteresis of the
lung [38], which causes the intra-lung pressure during the inhalation to be less
than that of the expiration, leading to a phase shift between the external surrogate
motion and the internal motion.
-7
-6
-5
-4
-3
-2
-1
0
0 10 20 30 40 50 60
Time (sec)
Am
pli
tud
e (
mm
)
Figure 2-5: Typical breath trace of a patient with a consistent rhythm over a 60
second period.
Each maximum corresponds to the end inhale point, while the minima
represent the end exhale section of the patient’s respiration (see Fig. 2-5). On the
day of treatment, a reference level is specified, around which a gating window for
treatment is selected. This gating window accounts for residual target motion and
a setup margin chosen by the physician. The idea of individualizing gating
windows for more patient-specific treatment has been looked at using the
32
patient’s breathing pattern and the allowable residual target motion as a guide. By
using a 4DCT to determine the amount of target motion, the physician can choose
a gating window that will correspond to the setup margin, in order to maximize
the efficacy of the treatment [16].
There are many methods of physically reducing the intra-fractional
motion, such as abdominal compression, breath-holding, visual biofeedback, and
active breathing control. These methods strive to produce a more reproducible
breath trace, and maximize the area in which the target can be treated. In a gated
treatment, residual movement of the target will still occur within the treatment
window. The ExacTrac® imaging system allows for imaging during this window,
to check that the internal markers do not deviate beyond the motion accounted for
in the treatment planning. The system also comes equipped with a visual-feedback
system, allowing the patient to follow their own breathing pattern. The visual
feedback can be coupled with audio, and has shown to reduce treatment times
from 1.7 ± 0.6 min / 100 monitor units (MU) to 0.9 ± 0.2 min / 100 MU [39].
2.4.2 Respiratory Gating Benefits and Issues
The goal of respiratory gating is to reduce the probability of delivering
dose to normal tissue and also underdosing the target [7]. However,
accomplishing these goals requires the use of many specialized techniques and
types of equipment. Gating is heavily affected on the patient’s ability to have a
reproducible breath trace throughout the treatment, as well as day to day. Several
reports have stated that the benefits of gated beam delivery do not outweigh the
increase in treatment time and complexity for patients with motion amplitudes
less than 20 mm [7, 40, 41]. In these cases, it has been suggested to apply
treatment to the entire ITV that has been outlined on the planning CT, rather than
treating only during a fraction of the breathing cycle. For all cases, patient-
specific tumor motion assessment is recommended, as it can be used to determine
if the patient would benefit from gated treatment, to quantify the residual motion,
and design margins for treatment planning, and to quantify and account for phase
shifts between the tumor motion and respiratory signal [7].
33
2.5 Imaging Modalities
As is suggested by its name, image guided radiation therapy (IGRT)
requires the use of several imaging modalities throughout a patient’s treatment
course. This section will cover the issues and theory of imaging used in SBRT,
including computed tomography, on-board imagers, and the ExacTrac® System.
2.5.1 Computed Tomography
As mentioned in the previous chapter, 4DCT is the most common method
of obtaining a set of planning images for SBRT. Other methods for accounting for
respiratory motion exist, such as slow CT scanning or inhale and exhale breath-
hold CTs, but this section will deal primarily with the theory and issues in dealing
with the 4DCT.
No matter the method of scanning chosen, imaging artifacts will be
present in some form or another. Metal implants or other objects located in the
scan area with a high atomic number can result in artifacts on the resulting image
set. Motion artifacts during the simulation imaging are caused primarily by
respiration, cardiac function, peristaltic activity, and organ filling and emptying
[7]. The transaxial rotation of the CT tube and the motion of this internal anatomy
are asynchronous, which will result in improper depictions of the organ and tumor
volumes.
Figure 2-6: The effect of moving 12 mm spherical target on a standard axial scan
(A) versus images acquired during a 4DCT scan (B). (C) shows the axial slices of
A
B C
34
a 4DCT of a moving spherical target. The spiral pattern results from the
reconstructions over a full rotation of the CT, and show a decreased density
around the outer surface, due to averaging effects. Reproduced from [42].
AAPM Task Group-101 recommends that the typical scan length should
extend at least 5-10 cm superior and inferior beyond the treatment field borders.
This scan length may be extended to 15 cm beyond the borders in order to
properly model the patient’s internal anatomy, but can be chosen using a scout
view image before scanning. This scan length should include all possible organs
at risk, so as to account for these structures during the treatment planning and
evaluate them with the use of a dose-volume histogram (DVH). While CT slice
thickness can affect the overall accuracy of the patient setup, 1-3 mm is generally
taken as an acceptable value. This value should not exceed 5 mm, as shown
through preliminary phantom studies for the Novalis TX treatment machine [20].
When a particular voxel contains more than a single type of tissue, partial volume
effects can be seen (See Fig. 2-7). Increasing the resolution by reducing the slice
thickness can lessen this effect. If a target falls within particular detectors during
the initial positioning and scan, partial voluming will be less visible.
Figure 2-7: Effect of partial voluming at the border of two types of tissues. The
white line represents the structure border and causes the detectors to average the
tissues into a single value.
35
The scan requires a stable patient breathing pattern. Irregularities in the
patient respiration signal from breath to breath factor into the residual motion
artifacts [42].
During this time, the system continuously takes projection data at the first
couch position for a time known as the cine duration. The duration is determined
by the total length of the patient breathing cycle plus the rotation time of the CT
tube. For a couch with a transit time of one second between positions, the total
scan length (Tscan) is given by:
Tscan = (Nslices/Ndetector rows)*(Tcine+1sec)-1 s (2-5)
and Nslices is the longitudinal length of the scan, Ndetector rows is the number of
detector rows, and Tcine is the duration at each couch position given by the motion
period plus the time for a full CT gantry rotation. At each of these couch
positions, a number of images determined by the cine duration and the time
interval between couch positions are reconstructed. These images are then
retrospectively sorted based on the phase of the respiration cycle, as described in
Section 1.2.3, typically with a 10% tolerance. This tolerance also contributes to
motion artifacts in the final image set [42].
2.5.2 BrainLAB ExacTrac® 6D Image Guidance System
The initial step in a typical patient setup procedure requires that the patient
be positioned according to the infrared (IR) body markers that reference the
treatment isocenter.
The IR component of the ExacTrac® System utilizes two precalibrated IR
tracking cameras mounted to the ceiling at the base of the patient couch. These
cameras are used to triangulate the position of IR body markers placed on the
patient. The body markers are 15 mm plastic spheres coated with an IR reflective
surface. The patient can also be outfitted with several accessories (See Fig. 2-8)
depending on the treatment to aid in precise positioning.
36
Figure 2-8: Cranial Array, Patient Mask, Reference Star and Grid (Reproduced
from ExacTrac® Clinical User Guide)
The process of using the IR markers begins with the calibration of the
system at the beginning of the day. The BrainLAB ET Isocenter Phantom (See
Fig. 2-9) is lined up with the room lasers, giving the ExacTrac® System an
infrared coordinate reference with regards to the patient couch and linac.
Figure 2-9: BrainLAB ET Isocenter Phantom. The five IR markers are placed
with a known configuration and point in space, allowing for the determination of
an IR coordinate system.
37
If the focal point of the IR camera is known, a single camera can only
determine a virtual line along which a marker is located. Therefore, to determine
the actual superposition of the IR marker, a second camera simultaneously
overlays a second virtual line, which intersects at the position of the marker (see
Fig. 2-10A).
Figure 2-10: Determination of the location of an IR marker using dual IR
cameras. When the location of the focal spot is known, virtual lines can be used to
locate the position of single IR reflectors (A). Ambiguities can appear for certain
setups (B) with multiple intersections, leading to the detection of ‘ghost markers.’
Depending on the geometric shape of the markers, this process can lend
itself to ambiguities, such as several markers being aligned along the same virtual
line, undeterminable rotations of the patient, or markers hidden from view.
ExacTrac® has several methods to minimize the possible ambiguities, which
compare the IR setup to the true marker positions, known through the original CT
data set or initial patient setup. This comparison can minimize the effect of ‘ghost
markers’, which are created when there are other possible intersections of virtual
lines (See Fig. 2-10B).
In addition to positioning ambiguities, the marker shift resulting from
positioning reproducibility, patient motion, or skin shift can lend itself to
isocenter variability. This problem is resolved by taking subsets of three or more
markers (the minimum requirement to define the orientation of a rigid structure).
These subsets are then subsequently weighted to determine a proper isocenter.
B A
38
S
SS
w
ZYXwZYX (2-6)
S
SS
d
nw
Where ZYX are the isocenter coordinates, Sw is the weighting
factor, and Sd is the Euclidian norm of the deviation between the reference
isocenter and subset isocenter. This method results in a minimization of
localization errors versus the unweighted strategy [38].
Once the patient is initially setup using the IR camera system, the target
position is checked. The imaging component of the ExacTrac® system
incorporates two kV X-ray units located in the floor on either side of the linear
accelerator (See Fig. 2-11).
Figure 2-11: X-ray tube and housing box used for kV imaging (Reproduced from
ExacTrac® Clinical User Guide).
The relationship between the kV X-ray images and the DRRs is
established using the pinhole cameral model:
34333231
14131211
pzpypxp
pzpypxpu
34333231
24232221
pzpypxp
pzpypxpv
(2-7)
39
Where (x, y, z) are the three-dimensional coordinates of a point in the
object being imaged, and (u, v) are the two-dimensional coordinates of the kV X-
ray projections onto the detectors. Pij are unknown parameters, which are
determined daily through the use of the X-ray calibration phantom, which comes
embedded with implanted markers with known relative positions. The unknown
parameters can then be determined mathematically [43] to allow for coordinate
conversion for different markers and objects.
2.6 Combination of Uncertainties and Summary of Theory
In the validation of the ExacTrac® Adaptive Gating System for use with
SBRT, the uncertainties needed to be broken down into individual components.
The system was evaluated under ideal static conditions to determine the effects of
the isocenters (EIso), positioning algorithm (EFusion), and CT (ECT) and treatment
planning uncertainties. For the static phantom case, these components could be
added in quadrature to determine an overall uncertainty.
222)( CTFusionIsototal EEEStaticE (2-8)
For gated SBRT, a static CT can no longer be used, and the term must be
replaced with a 4DCT term (E4DCT). In addition to replacing this term, gating
window size and tumor motion (EGating) affect the overall accuracy of the system.
This leads to an updated formula for gated procedures.
22
4
22)( GatingDCTFusionIsototal EEEEGatedE (2-9)
An end-to-end test can give the total uncertainty, but by limiting the
control elements, the individual uncertainties can be systematically determined.
This process is not exact, but by assuming that experiments can be done to isolate
each term, a conservative estimate of the uncertainties can be obtained.
40
REFERENCES
[1] International Commission on Radiation Units and Measurements., Prescribing,
recording, and reporting photon beam therapy, International Commission on
Radiation Units and Measurements, Bethesda, MD, 1993.
[2] S.H. Benedict, K.M. Yenice, D. Followill, J.M. Galvin, W. Hinson, B.
Kavanagh, P. Keall, M. Lovelock, S. Meeks, L. Papiez, T. Purdie, R. Sadagopan,
M.C. Schell, B. Salter, D.J. Schlesinger, A.S. Shiu, T. Solberg, D.Y. Song, V.
Stieber, R. Timmerman, W.A. Tome, D. Verellen, L. Wang, F.F. Yin, Stereotactic
body radiation therapy: the report of AAPM Task Group 101, Med Phys, 37
(2010) 4078-4101.
[3] J. Wulf, U. Hadinger, U. Oppitz, W. Thiele, R. Ness-Dourdoumas, M. Flentje,
Stereotactic radiotherapy of targets in the lung and liver, Strahlenther Onkol, 177
(2001) 645-655.
[4] M.H. Bilsky, Y. Yamada, K.M. Yenice, M. Lovelock, M. Hunt, P.H. Gutin,
S.A. Leibel, Intensity-modulated stereotactic radiotherapy of paraspinal tumors: a
preliminary report, Neurosurgery, 54 (2004) 823-830; discussion 830-821.
[5] M. Goitein, Radiation oncology : a physicist's-eye view, Springer, New York,
2008.
[6] B.N. Taylor, C.E. Kuyatt, Guidelines for evaluating and expressing the
uncertainty of NIST measurement results, 1994 ed., U.S. Department of
Commerce, Technology Administration, National Institute of Standards and
Technology, Gaithersburg, MD, 1994.
[7] R.R. Johnson, Elementary statistics, 2d ed., Duxbury Press, North Scituate,
Mass., 1976.
[8] S.R. Cherry, J.A. Sorenson, M.E. Phelps, Physics in nuclear medicine, 3rd ed.,
Saunders, Philadelphia, PA, 2003.
[9] F.M. Khan, The physics of radiation therapy, 4th ed., Lippincott Williams &
Wilkins, Philadelphia, 2010.
[10] R. Timmerman, L. Xing, Image-Guided and Adaptive Radiation Therapy, 1st
ed., Lippincott Williams & Wilkins, Philadelphia, PA, 2010.
41
[11] A.E. Lujan, E.W. Larsen, J.M. Balter, R.K. Ten Haken, A method for
incorporating organ motion due to breathing into 3D dose calculations, Med Phys,
26 (1999) 715-720.
[12] M. Riboldi, G. Baroni, M.F. Spadea, F. Bassanini, B. Tagaste, C. Garibaldi,
R. Orecchia, A. Pedotti, Robust frameless stereotactic localization in extra-cranial
radiotherapy, Med Phys, 33 (2006) 1141-1152.
[13] N.M. Wink, M. Chao, J. Antony, L. Xing, Individualized gating windows
based on four-dimensional CT information for respiration-gated radiotherapy,
Phys Med Biol, 53 (2008) 165-175.
[14] N. Linthout, S. Bral, I. Van de Vondel, D. Verellen, K. Tournel, T. Gevaert,
M. Duchateau, T. Reynders, G. Storme, Treatment delivery time optimization of
respiratory gated radiation therapy by application of audio-visual feedback,
Radiother Oncol, 91 (2009) 330-335.
[15] J.J. Sonke, M. Rossi, J. Wolthaus, M. van Herk, E. Damen, J. Belderbos,
Frameless stereotactic body radiotherapy for lung cancer using four-dimensional
cone beam CT guidance, Int J Radiat Oncol Biol Phys, 74 (2009) 567-574.
[16] M. Guckenberger, T. Krieger, A. Richter, K. Baier, J. Wilbert, R.A.
Sweeney, M. Flentje, Potential of image-guidance, gating and real-time tracking
to improve accuracy in pulmonary stereotactic body radiotherapy, Radiother
Oncol, 91 (2009) 288-295.
[17] E. Rietzel, T. Pan, G.T. Chen, Four-dimensional computed tomography:
image formation and clinical protocol, Med Phys, 32 (2005) 874-889.
[18] H. Yan, F.F. Yin, J.H. Kim, A phantom study on the positioning accuracy of
the Novalis Body system, Med Phys, 30 (2003) 3052-3060.
[19] P. Thevenaz, U.E. Ruttimann, M. Unser, A pyramid approach to subpixel
registration based on intensity, IEEE Trans Image Process, 7 (1998) 27-41.
42
Chapter 3
Materials and Methods
Chapter 3 details the physical components and the method of executing
the experiments accomplished. Stereotactic body radiation therapy requires the
use of many different types of equipment, starting with the imaging equipment,
the linac, the gating devices, and in-house and commercial software. The first
tests were done to describe mechanical accuracy of the linac and couch. The next
steps involved quantifying uncertainties for the case of a static phantom, and then
a phantom under gated conditions. During the course of the phantom studies,
patient introduced errors could not be taken into account, so in order to quantify
the ExacTrac® system’s ability under gated conditions, a patient study was
completed.
3.1 Equipment
This section will specify the various equipment used in a typical SBRT
treatment, as well as the specific tools used for all the experiments completed.
3.1.1 CT and RPM
All planning CTs were done on a Philips Brilliance CT Big Bore
(Koninklijke Philips Electronics N.V., Amsterdam, Netherlands) which was
equipped with the Varian® Real-time Position Management™ (RPM) system
(Varian Medical Systems, Palo Alto, CA). The seventh generation CT was
capable of 16-slice per revolution acquisition, up to a 60 cm scan field of view,
and respiratory correlated imaging. In conjunction with the RPM software, the
system was able to retrospectively sort all of the CT images into corresponding
phase or amplitude bins. Unless noted otherwise, 4DCT scans were done using
the default value of 3 mm slice thickness, with a 0.44 second tube rotation time,
and phase binning.
43
The RPM software sampled the IR marker box placed on the phantom at a
rate of 20 Hz.
3.1.2 Treatment Planning Software
Treatment planning for each of the experiments was done using the
BrainLAB iPlan® Treatment Planning Software (BrainLAB AG, Feldkirchen,
Germany). Initial stereotactic localization was done in RT_Image to provide a
reliable coordinate system, while contouring of internal structures and dose
prescription was completed in RT_Dose. Localization of the internal structures
was completed using a combination of auto-segmentation on a zoomed area
around the target and manual painting. All plans, unless otherwise noted, used a
single conformal beam in the AP direction, as complex beam arrangements were
unnecessary.
3.1.3 Linac
The linac used for each of the experiments was the Novalis Tx™ linac
(Varian Medical Systems, Palo Alto, CA). Mounted under the collimator jaws
was the Varian HD120 MLC (Millennium Multileaf Collimator) comprised of 2.5
mm leaves. The MLC was capable of delivering static or dynamic treatments with
a maximum field size of 15 cm x 15 cm. Dose rates of up to 1000 MU/min were
possible for specialized treatments, such as SRS and SBRT, in order to minimize
treatment times.
3.1.4 ExacTrac® and Accessories
The experiments required several accessories necessary for stereotactic
and gated treatments. For stereotactic treatments, a special head and neck base
plate and couch extension are used. A special IR cranial array with six
asymmetrically spaced markers is rigidly attached to this base plate for
localization purposes.
For extracranial procedures, a reference array is used to provide a
reference frame for the markers placed on the patient’s skin. This array is
horseshoe shaped with six asymmetrically placed markers which are meant to be
44
placed slightly above the patient’s abdomen without touching. The array attaches
to the side of the couch through a screw assembly and allows for adjustment
above the couch.
Figure 3-1: Both the cranial array (A) and the reference array (B) are outfitted
with six IR markers.
3.1.5 Phantoms
The ExacTrac® system and its corresponding accessories were designed
for use with live patients, but were tested and evaluated using phantoms designed
to replicate treatment conditions.
PHANTOM CONSTRUCTION
The first phantom used was composed of 14 polymethyl methacrylate
(PMMA) slices of 1 cm thickness. Slices could contain a number of internal
marker types, including spherical tungsten or integrated steel strips. The
constructed PMMA block was then attached to the BrainLAB gating phantom
platform through the use of securing screws at the base of the phantom.
A B
45
Figure 3-2: PMMA phantom. Each slice can contain a number of slots or internal
markers, allowing for a unique configuration specific for the user’s purpose.
The ET Gating Phantom (BrainLAB AG, Feldkirchen, Germany)
was set up by mounting the 14 PMMA onto a moving platform. Embedded in the
phantom were two 4.5 mm tungsten ball bearing markers. Three of the slices
included slight recesses with enough room to place film for dosimetric
measurements. One of the film plates was placed directly below the upper
tungsten marker.
46
Figure 3-4: The ET Gating Phantom. The longitudinally moving platform (A) and
the vertical marker plate (B) simulate the internal and external motion of a SBRT
patient.
The ET Gating Phantom was made up of two moving platforms: a vertical
marker plate and a horizontal drive plate (See Fig. 3-4). The drive plate was a
longitudinally shifting platform which held the PMMA plates and simulated
internal motion due to respiration. The vertical was outfitted with a flexible gating
sheet and body markers to mimic the external respiratory motion.
The next series of static tests used a Rando® anthropomorphic head
phantom. The Rando® phantom consisted of a human skull cast inside a soft-
tissue equivalent material. This urethane material was designed to mimic the
effective atomic number and mass density of muscle tissue with randomly
distributed fat. The head was made up of 10 slices of approximately 2.5 cm (1”)
thickness, with each slice containing pockets designed to accept 0.5 cm (3/16”)
implants. The implants typically used are fiducial markers, thermo-luminescent
dosimeters, or bone, air, and tissue-equivalent inserts.
B A
47
2.5 mm lead ball bearings were used as the internal fiducial markers, and
were inserted into tissue-equivalent inserts. Three of these markers were placed
behind the nasal cavity in the phantom, approximately around the center of the
skull in the 3rd
and 4th
cranial slices.
Figure 3-3: Anthropomorphic head phantom used for testing positioning fusion
algorithms. The lighter colored pegs placed in an array could be removed and
replaced with markers, dosimeters, or different density inserts.
PHANTOM IMAGING AND PREPARATION
A thermoplastic mask was needed for the phantom to be treated
framelessly. The mask was created using no spacers between the base and the face
of the mask in order to minimize unexpected shifts. Once the mask had set, the
phantom was ready for the planning CT. The phantom was placed into the H&N
Base plate and onto the Imaging Couch Top Frameless Extension, both parts of
the BrainLAB Head & Neck Treatment System. During fitting for masks, the
plastic will shrink slightly, and requires the use of spacers. Plastic spaces of 2 mm
thickness were used with the anthropomorphic phantom. The H&N Localizer and
48
Target Positioner box was then attached to the base plate and secured. Markers
were also placed directly onto the mask for use with a 3-point setup, in the event
of the localizer box not being used. The slice thickness was then chosen, and the
total images limited to no more than 300, which was the software limitation for
the treatment planning system. The images were then exported to the iPlan®
treatment planning system. The phantom slices were not taken apart at any point
during the measurements to minimize marker and slice shifts.
The gating phantom did not require the use of a stabilizing mask, and
could be placed directly onto the couch for both the CT planning scan and
treatment irradiation. Scanning parameters were chosen for a 4DCT, and the
phantom was imaged as described in Section 1.2.3. Using the control software for
the phantom (ExacTrac® Gating Phantom 1.0.0), the displacement of the
platforms could be set, as well as the cycle length, pattern, and phase differences
between the two platforms.
3.1.6 Film QA
The film used for all hidden target and WL experiments was the
GAFCHROMIC® RTQA2 (International Specialty Products, Wayne, NJ) film.
The film was self-developing with a dynamic range of 0.02 Gy to 8 Gy. The film
was chosen for its robust nature in regards to storage and ready availability. For
experiments requiring higher sensitivity, such as the high tumor speed or the field
profile scans, GAFCHROMIC® EBT2 (ISP, Wayne, NJ) film was used. This film
is designed for use from 1 cGy to 10 Gy, but can be used at higher doses by
switching color channels. The films were scanned in on an Epson Expression
1680 Professional scanner (Seiko Epson Corporation, Nagano, Japan) as an 8-bit
grayscale image at 200 dpi.
ANALYZATION SOFTWARE
Once the films were scanned into a digital format, a MATLAB® script
was used to quantitatively analyze the results. In preliminary versions of the
script, a routine named Fiximg.m was used to modify the contrast and image
49
intensity. A 2D median filter using a 9x9 pixel array was then used to reduce the
‘salt-and-pepper’ noise of the image, while retaining edges. Another routine,
Drawing.m, overlaid the film exposures with circles corresponding to the
radiation field and the radio-opaque spheroid. A correction factor of 5.7
8 was
applied to account for magnification from the cone to the film plane.
Figure 3-5: Conversion of scanned film after image enhancement and median
filter.
Secondary versions of the software included a graphical user interface
(GUI) to streamline analysis. The script utilized an image contrast window to
allow the user to manually adjust the visualization of the film exposure, and
allowed the input of individual couch or gantry angles. The difference in center
points between each of the circles was calculated and converted into a millimeter
value.
These values then needed to be converted in to the couch’s frame of
reference, in order to give a correction.
)sin(
)cos(
),(2tan
22
ry
rx
xya
yxr
(3-1)
(3-2)
(3-3)
(3-4)
(3-5)
50
Where ф is the angle formed with the lateral axis and φ is the couch angle.
The coordinates were then corrected on the film for their position relative to the
gantry angle.
)sin('
'
)cos('
xz
yy
xx
Where x’ is lateral position, y’ is superior-inferior direction, and z’ is vertical
direction.
3.2 Isocenter Evaluation Experiments
Before examining the accuracy associated with a gated treatment,
experiments were done on the treatment machine itself, in order to map out the
deviations associated with the mechanics of both the treatment couch and the
rotation of the gantry head. The tracking of the couch movement was designed to
give an estimate of the mechanical capability, while the overall uncertainty with
regards to the isocenters (the Eiso term of Equations 2-8 and 2-9) was obtained by
combining the mechanical and coordinate deviation uncertainties in quadrature.
3.2.1 IR Tracking of Couch Movement
For traditional treatments, the rotation of the couch and gantry must keep
the machine isocenter within a 2 mm sphere, so mechanical shifts occurring
during the treatment can be effectively ignored. In stereotactic treatments, this
isocenter sphere is reduced to 1 mm, and requires strict maintenance. By
monitoring the deviations of the couch using an external tool, a better
understanding of the uncertainties seen in treatments can be obtained.
The IR markers and camera system can provide an external modality for
viewing relative sub-millimeter shifts, so when zeroed at a particular couch
position, the mapping of the couch’s movement as it rotates can be acquired.
Prior to the experiment, the ExacTrac® system was calibrated using the
daily procedure as described in Section 1.2.3.8. The Rando® phantom was placed
(3-6)
(3-7)
(3-8)
51
into the H&N Base plate which was connected to a treatment couch extension.
The cranial IR array was attached directly to the base plate.
Once the assembly was zeroed at the center couch position (0°), 15° steps
were taken in either direction to ±90°. At each position the relative shift of the IR
markers was noted. This experiment was repeated five times to gain a standard
deviation for each position.
Initially, the cranial array did not sit properly over the phantom and mask.
The caudal side of the array pressured the shoulders of the anthropomorphic
phantom, causing approximately a 5 mm shift in the vertical direction, and a 1
degree offset in the longitudinal and latitudinal angles. This was remedied by
removing the shoulder slice from the phantom and creating a new PMMA base.
This required the creation of a new thermoplastic mask to accommodate the
changes in physiology.
3.2.2 ExacTrac® X-ray Tracking of Couch Movement
At the same time as the IR marker shifts were noted as a function of couch
angle, two other modalities were used to check the relative couch shift. Two
algorithms used in the ExacTrac® software utilize different aspects of the target
phantom (the embedded internal markers and the bony anatomy of the phantom)
to determine a patient correction vector.
Shifts were noted at every 15° up to ±90°.
3.2.3 Daily Winston Lutz Check
The morning quality assurance using the Winston-Lutz check allows for a
qualitative check of the accuracy of the radiation isocenter. All of these tests are
stored, and can be evaluated to give a quantitative assessment of the deviation of
the radiation isocenter as a function of couch and gantry angle.
During the morning calibration of the ExacTrac® and Novalis TX™
treatment system, the coincidence of several isocenters are checked. The film-
based Winston-Lutz test compares that the radiation beam agrees with the laser
alignment. In order to perform the test, the BrainLAB phantom pointer was
attached to the couch mount. The pointer was equipped with a radio-opaque
52
sphere centered under the targeting cross-hairs. Using the precision positioning
knobs (See Fig. 3-6) on the mount, the cross-hairs on the pointer were aligned to
the laser isocenter.
Figure 3-6: Preparation for alignment of WL pointer (A) with lasers. Precision
positioning knobs (B) are used to shift the pointer along the lateral and vertical
axes. A properly aligned WL pointer can be seen on the right.
A film mount was attached to the gantry head, with a strip of radiochromic
film clamped behind the phantom pointer. A stereotactic conical collimator of 7.5
mm diameter was attached to the gantry accessory tray slot. The film was then
irradiated with 600 MU, in order to produce a projection of the sphere within the
stereotactic radiation field. The field size was chosen to allow for a simple
tolerance check, where the machine would be considered acceptable when the
spheroid did not come into contact with the edge of the radiation field.
Films taken at gantry angles of 0° and 180° were used to determine shift
deviations in the coronal plane, while gantry angles of 90° and 270° used to
evaluate the sagittal plane. Couch angles of 0°, 45°, and 315° were also used with
the 0° gantry angle. During monthly quality assurance checks, a total of eight
exposures were taken, which included these angles as well as a two combinations
of couch and gantry rotation. All exposures during the study were collected by
technicians at the MUHC.
B
A
53
Winston-Lutz films from the month of October 2010 were evaluated using
the developed in-house MATLAB script mentioned in Section 3.1.6. A total of 71
exposures were used over the 31 day period. Films taken at gantry angles of 0°
and 180° were used to determine shift deviations in the coronal plane, while
gantry angles of 90° and 270° used to evaluate the sagittal plane. Couch angles of
0°, 45°, and 315° were also used with the 0° gantry angle.
Because the central axis of the radiation beam should not change with
relation to the gantry head for any given angle, the Winston-Lutz exposures can
be used to track the head sag and isocenter shifts of the gantry and couch, giving
the mechanical deviation component of the Eiso term.
3.2.4 The Hidden Target Test
Similar to a Winston-Lutz test, the hidden target test is designed to
determine uncertainties involved with a system. However, the hidden target test is
primarily used for end-to-end tests, which include all aspects of a treatment, from
CT scanning to beam alignment with the target.
The ‘hidden target’ refers to a small object that is placed inside a phantom
to be the center of the treatment process. The target is localized in the treatment
planning system after the planning CT. A single beam shaped by a stereotactic
cone (See Fig. 3-8) is used to treat the target and is aligned to the center of mass
of the target visualization
54
Figure 3-7: Stereotactic cones (A) used for treatment and calibration procedures.
Cones are placed into a mount (B) directly beneath the linac head.
A sheet of radiosensitive film is placed in line with the radiation beam
behind the target. For moving targets, the film is placed in a stationary position
outside the phantom, while for static cases, the film can be placed directly inside
the phantom. After the film has been irradiated during the treatment, an image of
the radiation field will be present, as well as the shadow of the ‘hidden target’.
The end-to-end accuracy of the system in question can be evaluated from the
deviation seen between the center of the field and the center of the shadow of the
target.
3.2.5 Coordinate Deviation of the ExacTrac® System
The accuracy of the ExacTrac® System relies on consistent calibration
throughout its use. The alignment of the laser with the calibration phantom and
A
B
55
WL pointer define the coordinate system around the isocenter and inherently the
final accuracy of the patient position. An option in the ExacTrac® calibration
software allows the user to align the WL pointer with the lasers.
A calibration image (70 kVp, 70 mA, 100 ms) was acquired, after which
the software automatically delineates the embedded sphere and calculates the
deviation from the center of the detector (See Fig 3-9). By assuming that the X-
ray tube and detectors remain stationary throughout the measurement and
repositioning the WL pointer as per the daily calibration, the calculated numbers
can show the deviation resulting from the laser positioning. A comprehensive
look at the coordinate deviation could be determined by repeating the alignment
20 times.
Figure 3-8: X-ray image of WL pointer from Tube 1. The embedded sphere and
expected center are compared in the ExacTrac® software.
3.3 Image Fusion Experiments
The next step after evaluating the isocenter uncertainty component was to
look at the ability of the software’s different fusion algorithms to correctly
position the patient. For SBRT treatments, particularly gated treatments for use
56
with this thesis, internal marker fusion is used to obtain the EFusion term from
Equations 2-8 and 2-9.
3.3.1 Relative Comparison of Fusion Methods on a Static Phantom
The simple cubic PMMA phantom was used for the comparison of fusion
methods. The phantom was placed at the isocenter with the use of the lasers, and
confirmed through the use of the ExacTrac® stereoscopic X-ray system. The X-
ray tubes used modifiable presets depending on the body part being imaged to
gain the best possible image contrast for the fusion. Thorax Standard (120 kV,
100 mA, 160 ms) was chosen for the PMMA phantom.
On the ExacTrac® console computer, the tungsten spheroid marker was
localized on the planning CT, for comparison with the ExacTrac® DRR. The
internal marker was used for the initial isocenter positioning, as this method is
generally accepted as more representative of the actual patient position. Because
the internal marker was rigidly positioned relative to the isocenter, the isocenter
shift could be calculated directly. Once this shift was calculated, the couch was
automatically positioned to the proper coordinates.
A manual shift was then applied to the phantom, using the couch
coordinates and the laser projections onto the graph paper to roughly measure the
offset, and the IR system to confirm the shift. Shifts of up to 5 cm were applied
along a single axis for each measurement. Once the shift was applied to the
phantom, three different fusion algorithms were used to calculate this shift.
Because the internal marker was used to initially place the phantom, the automatic
and manual bony fusion methods were compared to this.
3.3.2 Relative Comparison of Fusion Methods on a Static
Anthropomorphic Phantom
The anthropomorphic phantom was placed on the couch using Frameless
Radiosurgery Positioning Array. The array was clamped to the couch and
outfitted with graph paper along each face. The setup was moved to the planning
isocenter based on the infrared markers on the array. The localized internal
57
markers were used to define the phantom shift from the rough isocenter defined
by the initial infrared marker position.
The couch was systematically moved along each axis up to 5 cm, which
was confirmed using the graph paper and IR system. Automatic positioning was
not used. At each point, the ExacTrac® system was used to take two stereoscopic
images using the ‘Thorax Std.’ preset. Automatic detection of the internal markers
was used, and the markers were then fused to the planning CT position. Then,
using the same image set, Automatic Bony Fusion was used to compare phantom
positioning.
Each position was imaged three times before moving to the next. After
each set of shifts along one axis, the phantom was returned to isocenter using
automatic positioning. The positioning was then confirmed by imaging the
internal markers.
3.4 Computed Tomography Experiments
The pretreatment imaging also constitutes a component of the uncertainty,
and this section deals with the determination of the effects of the CT scans, for
both static and gated cases. The experiments here were used to quantify the ECT
and E4DCT terms.
3.4.1 Effect of Slice Thickness Using a Static CT
A total of nine CT scans were done on the ExacTrac® Gating Phantom,
distributed between slice thickenesses of 2, 3, and 5 mm. Prior to each scan the
ExacTrac® Gating Phantom was placed on the CT couch absent of any phantom
rotations. The phantom was shifted each time in the AP direction to randomize the
starting position of the scan, and introduce variations in the visualization of the
target. The X-ray tube also began each scan at a random angle.
The field of view and scan length were chosen based on a scout image to
include the entire PMMA portion of the phantom. Default settings for a standard
scan were used.
58
Auto-segmentation was used to delineate the markers inside the phantom.
Objects within the specified area with Hounsfield Units (HU) between 1700 and
3000 were accepted as the internal markers. A single element conformal beam
plan was used with a 7 mm margin. The margin was set large enough to allow for
the stereotactic cone to define the field.
After treatment planning, a hidden target test was required. The
ExacTrac® system was calibrated and three WL exposures were taken to
determine the baseline deviation. Each plan was executed a total of three times.
3.4.2 Effect of Slice Thickness on Four-Dimensional CT
In order to test the effect of CT slice thickness for the case of 4DCT scans,
multiple CT scans were planned. Three scans were taken at three slice thicknesses
(2, 3, and 5 mm) for a total of nine scans. Positioning of the phantom was done
similarly to the setup of the static CT.
The ExacTrac® Phantom was set to oscillate sinusoidally in the AP
direction with a maximum internal shift of 3 cm over a period of 5 seconds. No
phase shifts were present between the internal motion of the phantom and the
breath trace recorded by the IR camera system. The scan length was chosen as to
include the minimum and maximum positions throughout the breath cycle.
3.5 Respiratory Gated Experiments
The last component of uncertainty to be evaluated concerns the effects
seen during respiratory gated treatments (EGating). The main effects to be examined
include the tumor motion and the gating window size.
3.2.10 Effect of Gating Window Size and Tumor Motion
Window size and the motion of the tumor constitute a large portion of the
uncertainty in targeting in SBRT treatments. For typical treatments, the gating
window and tumor amplitude can be as large as 50% and 3 cm, respectively. The
ExacTrac® System was calibrated, and 3 WL exposures were taken prior to any
measurements.
59
The treatment plan was created using a 3 mm slice thickness CT scan.
Another set of plans was created with an intentional 5 mm offset from the center
of mass of the imaged marker. This was done to observe the residual shift in the
final position of the target with respect to the treatment beam. A hidden target
test was done for a case of a static phantom to give a baseline offset. The phantom
was then set to oscillate at 1 cm amplitude using a 5 second period sinusoidal
breath trace. The phantom was repositioned using the gating procedure and then
irradiated using window sizes of 10%, 20%, and finally 30%. These window sizes
were repeated for internal motions of 2 cm and 3 cm.
Each combination of window size and amplitude was repeated three times,
and evaluated as both an end-to-end test, and for individual component of window
size and amplitude. The individual components were collected by subtracting out
the deviation from a static HTT using the same initial positioning.
Lastly, using the 10% window size, a separate piece of GAFCHROMIC®
EBT2 film was irradiated on the top of the moving phantom to visualize the effect
of dose blurring as a function of tumor speed. The films were irradiated to 250
cGy. The films were then scanned using 24-bit color and dose profiles were taken
along the SI axis using FilmQA™ (3cognition USA, Wayne, NJ).
3.6 Patient Study
Once the system had been evaluated using phantoms under ideal
conditions, the next step was to compare these results with the positional shifts
seen during a real patient treatment. This study would help delineate the
uncertainties arising from the treatment system itself, and those uncertainties
resulting from patient movement or changes in anatomy.
Data was collected from four liver SBRT patients treated on the Novalis
Tx™ linear accelerator at the Montreal General Hospital over the previous two
years. After treatments, all patients were removed from the ExacTrac® computer
and backup on a remote server. These patients could be restored to view
correction shifts on any individual treatment day. Fractions varied between three
60
and ten, with the total dose being between 30 and 50 Gy. A total of 23 correction
shifts were collected from the patients.
Prior to treatment, internal fiducial markers were surgically implanted into
the patient’s liver, with each patient containing between two and seven. For the
CT, each patient was outfitted with six external, radiopaque body markers on their
abdomen, and placed on the scanning table using the BodyFix immobilization
system. The scans were done using the retrospective gating mode using 3 mm
slice thickness.
The target volumes were defined within the iPlan® treatment planning
software. Important structures such as the heart and bowels were also included in
the dose volume histogram.
A
61
Figure 3-9: Treatment planning portion of the liver SBRT patients. Figure A
shows the contouring of the target volumes (GTV – pink, CTV – purple, PTV –
red). Figure B shows the beam configuration around the targeted area, as well as
the heart (orange), small bowel (yellow), and the healthy liver (blue).
The liver lesions were contoured, as well as each of the important
surrounding structures, including the heart, bowel, and healthy tissues (See Fig. 3-
10A). The CTV and PTV were outlined around the GTV. Beam configurations
implemented limited couch and gantry angles to minimize treatment times. Up to
10 conformal beams (See Fig. 3-10B) were chosen for treatment, as well as a
boost if it was necessary.
On each day of treatment, patients were repositioned on the couch using
the gating procedures in the ExacTrac® software. With the exception of Patient 3,
a single point was used to define each of the internal fiducial markers center of
mass. Patient 3 used three long markers, defined by their endpoints. Once the
patient’s breath trace had stabilized, the reference level and typically two
additional imaging levels were chosen. Corrections were based only on the
B
62
reference level images. Initial positioning was then accomplished using the
external markers location in relation to the reference array. Following this
procedure, the dual X-ray tubes were used to image the internal fiducials for
precise positioning (See Fig. 3-11). If the determined offset was less than the
tolerable 5 mm, treatment continued as planned. If not, the calculated shift was
applied to the system and checked again with the X-ray tubes. This process would
be repeated until the offset was reduced below tolerance levels.
Figure 3-10: ExacTrac® images of a liver SBRT patient. Internal fiducials (A)
are used to complete precise positioning, while IR markers (B) are used to track
the patient’s movement and breath trace.
After the treatment was completed, shift data from the software was
exported from the computer to an archived hard disk. This data was used to
determine the ability of the system to initially position the patient and then correct
the position based on internal information. These values can then be compared
directly with the results from the phantom experiments to quantify the patient
component of uncertainty.
A
B
63
Chapter 4
Results and Discussion
This chapter will review the experiments described in Section 3.2 of this
thesis. The first sections will deal with the isocenter shifts, concerning the couch
and linac. The next sections will continue to discuss the uncertainties associated
with the ExacTrac® system and typical SBRT treatments with regards to a static
setup, and then under gated conditions. All uncertainties are given to one standard
deviation.
4.1 Isocenter Evaluation
The mechanical and radiation isocenter deviations were evaluated using
experiments implementing the ExacTrac® equipment and film exposures. The
coordinate deviations of the ExacTrac® system were also included in the study.
4.1.1 IR Tracking of Couch Movement
The experimental method described in Sections 3.2.3 and 3.2.4 was
intended to give an understanding of the deviations associated with a typical
couch rotation. These deviations were tracked using two external validation
techniques making up the ExacTrac® system, the IR camera system, and the
stereoscopic X-rays.
64
IR Shift vs. Couch Angle
-0.60
-0.40
-0.20
0.00
0.20
0.40
0.60
0.80
-90.0 -75.0 -60.0 -45.0 -30.0 -15.0 0.5 15.0 30.0 45.0 60.0 75.0 90.0
Couch Angle (°)
Ab
so
lute
Devia
tio
n (
mm
)
Total Deviation
Vertical
Lat
Long
Figure 4-1: Comparison of the infrared detected position as a function of the
couch angle.
The smallest detected deviation was around the couch angle of 0°. The
deviation detected here was largely due to the daily fluctuations of the calibration.
As the couch rotated to larger angles, the detected shifts increased in both
magnitude and uncertainty. The largest component of the detected shifts appeared
in the lateral direction. Including the error bars, which were taken from multiple
measurements of the same point, the deviation at each point in the couch’s
rotation was less than the 1 mm required for stereotactic radiosurgery.
4.1.2 X-ray Tracking of Couch Movement
At the same time as the IR readings were being taken of the phantom
position, stereoscopic X-rays were being recorded. These measurements could be
compared directly to the results from the previous section.
65
Int. Marker vs Auto Fusion
-0.2
0
0.2
0.4
0.6
0.8
1
1.2
1.4
-75 -45 -30 0 30 45 75
Couch Angle (o)
To
tal D
evia
tio
n (
mm
)
Internal Marker
Auto Fusion
Figure 4-2: Comparison of total deviation detected by the two image fusion
methods. The blue points represent the internal marker fusion, while the pink
shows the bony fusion method.
Similar to the infrared detection, the detected phantom shifts increase at
larger couch angles. Both methods show that the mechanical aspect of the linear
accelerator is capable of accuracy of 1 mm. The ExacTrac® system is capable of
detecting these mechanical shifts, which is important in determining the final
correction vector.
66
4.1.3 Evaluation of Daily WL Films
Figure 4-3: Scatter plot for the daily Winston-Lutz film exposures during the
month of October 2010. The blue points represent a couch position of 0°, and
multiple gantry angles. The red points represent a gantry angle of 0° and couch
angles of 45° and 315°.
The individual exposures were rotated into the couch’s frame of reference
as described in Section 3.1.6, and the average shift and standard deviation seen in
the exposures was calculated to be 0.3 ± 0.3 mm, -0.3 ± 0.4 mm, and -0.2 ± 0.4
mm in the lateral, superior-inferior, and vertical directions, respectively. These
measurements were used in the subsequent laser calibration to reduce the overall
deviations seen at these various gantry and couch angles. The WL pointer was
placed at the current laser isocenter, and then moved to the newly calculated
67
position. The lasers were then realigned to the center of the pointer. Over the next
month, the daily WL films were again analyzed for shifts. The resulting values
were 0.3 ± 0.4 mm, -0.1 ± 0.4 mm, and -0.2 ± 0.3 mm for the lateral, SI, and
vertical directions, respectively. Based on the standard deviations, the residual
uncertainties tend to be on the order of 0.3-0.4 mm for any given direction.
Figure 4-4: Scatter plot of the daily Winston-Lutz exposures for the month of
October 2010. The points have been organized by the measured deviation at the
individual couch or gantry angles and rotated into the couch’s frame of reference.
The points along the plane of motion of the couch can be compared to the
results of Sections 4.1.1 and 4.1.2: the IR and X-ray tracking of couch movement.
Discrepancies can be seen between different angles for the couch versus what was
seen in Figure 4-4. At 0 longitudinal shifts of up to 1 mm are visible, but the
detected shifts at couch angles of 315° (-45°) are on the same order, whereas the
IR system showed a differences of 0.4 mm between the two angles.
WL Deviation Oct
-1.5
-1
-0.5
0
0.5
1
1.5
0 20 40 60 80 100 120
Measurement Number
De
via
tio
n (
mm
)
Lateral (x)
SI (y)
Vertical (z)
G0,C0
G90,C0
G180,C0
G270,C0
G0,C45
G0,C315
68
Comparison of the lateral directions between the IR and WL
measurements shows similarity in both direction and magnitude. Vertical
measurements for the couch angle of 0° show deviations less than 0.5 mm in the
negative direction, due in part to the sagging of the linac head as it rotated about
the couch.
4.1.4 Coordinate Deviation of the ExacTrac® System
When using the Eiso term to define the total uncertainty, both the
mechanical deviation of the linac and the coordinate deviation of the ExacTrac®
system contribute.
The ExacTrac® component of the Eiso variable (Section 2.6) was
determined by averaging the alignment coordinates and taking the standard
deviation over the course of 20 measurements. The three-dimensional coordinates
determined were 0.1 ± 0.2 mm , 0.2 ± 0.1 mm, and 0.2 ± 0.1 mm in the lateral,
SI, and AP directions, respectively. This gives a total offset vector of 0.3 ± 0.2
mm.
The coordinate deviation and the mechanical deviation can then combined
in quadrature to give a value of 0.6 ± 0.7 mm for the isocenter term. Independence
is assumed because the two systems are separately mounted, although this value
should be viewed as a conservative estimate.
4.2 Image Fusion
Once the isocenter uncertainty component was determined, the effects of
the image fusion and the system’s ability to position the patient needed to be
established. While internal markers are used for SBRT positioning, this modality
was compared with the ExacTrac® system’s other positioning tools: the bony
anatomy fusion and the IR system.
69
4.2.1 Relative Comparison of Fusion Methods on a Static Phantom
In the relative comparison, the two main positioning modalities, the
internal marker (IM) and bony anatomy fusion were also checked against a
manual fusion. Measurements were done with separate calibrations, with the first
set taken relative to each other, while the second was taken to show absolute
deviation for each method.
Image Fusion Comparison
-0.80
-0.60
-0.40
-0.20
0.00
0.20
0.40
1 2 3 4 5 6 7 8 9 10 11 12 13 14 15
Measurement Number
Iso
ce
nte
r D
evia
tio
n (
mm
)
Internal Marker
Automatic Fusion
Manual Fusion
Figure 4-5: Comparison of Internal Marker, Bony Automatic, and Manual fusion
methods available on the ExacTrac® software.
The measurements are from a single calibration, with the standard
deviation taken from the entire set. The total deviation is shown with respect to
the average internal marker deviation because the internal marker was used to
initially position the phantom. The internal marker fusion and manual fusion had
an average difference of less than 0.1 mm, while the automatic fusion position
differed from the internal marker by an average of 0.3 mm. Each modality
exhibited a standard deviation of less than 0.2 mm.
70
Residual Marker Shift
0.00
0.10
0.20
0.30
0.40
0.50
0.60
0.70
0.80
0.90
1.00
1 1.5 2 2.5 3 3.5 4 4.5 5 5.5 6
Measurement Number
Dis
tan
ce
(m
m)
Internal Marker
Auto Fusion
Manual Fusion
Figure 4-6: Comparison of the Internal Marker, Bony Automatic, and Manual
fusion methods using a separate calibration of the ExacTrac® system.
The internal marker was used to initially position the phantom, but in this
plot the different methods are presented in absolute deviation rather than with
respect to the initial positioning method. The manual fusion again shows the
smallest offset (0.2 ± 0.1 mm), while the bony fusion method differs by 0.6 ± 0.1.
All methods had a standard deviation of less than 0.2 mm.
71
4.2.2 Comparison of Image Fusion Methods for a Static Gating
Phantom
Once the fusion methods were compared for points at the isocenter, the
fusion methods needed to be compared for their ability to detect and correct for
known shifts.
Table 4-1: Table summarizing the detected offset by IR marker, internal marker,
and auto fusion from the actual position for shifts along any of the three couch
axes.
Infrared
Marker Internal Marker
Auto
Fusion
Lat
(mm)
SI
(mm)
AP
(mm)
Overall
(mm)
Lat
(mm)
SI
(mm)
AP
(mm)
Overall
(mm)
Lat
(mm)
SI
(mm)
AP
(mm)
Overall
(mm)
Lateral Shift
10 mm Average 0.1 -0.2 0.0 0.2 0.1 -0.1 -0.1 0.2 0.0 -0.4 -0.2 0.45
St. Dev 0.1 0.1 0.1 0.2 0.1 0.1 0.1 0.1 0.1 0.1 0.1 0.14
20 mm Average -0.1 -0.3 -0.1 0.3 0.0 -0.2 -0.2 0.3 -0.1 -0.5 -0.2 0.58
St. Dev 0.1 0.1 0.1 0.1 0.1 0.0 0.1 0.1 0.0 0.1 0.1 0.14
50 mm Average -0.1 0.0 -0.2 0.2 0.1 0.1 -0.2 0.3 -0.1 -0.2 -0.4 0.43
Std Dev. 0.1 0.1 0.1 0.1 0.1 0.1 0.1 0.1 0.1 0.1 0.0 0.10
SI Shift
10 mm Average 0.0 -0.2 0.0 0.2 0.1 -0.1 -0.2 0.2 0.0 -0.5 -0.2 0.52
St. Dev 0.0 0.0 0.0 0.1 0.0 0.1 0.0 0.1 0.0 0.1 0.1 0.10
20 mm Average 0.1 -0.2 0.0 0.2 0.1 -0.1 -0.2 0.2 -0.1 -0.5 -0.2 0.50
St. Dev 0.1 0.1 0.1 0.2 0.1 0.1 0.0 0.1 0.1 0.1 0.1 0.15
50 mm Average -0.1 -0.4 0.3 0.5 -0.1 -0.4 0.2 0.5 -0.3 -0.6 0.1 0.66
Std Dev. 0.0 0.1 0.2 0.2 0.1 0.1 0.2 0.2 0.1 0.1 0.1 0.12
AP Shift
10 mm Average 0.0 0.0 0.1 0.1 0.1 0.1 0.0 0.1 0.0 -0.3 0.0 0.32
St. Dev 0.1 0.1 0.1 0.1 0.1 0.1 0.1 0.2 0.1 0.1 0.1 0.17
20 mm Average 0.0 -0.1 0.1 0.2 0.0 0.0 0.0 0.0 0.0 -0.4 -0.1 0.38
St. Dev 0.1 0.1 0.1 0.1 0.1 0.1 0.1 0.1 0.1 0.1 0.1 0.18
50 mm Average -0.1 -0.1 0.2 0.2 -0.1 0.1 0.1 0.1 0.0 -0.3 0.1 0.35
Std Dev. 0.1 0.1 0.1 0.2 0.1 0.1 0.1 0.2 0.1 0.1 0.2 0.19
72
The IR system showed an accuracy of 0.2 ± 0.2 mm for shifts up to 5 cm.
The largest deviations from the actual position were seen in the vertical and SI
directions, with the largest total deviation arising for the largest shifts, except in
the lateral shift direction. These lateral shifts remained within the stated accuracy
of the IR system. However, in clinical SBRT treatments the accuracy of the IR
markers depends on several factors, including the repositioning of the markers on
the patient at treatment time, as skin sagging. Results from this experiment give a
baseline estimate for a rigid phantom setup.
The use of internal markers also gave an accuracy of 0.2 ± 0.2 mm, while
the fusion of the bony anatomy was 0.5 ± 0.2 mm. These values can be used in
determining the total uncertainty of the system, as the EFusion term (Section 2.6),
depending on the positioning modality chosen.
4.2.3 Comparison of Fusion Methods on a Static Anthropomorphic
Phantom
To allow for a more robust evaluation of the EFusion term, an
anthropomorphic phantom replaced the PMMA phantom, which contained bony
anatomy in addition to the internal fiducial markers.
73
Internal Marker vs Auto Fusion
-0.30
-0.20
-0.10
0.00
0.10
0.20
0.30
0.40
0.50
0.60
0 5 10 15 20 25 30 35
Measurement Number
De
via
tio
n (
mm
)
Internal Marker
Auto Fusion
Figure 4-7: Plot showing the total detected offset from planning position on a
static anthropomorphic phantom. The pink shows the results of the bony fusion,
while the blue shows the results of the internal marker.
The internal markers resulted in a more consistent and smaller offset than
the automatic fusion algorithm for the anthropomorphic phantom. The internal
marker offset was determined to be 0.1 ± 0.2 mm, while the automatic fusion was
0.2 ± 0.3 mm. The second calibration gave comparable results for each method,
showing shifts in the same direction and within 0.1 mm of each other. The first
calibration, however, showed a discrepancy between the two modalities, with the
automatic fusion giving an average offset that was 0.3 mm larger than the average
shift determined by the internal markers. This shift should not be considered
significant as the internal markers were used for the initial positioning, and is
comparable to the relative difference seen in Section 4.2.1.
The same phantom was used in Table 4-2, but the table is broken into
detected offsets based on the shift applied to the system.
74
Table 4-2: Summary of the anthropomorphic phantom’s average deviations from
its actual position based on magnitude of the shift from planned isocenter.
Shift
Direction AP (mm) Lat (mm) SI (mm)
Shift (mm) IR (Patient Positioning)
10 Average 0.1 0.2 0.2
St. Dev. 0.1 0.2 0.1
20 Average 0.2 0.3 0.2
St. Dev. 0.2 0.1 0.2
50 Average 0.2 0.2 0.5
St. Dev. 0.2 0.1 0.2
Shift (mm) Internal Marker (X-ray)
10 Average 0.1 0.2 0.2
St. Dev. 0.2 0.1 0.1
20 Average 0.1 0.3 0.2
St. Dev. 0.2 0.2 0.2
50 Average 0.1 0.3 0.5
St. Dev. 0.2 0.1 0.2
Shift (mm) AutoFusion (X-ray)
10 Average 0.3 0.5 0.5
St. Dev. 0.2 0.1 0.1
20 Average 0.4 0.6 0.5
St. Dev. 0.2 0.1 0.2
50 Average 0.4 0.4 0.7
St. Dev. 0.2 0.1 0.1
The average detected shifts seen in Table 4-2 tend to be larger than on the
static gating phantom (See Table 4-1), with the IR and IM average offsets both
increasing to 0.4 ± 0.3, respectively, and the AutoFusion increasing to 0.8 ± 0.3.
The internal anatomy of the phantom became more complex, and IR markers
were no longer directly fastened to the phantom, but rather on the cranial array.
These are suitable to use in the EFusion term in calculating the total uncertainty, for
shifts up to 5 cm. For use in calculating the total uncertainty in section 4.5.2, the
average internal marker shift was chosen, as this is the modality used in SBRT.
75
Lat Shift (Overall Deviation)
0
0.1
0.2
0.3
0.4
0.5
0.6
0.7
0.8L
at
De
via
tio
n (
mm
)
1 cm (IR)
2 cm (IR)
5 cm (IR)
1 cm (IM)
2 cm (IM)
5 cm (IM)
1 cm (AF)
2 cm (AF)
5 cm (AF)
Figure 4-8: Comparison of the IR, internal marker, and auto fusion positioning
methods in the presence of lateral shifts.
The system showed a consistent response for each positioning modality
for detecting shifts in the lateral direction. The internal markers and IR showed
comparable average offsets (within 2%) (0.23 ± 0.14 and 0.24 ± 0.14 mm) from
the actual position, while the image fusion modality demonstrated a larger offset
of 0.49 ± 0.13 mm, with a maximum of 5% error for the 1 cm shift.
76
SI Shift (Overall Deviation)
0
0.1
0.2
0.3
0.4
0.5
0.6
0.7
0.8
0.9
SI
De
via
tio
n (
mm
)
1 cm (IR)
2 cm (IR)
5 cm (IR)
1 cm (IM)
2 cm (IM)
5 cm (IM)
1 cm (AF)
2 cm (AF)
5 cm (AF)
Figure 4-9: Comparison of IR, internal marker, and auto fusion positioning
modalities in the presence of SI shifts.
Longitudinal shifts were all reported within 5% of the actual position
using each of the positioning modalities. Both the infrared and internal marker
methods experienced a slight reduction in accuracy for shifts of 50 mm. The
detected shifts in this direction were the largest of the three axes, but not
significantly.
77
AP Shift (Overall Correction Vector)
-0.2
-0.1
0
0.1
0.2
0.3
0.4
0.5
0.6
1
De
via
tio
n (
mm
)
1 cm (IR)
2 cm (IR)
5 cm (IR)
1 cm (IM)
2 cm (IM)
5 cm (IM)
1 cm (AF)
2 cm (AF)
3 cm (AF)
Figure 4-10: Comparison of IR, internal marker, and auto fusion positioning
modalities in the presence of vertical shifts.
In the anterior-posterior direction the internal marker method showed the
smallest overall shift from the actual position. All three modalities detected shifts
up to 50 mm to within 0.4 mm, and each showed standard deviations between 0.1
mm and 0.2 mm.
4.3 Computed Tomography
This section deals with the uncertainty associated with the pretreatment
imaging. These experiments were used to determine the ECT term for static cases,
and the E4DCT term for treatments under gated conditions (Section 2.6).
4.3.1 Effect of Slice Thickness Using a Static CT
The experiment described in section 3.4.1 was completed over three series
of dates, and was combined into a single table (see below).
78
Table 4-3: The detected deviation calculated using WL exposures for various slice
thicknesses used for SBRT.
Lat (mm) SI (mm)
Slice Thickness 2mm 0.0 ± 0.2 0.1 ± 0.5
3mm 0.2 ± 0.4 0.4 ± 0.7
5mm 0.1 ± 0.4 0.1 ± 0.6
The static CT showed an overall accuracy ranging from 0.1 ± 0.5 mm to
0.5 ± 0.9 mm. Due to the makeup of the CT, vertical resolution determined to be
the same as in the lateral direction. Uncertainties associated with these directions
was assumed to be similar, and were unaffected by the changes in slice thickness.
Errors seen in the longitudinal direction tended to have a larger standard deviation
associated with them. This is due to the resolution along the SI axis being directly
affected by the slice thickness. Yan et al. recommended using slice thicknesses up
to 5 mm for use with highly accurate treatments, and the positional errors up to
this slice thickness remained within useable tolerances [20].
4.3.2 Effect of Slice Thickness on a Four-Dimensional CT
The experiment from the previous section was repeated, but using a
moving phantom in conjunction with a 4DCT. In addition to the hidden target
test, the internal marker matching and auto-fusion were used to check the final
offset of the phantom from isocenter.
Table 4-4: Positional Accuracy of the ExacTrac®
Adaptive Gating System vs. CT
Slice Thickness
Slice
Thickness
Internal Marker Auto Fusion Hidden Target
Lat
(mm) SI (mm)
AP
(mm)
Lat
(mm) SI (mm)
AP
(mm)
Lat
(mm) SI (mm)
2 mm 0.4 ± 0.2
0.6 ±
0.2 0.4 ± 0.2 0.1 ± 0.2
0.6 ±
0.1 0.1 ± 0.3 0.1 ± 0.2
0.5 ±
0.1
3 mm 0.3 ± 0.2
0.7 ±
0.2 0.4 ± 0.2 0.6 ± 0.6
0.4 ±
0.4 0.5 ± 0.2 0.2 ± 0.1
0.5 ±
0.1
5 mm 0.4 ± 0.2 0.6 ± 0.3 ± 0.5 0.1 ± 0.4 0.7 ± 0.6 ± 0.4 0.3 ± 0.3 0.5 ±
79
0.2 0.3 0.3
The use of the 4DCT allows the user to pull a section of the breathing
cycle for treatment, rather than treating over the entire internal target volume.
While there is still residual motion during this window, the resulting scan can be
used for highly accurate treatments, such as SBRT. The largest average offsets
appeared in the SI direction, similarly to the static CT. These values result from
the target motion along this axis in addition to the effect of the slice thickness.
The detected offset in the lateral direction increased slightly from the static case,
due possibly to slight rotational errors in the setup being compounded by the
phantom movement.
The 4DCT slice thickness constitutes one of the larger sources of
uncertainty for the final positioning, and can be integrated into total uncertainty
formula as the E4DCT term (Section 2.6). The value can be chosen based on which
slice thickness is to be used with the treatment.
4.4 Respiratory Gated Effects
The final term (EGating) described in Section 2.6 refers to the uncertainty
effects created under gated conditions during treatment. This section will deal
with the determination of these effects in regards to the tumor motion and gating
window size.
4.4.1 Comparison of Treatment Plans using End-to-End Test
Section 3.2.10 discusses the creation of multiple treatment plans to
observe the ExacTrac® system’s ability to position in the presence of imprecise
localization of the target.
80
Gating Window Size (Superior Shift)
0
0.5
1
1.5
2
2.5
0 10 20 30 40 50 60
Window Size (%)
Ov
era
ll D
ev
iati
on
(m
m)
Gating Window Size (Inferior Shift)
0
0.2
0.4
0.6
0.8
1
1.2
1.4
1.6
1.8
2
10 20 30 40 50 60
Window Size (%)
Overa
ll D
evia
tio
n (
mm
)
Figures 4-11 and 4-12: End-to-end results of variation of window size for a tumor
amplitude of 2 cm. Figures include the 0.5 mm offset programmed into the
treatment plan, resulting in overall deviations of greater than 1 mm.
81
The average difference for all window sizes in the end-to-end uncertainty
between the offset treatment plans and the aligned treatment plans was 0.3 ± 0.4
mm, with the largest difference seen in the 50% window. The 50% window
produced larger dose blurring in the film exposures than the smaller windows,
resulting in a larger uncertainty. The intrinsic shift of 0.5 mm falls within the error
bars of the average difference.
Figure 4-13: Comparison of window size (10% on the left, 50% on the right) on
the dose blurring effect.
The example on the left shows a target being treated using a 10% window,
while the example on the right utilizes a 50% window. The larger window
increased the uncertainty in deducing the center of mass of the target shadow.
82
Overall Comparison of Gating Window Size
0
0.2
0.4
0.6
0.8
1
1.2
1.4
1.6
1.8
2
0 10 20 30 40 50 60
Window Size (%)
Rela
tive D
evia
tio
n (
mm
)
Figure 4-14: Overall plot of comparison of gating window sizes for a tumor
amplitude of 2 cm.
The end-to-end results of the tumor amplitude comparison show that the
10% and 20% window sizes gave similar average offsets, with the standard
deviation for the first three window sizes (10, 20, 30 %) being ± 0.2 mm, and ±
0.3 mm for a 50% window. As the window size increased, the average offset also
increased to greater than 1.4 mm for both the 30 % and 50 % windows. The
ExacTrac® software uses 30 % as the default window size for SBRT treatments.
4.4.2 Tumor Amplitude
In addition to the effects of the size of the gating window, the motion of
the tumor being targeted plays a large role in the accuracy of the system. The
following section looks at the system’s ability to target and deliver a treatment
beam under gated conditions with varying tumor speeds.
83
Relative Offset Due to Tumor Amplitude
-0.6
-0.4
-0.2
0
0.2
0.4
0.6
0.8
1
1.2
0 1 2 3
Amplitude (cm)
Overa
ll T
arg
et
Devia
tio
n (
mm
)
Overall (mm)
Lateral (mm)
SI (mm)
Figure 4-15: Plot showing the relative offset of the hidden target as a function of
tumor amplitude.
The plot shows that the overall relative offset is proportional to the
amplitude of the tumor motion. The largest contribution was due to the shifts
detected in the SI direction. These shifts are in due to the increasing target speed
along this axis, affecting the targeting of the system. This is similar to the
increasing effect of the target motion during CT scanning. The lateral offset
decreases with increased tumor speed, the standard deviation increases to a
maximum of ± 0.3 mm for 3 cm tumor amplitude. The standard deviations of the
individual directions were all within ± 0.2 mm, while the overall standard
deviation increased from ± 0.3 mm to ± 0.4 mm.
4.4.3 Effect of Gating Window Size and Tumor Motion
After looking at the window size and tumor motion components
individually, these terms were expanded to a wider range of clinical values.
Depending on the treatment being given, the EGating term’s (Section 2.6)
contribution to the total uncertainty can be determined from Table 4-5.
84
Table 4-5: Positional Accuracy of the ExacTrac®
Adaptive Gating System vs.
Gating Parameters
Gating Window 10% 20% 30%
Lat (mm) SI (mm) Lat (mm) SI (mm) Lat (mm) SI (mm)
Tumor Amplitude (cm)
0 0.2 ± 0.2 0.2 ± 0.2 - - - -
0.75 0.2 ± 0.2 0.1 ± 0.2 0.1 ± 0.2 0.1 ± 0.2 0.1 ± 0.3 0.1 ± 0.3
1.5 0.1 ± 0.2 0.0 ± 0.2 0.1 ± 0.3 0.1 ± 0.3 0.1 ± 0.2 0.4 ± 0.4
2.25 0.0 ± 0.2 0.2 ± 0.3 0.1 ± 0.2 0.1 ± 0.3 0.3 ± 0.4 0.8 ± 0.6
3 0.3 ± 0.4 0.3 ± 0.3 0.2 ± 0.2 0.1 ± 0.5 0.1 ± 0.3 1.1 ± 1.7
The contribution of the window size and tumor amplitude to the overall
uncertainty was less than 1 mm for all amplitudes paired with up to a 20% gating
window. However, for large tumor amplitudes with the 30% window, the detected
overall offset increased to a maximum of 1.1 ± 1.8 mm. Even after changing to a
more sensitive film, a residual shift was detected. The ExacTrac® Adaptive
Gating system showed itself to be adequate for smaller window sizes and tumor
amplitudes, but for tumor amplitudes of greater than 3 cm, external precautions
would be necessary to reduce the uncertainty. The next section will discuss the
more of the effects of large tumor motion on the system’s ability to properly
deliver a treatment.
4.4.4 Dose Profiles
The system’s ability to target and properly irradiate a target located
internally was checked by looking at the dose profiles along the axis of motion
(SI). Dose blurring was more readily visible along this axis.
85
Tumor Speed Profiles
-50
0
50
100
150
200
250
300
-15 -10 -5 0 5 10 15
Profile Length (mm)
Do
se (
cG
y) Static
1 cm
2 cm
3 cm
4 cm
Figure 4-16: Comparison of dose profiles for a target moving over a 5-second
breath cycle.
The figure shows different dose profiles of a 10 mm field treated to 250
cGy in the bottom 10% of the breath trace. Cross-sections were done along the SI
axis. Doses at the center of the field were all within ± 5% of the prescribed dose.
As the speed of the target increased, dose blurring increased along the axis,
particularly in the inferior direction. This shift in dose is possibly due to the slight
lag of the treatment beam with respect to the triggering mechanism.
4.5 Patient Study and Summary
The initial aim of this thesis was to quantify the sources of error associated
with the ExacTrac® system during an SBRT treatment. The system has been
evaluated under ideal conditions, using a static phantom as well as a moving
phantom reproducing the movements of a patient. However, such conditions are
impossible to replicate when a living patient is involved. This section deals with
86
the study described in Section 3.6, and the discrepancies between the phantom
studies and actual patient treatments.
4.5.1 Patient Study
The 23 correction shifts were combined into a single table, divided into
the individual patients from whom the data was taken.
Table 4-6: Comparison of detected shifts for Liver SBRT patients at the MUHC
hospital from 2010-2011.
Pretreatment Shift Corrected Shift
Lat
(mm)
SI
(mm)
AP
(mm)
Overall
(mm)
Lat
(mm)
SI
(mm)
AP
(mm)
Overall
(mm)
Patient 1 Avg. -0.8 -0.9 -0.7 5.9 -0.1 -0.7 1.2 2.3
St. Dev. 2.2 5.3 4.5 4.1 1.1 2.0 2.3 2.7
Patient 2 Avg. 3.3 4.8 -1.4 7.8 0.5 1.9 0.4 5.5
St. Dev. 1.3 6.7 1.7 3.7 1.6 6.3 1.7 3.3
Patient 3 Avg. 5.7 9.1 -13.2 17.0 2.6 1.6 -2.1 3.7
St. Dev. - - - - - - - -
Patient 4 Avg. -2.2 -6.8 0.1 7.9 -0.7 -1.0 0.5 3.3
St. Dev. 1.6 4.2 3.0 4.1 1.3 2.5 2.2 1.6
Overall Avg. 2.1 4.8 2.8 6.5 1.2 2.3 1.6 3.3
St. Dev. 2.8 6.6 4.4 4.4 1.6 3.1 2.1 2.5
Each patient consisted of several fractions, except for patient 3, during
which only a single fraction was positioned with the ExacTrac® system. After the
initial positioning, the correction vector calculated was 6.5 ± 4.4 mm, larger than
the 5 mm used for treatment at the MUHC. After applying the detected shift, the
new correction vector was decreased by an average of 3.2 mm to a final offset of
3.3 ± 2.5 mm. Uncertainty was largest along the SI axis, both before and after
correction, due to contributions from the CT planning and tumor motion.
87
4.5.2 Comparison of Spatial Accuracy on a Phantom vs. Patient
The end-to-end film study results from Section 4.4.1 show ExacTrac®
system is capable of consistent positioning within 2 mm of the intended treatment
isocenter. This corresponds well with the combination of the individual
component uncertainty in quadrature described in Section 2.6.
When using typical clinical settings (3 mm slice thickness, 30 % window
size) on a typical patient tumor (5 second breath cycle, 1.25 cm tumor amplitude),
the formula in Section 2.6 can be used to estimate the spatial accuracy of the
system. This calculation uses overall correction vectors, and is not specific to a
particular direction.
22
4
22
GatingDCTFusionIsototal EEEEE
EIso = 0.6 ± 0.7 mm (Section 4.1.4)
EFusion = 0.4 ± 0.3 mm (Section 4.2.3)
E4DCT = 0.9 ± 0.3 mm (Section 4.3.2)
EGating = 0.4 ± 0.5 mm (Section 4.4.3)
Etotal = 1.2 ± 1.0 mm
Even looking at the corrected positions of the patients, the detected offset
from the isocenter is larger, being 3.3 ± 2.5 mm. The difference in positioning
ability can be attributed to patient motion and internal shifts of the fiducial
markers, but could have been reduced for some cases, as in Figures 4-17 and 4-
18. It should be noted that the largest observed shifts for both the phantom and
patients were in the SI direction, which has been attributed mainly to the
resolution of the CT scan and the primary axis of motion of the target. However,
the shifts in the AP and lateral directions on the patient were also non-negligible.
Due to the limitations of the axis of motion of the phantom, a direct comparison
of tumors moving along multiple axes was not possible, although these directions
88
should not be neglected. As Chapter 1 discussed, motion in these directions can
still occur.
Figure 4-17: Two patient positioning X-rays of the same patient on different
treatment days. A well contrasted image (A) shows the implanted markers clearly
on a background of the patient anatomy. An improperly warmed up X-ray tube
(B) can result in a salt-and-pepper images that can cause difficulty in localizing
the implanted markers.
Figure 4-18: Two patient positioning X-rays of same patient on different
treatment days, showing effect of beam energy. Correctly chosen beam
parameters (kV, ms, mA) will result in a contrasted image, where implanted
A B
A B
89
markers can be detected easily (A). Improperly selected parameters can result in
an oversaturated image, where markers are not readily visible against the
anatomy of the patient.
The uncertainty in determining the center of mass of the internal markers
can partly be attributed to the CT scan and the resolution used, but due to less
rigidly structured markers, localization may vary from patient to patient and over
the treatment period. The user input plays a large role in the final determined
shift, as fiducials can be much easier to delineate in a phantom. The center of
mass is chosen by the user, and may be difficult to determine for markers that
have a less than rigid structure.
However, even with slight user input fluctuations, the ExacTrac® system
shows itself to be a suitable tool for accurately positioning for treatments.
90
REFERENCES
[1] H. Yan, F.F. Yin, J.H. Kim, A phantom study on the positioning accuracy of
the Novalis Body system, Med Phys, 30 (2003) 3052-3060.
91
Chapter 5
Conclusion
5.1 Summary of Thesis
An in-depth look at overall positional accuracy of the ExacTrac®
Adaptive Gating system was presented by simulating the clinical extracranial
treatment process. A method of evaluating the individual components’
contributions to the uncertainty was based on the built-in software accompanying
the equipment and external verification through the use of a radiochromic film
study. The clinical process for SBRT treatments includes contributions from the
mechanical aspects of the linac, the CT scanning, the positioning algorithm, and
the gating parameters chosen for treatment. Each of these steps was evaluated
individually to give a quantitative assessment of the accuracy.
The mechanical isocenter was checked using the daily WL exposures over
the course of a month and the WL kit used for calibration. The effect of the CT
slice thickness was tested for both static CT scans and 4DCT scans. This was
accomplished by planning multiple treatments on scans of different slice
thicknesses. The internal marker fusion was compared to the automatic bony
anatomy fusion, and IR markers as different methods of patient positioning by
checking their ability to detect known shifts from the treatment isocenter. The
comparisons were done using two static phantoms, the ExacTrac® Gating
Phantom, and an anthropomorphic head phantom, both allowing for internal
marker inserts. Chosen because of its capacity to track internal tumors directly,
the system’s ability to determine position was adequate for the use of SBRT.
Lastly, the ability of the ExacTrac® Adaptive Gating system to irradiate a moving
stereotactic target was tested. The internal tumor amplitude and the treatment
window size were the parameters tested through the use of the hidden target test.
92
The relationship between each of these parameters and the total
uncertainty in a gated treatment can be described by combining each term in the
formula from Section 2.6 in quadrature.
Each of the parameters can be chosen from tables based on the
corresponding steps taken during the treatment process to create a unique estimate
for the total uncertainty.
All films used were interpreted by an in-house software script written in
MATLAB® to evaluate the Winston-Lutz assessment and the hidden target test,
allowing for quantification of past data taken, as well as giving a non-commercial
method of checking the system. The script allowed for enhancement beyond
qualitative checks and a precise calculation of the target’s offset with respect to
the treatment field. Many of the exposures, such as the larger window sizes and
faster moving targets would not have been readily visible without the use of
software enhancement.
The largest sources of uncertainty were determined to be the 4DCT and
the mechanical isocenter, however for tumors with large internal amplitudes
(>2.25 cm) that are treated with large gating windows (>30%) the gating
parameters can contribute 1.1 ± 1.8 mm or greater.
The interpreted results from the various experiments done on the
ExacTrac® system show that it can adequately track and target a moving
stereotactic target. The system itself includes an intrinsic amount of uncertainty,
but even when combined with the added complication of patient motion and
internal tumor shifts can accurately target within 5 mm.
5.2 Future Work
The script used for analysis of the film can be continued to be used in the
analysis of Winston-Lutz films, particularly for the daily QA checks. Rather than
checking that the system is merely within specifications, quantitative evaluation
of WL films can provide useful information regarding the calibration of the lasers.
If a systematic shift in isocenter is visible over a long period of time, a correction
93
vector can be provided by the software script to more precisely position the lasers
with respect to the radiation isocenter.
The effect of inconsistent breathing can directly translate into inferior
treatments, which can be prolonged and may require repositioning mid-treatment
if breathing becomes too erratic. Patients have the option of using feedback
through the form of goggles providing a visualization of their own breath trace in
the ExacTrac® Adaptive Gating System. A study by Linthout et al. has looked at
the effect of using audio-visual feedback on treatment time optimization [39]. In
addition to increasing treatment time, an irregular breathing pattern can reduce
correlation between the internal and external markers and could have a direct
effect on the accuracy of the system. Fiducial markers may shift and contort
internally, and a beneficial study with the ExacTrac® Adaptive Gating System
could be done using a deformable phantom with a programmable breath trace. A
hidden target test could then be done to evaluate the system accuracy under these
conditions.
Lastly, only liver SBRT patients were evaluated, due to a relative lack of
gated SBRT patients at the McGill University Health Centre. A further patient
study could be extended to include other important areas of treatment, particularly
the lung. The software script and phantom studies can be applied to different
treatment parameters, and a comparison of treatments in the lung would be useful
knowledge.
The ExacTrac® system has proved to be a useful device for accurate gated
SBRT procedures, and has many opportunities to be utilized for years to come.
The completed experiments have tested the accuracy of the system under certain
circumstances, but expanding this work would surely benefit hospitals and
patients worldwide.
94
REFERENCES
[1] L. Marrett, Canadian Cancer Society's Steering Committee: Canadian Cancer
Statistics 2010. Toronto: Canadian Cancer Society, 2010., in, 2010.
[2] L. Leksell, The stereotaxic method and radiosurgery of the brain, Acta Chir
Scand, 102 (1951) 316-319.
[3] L. Leksell, Cerebral radiosurgery. I. Gammathalanotomy in two cases of
intractable pain, Acta Chir Scand, 134 (1968) 585-595.
[4] H. Blomgren, I. Lax, I. Naslund, R. Svanstrom, Stereotactic high dose fraction
radiation therapy of extracranial tumors using an accelerator. Clinical experience
of the first thirty-one patients, Acta Oncol, 34 (1995) 861-870.
[5] S. Ryu, F. Fang Yin, J. Rock, J. Zhu, A. Chu, E. Kagan, L. Rogers, M.
Ajlouni, M. Rosenblum, J.H. Kim, Image-guided and intensity-modulated
radiosurgery for patients with spinal metastasis, Cancer, 97 (2003) 2013-2018.
[6] M.C. Schell, F.J. Bova, L.D. A., L.D. D., AAPM Report No. 54 Stereotactic
Radiosurgery Report of Task Group 42, 1995.
[7] S.H. Benedict, K.M. Yenice, D. Followill, J.M. Galvin, W. Hinson, B.
Kavanagh, P. Keall, M. Lovelock, S. Meeks, L. Papiez, T. Purdie, R. Sadagopan,
M.C. Schell, B. Salter, D.J. Schlesinger, A.S. Shiu, T. Solberg, D.Y. Song, V.
Stieber, R. Timmerman, W.A. Tome, D. Verellen, L. Wang, F.F. Yin, Stereotactic
body radiation therapy: the report of AAPM Task Group 101, Med Phys, 37
(2010) 4078-4101.
[8] M. Goitein, Radiation oncology : a physicist's-eye view, Springer, New York,
2008.
[9] Y. Seppenwoolde, H. Shirato, K. Kitamura, S. Shimizu, M. van Herk, J.V.
Lebesque, K. Miyasaka, Precise and real-time measurement of 3D tumor motion
in lung due to breathing and heartbeat, measured during radiotherapy, Int J Radiat
Oncol Biol Phys, 53 (2002) 822-834.
[10] Q.S. Chen, M.S. Weinhous, F.C. Deibel, J.P. Ciezki, R.M. Macklis,
Fluoroscopic study of tumor motion due to breathing: facilitating precise radiation
therapy for lung cancer patients, Med Phys, 28 (2001) 1850-1856.
[11] P.J. Keall, G.S. Mageras, J.M. Balter, R.S. Emery, K.M. Forster, S.B. Jiang,
J.M. Kapatoes, D.A. Low, M.J. Murphy, B.R. Murray, C.R. Ramsey, M.B. Van
Herk, S.S. Vedam, J.W. Wong, E. Yorke, The management of respiratory motion
in radiation oncology report of AAPM Task Group 76, Med Phys, 33 (2006)
3874-3900.
[12] S.C. Davies, A.L. Hill, R.B. Holmes, M. Halliwell, P.C. Jackson, Ultrasound
quantitation of respiratory organ motion in the upper abdomen, Br J Radiol, 67
(1994) 1096-1102.
[13] R.M. Cardinale, Q. Wu, S.H. Benedict, B.D. Kavanagh, E. Bump, R. Mohan,
Determining the optimal block margin on the planning target volume for
extracranial stereotactic radiotherapy, Int J Radiat Oncol Biol Phys, 45 (1999)
515-520.
[14] J.F. Fowler, W.A. Tome, J.D. Fenwick, M.P. Mehta, A challenge to
traditional radiation oncology, Int J Radiat Oncol Biol Phys, 60 (2004) 1241-
1256.
95
[15] T. Naruke, T. Goya, R. Tsuchiya, K. Suemasu, Prognosis and survival in
resected lung carcinoma based on the new international staging system, J Thorac
Cardiovasc Surg, 96 (1988) 440-447.
[16] N.M. Wink, M. Chao, J. Antony, L. Xing, Individualized gating windows
based on four-dimensional CT information for respiration-gated radiotherapy,
Phys Med Biol, 53 (2008) 165-175.
[17] R. Timmerman, L. Xing, Image-Guided and Adaptive Radiation Therapy, 1st
ed., Lippincott Williams & Wilkins, Philadelphia, PA, 2010.
[18] W. Lutz, K.R. Winston, N. Maleki, A system for stereotactic radiosurgery
with a linear accelerator, Int J Radiat Oncol Biol Phys, 14 (1988) 373-381.
[19] D. Verellen, G. Soete, N. Linthout, S. Van Acker, P. De Roover, V. Vinh-
Hung, J. Van de Steene, G. Storme, Quality assurance of a system for improved
target localization and patient set-up that combines real-time infrared tracking and
stereoscopic X-ray imaging, Radiother Oncol, 67 (2003) 129-141.
[20] H. Yan, F.F. Yin, J.H. Kim, A phantom study on the positioning accuracy of
the Novalis Body system, Med Phys, 30 (2003) 3052-3060.
[21] N. Hayashi, Y. Obata, Y. Uchiyama, Y. Mori, C. Hashizume, T. Kobayashi,
Assessment of spatial uncertainties in the radiotherapy process with the Novalis
system, Int J Radiat Oncol Biol Phys, 75 (2009) 549-557.
[22] T. Takakura, T. Mizowaki, M. Nakata, S. Yano, T. Fujimoto, Y. Miyabe, M.
Nakamura, M. Hiraoka, The geometric accuracy of frameless stereotactic
radiosurgery using a 6D robotic couch system, Phys Med Biol, 55 (2010) 1-10.
[23] R.E. Wurm, S. Erbel, I. Schwenkert, F. Gum, D. Agaoglu, R. Schild, L.
Schlenger, D. Scheffler, M. Brock, V. Budach, Novalis frameless image-guided
noninvasive radiosurgery: initial experience, Neurosurgery, 62 (2008) A11-17;
discussion A17-18.
[24] J. Kim, J.Y. Jin, N. Walls, T. Nurushev, B. Movsas, I.J. Chetty, S. Ryu,
Image-guided localization accuracy of stereoscopic planar and volumetric
imaging methods for stereotactic radiation surgery and stereotactic body radiation
therapy: a phantom study, Int J Radiat Oncol Biol Phys, 79 (2011) 1588-1596.
[25] J. Ma, Z. Chang, Z. Wang, Q. Jackie Wu, J.P. Kirkpatrick, F.F. Yin,
ExacTrac X-ray 6 degree-of-freedom image-guidance for intracranial non-
invasive stereotactic radiotherapy: comparison with kilo-voltage cone-beam CT,
Radiother Oncol, 93 (2009) 602-608.
[26] L.T. Wang, T.D. Solberg, P.M. Medin, R. Boone, Infrared patient positioning
for stereotactic radiosurgery of extracranial tumors, Comput Biol Med, 31 (2001)
101-111.
[27] S.E. Tenn, T.D. Solberg, P.M. Medin, Targeting accuracy of an image
guided gating system for stereotactic body radiotherapy, Phys Med Biol, 50
(2005) 5443-5462.
[28] T.R. Willoughby, A.R. Forbes, D. Buchholz, K.M. Langen, T.H. Wagner,
O.A. Zeidan, P.A. Kupelian, S.L. Meeks, Evaluation of an infrared camera and X-
ray system using implanted fiducials in patients with lung tumors for gated
radiation therapy, Int J Radiat Oncol Biol Phys, 66 (2006) 568-575.
96
[29] A.E. Lujan, E.W. Larsen, J.M. Balter, R.K. Ten Haken, A method for
incorporating organ motion due to breathing into 3D dose calculations, Med Phys,
26 (1999) 715-720.
[30] R.E. Wurm, F. Gum, S. Erbel, L. Schlenger, D. Scheffler, D. Agaoglu, R.
Schild, B. Gebauer, P. Rogalla, M. Plotkin, K. Ocran, V. Budach, Image guided
respiratory gated hypofractionated Stereotactic Body Radiation Therapy (H-
SBRT) for liver and lung tumors: Initial experience, Acta Oncol, 45 (2006) 881-
889.
[31] International Commission on Radiation Units and Measurements.,
Prescribing, recording, and reporting photon beam therapy, International
Commission on Radiation Units and Measurements, Bethesda, MD, 1993.
[32] J. Wulf, U. Hadinger, U. Oppitz, W. Thiele, R. Ness-Dourdoumas, M.
Flentje, Stereotactic radiotherapy of targets in the lung and liver, Strahlenther
Onkol, 177 (2001) 645-655.
[33] M.H. Bilsky, Y. Yamada, K.M. Yenice, M. Lovelock, M. Hunt, P.H. Gutin,
S.A. Leibel, Intensity-modulated stereotactic radiotherapy of paraspinal tumors: a
preliminary report, Neurosurgery, 54 (2004) 823-830; discussion 830-821.
[34] B.N. Taylor, C.E. Kuyatt, Guidelines for evaluating and expressing the
uncertainty of NIST measurement results, 1994 ed., U.S. Department of
Commerce, Technology Administration, National Institute of Standards and
Technology, Gaithersburg, MD, 1994.
[35] R.R. Johnson, Elementary statistics, 2d ed., Duxbury Press, North Scituate,
Mass., 1976.
[36] S.R. Cherry, J.A. Sorenson, M.E. Phelps, Physics in nuclear medicine, 3rd
ed., Saunders, Philadelphia, PA, 2003.
[37] F.M. Khan, The physics of radiation therapy, 4th ed., Lippincott Williams &
Wilkins, Philadelphia, 2010.
[38] M. Riboldi, G. Baroni, M.F. Spadea, F. Bassanini, B. Tagaste, C. Garibaldi,
R. Orecchia, A. Pedotti, Robust frameless stereotactic localization in extra-cranial
radiotherapy, Med Phys, 33 (2006) 1141-1152.
[39] N. Linthout, S. Bral, I. Van de Vondel, D. Verellen, K. Tournel, T. Gevaert,
M. Duchateau, T. Reynders, G. Storme, Treatment delivery time optimization of
respiratory gated radiation therapy by application of audio-visual feedback,
Radiother Oncol, 91 (2009) 330-335.
[40] J.J. Sonke, M. Rossi, J. Wolthaus, M. van Herk, E. Damen, J. Belderbos,
Frameless stereotactic body radiotherapy for lung cancer using four-dimensional
cone beam CT guidance, Int J Radiat Oncol Biol Phys, 74 (2009) 567-574.
[41] M. Guckenberger, T. Krieger, A. Richter, K. Baier, J. Wilbert, R.A.
Sweeney, M. Flentje, Potential of image-guidance, gating and real-time tracking
to improve accuracy in pulmonary stereotactic body radiotherapy, Radiother
Oncol, 91 (2009) 288-295.
[42] E. Rietzel, T. Pan, G.T. Chen, Four-dimensional computed tomography:
image formation and clinical protocol, Med Phys, 32 (2005) 874-889.
[43] P. Thevenaz, U.E. Ruttimann, M. Unser, A pyramid approach to subpixel
registration based on intensity, IEEE Trans Image Process, 7 (1998) 27-41.
97
BIBLIOGRAPHY
Benedict, S. H., K. M. Yenice, et al. (2010). "Stereotactic body radiation therapy:
the report of AAPM Task Group 101." Medical physics 37(8): 4078-4101.
[3, 5, 24, 32, 33]
Bilsky, M. H., Y. Yamada, et al. (2004). "Intensity-modulated stereotactic
radiotherapy of paraspinal tumors: a preliminary report." Neurosurgery
54(4): 823-830; discussion 830-821. [24]
Blomgren, H., I. Lax, et al. (1995). "Stereotactic high dose fraction radiation
therapy of extracranial tumors using an accelerator. Clinical experience of
the first thirty-one patients." Acta oncologica 34(6): 861-870. [2]
Cardinale, R. M., Q. Wu, et al. (1999). "Determining the optimal block margin on
the planning target volume for extracranial stereotactic radiotherapy."
International journal of radiation oncology, biology, physics 45(2): 515-
520. [5]
Chen, Q. S., M. S. Weinhous, et al. (2001). "Fluoroscopic study of tumor motion
due to breathing: facilitating precise radiation therapy for lung cancer
patients." Medical physics 28(9): 1850-1856. [5]
Cherry, S. R., J. A. Sorenson, et al. (2003). Physics in nuclear medicine.
Philadelphia, PA, Saunders. [27]
Davies, S. C., A. L. Hill, et al. (1994). "Ultrasound quantitation of respiratory
organ motion in the upper abdomen." The British journal of radiology
67(803): 1096-1102. [5]
Fowler, J. F., W. A. Tome, et al. (2004). "A challenge to traditional radiation
oncology." International journal of radiation oncology, biology, physics
60(4): 1241-1256. [5]
Goitein, M. (2008). Radiation oncology : a physicist's-eye view. New York,
Springer. [4, 25, 27]
Guckenberger, M., T. Krieger, et al. (2009). "Potential of image-guidance, gating
and real-time tracking to improve accuracy in pulmonary stereotactic body
98
radiotherapy." Radiotherapy and oncology : journal of the European
Society for Therapeutic Radiology and Oncology 91(3): 288-295. [32]
Hayashi, N., Y. Obata, et al. (2009). "Assessment of spatial uncertainties in the
radiotherapy process with the Novalis system." International journal of
radiation oncology, biology, physics 75(2): 549-557. [15, 16]
International Commission on Radiation Units and Measurements. (1993).
Prescribing, recording, and reporting photon beam therapy. Bethesda, MD,
International Commission on Radiation Units and Measurements. [23, 24]
Johnson, R. R. (1976). Elementary statistics. North Scituate, Mass., Duxbury
Press. [27]
Keall, P. J., G. S. Mageras, et al. (2006). "The management of respiratory motion
in radiation oncology report of AAPM Task Group 76." Medical physics
33(10): 3874-3900. [5]
Khan, F. M. (2010). The physics of radiation therapy. Philadelphia, Lippincott
Williams & Wilkins. [28]
Kim, J., J. Y. Jin, et al. (2011). "Image-guided localization accuracy of
stereoscopic planar and volumetric imaging methods for stereotactic
radiation surgery and stereotactic body radiation therapy: a phantom
study." International journal of radiation oncology, biology, physics 79(5):
1588-1596. [15]
Leksell, L. (1951). "The stereotaxic method and radiosurgery of the brain." Acta
chirurgica Scandinavica 102(4): 316-319. [1]
Leksell, L. (1968). "Cerebral radiosurgery. I. Gammathalanotomy in two cases of
intractable pain." Acta chirurgica Scandinavica 134(8): 585-595. [2]
Linthout, N., S. Bral, et al. (2009). "Treatment delivery time optimization of
respiratory gated radiation therapy by application of audio-visual
feedback." Radiotherapy and oncology : journal of the European Society
for Therapeutic Radiology and Oncology 91(3): 330-335. [32, 93]
Lujan, A. E., E. W. Larsen, et al. (1999). "A method for incorporating organ
motion due to breathing into 3D dose calculations." Medical physics
26(5): 715-720. [17, 30]
99
Lutz, W., K. R. Winston, et al. (1988). "A system for stereotactic radiosurgery
with a linear accelerator." International journal of radiation oncology,
biology, physics 14(2): 373-381. [12]
Ma, J., Z. Chang, et al. (2009). "ExacTrac X-ray 6 degree-of-freedom image-
guidance for intracranial non-invasive stereotactic radiotherapy:
comparison with kilo-voltage cone-beam CT." Radiotherapy and oncology
: journal of the European Society for Therapeutic Radiology and Oncology
93(3): 602-608. [15]
Marrett, L. (2010). Canadian Cancer Society's Steering Committee: Canadian
Cancer Statistics 2010. Toronto: Canadian Cancer Society, 2010. [1]
Naruke, T., T. Goya, et al. (1988). "Prognosis and survival in resected lung
carcinoma based on the new international staging system." The Journal of
thoracic and cardiovascular surgery 96(3): 440-447. [6]
Riboldi, M., G. Baroni, et al. (2006). "Robust frameless stereotactic localization
in extra-cranial radiotherapy." Medical physics 33(4): 1141-1152. [31, 38]
Rietzel, E., T. Pan, et al. (2005). "Four-dimensional computed tomography: image
formation and clinical protocol." Medical physics 32(4): 874-889. [34, 35]
Ryu, S., F. Fang Yin, et al. (2003). "Image-guided and intensity-modulated
radiosurgery for patients with spinal metastasis." Cancer 97(8): 2013-
2018. [2]
Schell, M. C., F. J. Bova, et al. (1995). AAPM Report No. 54 Stereotactic
Radiosurgery Report of Task Group 42. [3]
Seppenwoolde, Y., H. Shirato, et al. (2002). "Precise and real-time measurement
of 3D tumor motion in lung due to breathing and heartbeat, measured
during radiotherapy." International journal of radiation oncology, biology,
physics 53(4): 822-834. [5]
Sonke, J. J., M. Rossi, et al. (2009). "Frameless stereotactic body radiotherapy for
lung cancer using four-dimensional cone beam CT guidance."
International journal of radiation oncology, biology, physics 74(2): 567-
574. [32]
100
Takakura, T., T. Mizowaki, et al. (2010). "The geometric accuracy of frameless
stereotactic radiosurgery using a 6D robotic couch system." Physics in
medicine and biology 55(1): 1-10. [15]
Taylor, B. N. and C. E. Kuyatt (1994). Guidelines for evaluating and expressing
the uncertainty of NIST measurement results. Gaithersburg, MD, U.S.
Department of Commerce, Technology Administration, National Institute
of Standards and Technology. [26, 27]
Tenn, S. E., T. D. Solberg, et al. (2005). "Targeting accuracy of an image guided
gating system for stereotactic body radiotherapy." Physics in medicine and
biology 50(23): 5443-5462. [16, 17]
Thevenaz, P., U. E. Ruttimann, et al. (1998). "A pyramid approach to subpixel
registration based on intensity." IEEE transactions on image processing : a
publication of the IEEE Signal Processing Society 7(1): 27-41. [39]
Timmerman, R. and L. Xing (2010). Image-Guided and Adaptive Radiation
Therapy. Philadelphia, PA, Lippincott Williams & Wilkins. [12, 30]
Verellen, D., G. Soete, et al. (2003). "Quality assurance of a system for improved
target localization and patient set-up that combines real-time infrared
tracking and stereoscopic X-ray imaging." Radiotherapy and oncology :
journal of the European Society for Therapeutic Radiology and Oncology
67(1): 129-141. [14, 15, 16]
Wang, L. T., T. D. Solberg, et al. (2001). "Infrared patient positioning for
stereotactic radiosurgery of extracranial tumors." Computers in biology
and medicine 31(2): 101-111. [15]
Willoughby, T. R., A. R. Forbes, et al. (2006). "Evaluation of an infrared camera
and X-ray system using implanted fiducials in patients with lung tumors
for gated radiation therapy." International journal of radiation oncology,
biology, physics 66(2): 568-575. [16]
Wink, N. M., M. Chao, et al. (2008). "Individualized gating windows based on
four-dimensional CT information for respiration-gated radiotherapy."
Physics in medicine and biology 53(1): 165-175. [12, 32]
101
Wulf, J., U. Hadinger, et al. (2001). "Stereotactic radiotherapy of targets in the
lung and liver." Strahlentherapie und Onkologie : Organ der Deutschen
Rontgengesellschaft ... [et al] 177(12): 645-655. [24]
Wurm, R. E., S. Erbel, et al. (2008). "Novalis frameless image-guided
noninvasive radiosurgery: initial experience." Neurosurgery 62(5 Suppl):
A11-17; discussion A17-18. [15]
Wurm, R. E., F. Gum, et al. (2006). "Image guided respiratory gated
hypofractionated Stereotactic Body Radiation Therapy (H-SBRT) for liver
and lung tumors: Initial experience." Acta oncologica 45(7): 881-889. [17]
Yan, H., F. F. Yin, et al. (2003). "A phantom study on the positioning accuracy of
the Novalis Body system." Medical physics 30(12): 3052-3060. [14, 16,
34, 78]