52
Student Guide Validation of TxDOT Flexible Pavement Skid Prediction Model: Workshop Published: May 2017 Product 0-6746-01-P2

Student Guide
Validation of TxDOT Flexible Pavement Skid Prediction Model:
Workshop Published: May 2017
Product 0-6746-01-P2


VALIDATION OF TXDOT FLEXIBLE PAVEMENT SKID PREDICTION MODEL: WORKSHOP
by
Arif Chowdhury Assistant Research Engineer
Texas A&M Transportation Institute
Product 0-6746-01-P2 Project 0-6746-01
Project Title: Validation of TxDOT Flexible Pavement Skid Prediction Model
Performed in cooperation with the Texas Department of Transportation
and the Federal Highway Administration
Published: May 2017
TEXAS A&M TRANSPORTATION INSTITUTE College Station, Texas 77843-3135


1
TxDOT Flexible Pavement Skid Prediction Model: Workshop
Date: TBD Location: TxDOT Construction Division, Cedar Park, Texas Contacts: Arif Chowdhury, [email protected], 210-321-1210
Agenda
Time Module Instructor
Course Materials:
• Background summary of Research Project 0-5627. • Short presentation of research tasks and findings from Research Project
0-6746. • Aggregate characterization with Aggregate Imaging Measurement System
(AIMS) and Micro-Deval device. • Demonstration of Skid Analysis of Asphalt Pavement (SAAP) software
(installation, new features). • Several examples that run the revised program, including hot-mix asphalt
(HMA), seal coat, aggregate sources and properties, aggregate combinations, average annual daily traffic (AADT), and truck traffic.
• Limitations of SAAP. • Future work. • Open discussion.


3
Module 1: Background and Research Findings of
TxDOT Research Project 0-5627 and
TxDOT Research Project 0-6746
PowerPoint Presentation

4

5

6

7

8

9

10

11

12

13

14

15

16

17

18

19

20

21
22

23

24

25

26

27


29
Module 2: Aggregate Characterization
Aggregate Polishing with Micro-Deval Aggregate Image Measurements System


31
Module 3: SAAP User Guide
Research Report 0-6746-1 documents the research effort and the skid prediction models for asphalt mixtures and seal coat surfaces, respectively, under TxDOT Research Project 0-6746. Both of these models feature similar inputs and equations with only minor variations. In order to simplify the calculation of predicted skid numbers, a desktop computer application was developed based on the macro tool developed earlier under Research Project 0-5627. Under the follow-up study, Research Project 0-6746, a computer application named SAAP was developed using Access-based Visual Basic Application (VBA) language to execute the steps needed to calculate the skid resistance of asphalt pavement as a function of traffic. This section describes the program and the steps needed to calculate the pavement skid resistance for both asphalt mixture surfaces and seal coat surfaces. In the folder named Application, the application has two Microsoft Access files—an application file and a data file—and another folder called Export. Once the user opens the application file by double clicking, he/she will notice the first page (Figure 1). This “About” page describes the function of the SAAP application. On the next page (Figure 2), the user needs to input a new project name or select one of the existing projects in order to proceed to the next window. Next, the user selects the type of pavement surface (Figure 3)—asphalt mixture or surface treatment. Depending on the type of surface selected, the application uses the appropriate prediction model. The inputs for both asphalt mixtures and seal coat surfaces are similar. In the next step (Figure 4), the mixture gradation is inputted to the application. The user can either enter the gradation or select one of the standard mixture gradations used in the state of Texas. Similarly, if surface treatment is selected as the pavement surface, the user can either enter the gradation or select the standard aggregate grade. If the user elects to enter the gradation manually by selecting the Input Gradation radio button, a separate window pops up (Figure 5), where the amount of percent passing for selected sieves is entered. The user can select any number of sieves (minimum four) and enter the percent passing values for each selected sieve. This information is used to calculate the scale and shape factors (λ and κ) of the combined gradation.

32
Figure 1. Initial Window of the Program.
Figure 2. Project Name Input.

33
Figure 3. Pavement Surface Type Input.
Figure 4. Choice of Mixture Type.

34
Figure 5. Manual Aggregate Gradation Input.
In the next few steps, the aggregate texture and angularity values measured using AIMS are entered. The window shown in Figure 6 provides the option to input either the texture/angularity measured at two points (before polishing and after polishing for 105 minutes in the Micro-Deval) or the texture/angularity measured at three points (before polishing, after polishing for 105 minutes in the Micro-Deval, and after polishing for 180 minutes). The use of three data points provides a more accurate estimation of aggregate resistance to polishing. This step will be followed by the appearance of windows to enter the texture data of aggregates from one or more sources. The user can select up to three aggregate sources used in the mixture. As shown in Figure 7, users can input the texture value of the component aggregate source(s). In the same window, the user needs to input the percentage ratio of each aggregate source relative to the combined gradation and the percent retained on the No. 4 sieve for each of the sources. This information is required to calculate the weighted average of texture and angularity of combined gradation when two or more aggregate sources are used. Figure 8 shows the window that pops up if the user opts for three data points (Figure 6). Similar to Figure 7, the user inputs the ratio of aggregate in combined

35
gradation and amount of percent retained on the No. 4 sieve for each source as well as the texture data measured by AIMS at three different polishing levels. For the next step, the user inputs aggregate angularity data similar to aggregate texture data. The screen shown in Figure 9 or Figure 10 pops up, depending on whether the user selected two data points or three data points for the texture/angularity measurement (Figure 6).
Figure 6. Selection of AIMS Test Data Points.
Figure 7. Aggregate Texture Input for Two Data Points.

36
Figure 8. Aggregate Texture Input for Three Data Points.
Figure 9. Aggregate Angularity Input for Two Data Points.

37
Figure 10. Aggregate Angularity Input for Three Data Points.
Once the user enters the aggregate angularity data and clicks the Next button, a new window (Figure 11) appears. At this stage, the user enters the mean profile depth (MPD) of the pavement. There are two options: the user can enter the MPD value or let SAAP estimate the MPD values. The user can input the measure of MPD for that particular mixture or grade (seal coat). It is preferred to have the measurement done at the initial stage of the pavement’s service life. The SAAP projects the reduction of the MPD throughout its service life based on the traffic count. Alternately, the user can select the SAAP estimation option. That way, SAAP estimates the MPD values based on the shape and scale factors calculated from combined aggregate gradation and traffic count.

38
Figure 11. Mean Profile Depth Input.
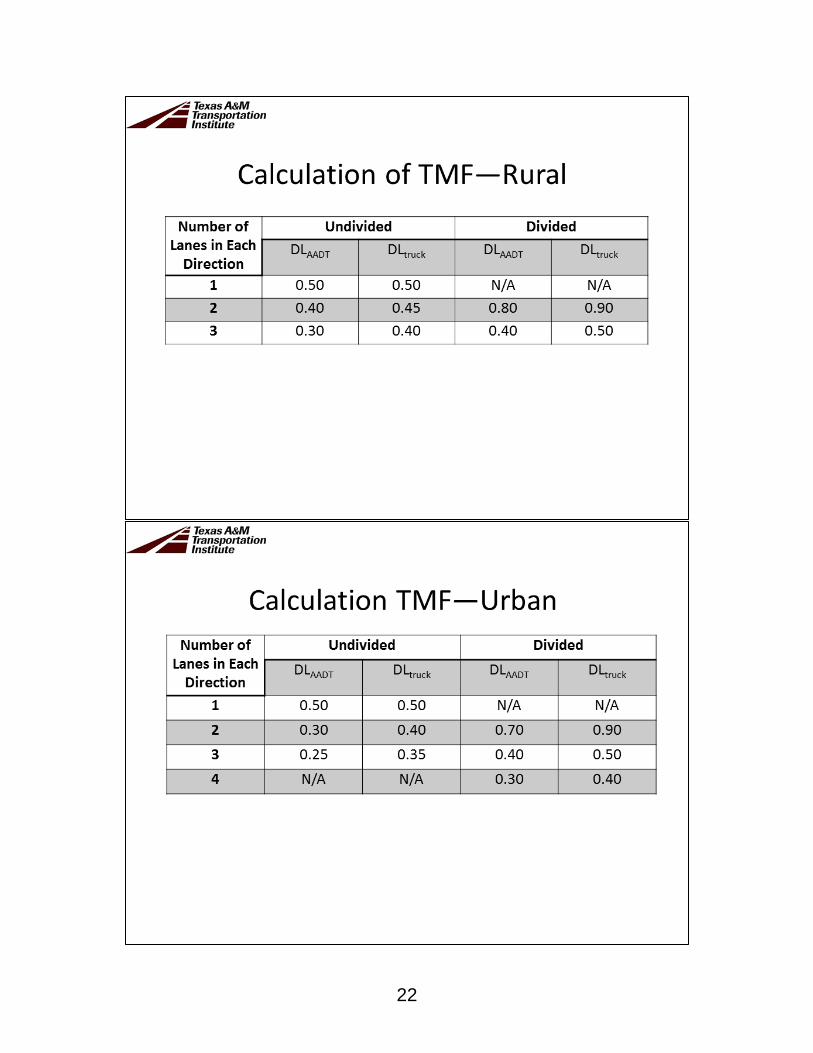
After entering the MPD information, the user inputs the highway configuration and traffic data (Figure 12). In this step, the user enters the information about the highway type (rural/urban or divided/undivided), the total number of through traffic lanes in each direction, the total AADT for both directions (for undivided highway, K roadbed) or the AADT for each direction (for divided highway, R or L roadbed), and the percent truck traffic (Figure 12). Using this information, the application calculates the adjusted AADT for the design lane. Again, the adjusted AADT is used to calculate the Traffic Multiplication Factor (TMF). Please note that the current application does not consider the traffic growth factor. When the user clicks the Next button, as shown in Figure 12, the software generates the skid number for 15 years at 1-year intervals starting from Year 1.

39
Figure 12. Highway Type and Traffic Data Input.
The next step (Figure 13) in the software provides options on how the user wants to see the output. In this window, there are three options for the display of results. The first option is to obtain a prediction of skid resistance as a function of years in service (up to 15 years). This chart also contains the project and prediction (iteration) number in the top left corner. The user can also print the chart by clicking the Print tab (Figure 14).

40
Figure 13. Output Data Display Options.

41
Figure 14. Skid Prediction Chart for 15 Years.
The second option is to get a classification of the pavement section based on its skid resistance after a specified number of years and corresponding threshold values. If the user selects “Classify an Asphalt Pavement Section Based on Its Skid Resistance,” a window (Figure 15) pops up in which the user needs to input some additional information required for pavement classification. These input parameters are:
• The length of service life in years for which a pavement section will be classified.
• The skid resistance threshold values based on how a pavement section will be classified (Figure 14). The first threshold value is the acceptable skid number above which the designer is not concerned. The second threshold value is the skid number above which (but below the acceptable value) one should monitor the surface condition more frequently and below which one should take corrective measure to restore surface friction.
After clicking on the Set button, a window with the pavement classification will be presented (Figure 16). Depending on the predicted skid number at the end of

42
service life and designer-selected threshold values, the pavement skid performance is classified as high, medium, or low. For display purposes, the high, medium, and low skid performances are shown in a green, yellow, and red bar chart, respectively.
Figure 15. Selection of Thresholds or Aggregate Classification.

43
Figure 16. Sample Aggregate Classification Based on Skid Performance.
The third option for displaying the data is to export the input and output data into a Microsoft Excel spreadsheet. By clicking this button, the user can export the input and output file in a separate folder. Once the user selects this option, a new window (Figure 17. Saving Input and Output Spreadsheet Files. opens. The user has the option to change the input file name and the location folder. Once the input file is saved, the same window provides the option to save the output file, where the user can save the output file in a different name and location folder. Figure 18. Sample Input Spreadsheet. and Figure 19. Sample Output Spreadsheet. show sample input and output data in a spreadsheet. The Input file records all the data or preferences selected by the user, including the comments. The output file shows the projected skid number, IFI, MPD, and adjusted traffic count for each year starting from Year 1 to 15. The application can be terminated by clicking the Exit Application button. The application saves all the input data entered previously. The user can also navigate through the application by clicking the tabs located on top of the windows. Detailed information regarding the development of these models and software can be found in Research Report FHWA/TX-17/0-6746-1, “Validation of Asphalt Mixture Pavement Skid Prediction Model and Development of Skid Prediction Model for Surface Treatments” at http://tti.tamu.edu/documents/0-6746-1.pdf.

44
Figure 17. Saving Input and Output Spreadsheet Files.
Figure 18. Sample Input Spreadsheet.

45
Figure 19. Sample Output Spreadsheet.


47
Limitations of SAAP The limitations of SAAP include the following:
• Software cannot be used to predict the skid resistance of concrete pavement. • Software can handle up to three aggregate sources but can be modified to
include more sources. • Software cannot handle mixture with Recycled Asphalt Pavement (RAP) or
Lime Rock Asphalt (LRA). AIMS cannot characterize them. • Prediction model is based on skid number measured at 50 mph and with
smooth tires. Calibration of models is required for different conditions. • AIMS characterization (texture especially) of multicolored rocks is
challenging. • Skid prediction does not work for pavements with excessive bleeding and
flushing. • Aggregates passing a No. 4 sieve have no effect. They can be modified down
to a No. 8 sieve, though. The limiting factor is the ability of AIMS to characterize the texture of aggregate smaller sizes.
• Traffic growth factor was not included in the cumulative traffic calculation, but it can be modified in the future.
• Lane distribution factors for passenger vehicle and truck traffic are based on limited data. Future work should revisit this issue.
• Default shape and scale factors (λ & κ) for a given mixture gradation were calculated based on a gradation curve passing through the middle of the respective gradation band. Inputting the actual combined aggregate gradation provides the most accurate shape and scale factor.


