56
EUR 24496 EN - 2010 Validation Protocol for Emergency Response Geo-information Products Marco Broglia, Christina Corbane, Daniela Carrion , Guido Lemoine and Martino Pesaresi

EUR 24496 EN - 2010
Validation Protocol for Emergency Response Geo-information Products
Marco Broglia Christina Corbane Daniela Carrion Guido Lemoine and Martino Pesaresi
The mission of the JRC-IPSC is to provide research results and to support EU policy-makers in their effort towards global security and towards protection of European citizens from accidents deliberate attacks fraud and illegal actions against EU policies European Commission Joint Research Centre Institute for the Protection and Security of the Citizen Contact information Address JRC - TP 267 - Via E Fermi 2749 - 21027 Ispra (VA) Italy E-mail marcobrogliajrceceuropaeu Tel +39 0332 785435 Fax +39 0332 785154 httpipscjrceceuropaeu httpwwwjrceceuropaeu Legal Notice Neither the European Commission nor any person acting on behalf of the Commission is responsible for the use which might be made of this publication
Europe Direct is a service to help you find answers
to your questions about the European Union
Freephone number () 00 800 6 7 8 9 10 11
() Certain mobile telephone operators do not allow access to 00 800 numbers or these calls may be billed
A great deal of additional information on the European Union is available on the Internet It can be accessed through the Europa server httpeuropaeu JRC 59838 EUR 24496 EN ISBN 978-92-79-16428-6 ISSN 1018-5593 doi10278863690 Luxembourg Publications Office of the European Union copy European Union 2010 Reproduction is authorised provided the source is acknowledged Printed in Italy
1
TABLE OF CONTENTS
1 INTRODUCTION 2
2 OBJECTIVES OF THE VALIDATION PROTOCOL 3
3 VALIDATION TERMINOLOGY 3
31 Data information and geo-information 3 32 Product service attributes and parameters 4 33 Validation 4
4 THE VALIDATION PROCESS 6
41 Information sources for validation 6 411 Comparison with ground truth data 6 412 Comparison with reference data 6 413 Product inter-comparison 7
42 Validation on sample basis 7 43 Exercises past and live events (full scale real conditions) 8 44 Validation ranges 9 45 The validation model and its criteria 10
451 Reliability of the information contents 10 452 Consistency of the information support 12 453 Usability of the product 13 454 Efficiency of the service 13
46 Analytical description of attributes to be validated 15 461 Reliability of the information content 15 462 Consistency of the information support 24 463 Usability of the product 31 464 Efficiency of the service 40 465 Validation summary checklist 42 466 Sampling scheme 48
5 CONCLUSION 49
51 Main considerations upon the validation process after its implementation 49 52 Main recommendations and suggestions for next steps 49 53 concluding remarks 49
6 ACKNOWLEDGMENTS 50
7 REFERENCES 50
2
1 INTRODUCTION
Europe is making a significant effort to develop (geo)information services for crisis
management as part of the Global Monitoring for Environment and Security (GMES)
programme Recognising the importance of coordinated European response to crises and the
potential contribution of GMES the Commission launched a number of preparatory activities
in coordination with relevant stakeholders for the establishment of an Emergency Response
GMES Core Service (ERCS)
GMES Emergency Response Services will rely on information provided by advanced
technical and operational capabilities making full use of space earth observation and
supporting their integration with other sources of data and information Data and information
generated by these services can be used to enhance emergency preparedness and early
reaction to foreseeable or imminent crises and disasters
The portfolio of emergency services deals with
1) Disasters - Natural risks earthquakes and volcanic risk floods wild fires tsunami etc
2) Disasters - Technological risks major industrial accidents hazardous materials spills due
to natural disasters major transport accidents air road and sea
3) Complex and compound emergencies humanitarian consequences of conflicts
From a technical point of view the use of geo-information for emergency response poses
significant challenges for spatial data collection data management information extraction and
communication On one hand the delivery of rapid and updated but nevertheless reliable
products to end-users is considered a high-priority topic by users and providers on the other
hand in crisis situations the delivered geo-information is often ingested by the users without
having the opportunity to review its quality and accuracy Technical characteristics and
constraints related to these new technologies may show complex interactions for example the
increase of spatial resolution of satellite sensor will lead to the decrease of spatial consistency
of geo-databases generated using this sensor data With the currently available reference data
(GCP DTM) panoramic and parallax distortion of the new generation satellite data generate
a displacement error often greater than the pixel size in the final geo-information layers with
implicit effects on the quality of multi-temporal assessments and on the interoperability of the
extracted geo-information The introduction of high resolution SAR in flood mapping requires
a careful assessment of its performance especially in urban built-up etc The need for an
independent formal assessment of these products to provide operational services at
homogeneous and reliable standards has recently become recognized as an integral
component of service development The statement of ldquosomething better than nothingrdquo is no
longer valid The need for robustness quality and relevance of the information are gradually
becoming recognized as a major component of satellite derived geo-products
Validation is intended to help end-users decide how much to trust geo-information products
(maps spatial dataset) and combined with quality assurance can help to identify
improvements
The focus in this document will be on geo-information products in particular those derived
from Earth Observation data
3
ERCS services addressing different thematic applications share a number of common
characteristics
i) they address similar operational needs
ii) they produce similar outputs (eg reference maps assessment maps thematic
maps)
iii) their outputs integrated into information environments that support decision
making service
This enables the definition of a common validation framework the implementation of
validation principles and the development of a validation process as a tool to check whether
the products meet standards and user needs
2 OBJECTIVES OF THE VALIDATION PROTOCOL
The validation principles methods rules and guidelines provided in this document aim to
give a structure that guarantees an overall documented and continuous quality of ERCS
servicesproducts The goal is to ensure that all products meet the required levels of accuracy
availability and affordability requested and expected by the end-users
This validation protocol aims to define
- Rules to ensure unbiased and independent validation
- Top-level validation criteria characteristics and parameters
- The requirements for validation reference data sources
3 VALIDATION TERMINOLOGY
This chapter defines terms and some basic related concepts used in validation These terms
aim to distil a common terminology that can be used throughout GMES projects especially in
those activities that address validation (and quality assurance)
31 DATA INFORMATION AND GEO-INFORMATION
Data is a raw signal recording typically expressed as a numeric quantity Data are
registered by sensors (eg thermometertemperature gaugeswater level etc) In ERCS
satellite sensors are a prime source of data ie recordings of electromagnetic energy
reflectedbackscatteredemitted by the Earth‟s surface
Information is data with a meaning a semantic Typical examples of information are the
recording of all the damaged built-up structures in a given area a population vulnerability
index a hurricane path a flooded area
The distinction between data and information is only pragmatic When the data collection
is sufficient for our purpose then the notion of data and information coincide Information
has always equal or greater abstract semantic level than the data eg to know the amount
(extension volume) of surface water per spatial unit is data to know where are the
flooded areas (defining what we mean by that how water height we need in order to
classify it as flooded) is information
4
Geo-information is information referred to a spatial context If data and information
coincide we can also talk about geo-data
Basic proprieties of geo-information are strictly related to the reliability of the technique
we use for collecting data (sensor interview other) the reliability of the method we use to
semantically upscale data to information the precision of the spatial reference
32 PRODUCT SERVICE ATTRIBUTES AND PARAMETERS
ERCS deliver geo-information products for use in thematic applications within the emergency
response realm In the following some definitions of product validation related terms are
presented
Product is the delivered object containing geo-information Examples are a paper map a
digital map a feature set accessible via a web service etc
Process is the workflow to generate a product from input data following a number of
logical steps For example generating a fire map from input optical satellite sensor data is
defined as a process
Service is an implementation of a process put in place to generate a product and deliver it
to the user
Provider is an entity (ldquoactorrdquo) that hosts a service A provider may host one or more
services Furthermore different providers may host a service that is similar in scope
Attributes of a product a product has a set of attributes (characteristics) that determines
the product as an acceptable service output Some of these attributes can be described
quantitatively eg the positional accuracy and the thematic accuracy Others can be
described using qualitative parameters (eg readability)
Attributes of a service a service has a set of attributes (characteristics) that determine the
service as acceptable process implementation Some of these attributes can be described
quantitatively eg time to delivery Others can only be described using qualitative
parameters (eg quality of support)
Parameters are measurements to assess the attribute values The parameters can be
quantitative or qualitative For example to assess the ldquopositional accuracyrdquo attribute we
can use the ldquoRoot Mean Square Errorrdquo parameter to assess ldquoreadabilityrdquo we can use
ldquodistinguishability of symbolsrdquo and ldquocontrast between background and map themesrdquo
parameters
33 VALIDATION
Validation can be defined as ldquoa producer-independent process generating documented
evidence to which degree the object subject to validation reaches predetermined
requirementsrdquo
This synthetic definition deserves detailed comments
Validation is producer-independent the aim of validation is to provide the (usually
non-technical) user with a high level of assurance that the products meet standards and his
needs and should therefore be producer-independent
Validation is a process implies that a systematic reproducible approach (= a method) is
defined to perform validation activities
5
Documented evidence implies the definition of parameters as much as possible
quantitative parameters ie metrics that can be reported and analyzed in order to assess
the performance of a productservice
Reaches predetermined requirements validation is not an ldquoabsoluterdquo check It is a
relative check it compares the object under validation to a reference level in order to i)
justify the cost of it (verification that the characteristics of the productservice acquired is
as promised at the moment of the transaction) ii) minimize use problems (safety misuse
etc) This means that clear requirements covering all user needs are crucial for good
validation practices These requirements need to be as much quantitative as possible and
to be defined prior to the conduction of validation activities Whenever requirements are
missing or are not sufficiently detailed professional experience (ldquobest practicerdquo) and
expert knowledge shall be used The predetermined requirements also imply that
acceptable validity ranges and accepted tolerance are defined prior to the conduction of
validation activities
Validation is performed at the interface between the service provider and the end user Both
entities normally prefer that validation is performed by an entity that is independent from their
interests Validation requires in-depth knowledge of the service set-up which may be
commercially confidential Therefore a validating entity should have no commercial interest
in similar service development At the same time the validation entity must have a good
understanding of the intended end user service take-up to ensure that product requirements
have been sufficiently detailed to meet users‟ needs
SERVICE
Requires
informationUser
Validation
Validation
Provider
Surface
change
Methodology
[science]
Information
processProduct
EO data
Delivery
Event
Detectable
by
Implements Generates
Induces
Defines
Specifications
requirements
Has
attributes
Has
attributes
Provides reference
User
assessment
Input
Needs
Is subject to
Figure 1 Logical diagram of ERCS and the role of validation
6
4 THE VALIDATION PROCESS
41 INFORMATION SOURCES FOR VALIDATION
Reliability of the information contents plays a major role in the validation process To
validate spatial and thematic accuracy or consistency the general approach is to compare the
product contents with other information sources which can be classified in three main
categories
Ground truth measures
Reference data sources
Other products containing similar information (inter comparison)
411 Comparison with ground truth data
Ground truth data regarding an emergency event are collected
at the location of the event
at event time or in a temporal range during which the situation object of interest
doesn‟t change
Ground truth sources are case dependant eg ranging from ground control points collected in
a field mission to independent measurements of the event of interest (eg water level records
in the case of floods damage assessment reports (earthquakes) UNHCR field reports (refugee
camps))
This is the source that usually allows the best performances in terms of accuracy of the
validation process and also usually demands most resources
When ground truth data is required for validation a proper collection strategy (on sampling
basis) should be first developed taking into account the financial and human resources
required to undertake a substantive validation
412 Comparison with reference data
When ground truth data is not available or is difficult to collect (eg due to disaster impact)
comparison with independent reference data is needed to determine consistency
Key to any consistency assessment is the provision of representative independent reference
data that is inherently more accurate than the product to be evaluated For instance when
satellite data is used as a reference for validation it should have a higher spatial resolution
than the satellite data used to generate a product andor better spectral and radiometric
resolution
Reference data should also encompass the same time period as the information product under
validation
According to the requirements of each product the type and format as well as the spatial
temporal criteria and thematic content of the reference data to be checked will be defined in
section 46
Typical reference data sources are VHR satellite images or airborne images Increasingly
media reports are a source of event reference information
Other specific reference data sources can be models eg hydrological models for flood area
estimation or physical vulnerability models for earthquake damages estimation Of course the
7
application of a model introduces an additional step of uncertainty to the reference
information extracted from the data source
413 Product inter-comparison
Inter-comparison takes as inputs products coming from different service providers that have
information contents similar to the contents of the product under validation The products may
also be based on independent data sources (eg a flood map derived from optical and SAR
sensor data)
Inter-comparison only results in a measure of consistency between the compared products
Typical results include
the degree of difference between the product under validation and the reference
insights into the reasons of such differences and consequent identification of the
possible weak points of the product
The main advantage of such a validation is its relative low cost compared to a validation using
reference data It can be performed when access to reference data is difficult or too expensive
or in special cases where a previously validated product is available and considered as
suitable for validation purposes
42 VALIDATION ON SAMPLE BASIS
Validation is expected to assess the characteristics of the products in practice with limited
resources it is not possible to fully validate all products for all services
Thus there is the need to define criteria to apply a multi-level sampling strategy selection of
priority services and products space and time sampling
Selection of priority services and products
The criteria to define priority services and products are
user-criticality the services and products that involve the most serious emergency
events or the ones which have the highest impact on user‟s workflow errors in these
have a high probability to cause losses
frequency of use services and products most frequently used An error in these has
high probability to propagate
novelty the new services and products since they have not been exposed to
operational constraints yet known and trusted Validation should be aimed at
minimising the probability of erroneous use
Spatial sampling
For a single product to be validated design based surveys will be implemented Sampling
areas have to be defined and must fulfil the following general principles
significance their dimension must be sufficient to ensure with high probability that
the results are reliable
representativeness their composition must include all relevant information the
sampling is supposed to check
Strata and clusters will be employed in thematic accuracy assessment Strata are typically
motivated by estimation objectives For example stratifying by map land cover class targets
the objective of estimating class-specific accuracy and stratifying by regions targets the
8
objective of estimating region-specific accuracy Without stratification the sample size
representing a rare class or small region may be insufficient to precisely estimate accuracy
Budget and time constraints are two important inputs for defining the sampling design as they
often limit the number of strata that can be effectively employed
The choice of sampling areas is also driven by
importance of information to be validated
availability of information sources and cost of acquisition
advice from local experts for field mission to define a detailed strategy optimizing
the effort
Temporal sampling
Also time sampling (repetition of sampling across different time instants) must follow general
principles
Significance the validation time interval must be sufficient to ensure with high
probability that the results are reliable
Representativeness the validation time interval must include information the sampling
is supposed to check
Practical criteria are
every kind of product delivered should be validated at least once
validation should be conducted on a periodic basis to ensure the accuracy and the
consistency of the geo-information
the more often a product has been successfully validated the higher will be its
reliability and the lower the validation frequency needs to be
43 EXERCISES PAST AND LIVE EVENTS (FULL SCALE REAL CONDITIONS)
Validation exercises should be performed both on past and live events However priority
should be given to live events mainly because they allow performing the validation of a
certain product with the help and the full contribution of the users Before implementing the
validation one should consider first the advantages and disadvantages of past and live events
that may vary from one product to another
For live events
- The main advantages are collection of quality reference ground truth data for
validation selection of representative products they are more interesting to the
users
- The disadvantages are some events occur more rarely than others (eg earthquake)
need for and extensive time for preparation expensive data collection
For past events
- The main advantages are the ability to perform the validation for almost all kinds of
events the need for a short time frame to prepare and perform validation in most
case validation of past events is less expensive and easier
- The disadvantages are the data collected may not be of very good quality and the
methodology used for data collection not well defined the products may not be
9
completely representative of the different thematic and geographical areas of
interest they miss some important operational characteristics especially on user
involvement Finally there may already be some published works on the
methodologies used or results produced by other service providers which could
bias the validation set-up
44 VALIDATION RANGES
For an efficient validation process it is of utmost importance to specify not only the right
validation parameters but also the validity ranges which imply acceptance or rejection
Ideally validation is resulting in a cross-check for each validation parameter The more
stringent the allowed validity ranges the more likely a product or service may fail to meet the
requirements It is not always essential to validate every parameter but it is necessary to
define a ranking for each kind of service
Some pertinent questions may help in defining the validity ranges
- What precision and accuracy is required for the essential information layer
- How robust should the product be
- How fast should the process and product information delivery be
- What is the minimum required performance
Furthermore service improvements that are integrated into ERCS should typically lead to a
narrowing of validity ranges to reflect that the service indeed performs at a higher level In
general the purpose of the validation expert is to evaluate the Map as a whole but in
emergency cases maps must be produced in a very short time so it is possible that the
provider must strike a balance between rapidity and accuracy That‟s why it is important to
consider this matter in the validation procedure evaluating first of all if the map is useful for
its peculiar purpose focusing the attention on the most crucial aspects
A weight should be given to each validation parameter to give more importance to what is
crucial for the user There cannot be a unique reference scale of ranges for every kind of map
the priorities should be defined for most of cases by the users or if it is not possible by the
expert of validation according to the users‟ needs Usually the priority should be given to the
major information about the emergency that the Map is supposed to give for example if the
map regards flood the detection of flood is the most important But the analysis can go deeper
inside the problem if the major problem regards people involved the flood detection on
urban areas is particularly critical in other cases the attention could be focused on the impact
on agriculture and so on
The main criteria should be
- To point out which is more important between thematic and positional accuracy
- Considering thematic accuracy to point out which layers are more sensitive
Then for each parameter different levels of acceptability should be defined (the validation
ranges) Different statistical approaches are needed for the determination of validation ranges
In principle validation is performed for a representative sample of services This sample
should reflect different types of events and it should represent significantly the total volume
of mapping unit produced Depending on the thematic information sampling may be non-
uniform but rather skewed to represent most significant areas of interest (eg for flood maps
high value areas may be sampled at higher rates that low value areas)
10
Validation ranges help to formally rank the products and services and allow the identification
of particular problems that should be addressed by the service provider in order to improve a
certain product or service set-up Users benefit from validation results through the enhanced
trust in products or reliance on services that successfully pass validation and the gradual
improvement in service evolution The role of the users in defining ranges is crucial the
purpose of the ranges is not theoretical but it aims to allow the validation being really user
driven
45 THE VALIDATION MODEL AND ITS CRITERIA
In this sectionthe framework for the validation protocol is defined Validation relies on a set
of quantitative as well as qualitative parameters that can be grouped into four categories
1) Reliability of the information content
2) Consistency of the information support
3) Usability of the product
4) Efficiency of the service
Each category requires a specific set of validation parameters validation tools and methods
The validation methodologies will be further developed in the following
451 Reliability of the information contents
Reliability is generally defined as the degree to which the information contained in a
product is similar to a reference (also called ldquoground truthrdquo) dependable or repeatable
(stability) ie the degree to which it is free of errors logical and complete Reliability regards
also the soundness of the methodology and of the sources used to generate the product
Most of the GMES ERCS are implementations of methods that require Earth Observation
data as inputs For instance the flood mapping service can be based on the detection of
radiometric changes that are due to the change of the physical properties of the observed
surface from the normal state (ie not flooded) to a flooded state The reliability of the
radiometric change detection depends on the characteristics of the remote sensing sensor
(spatial spectral and temporal resolution technical characteristics of the registration and
processing) and environmental conditions at the time of image acquisition (eg atmospheric
conditions surface characteristics seasonal effects) The process to transform the data in
radiometric measurements into information about flood extent involves various technical
processing steps (eg geo-referencing radiometric calibration) and decision steps that lead to
the delineation and presentation of the ldquoflooded areardquo class This process may differ across
services (ie process implementations) because methods and tools to perform technical
processing may vary decision criteria for class delineation are applied differently or the
presentation formats differ These differences may even exist for different service classes
implemented by the same service provider For instance a ldquorapidrdquo service instance may
include technical processing steps that are optimized for speed rather than technical accuracy
leading to a different output than a ldquoslowrdquo and more precise variant of the same service
Interestingly this suggests that a ldquoflood mappingrdquo service requires further specification as in
ldquorapid flood mapping with medium resolution SARrdquo or ldquoprecise flood mapping with VHR
optical datardquo as these produce rather different outputs and each may require a specific
validation context
11
In summary Earth Observation data provide indirect measurement of the state that is of
thematic interest in a specific Respond service (eg a flood map an actual refugee camp
overview) These indirect measurements may suffer from
- Insufficient spatial resolution ie the sensor produces imagery at a resolution that is
not sufficient to resolve the detail needed for the thematic output For instance
individual buildings may not be sufficiently detailed in a 5 m image product to allow
accurate damage assessment
- Insufficient radiometric resolution ie the sensor sensitivity to radiometric changes
is not sufficient to resolve different objects or different states that are of interest to the
observed process Alternatively the process under observation may not result in
sufficient radiometric diversity to allow resolution of different states in the sensor
output For example it may not be possible to differentiate between flooding depth if
the sensor‟s radiometric channels saturate at a certain depth
- Insufficient temporal resolution ie the sensor‟s revisit frequency is too low to
capture the relevant stages of the dynamic event This may either be due to technical
limitation due to orbit configuration or versatility of the steering capability or
environmental conditions (eg cloud cover) For instance the imagery may not have
captured flooding at its maximum extent
- Heterogeneity the quality of the image inputs may vary by sensor (eg due to
difference in radiometric or geometrical resolution) but also for the same sensor for
different areas andor epochs due to variation in viewing configuration atmospheric
conditions seasonal changes etc Especially in the rapid mapping case where input
data may need to be selected on a first come first serve basis this can lead to
considerable heterogeneity in map output quality
- Class dependencies non-linearity incompleteness interpretation of the remote
sensing images typically depends on model assumptions that are specific to a class
(eg land use classes) within a limited validity range Such model assumptions may
even be specific to a certain geographical area (eg there is no universal model for an
urbanised area) Non-linear effects (eg saturation) may limit the applicability of the
model assumption Incompleteness may limit the effective coverage of the mapped
area (eg limited by sensor field of view) or the class delineation (essential bands
missing)
- Subjectivity service outputs are some form of image interpretation which may be
based on subjective decisions (eg threshold definition class assignment grouping
criteria) Subjectivity contributes to in-service and between-service variability
Availability of pre-event reference data is generally critical depending on the instrument and
geographical area Archives for commercial imagery are generally sparse for areas outside
commercially or strategically important areas Reference maps may come from a range of
sources with different scales quality age thematic content etc especially in areas of the
world where no uniform mapping standards exist
The reliability of the information source ie the sensor data is one of the first criteria
defining the reliability of the derived product Because of the entropy theorem in the
information theory the reliability and overall quality and usefulness of the final product can
only decrease starting from the reliability of the information sources The minimization of this
entropic degradation is of course the objective of the quality control design and
management
12
Measuring or assessing reliability implicitly assumes that reliability of a product is the same
for all users It is based on very careful analysis of the product and most of the time it
requires independent reference data
Validation of the information content reliability for products includes
- Checking the thematic accuracy (against ground measurement) and consistency (against
other reference data) of the information content of the product
- Check the positional accuracy (against ground control point) and consistency (against
georeferenced reference data) of the information content of the product
- Check the temporal adequacy of the information contained in the product
- Check spatial representation of the mapped theme with respect to the event‟s spatial extent
- Check completeness of the information content of the product
- Define a sampling framework for on-site ground truth collection if required
- Ensure the independence of the source from political and economical interests
- Derive event specific criteria for ranking of permissible errors (quality statement)
The complete list and the definition of the parametric tests belonging to this category are
given in section 461
452 Consistency of the information support
This category of validation parameters addresses the quality of the cartographic support or of
the geospatial infrastructure that contains the geo-information It takes into account not only
the absolute quality of a certain information layer or feature but also the relative consistency
between the different information layers or features contained in a specific product (eg the
relative positional consistency across different feature sets in the same product) It deals with
the representation of the information from the thematic positional geometrical and temporal
point of views
Validation of the consistency of information support includes
- Assessing the internal logical consistency of the cartographic support or of the geospatial
infrastructure Internal consistency is related to i) the interrelations among cartographic
features themselves (eg compatibility between the geographic projections of the different
entities or geo-information layers included in the same product) and ii) cartographic features
and their attributes (eg domain consistency)
- Checking the consistency between spatial detail and absolute positional accuracy
- Checking the geometric quality (eg ensuring the compliance with topological rules) and
completeness of the information support
- Ensuring the respect of generalization rules which is based on i) the selection of an
appropriate scale given the map purpose and the map audience and ii) on the set of processes
used to manipulate the spatial information such as the following well-known generalization
operators simplification smoothing refinement etc
- Checking the temporal consistency among the different features ie determining the age of
different data layers included in the product
The complete list of validation characteristics belonging to this category is detailed in the
validation protocol They were derived from basic cartographic rules and are of utmost
importance for the communication of the information to the user
13
453 Usability of the product
The usability of a product is contingent upon its appropriate use that is through avoidance of
misuse or erroneous use It is directly related to the communication of the geo-information to
others This issue centres on the following question
Will the users find the geo-information product useful and informative
Using a geo-information product includes reading interpreting analysing and eventually
integrating the information contained in the product Therefore it is crucial to eliminate any
misunderstanding and ambiguities Ensuring the usability and avoiding the problems of
misunderstanding and misuse of a product require a collaborative approach between the user
and the producer
From the validation expert‟s standpoint checking the usability of the product is one of the
most crucial aspects of the validation A particular stress will hence be given to this category
since most of the defined parameters are directly derived from user requirements and
expectations In that sense validating the usability aims at narrowing the gap between the
service provider and the end user
Some of the validation characteristics belonging to this category will certainly vary depending
on the intended audience technical limitations and specific requirements However we can
generally identify 5 main groups of parameters
1) Media used the data exchange format used for delivering a certain product to the end
user will depend on the specific use context and is not generalizable to all classes of
geo-information products (eg a map printed on water-proof media for use in tropical
area during the rainy season is a typical need linked to a specific use context)
2) Readability refers not only to the visual perception of information contained in a
product but also to cognition which deals with the users thought processes prior
experiences and memory The principles of cognition are important because they
explain why certain symbols work (ie communicate information effectively) To
illustrate the importance of cognition we may take the examples of the use of
different colours (eg blue or red) for representing the flood extent in different map
products For a certain user accustomed to see flooded areas in blue the presence of
the red colour representing flood extent will be confusing since it might be associated
with burned areas seen on a previous map
3) Metadata consistency the presence of metadata is essential not only for electronic
based geo-information (eg GIS data) but also for paper maps Validation of metadata
consistency concentrates on the conformity to a compulsory set of standard metadata
fields (eg conform to ISO 19115)
4) Access and sharing restrictions clear statements on the constraints to access use
information sharing and copyrights are important for evaluating the extent of the
usability of a certain product These may either be part of the agreed metadata
standard or documented separately beforehand (eg for a class of products)
454 Efficiency of the service
The discussion in this section is relevant in the context of validation as it provides a critical
review of the overall service provision The understanding of inherent quality issues and
dependencies is relevant in the design of targeted validation techniques that test the validity
constraints for a given process under a given set of circumstances (event)
14
Whereas heterogeneity in the input data affects product quality can service delivery be
affected by the operational supply of the input Earth observation data This is particularly
relevant for the ldquorapidrdquo service implementations for post-event mapping For a comparative
analysis of the affected area the best possible resolution imagery is generally preferred as
closely timed to the event date as possible both for the pre-event reference and post-event
situation assessment Post-event image acquisition requires an elaborate analysis of
programmable resources Furthermore delivery time of satellite data depends both on
technical parameters such as geographical location which determines both acquisition
planning and the need for onboard recording as well as commercial (eg conflicting priority
or exclusivity) and even political issues (shutter control restricted access) The latter is
particularly important in crisis situation with a political dimension and typically for very high
resolution data (eg sub-meter resolution optical and SAR systems)
Dependency on third party processing tools may exist as well for instance image processing
software that contain different geometrical or radiometric correction routines This is
particularly relevant if the complexity of the information content extraction requires
application of sophisticated and time consuming algorithms analysis of time series and
multi-sensor data sets
Finally effective delivery of the service outputs may depend on the access to enabling
technologies such as high-bandwidth Internet tele-communication means enhanced
computing environments etc both at the service producer and service user end Formats and
standards are relatively well established especially for standard reporting (eg PDF web-
mapping) but end-user service uptake may require further integration into the electronic
workflow within the end-user organisation especially if this extends to local users in remote
areas
The three previous categories of criteria (reliability of information content consistency of
information support usability of the product) refer to validation characteristics that are
relevant to a product or a group of products delivered by a service Efficiency of the service is
related to the infrastructure delivering the product(s) Ensuring the efficiency of the service is
as important as validating the individual products However evaluation of efficiency will be
strongly dependent on the type of service archive proactive reactive alerts
The efficiency of a service includes the performance the availability the affordability and
the integrity
Performance is about timing The time it takes the system to respond to an event generally
provide the basic measure of performance The service performance indicators will be based
on the performance criteria such as
List of events and delivering time from the order or response time performance
Volume of service delivered (number of maps hellip)
Support services delivered (training hellip)
Quality control results
Multilingual call centre option available
Multi-layer (internet phone video conference) platform available
The key question that should be addressed when evaluating the performance of a service is
15
What is the added value of the information derived from service use when compared to
information derived from other sources (eg media reports internal information
sources) Can improvements (if any) be quantified
Availability is related to system failure and associated consequences and is characterized by
the probability of the system being operational and readily accessible when the user needs it
It also checks if 247 option is available
Affordability is related to the cost of the service the general rule being that overall benefits
should normally justify the overall cost One major issue that should be addressed here is
Does service delivery and integration lead to additional costs (eg extra work need for
hardwaresoftware)
Integrity is the extent to which geo-information product is delivered correctly by the service
without any alteration in the delivery process (aspects of handling distribution and
information delivery or access) This assumes that the validation expert traces the service
output as soon as it is produced at the provider‟s unit and checks against the delivered product
once it reaches the end-user Checking the integrity means also to look at the media or the
system used to deliver the product and assess its compliance to standards and its adequacy for
the type of information it is supposed to supply
46 ANALYTICAL DESCRIPTION OF ATTRIBUTES TO BE VALIDATED
In the following the four main categories of attributes reliability of the information content
consistency of the information support usability of the product and for efficiency of the
service are listed and described with the concerning attributes to be validated For each
validation category it will be
i) first recalled the definition
ii) then explained the different attributes and give some indications on the metrics that
will be used for assessing these attributes
iii) then given guidelines on the methodologies that can be used to estimate these
parameters The detailed methodologies will be provided in future versions of the
validation protocol
461 Reliability of the information content
Reliability is generally defined as the degree to which the information contained in a
product is similar to a reference (also called ldquoground truthrdquo) dependable or repeatable
(stability) ie the degree to which it is free of errors logical and completeFrom the user
point of view reliability is a statement about how much the user is confident in the map given
its purpose This is not a mathematical definition like accuracy or uncertainty but is a
judgment made by the map-user and may therefore depending on the purpose of the map
However this judgment can be supported by evidence from
-Accuracy measures
-Evaluation of all contributing data
-Independent validation
-Expert opinion
-User support Generally found to be acceptable by stakeholders and the map has stood the
test of time
16
In the following the products‟ attributes are presented they will be examined during the
assessment of the reliability Also the parameters (measurements) that can be used for
evaluating the quality of these attributes will be listed The methods that can be implemented
for collecting and analyzing these measurements will be detailed in the next version of this
protocol
1] Thematic accuracy (based on in-situ data)
Accuracy in general is the degree to which a measured value conforms to a true or accepted
value Accuracy is a measure of correctness It is distinguished from precision which
measures exactness In an image classification or in a map in general a variety of errors can be encountered
Typically interest focuses on thematic accuracy which is the correspondence between the
class label assigned by the classification and that observed in reality The latter refers here to
ground-observed data In thematic accuracy there are two elements the correct class at the
correct location In other words have the data at point X been correctly classified
Figure 2- Principle of accuracy assessment using ground-truth data
A map or a geo database can be constituted of several information layers or features The
thematic accuracy can hence vary from one feature to another in the same geo-information
product It is therefore necessary to classify the different layers according to their importance
for the user and relatively to the main event that is being mapped This classification can then
allow to perform a prioritized thematic accuracy assessment and to concentrate the effort on
the most meaningful features
Parametersmethods used for measuring thematic accuracy
Thematic accuracy can be assessed using quantitative parameters The most widely used
measure of accuracy is the confusion matrix despite the large number of accuracy assessment
metrics described in remote sensing literature
17
Figure 3 - The confusion matrix and some common measures of classification accuracy that may be derived from it
Figure 3 shows the confusion matrix and some common measures of classification accuracy
that may be derived from it The highlighted elements represent the main diagonal of the
matrix that contains the cases where the class labels depicted in the image classification and
ground data set agree whereas the off-diagonal elements contain those cases where there is a
disagreement in the labels In the example shown the number of classes q is 3 (Foody
2002)
The confusion matrix is as a simple cross-tabulation of the mapped class label against that
observed in the ground or reference data for a sample of cases at specified locations it
provides an obvious foundation for accuracy assessment (Campbell 1996 Canters 1997)
Indeed the confusion matrix provides the basis on which to both describe classification
accuracy and characterize errors Alternatively the pattern of misclassification evident in
the matrix may aid studies that use the map particularly as a means to estimating the areal
extent of classes over a region
The confusion matrix can be obtained by overlaying ground reference data (ground validation
sample data) over the map Many measures of classification accuracy or accuracy indices can
be derived from the confusion matrix
- Overall accuracy =
- Producerrsquos accuracy =
- Userrsquos accuracy =
- Kappa coefficient
- Thematic errors two types of thematic error omission and commission are possible and
both may be readily derived from a confusion matrix (Congalton and Green 1993) An
error of omission occurs when a case belonging to a class is not allocated to that class by
the classification Such a case has been erroneously allocated to another class which
suffers an error of commission
In addition to these common accuracy measures it is proposed also to calculate other
complementary measures
18
- Conditional Kappa= kkk
kkkk
nnnn
nnnn
This coefficient looks at the agreement for an individual class within the matrix
2] Thematic consistency (based on consistency check with other sources excluding in-
situ data)
The difference between thematic accuracy and thematic consistency lies in the reference data
used for the validation While thematic accuracy uses ground-observed (in-situ) data thematic
consistency is based on other types of reference data that do not require any field work A
reference satellite imagery a topographic map or even inter comparison with another product
can be used for performing a consistency check of thematic information when in-situ data are
not available
Parametersmethods used for measuring thematic consistency
Quantitative and qualitative parameters can be used for checking the thematic consistency
a) Quantitative measures as for thematic accuracy measures the confusion matrix can also
be used for assessing the thematic consistency It must however be recognized that in the
absence of in-situ data the resulting confusion matrix and accuracy statement may be
significantly distorted by errors in the reference data It is therefore necessary to establish
a protocol for the collection of reference data that applies an index of confidence to the
reference data so that different subsets can be evaluated or to use secondary class labels
to allow a softer evaluation of the degree of agreement between the data sets to be
calculated (Zhang and Foody 1998) A further problem arises as a consequence of the
sampling strategy adopted for the collection of groundreference data The protocol for the
collection of groundreference data will have also to define the sampling design that will
be used depending on the scale and of the units mapped in the geo-information product
(eg pixels or parcels)
b) Qualitative measures Although a statistically rigorous assessment predicated on a
probability sampling design is still the ldquogold standardrdquo for assessing the thematic
consistency other approaches that are less costly can add significantly to the
understanding of errors and the potential improvement of the map‟s consistency One of
these is systematic quality control which consists of a quick qualitative survey that is
performed over every part of the map This systematic assessment of the quality of the
maps increases the quality of the final products and is recommended as a preliminary step
prior to implementing the more formal consistency assessment Qualitative validation is
based on a systematic descriptive protocol in which each cell of the map is visually
examined and its consistency documented in terms of type of cell composition This
qualitative assessment can be translated in the form of quantitative metrics of the
landscape complexity and of spatial pattern within each examined cell This protocol
proposes to use the following indexes fragmentation index heterogeneity index and
Shannon entropy index
19
3] The absolute positional accuracy of the information
The absolute positional accuracy is a measure of discrepancy between the position of the
features represented on the map or in a geo-information layer and their real position obtained
from ground surveys To allow validation ground surveys must produce data quality better
than product data quality
The concept of absolute positional accuracy is equivalent to the concept of scale For paper
maps it refers to the cartographic scale (representation scale) since the accuracy of
information contained in the map is determined by representation scale For digital geo-
datasets (vectors and rasters) it refers to the nominal scale (scale of data acquisition) since
visualization is physically possible at any scale but the accuracy of information contained in
the dataset is determined by the scale of data acquisition
Positional accuracy combines two concepts precision and location Precision is the spatial
detail
- for raster products it is the resolution
- for vector products it is lied to the instruments and techniques used to produce the
data
4] The relative positional consistency of the information
Relative positional consistency is the measure of the average discrepancy in distances
between the positions of the features represented on the map and their positions obtained from
reference data such as satellite imagery a topographic map or national geo-database It is the
same concept as absolute positional accuracy the only difference lies in the use of reference
data that is not ground survey and then cannot be strictly considered as ground truth
Nevertheless to allow validation reference data must have better quality than the product‟s
quality
Parametersmethods used for measuring the absolute positional accuracy and the relative positional
consistency
The Root Mean Square Error (RMSE) will be used to estimate the positional accuracy and
the relative RMSE will be used for measuring the relative positional consistency
RMSE is the square root of the average of the set of squared distances between dataset
coordinate values and their true values obtained from ground-truth surveys The relative
RMSE is based on the same equation but in this case the reference coordinate values are
obtained by an independent source of higher accuracy (eg a larger scale map a
georeferenced remote sensing image with finer resolution)
Accuracy is reported in ground distances at the 95 confidence level Accuracy reported at
the 95 confidence level means that 95 of the positions in the dataset will have an error
with respect to true ground position that is equal to or smaller than the reported accuracy
value The reported accuracy value reflects all uncertainties including those introduced by
geodetic control coordinates compilation and final computation of ground coordinate values
in the product
20
Table 1- ASPRS Accuracy Standards for Large-Scale Maps
One major issue is the number and the distribution of Ground Control Points (GCPs) and
check points Normally for large scale maps a minimum number of 20 check points should
be tested distributed to reflect the geographic area of interest and the distribution of error in
the dataset When 20 points are tested then the 95 percent confidence level allows 1 point to
fail the threshold given in product requirements
Table 1 shows the planimetric accuracy standards (class 1 horizontal) according to the
American Society for Photogrammetry and Remote Sensing (ASPRS (1990) for large scale
maps The values in this table are based on the cartographic convention to fix the minimum
readable thickness for graphics elements of a map This thickness is usually set in the interval
02 - 03 mm (025 in Table 1)
5] Time gap
The closer the time between the event and the source of mapped information the more
reliable the map is to the user Therefore the time gap is an important attribute of the products
delivered Since a dataset or map can contain several themes obtained at different dates it will
be important to rank these themes according to their importance to the users and to search out
the time gap between the event of interest and the most important themes
Parametersmethods used for determining the time gap
The time gap can expressed in hours days months or even years This information can be
obtained either from metadata or directly on the map It can also be checked by comparing the
declared dates to catalogues of satellite imagery or to other independent sources of temporal
information
6] Information on occlusion (clouds artefacts) expressed as a percentage of the spatial
extent and
7] Information on occlusion in the form of a mask representing occluded areas
Determination of unmarked areas due to artefacts or clouds is essential for the user to better
understand the information content This information can express in the form of a percentage
of the spatial extent of the mapped area andor directly represented on the map (ie occluded
areas represented with a mask and defined in the legend)
21
Parametersmethods used for checking information on occlusions
This information must be declared either in the metadata or directly on the map (in the
interpretation text or in the form of a mask) Therefore the parameter that will be used for
assessing this attribute is the presenceabsence dichotomy with values corresponding to 1
(for presence) and 0 (for absence)
8] Overlap between geo information layers
Maps will often contain objects and areas that overlap (eg lines representing streams might
run over lines that represent roads and both sets of lines may be drawn over areas) Sorting
and arranging information in separate layers and then drawing them in an order that reduces
ambiguities on the final display plays an important role in the final reliability of information
content When overlapping areas occur in the same layer it is possible to encounter confusing
effects
Figure 4- a) Ambiguous and b) non ambiguous overlapping
Figure 4 illustrates ambiguous and non ambiguous overlapping situations
a) Ambiguous situation where one cannot tell if the area formatted using a crosshatch style
and a white colour for background is simply drawn as overlapping blue triangle or if it‟s
perfectly into a regular shaped blue area
b) Non ambiguous situation where two overlapping areas are formatted in two different
drawing layers using a slightly contrasting colour and a slightly different open pattern
style
Parametersmethods used for determining overlap
Absence of overlap is encouraged therefore the presenceabsence parameter will be used for
this attribute However sometimes it is impossible to avoid overlapping and consequently
simple cartographic rules and common sense can help to represent the information in an
unambiguous way For that the pertinence parameter will also be used allowing to rank the
representation of overlap into five categories Very Bad Bad Fair Good and Very Good
b) a)
22
Figure 5- Examples of overlay between geo information layers
These two subsets were taken from a map representing damaged building and
infrastructure The yellow line represents the cadastral limits the red and yellow dots
represent the damaged buildings and the red cross is for the damaged airport (runway
sections) On the first subset we can observe an overlay between the cadastral limits and
the damaged buildings On the second one there is an overlay between the toponyms the
damages airport and the cadastral limits The parameter used to assess the overlay in this
case is the ldquopertinencerdquo In this case were the most important information is the location
of damage the order of the layers is not pertinent because it does not respect the levels of
relative importance of geo information This overlay does not only affect the reliability of
information content but also the readability of the map
This is another example showing an overlap between the most important geoinformation
layers Mainly we can identify an overlap between urban areas represented in blue and
the envelop of burnt areas represented with a red line The latter also includes information
on land cover mainly dense (represented in dark green) and sparse vegetation
(represented in light green) The use of transparent texture could have been preferable
Figure 6- Example of overlay between urban areas represented in blue and the envelop of burnt areas
represented with a red line and including as well an information on land cover mainly dense (dark green) and
sparse vegetation (light green)
23
9] Semantic definition of information content (either public or ad hoc)
Every feature represented on a map should normally be defined in a comprehensible form
This can be done in the legend which is a kind of dictionary that provides a key for
understanding the different symbols used on a map It is desirable to mention the source of the
definitions used in the legend (whenever the features description is based on a commonly
used legend eg Corine landcover) for an increased reliability of information content
Parametersmethods used for assessing the semantic definition of information content
In addition to the presenceabsence of semantic definitions of information content on the
map the completeness of the definition will also be used as a quality parameter In other
words this parameter allows to check if all the symbols are defined in the legend and if a
reference on the source of definitions is available
10] Information on the spatial detail of information sources
The spatial detail (precision) of information refers to the granularity of the data that is used
for generating the product Information on the spatial detail is essential to check the
consistency of the spatial accuracy of the product
Parametermethod used for checking the information on the spatial detail of the information source
The presenceabsence check is used in the documentation of information on the spatial
resolution for raster data (image data) and on the nominal scale for vector data
11] The methodology used for accuracy assessment
In some cases the service providers give indications on the spatialpositional accuracy of the
delivered product In that case it is essential to know what is the methodology (sample size
type of reference data sampling design accuracy metrics etc) used for determining the
accuracy of the delivered product
Parametermethod used for checking the information on the methodology used for accuracy assessment
Besides the presenceabsence of information in the documentation of information on the
methodology used for accuracy assessment the pertinence or suitability of the methodology
will also be examined The latter depends on i) the quality of the reference data used for
accuracy assessment ii) the sampling density iii) the sampling scheme etc
12] Credibility
Credibility of the service provider is one of the main aspects that determine the reliability of
the information contained in a geo-information product Evaluating the credibility or
believability will help the users in establishing trust in the service and in the products it
delivers
Parametermethod used for assessing the credibility
A documentation of the scientific reputation and of the operational experience of the
service provider will be established as a measure of credibility Besides the independence
(yesno) of the source from politicaleconomical interest is also a criteria that can help in
assessing the credibility of the service provider This can be performed based on the
24
validation expert‟s experience on the experience record and the reputation of the source and
on validation results
462 Consistency of the information support
A consistent product is the one that does not contain contradictions While reliability of
information contents is mainly based on comparison with reference sources consistency
checks focus on internal contradictions of the product between different components of the
product (documentation included) or with respect to requirements
When a contradiction between two or more elements is detected it is seldom possible to
decide which the correct one is but the presence of a contradiction is a good hint that the
product contains errors and then further investigation is worth
Consistency validation requires as input the product (documentation included) and the
requirements no reference source is required for most part of the checks
Different parameters and methods apply depending on the information support (ie the media
the format) used for the product
Consistency validation offers the following advantages
- It does not require reference sources (for most part of the checks)
- It can be run time-independently from data sources acquisition
- It is less expensive with respect to validation of reliability of information contents
- For digital products a relevant part of consistency validation can be automatic or
computer assisted thus it can be performed automatically on the full product (not only on
sample basis as compared to reliability of information content)
For these reasons consistency validation is sometimes used as a relatively fast and un-
expensive bdquopre‟ validation
1] Consistency between absolute positional accuracies (spatial details)
This attribute describes consistency between spatial attributes of the product Starting from
the information sources and ending at the final product the information quality can only
eventually decrease because of processing Then if a product has a declared positional
accuracy this implies that the information contents (featuresimage) must have at least the
same minimum positional accuracy Also the information sources must have the same
minimum positional accuracy
In other words a product with spatial accuracy of 25 meters (scale110000) must really allow
to read 25 meters spatial information and have information sources with spatial accuracy of
25 meters or better
Parametermethod used for checking the consistency between spatial detail and absolute positional
accuracy
The first parameter is the ratio between declared absolute positional accuracy of the product
and declared absolute positional accuracy of information sources This is a trivial check The
values should be contained into the documentation
The second parameter is the ratio between declared absolute positional accuracy of the
product and absolute positional accuracy of information contained in the product The
challenging part regards the estimation of positional accuracy of information contained in the
product It is often easier to estimate its spatial detail and use it instead of accuracy to obtain a
bound
25
For all products (in particular paper products) it is possible to try an estimation of spatial
consistency with known elements contained in other themes
For digital products computer assisted or visual examination are possible for paper a
detailed visual examination can sometimes give a rough estimate
2] Relative positional consistency across different feature sets in the same product
This attribute describes consistency between spatial information contained in the product
There are features with expected positional relation between themselves eg (partial)
adjacency of municipalitycountystate boundaries containment of bridges in transport
networks In addition to this many thematic features can also be easily observed on very high
resolution satellite imagery or an aerial photograph eg transportation networks water bodies
If the product contains featuresimages with these relations it is possible to evaluate their
relative positional consistency The following figures show some examples of inconsistencies
Figure 7 ndash Probable inconsistency between boundaries (dashed) and the background image
Figure 8 ndash Inconsistency between roads in thematic features and roads in the underlying image
26
Parametermethod used for checking the consistency across different feature sets in the same product
The main parameter is RMSE It can be calculated with different methods depending on the
type of product (paper map digital map hellip)
- Paper maps RMSE will be compared to the cartographic scale It is also possible to
compute RMSE using measures in mm taken directly from the map and to compare this
RMSE with the graphical accepted tolerance (02 ndash 03 mm) A visual inspection of the
map usually allows a quick assessment of major problems
- Digital maps (images not georeferenced data) the default approach is to visualize or
print at the proper cartographic scale and to use the same procedure applied to paper
maps
- Georeferenced data in this case computer aided assessment is the best approach to
compute RMSE The resulting value has to be compared with the nominal scale
3] Relative time gap between most significant features
This attribute describes the time distance between the most significant features included in the
product
The interpretation of this attribute is case dependant There seem to be no general rule a loose
reference could be that the features should refer to the same date (as close as possible to the
event of interest) Knowledge of time gap helps in identifying and explaining the artefacts
(ie identifying discrepancy related to newly built up information)
Parametermethod used for checking the relative time gap between most significant features
Time measures hours days months years between data features This information can be
checked in metadata
4] Respect of generalization rules
Generalization is the process of reducing the information content of maps due to scale change
map purpose intended audience andor technical constraints For instance when reducing a
map from large scale to small scale some of the geographical features must be either
eliminated or modified because the amount of map space is significantly reduced Of course
all maps are to some degree generalizations as it is impossible to represent all features from
the real world on a map no matter what the scale (Slocum McMaster et al 2005)
Examples are representation of cities from metric (polygon) to symbolic (point)
representation of green or built areas without some internal (minor) roads even if the
cartographic scale will allow to represent them
Generalization can be performed using many spatial operators described in the following
figure
27
Figure 9 ndash Spatial operators for generalization (Slocum 2005)
Parametermethod used for checking the respect of generalization rules
It is not possible to perform a complete and a systematic check it is proposed to focus on
pertinence of symbolic representation and pertinence of metric representation according to
different scales and semantic hierarchy
The method is to understand which generalization process has been used by checking in
metadata and have a visual examination of the map
5] Consistency between map and legend symbols
The map and the legend must contain a consistent set of symbols
- all symbols used in the map must be named in the legend
28
- all symbols named in the legend must be used in the map If the map is divided into tiles
it may occur that not all the symbols represented in the legend are visible on all the maps
The following figures show some examples of inconsistencies
Figure 10 ndash the legend symbol for provincial capital is missing in the map
Figure 11 ndash The symbol for drainage line has different sizes in the map and in the legend
Parametermethod used for checking the consistency between map and legend symbols
The parameters used to evaluate consistency between map and legend symbols are
- the percentage of symbols present in the map and described in the legend
- the degree of graphical correspondence between those symbols
The method to assess these parameters consists in a visual check on the map
6] Compatibility between the geographic coordinateprojections systems
A single product can contain different features (or geo-information layers) coming from
different sources If the features are stored in different coordinateprojection systems this can
cause consistency problems as displacement or deformation of the information
If the product is a map two main cases exist
- the inconsistency is managed during the production process using coordinate transform
and re-projection tools
- the inconsistency propagates to the product in this case it is usually detected performing
bdquorelative positional consistency across different feature sets‟ check
Any transformation applied to data that affects the coordinates or the reference system should
appear explicitly in the metadata and also its effects on the map precision should be
mentioned
If the product is a dataset there is the need to perform a systematic check
29
Parametermethod used for checking the Compatibility between the geographic coordinateprojections
systems
The main parameter is the pertinence of the coordinateprojection systems It can be evaluated
checking metadata checking properties of geographic data files and by visual inspection
7] Topological consistency
Topology studies spatial properties that are preserved when an object is deformed in a
continuous way ie stretched without either tearing or gluing Topological consistency is
achieved when the required properties are respected in the product
The importance of topological consistency lies in the fact that it increases the effective
usability of data every geo-data can be printed but the area can be calculated only for closed
polygons and the minimum path can be calculated only for connected networks Thus the
respect of topological properties can be very important for specific geo-information products
depending on their expected use
In addition to this topological relations can help to detect content errors eg a dam should be
contained in the boundary of water bodies
Parametermethod used for checking topological consistency
There are several parameters to describe topological consistency Some examples are
adjacency some features could be constrained to be adjacent eg administrative
boundaries roads sections that separate cities and the administrative boundaries
coverinclusion some features could be constrained to be completely covered by
included in others eg the polygon of state surface should include the polygon of
each city of that state Of course the type of inclusion depends on the geometric
feature types linear represented dams should be contained in the boundaries of
polygonal represented water bodies punctual represented dams should be
contained in linear represented water bodies
presence of gaps gaps in a feature dataset could be allowed or not eg a land use
cover should have no gaps
overlapping overlapping between features of the same or of a different dataset
could be allowed or not (digitizing happens to produce overlapping in the same
feature)
closure of polygons polygons should be closed in order to properly allow some
operations as area calculation inclusion check The case of not closed polygons
can occur when geometry is digitized using CAD tools
connection of networks for some linear features the connection property could be
required eg for transportation network when path processing is necessary
presence of dangles a line with an endpoint that is not connected to another line is
called a dangle this could be allowed or not
continuity (across tiles) features should not have unwanted breaks that reduce
usability For instance big datasets are often processed partitioning the study area
into tiles and digitizing features into each single tile This practice can lead to
features (roads coastline hellip) that are not continuous across the tiles
30
There are many computer aided tools to help checking topological parameters in datasets The
availability of such tools enables to perform extensive systematic checks on the complete
product
Visual analysis is suitable for maps
Figure 12 ndash Inclusion (of a point in a polygon) presence of a gap dangle line (ESRI)
Figure 13- Example of topological inconsistency
These are subsets of two reference maps representing road infrastructure delivered by the
same service provider The red circles highlight a topological inconsistency observed between
the two maps The parameter used to assess the topological consistency is the ldquoContinuity of
geographical featuresrdquo Thanks to a simple visual comparison of the two maps it is possible
to identify breaks in the geographical features (here the roads) in the map represented on the
left This may be a source of confusion for users who receive these two maps which are
supposed to represent the same information at the same scale
8] Attributes consistency
Geo-data has alphanumeric attributes and they are also an important source of information
Attribute consistency refers to data types and values that attribute can have This property is
also known as domain consistency (Bernhardsen 1999)
The importance of attribute consistency lies in the fact that it increases the effective usability
of data eg every data can be printed but only numerical data can be used for numerical
computing (not numbers written in character fields) Thus the respect of attribute consistency
can be very important for specific geo-information products depending on their expected use
In addition to this attribute consistency checking can help to detect content errors eg an
absolute speed cannot be negative
31
Parametermethod used for checking attribute consistency
There are several parameters to describe attribute consistency Some examples are
- data type compliance the data types contained in the product must be compliant with the
expected data types eg number character datehellip
- value range the attribute values must be included into expected (or anyway reasonable)
ranges eg surface mountain height could be expected to be in the range [500m ndash
9000m] EU language in the list [bg cs da de et el en es fr ga it lv lt hu mt nl pl
pt ro sk sl fi sv]
- filling of required fields some fields could be required for further computing and they
must be filled
There are many computer aided tools to help checking attribute consistency in datasets The
availability of such tools enables to perform extensive systematic checks on the complete
product
Visual analysis is suitable for those attributes that have explicit output on maps eg
classifications (this check is usually performed under thematic accuracyconsistency
activities)
9] Consistency between declared and effective representation scale
The effective representation scale of the product could be different from the declared
representation scale If the product is meant for metric use ie to assess distances it is worth
to check this consistency This check applies only to maps that are meant to be printed The
representation scale can be declared in different ways the most used are a proportional scale
bar eg and a numerical ratio eg 1100000
Parametermethod used for checking consistency between declared and effective representation scale
If the scale bar is used the check consists in defining control points on the paperdigital map
measuring their map distance getting the real metric distance by a reference source and
comparing these data with the scale bar
If the ratio is used with paper maps the check consists in defining control points on the map
measuring their map distance getting the real metric distance by a reference source and
comparing these data with the ratio
If the ratio is used with digital maps the same check is possible only if information on
physical dimension of paper sheet is given Performing this check will also define if the
declared physical dimension is consistent
463 Usability of the product
The usability of a product is contingent upon its appropriate use that is through avoidance of
misuse or erroneous use It is directly related to the communication of the geo-information to
others This issue centres on the following question
Will the users find the geo-information product useful and informative
Using a geo-information product includes reading interpreting analysing and eventually
integrating the information contained in the product Therefore it is crucial to eliminate any
misunderstanding and ambiguities Ensuring the usability and avoiding the problems of
32
misunderstanding and misuse of a product require a collaborative approach between the user
and the producer
From the validation expert‟s standpoint checking the usability of the product is one crucial
aspect of the validation A particular stress will hence be given to this category since most of
the defined parameters are directly derived from user requirements and expectations In that
sense validating the usability aims at narrowing the gap between the service provider and the
end user
1] Spatial coverage of the area of interest
The location and the extent of the area represented on a map is the first thing that must be
examined at the delivery of a product A map that does not cover the area of interest is not
useful to the end user Ideally the area covered by a (or series of) map(s) should cover the
whole surface extent specified by the user in the User Request Form (URF)
Parametermethod used for assessing the spatial coverage of the area of interest
The extent of the area covered by the geo-information product with respect to the area
specified by the user can be measured using the area percentage that can be estimated either
visually or automatically
2] Overview map
An overview map or inset is a smaller map included within the context of a larger map Insets
can serve two main purposes 1) to show the primary mapped area in relation to a larger more
recognizable area (a locator inset) 2) to provide a close up of a section or sections of the map
When the inset map is used to provide an overview the targeted users should be considered in
order to determine what locational information they need to properly fix the location of the
area under study in their mind
Parametermethod used for assessing the overview map
Not only the presence of an inset map has to be checked but also its pertinence This can be
assessed thanks to the following questions
- Can the location of the mapped area be easily identified
- Is the map annotated with relevant location names
- Is the affected area highlighted
3] Coordinate graticulesgrid
The graticule represents the projected position of the geographic coordinates at constant
intervals or in other words the projected position of selected meridians and parallels The
shape of the graticule depends largely on the characteristics and scale eg on the 150000
topographic map graticule lines or ticks can be represented at every 5 minutes and grid lines
at every kilometer The presence of graticules on a paper map can help to easily georeference
the map once it is scanned and to use it in a GIS environment
Parametermethod used for assessing the coordinate graticules
The presenceabsence of graticules and grids on a map will be examined The pertinence of
the spacing of graticules in relation with the scale of the map will also be assessed The
33
pertinence of coordinate labels and the precision (for paper maps and geospatial data) with
regard to the end-user will also be examined For instance it is sometimes preferable to have
the coordinates represented in decimal degrees in double-precision floating point because
this format allows their easy integration in a GIS database
4] Cartographic scale and printing size
The scale either indicates the amount of reduction that has taken place on a given map or
allows the map user to measure distances The cartographic scale determines the mapped
space and level of cartographic detail possible The presence of graphical scale (scale bar) in
addition to a numerical ratio is encouraged The ability of a scale bar to indicate distances
together with its ability to withstand enlargement and reduction of a map make it the
preferred format for inclusion on a map The maximum distance value represented in a bar
scale should always be rounded and easy to work with In addition to the cartographic scale
the recommended print size should also be clearly defined on the map
Parametermethod used for assessing the cartographic scale
The presenceabsence of the cartographic scale and of the recommended printing size will be
checked on the map In some cases the printing size is not explicitly written on the map but
contained in a page description data that consists in a set of printing instructions (eg
Postscript file)
5] Description of processing steps information sources
A description of information sources and processing steps (orthorectification classification
digitalization visual analysis) used for the production of geo-information add confidence
and credibility to the product The description of processing information should clearly appear
on the map and in the case of a geospatial database it should be given in the metadata
Parametermethod used for assessing the description of processing steps information sources
In a first place the presenceabsence of a description of information sources and processing
steps will be examined In a second place the pertinence of the information sources and the
approach used for processing it will be analyzed with regard to 1) the output information
required by the user and to 2) thematic and positional accuracy of the sources and of the
product detailing the assessment method used
6] Interpretation textreport
The usability of a product (especially a map) can be enhanced by the presence of an
interpretation text that gives information on the core elements represented in the map or
contained in a geospatial database (origin of disaster data location targeted users etc)
Parametermethod used for assessing the interpretation textreport
In addition to the presenceabsence of the interpretation text its completeness its clarity and
the correctness of the formulation and spelling will also be examined
7] Acknowledgement and sources 8] Name of the producer
9] Logos of the partners
34
The usability of the map is also reliant on the completeness of the information Among the
compulsory information that must be supplied by the service provider to the user are the
acknowledgement and the sources the author and the contact information of the producer and
the logos of the partners
Parametermethod used to check the 3 attributes
All the above cited attributes (points 7] 8] and 9]) should clearly appear on the map Their
presenceabsence will hence be evaluated
10] Media used
The data exchange format used for delivering a certain product to the end user will depend on
the specific use context and is not generalizable to all classes of geo-information products
(eg a map printed on water-proof media for use in tropical area during the rainy season is a
typical need linked to a specific use context) The media used can also affect the decision on
the map size For instance a service provider should not make an A5 map for an informative
paper map such as a poster Hence the media used and the size of the map should also be
consistent
Parametermethod used to check the media used
Information on the map medium should be clearly defined in the product requirements
Compliance to user needs given in the URF and consistency with the map printing size are
additional parameters to be checked during validation
11] Readability
Readability refers not only to the visual perception of information contained in a product but
also to cognition which deals with the users thought processes prior experiences and
memory The principles of cognition are important because they explain why certain symbols
work (ie communicate information effectively) To illustrate the importance of cognition the
examples of the use of different colours (eg blue or red) for representing the flood extent in
different map products can be considered For a certain user used to see flooded areas in blue
the presence of the red colour representing flood extent will be confusing since it might be
associated with burned areas seen on previous maps
Parametersmethods used to assess readability
A set of parameters can be used to evaluate readability These parameters will help to check if
the service provider applied the basic cognitions of graphic semiology (choice of symbols
colours and typography etc)
Appropriate title fitting with the content (contains topic location date)
The title should be appropriate and fitting to the content of the map It should also be
complementary to the legend The appropriateness and completeness of the titles will be
assessed
Adequacy of font size and colour of text
A differentiation in the meaning of objects present in the same map requires variable fonts
with variables sizes and appropriate colour identification For the font design in maps it is
necessary to decide on the font-family its basic forms like size and the positioning of the
type dependant on the space that is left next to the other map elements For example in
35
cartography with the variation in size a differentiation in the meaning of certain objects in a
group is possible eg a smaller size could characterise a town with less inhabitants a larger
size more inhabitants It is normally recommended to use a minimum difference of 2 points of
font sizes for the different elements of the map (title legend heading legend definitions data
source bar scale map labels etc) It is also necessary to avoid mixing too many types of
fonts in the same map
Correctly placed labels
Map labels placing also called lettering is important in the means of linguistic practical
technical and aesthetic aspects Illegible or non-existing labels on a map could cause damage
to the users Placement of letterings on the map should follow some basic cartographic rules
Figure 14- Examples of good and bad solutions for positioning of map labels
Adequate and differentiable Colours used for representing the different themes
are satisfactory visual contrast between background and map themes
Colour conventions for qualitative and quantitative agreements will be checked
Qualitative use of colour in mapping addresses points lines areas or symbols The elements
colour is seen as a qualitative value ie it is not applying an amount to the elements
Qualitative value is expressed through colour hue and its intensity or saturation The logic of
use of different colours should be appropriate to user‟s habits eg
Water ndash Blue Vegetation ndash Green Land ndash Brown Temperature ndash Blue to Red
In quantitative use of colours value differences are best shown with a differing amount of
one colour hue for one theme Sequential schemes are for instance suited to ordered data that
progress from low to high Diverging schemes put equal emphasis in mid-range critical values
and extremes at both ends of the data range
a) Sequential colour schemes b) Diverging
colour schemes
36
Figure 15- Example of conventional sequential (a) and diverging (b) colour schemes
(httpwwwcolorbrewerorg)
The following basic rules should be respected when selecting qualitative and quantitative
colour schemes for a map
- The selected colours should allow the user to correctly match the colour on the map with
the corresponding legend colour
- The colours should convey a correct impression of how the feature changes in magnitude
across the map area
- The colour schemes are supposed to allow the comparison of quantitative data for features
on two or more maps of the same area
In addition to a qualitative assessment of the pertinence of the selected colours the two
following metrics will also be used to evaluate the contrast for colour schemes
Colour brightness
((Red value 299) + (Green value 587) + (Blue value 114)) 1000
Colour difference
(maximum (Red value 1 Red value 2) - minimum (Red value 1 Red value 2)) + (maximum
(Green value 1 Green value 2) - minimum (Green value 1 Green value 2)) + (maximum
(Blue value 1 Blue value 2) - minimum (Blue value 1 Blue value 2))
Two colours provide good color visibility if the brightness difference and the color difference
between the two colors are greater than a set range
The range for colour brightness difference should be ge 125 Colour difference should be ge
400
Figure 16- Example of bad map readability due to inadequate symbolsrsquo colours
These are subsets of two maps of areas affected by the tropical cyclone NARGIS produced at
an interval of two days by the same service provider The red and blue colours refer to
satellite detected waterwet areas according to the legends of these two maps The parameter
that allows here to assess readability is the ldquoAdequacy of the colours used to represent the
different themesrdquo This example shows how the readability of a map can be affected i) by the
non respect of colour conventions and ii) by the inconsistency in the colours used to represent
the same type of information in two products of a same service
37
Symbols easily differentiable
The various perceived differences in map symbols are usually described by the term visual
variables The differentiability of symbols is related to spacing size orientation shape
arrangement and texture (combining the visual variables spacing and size) of visual variables
The pertinence of map symbols will hence be evaluated taking into account these basic visual
variables Besides the respect of standards for geospatial symbology will be checked (eg the
use of conventional topographic symbology for reference maps)
Absence of overlap between geo information layers
This parameter is checked twice in the reliability of information content and in readability
because overlapping features affect both attributes (sect point 8] in reliability of information
content)
12] Legend symbols are clearly defined
The legend is the map element that defines all of the thematic symbols on a map Symbols
that are self-explanatory and not directly related to the map‟s theme are normally omitted
from simple thematic map legends In contrast for general reference maps all the symbols
should be defined even if self-explanatory Special care should be taken to insure that
symbols in the legend are identical to those used in the mapped area Legend symbols should
also be organized into groups based on a particular criterion (eg two groups can be formed
according to whether the symbols represent natural or cultural features)
Figure 17 - Some basic rules for symbols layout in a legend
Figure 17 shows some basic rules for symbols layout in a legend (Slocum McMaster et al
2005) (A) The legend is composed of representative symbols and definitions (B)
Distribution and alignment of symbols and definitions (C) Horizontal alignment of
definitions composed of numeric ranges (D) Horizontal positioning of symbols and
definitions (E) Irregular polygons used to represent areal data
Parametermethod used to check legend symbols
The presenceabsence of a definition for each symbol in the legend will be checked In
addition the pertinence of the definition of symbols and their arrangement on the map legend
will also be assessed
13] Adequacy of the projection with the use
38
For some specific purposes for instance for assessing areas angles or distances in a map it is
necessary to select an appropriate map projection that preserves a particular property
Projections that preserve either area or angles are called equivalent and conformal
respectively Equidistant projections preserve distances along some directions The commonly
used UTM projection preserves shapes and direction but distorts area and distance Hence
when areas have to be estimated from a map it is better to use an equivalent projection In
some other situations it is recommended that the local projection also is made available as a
client option This allows an easier integration in local geospatial databases
Parametermethod used to check adequacy of the projection
The projection should be clearly defined on the map and in the metadata A check of the
pertinence of the selected map projection with regard to user‟s need will be done The
possibility to request a specific map projection should be included into the requirements and
into the URF
14] Multilingual support
Most of the geo-information products for emergency response consider English as a reference
language for communication For non English speaking countries one may ask how
explanatory is the map In some situations it is necessary to have the toponyms or even the
interpretation text in the national language It is sometimes possible to just paraphrase the
names in areas where Latin is not the base of the language eg Greek Hebrew Chinese etc
Names can be simply transcribed1
Figure 18- Example of a multi-lingual landslide and debris flow map for China earthquake occurred on 12 May 2008
Parametermethod used to check multilingual support
1 Transcription is a method of replacing elements fonts characters or sounds however they may be written with characters
or sounds of another language
39
The existence of a multilingual support for a map and its supporting documents is
encouraged Therefore the presenceabsence of multiple languages and the pertinence of the
language used with regard to user‟s requirements will be assessed The possibility to request a
specific language support should be included into the requirements and into the URF
15] Metadata consistency
For validation purposes some metadata sections are mandatory and hence need to be declared
either directly on the map or in the metadata XML file for digital geographic data The
required metadata is relevant to content description aspects and is based on pre-defined
standards (ISO 19115)
Parametermethod used to check metadata consistency
The presenceabsence of information related to the following metadata elements will be
checked
- Identification information (resource title abstract type identifier language)
- Classification of data and services (topic category)
- Keywords
- Geographic location (bounding box)
- Reference System
- Temporal reference- Quality and validity (spatial accuracy)
- Maintenance information
- Responsible organization (contact information)
- Information on license and copyrights
- Metadata on metadata (metadata point of contact metadata language)
In addition the compliance of metadata to pre-defined standards will also be assessed (eg
check if metadata is compliant with ISO 19115 Geographic information ndash Metadata or ISO
19131 Geographic information - Data product specifications)
16] Version number of the product
Of a particular importance for validation in general and for the user in particular is the
availability of information on the versioning of a certain product A version distinguishes
between different releases of the same information resource that may occur over time As
some map products are sometimes subject to frequent updating it is necessary to mention the
version number either directly on the map product or in the metadata file
Parametermethod used to check version number
The presenceabsence of versioning information either on the map or in the metadata file
associated to the product will be checked
17] Constraints related to access use and sharing of information
Access limitations are restrictions and prerequisites for accessing the information resource
This information describes any constrains or legal prerequisites for accessing the information
40
resource or its component products or services This includes any access constraints applied to
assure the protection of privacy or intellectual property and any other special restrictions or
limitation on accessing the information
Parametermethod used to check constraints related to access use and sharing of information
It is recommended to explicitly specify whether the product is governed by access limitations
Therefore the presenceabsence of such information will be checked directly on the map or in
the metadata file or in any other supporting document supplied by the service provider
Besides the type of constraint will also be assessed Examples of generic limitations that can
be declared are No Restrictions Public Sensitive Classified
18] Existence of additional fees
Contractual obligations or fees necessary to gain access to the information resource should
also be referenced mainly in the metadata file or in other related documents supplied by the
service provider This information should be free of ambiguity and all specific conditions
related to the payment should be clearly mentioned so to avoid any bad surprise to the user
Parametermethod used to check the existence of additional fees
The presenceabsence of information on additional fees will be checked and the amount of
the fees and the specific conditions will be evaluated with regard to the benefits of the
products to the user
19] Distribution liability
Any information regarding the liability assumed by the distributor should be clearly defined
either directly on the map layout or in the metadata file for digital data The statement of
liability should clearly include the following information
- liability regarding the input data (scale resolution spatial accuracy date) used for
generating the product
- liability concerning the information content of the product (in relation with time
constraints under which the product was generated)
- liability concerning the processing approach used for deriving the geo-information
Parametermethod used to check the distribution liability
The presenceabsence of information on distribution liability will be checked directly on the
map (for map products) or in metadata file for digital data
464 Efficiency of the service
So far the validation tackled mainly the products‟ attributes The service that delivers the
product to the users has also a series if attributes that can be evaluated through validation with
the help of the users Efficiency of the service is related to the infrastructure delivering the
product(s) Ensuring the efficiency of the service is as important as validating the individual
products However evaluation of efficiency will be strongly dependent on the type of service
archive proactive reactive alerts The following attributes and their corresponding
parameters will be used for assessing the efficiency of a service in an operational framework
41
1] Delivery time from order
The time gap between the triggering and the delivery of the final product to the user is an
essential attribute especially for full scale emergency-response services The end-to-end
service delivery time is based on four components i) mobilization time (time for the user to
activate a service) ii) EO data acquisition time (time to program the first set of crisis images
with satellite tasking) iii) EO data production time (time to supply the first set of crisis
images and the needed archive images called pre-images) iv) the value-adding time (time to
produce and deliver the first products)
Parametermethod used for determining the time from order
The delivery time can be measured (only by users) by the number of hours days or months
and can be checked by comparing the declared delivery time in service requirements and the
actual delivery time to the users
2] Delivery cost
The cost of the products delivery is essential to assess the benefit of a service to the users The
delivery cost should normally be justified by the benefits the users get from a particular
service
Parametermethod used for assessing the delivery cost
The delivery cost can be measured by the amount of money necessary for the provision of a
particular service or product This real cost can be cross checked with the declared cost given
in the service requirementsspecifications
3] Technical support
The existence of a technical support is also an important aspect describing the efficiency of a
service The technical support here is understood as a team or unit that provides assistance to
the users before during and after the products delivery The technical support is also expected
to ensure products inclusion and publication in the service portal
Parametermethod used for assessing the technical support
The presenceabsence of a multilingual center and the availability of a 247 option (allowing
to activate the service) can help to assess the efficiency of a service and its reactivity in the
case of a disaster This information can be verified either in the metadata or it can be directly
mentioned on the map or in service specifications It has to be compared with requirements
4] Frequency of update
Updating frequency especially for rapid maps and early warning services (eg real-time
services) can also contribute to assess the efficiency of a service In case of rapid maps
updating frequency is essential for a continuous information support during response In the
prevention phase it helps to anticipate protective actions and allows to respond quickly to the
emergency
Parametermethod used for determining the frequency of update
This attribute can be represented in terms of minutes hours days or even months The higher
the frequency the better is the efficiency of the service However the evaluation of this
42
parameter will strongly depend on the type of delivered product For instance for past disaster
maps or for risk maps the updating frequency is defined according to the user needs and is
not as essential as for rapid mapping products This parameter will also be checked in the
documentation supplied by the service provider or in service specifications with respect to
requirements
5] Integrity
Integrity is the extent to which geo-information product is delivered correctly by the service
without any alteration in the delivery process (aspects of handling distribution and
information delivery or access) This assumes that the validation expert traces the service
output as soon as it is produced at the provider‟s unit and checks against the delivered product
once it reaches the end-user
Parametermethod used for assessing the integrity
Checking the integrity means to look at the media or the system used to deliver the product
and assess its compliance (yesno) to standards and its adequacy (yesno) for the type of
information it is supposed to supply The integrity can be evaluated by checking the product
before and after delivery to the end user and by assessing the changes that may occur during
the delivery process
465 Validation summary checklist
The following checklist summarizes attributes parameters and methods used to perform the
validation
43
Validation categories
Attributes Parameters Methods
Reliability of
the
information
content
1] Thematic accuracy (based on in-situ data)
Decidepropose the most important themes for each product type and focus on them
Quantitative measures
- Overall acc
-Commission error
-Omission error
-Producerrsquos acc
-Userrsquos acc
-Kappa coefficient
-Conditional Kappa
(Congalton 1991)
- Probability-based sampling design
- Comparison with in-situ data
- Interpretation of field work
2] Thematic consistency (based on consistency check
with other sources excluding in- situ data)
Quantitative measures
Same as thematic accuracy
Qualitative and quantitative systematic measures
- Composition of a cell
-Fragmentation index
-Heterogeneity index
-Shannon entropy index
(Strahler Boschetti et al 2006)
- Reclassification of the concerned regions or areas of
interest
- Digitization of certain elements from reference satellite
imagery topographic maps etc
- Independent visual interpretation
- Overlay with vector data
- Photo interpretation
- Comparison with adequate land cover data sets
- Grid based qualitative validation (based on reference data)
3] The absolute positional accuracy of the
information
Absolute Root Mean Square Error Comparison with ground surveys
4] The relative positional consistency of the
information
Relative Root Mean Square Error Comparison with reference data (satellitemapvector)
5] Time gap Time interval between the event of interest and the
information source (based on selected priority layers)
-Check Metadata
-Compare with satellite catalogues
6] Information on occlusion (clouds artefacts)
expressed as a percentage of the spatial extent
Presenceabsence Check in Metadata interpretation text
7] Information on occlusion (clouds artefacts ) in
the form of a mask representing occluded areas
Presenceabsence Visual (on the map)
8] Overlap between geo information layers -Presenceabsence
-Pertinence
-Visual (on the map)
-Semi-automated (eg line segments point features
homogeneous segments)
9] Semantic definition of information content (either
public or ad hoc)
- Presenceabsence
- Completeness
-Check in Metadata
-Check if a reference for definition source is available on the
44
map
10] Information on the spatial detail of information
sources
- Presenceabsence of spatial resolution (for image
data)
- Presenceabsence of nominal scale (for vector data)
-Check in Metadata report or text supplied by the service
provider
11] The methodology used for accuracy assessment -Presenceabsence
- Pertinence
Check in Metadata report or text supplied by the service
provider
12] Credibility - The scientific and or social reputation and experience
of the source
- The independence of the source from
politicaleconomical interest on the
information delivered
-Validation expertrsquos experience -Experience record of the source
Consistency
of the
1] Consistency between absolute positional accuracies
(spatial details)
-Ratio between declared absolute positional accuracy
of the product and declared absolute positional
accuracy of information sources
-Ratio between declared absolute positional accuracy
of the product and absolute positional accuracy of
information contained in the product
Check in metadata Visual estimation computer assisted
assessment
2] The relative positional consistency across different
feature sets in the same product
Relative Root Mean Square Error -Derived from absolute positional accuracy
-Cross-check with GCPs obtained from reference
satellitemapvector
3] Relative time gap between most significant features Number of hours days months or years -Check in Metadata
4] Respect of generalization rules - Pertinence of symbolic representation according to
different scales and semantic hierarchy
-Pertinence of metric representation according to
different scales and semantic hierarchy
- Visual (on the map)
-Check in Metadata
5] Consistency between map and legend symbols -All map symbols are included in the legend Visual (on the map)
6] Compatibility between the geographic
coordinateprojection systems of the different
features (or geo-information layers) included in the
same product
Pertinence -Visual (on the map)
-Check in Metadata
- Check data file properties
45
information
support
7] Topological consistency - Adjacency of features
- Coverinclusion
- Presence of gaps
- Overlapping
- Closure of polygons
- Connection of networks
- Presence of dangles
- Continuity of features (across tiles)
-Visual (on the map)
-Computer aided topological tools
8] Attributes consistency - Data type compliance
- Value range
- Filling of required fields
- Visual (on the map)
-Computer aided
9] Consistency between declared and effective
representation scale
- Consistency of scale bar
- Consistency of numerical scale
Visual or computer aided control points
Usability of
1] Spatial coverage of the area of interest Percentage of the area of interest covered by the
product
-Visual (on the map)
-Computer aided
2] Overview map - Presenceabsence
- Pertinence
Visual (on the map)
3] Coordinate GraticulesGrid - Presenceabsence
-Pertinence of spacing
-Pertinence of coordinate labels (precision)
Visual (on the map)
4] Cartographic scale and printing size -Presenceabsence -Visual (on the map)
5] Description of processing steps information
sources
- Presenceabsence
-Pertinence
-Visual (on the map)
-Check in Metadata
6] Interpretation textreport - Presenceabsence
- Completeness
- Correctness of formulation and spelling
Visual (on the map)
7] Acknowledgments and source Presenceabsence Visual (on the map)
8] The name of producer Presenceabsence Visual (on the map)
9] Logos of partners (where a number of
organisations are responsible for the content and
publication of a map each organization should
receive equal prominence)
Presenceabsence Visual (on the map)
10] Media Used - Digital (GIS-ready image-ready graphic office-ready)
- Analogical (paper water-proof plastic other media)
and fitness for its intended use
- Consistency with the printing size
Visual
46
the product
11] Readability - Appropriate title fitting with the content (contains
topic location date)
- Adequacy of font size and color of text
- Labels are correctly placed
- Colors used for representing the different themes
are adequate and differentiable visual contrast
between background and map themes is satisfactory
- Symbols easily differentiable
- Absence of overlap between geo information layers
- Visual (on the map)
- Computer-aided
12] Legend symbols are clearly defined -Presenceabsence
- Pertinence
Visual (on the map)
13] Adequacy of the projection with the use Pertinence (eg area estimation requires equal area
projection in some case national projection system is
required)
- Check in Metadata
-Visual on the map
14] Multilingual support Pertinence of the map and supporting document
language(s)
Check in map and interpretation report
15] Metadata consistency - Identification information (resource title abstract
type identifier language)
- Classification of data and services (topic category)
- Keywords
- Geographic location (bounding box)
- Temporal reference
- Quality and validity (spatial accuracy)
- Responsible organization (contact information)
- Information on license and copyrights
- Metadata on metadata (metadata point of
contact metadata language)
-Check in Metadata if all information required for validation
is present
-Check if Metadata is compliant with pre-defined standards
(eg ISO 19115 and ISO 19119)
16] Version number of the product - Presenceabsence -Check in Metadata
-Visual (on the map)
17] Constraints related to access use and
information sharing
- Presenceabsence
- Type
Check in Metadata map layout report supplied by the
service provider
18] Existence of additional fees - Presenceabsence
- Amount and conditions
Check in Metadata map layout report supplied by the
service provider
19] Distribution Liability a statement of the liability
assumed by the distributor of a data set or
information resource
Presenceabsence Check in Metadata map layout report supplied by the
service provider
1] Delivery time from order Number of hours days months Cross check between service requirements (specifications)
47
Efficiency of
the service
and actual delivery time
2] Delivery cost Amount Cross check between service requirements (specifications)
and actual delivery cost
3] Technical support - 247 option available
- Multilingual call center
- Check in Metadata map layout report supplied by the
service provider
- Questionnaire
- Check in service requirements (specifications)
4] Frequency of update (in case of series of maps)
Number of hours days months - Check in Metadata map layout report supplied by the
service provider
- Check in service requirements (specifications
5] Integrity Compliance to standards of the media used for
product delivery
Check product before and after delivery to end user
Table 2- Summary checklist for validation attributes
48
466 Sampling scheme
For both thematic and positional accuracy computation it can be necessary to apply a sampling
scheme since usually it is impossible to validate the whole dataset In this paragraph general sampling
indications will be given Since it is not possible to consider all possible cases the validation expert
should take into account these indications and adapt them to each specific case using common sense
The sampling scheme will depend on the peculiarity of each map Just general criteria can be given at
this stage In any case the sampling design is a critical point because it can affect the assessment
results
There are many kinds of data that can be necessary to sample For example if products from a certain
service provider are to be validated the objects to sample are ldquoproductsrdquo in some other cases there can
be a product constituted by many tiles so the objects to sample are ldquotilesrdquo Hereinafter the objects to
be sampled will be addressed generically as ldquoelementsrdquo
All the elements should be divided into homogeneous groups if necessary and a sample from each
group should be validated For example if there are tiles of a base map representing a large territory
with both flat and mountainous areas both could be taken into account separately Also if necessary
each element should be divided into homogeneous strata for example if there are more layers each
layer should be dealt with separately
At least the 10-15 of the elements should be validated even if the number can vary according to
particular cases with a very large amount of data it could be possible to consider no more than 50-100
elements on the contrary with a very small amount of data at least 10-20 elements should be
considered
It is important to distinguish between the sampling for the positional accuracy assessment and for the
thematic accuracy assessment for each element or within each element stratum
Positional accuracy assessment Within each stratum the sampling scheme if possible should
reproduce approximately a grid In that way all parts of the map can be validated It is really important
to sample map borders to verify the presence and entity of border effects Depending on the subject of
the map the density of the sample can vary To have significant statistics of the results the samples
should include at least 20 points in really difficult conditions the number could decrease till 10 but
better results can be achieved considering 50-100 points
Thematic accuracy validation About thematic validation instead of single points polygons should
be preferred It is possible to consider different sampling schemes (Congalton and Green 1993)
- Random sampling this is the sampling scheme that gives the best statistical results about
samples independency
- Systematic sampling the samples are taken at a regular interval starting from a random point
It permits to uniformly cover the area of interest
- Stratified random sampling data are divided into strata for example one stratum for each
class or even more strata in one class if there are significant differences among different
zones and then each stratum is randomly sampled
It often happens that the selected points or polygons are not accessible on the field or it is impossible
to recover information about them so it can be necessary to move them Anyway those points or
polygons must be moved to a more accessible place taking into account the sampling scheme criteria
49
5 CONCLUSION
51 MAIN CONSIDERATIONS UPON THE VALIDATION PROCESS AFTER ITS IMPLEMENTATION
After the experience acquired in the implementation of the protocol the following considerations have
been originated upon the validation process
The protocol is a systematic collection of product attributes to be checked and of parameters and
methods that allow performing the assessment
The protocol application level the number of parameters that can be practically checked depends
on the context (type of product user needs available reference data)
The availability of reference data is a crucial issue for validation process
Additional reference data (eg GPS-tagged photos) can be provided by local authorities to help the
validation process
The protocol has been applied to practical cases and proved to be useful to highlight issues in the
delivered products eg
- arguable definition of normal water level in flood map
- difference between the cartographic scale of the maps and the scaleresolution of information
contents
- some confusion may occur between burned area related to activation specific event and
burned areas related to previous fires
- limits in detecting water in urban areas with SAR data
- a reference map used as background for emergency products is usually preferred by the user
with respect to background satellite images
52 MAIN RECOMMENDATIONS AND SUGGESTIONS FOR NEXT STEPS
To improve the validation process it is important
To develop the interface with service providers to enhance a positive feedback that helps them to
continuously improve the products‟ quality
To develop the interface with users to refine user requirements understanding
To cooperate with users to jointly define validation ranges for the most important attributes and
parameters (with respect to product type)
To define a ldquoprotocol for fast validationrdquo that allows performing the check of the product without
any reference data and to try to assess its usefulness
To define a list of mandatory attributes to be checked depending on the type of the product and on
the time frame given for validation
To experiment the use of mathematical models pre-event knowledge and ancillary data to reduce
the need of reference data
53 CONCLUDING REMARKS
The validation protocol described in this document aims at ensuring a consistency of the validation
process by providing guidelines for the assessment of the products attributes The protocol was
purposely defined at a generic level in order to accommodate with the different types and families of
emergency services and products
The application of the validation protocol can be performed at different levels depending on the
following main factors
The type of product to be validated (eg rapid situation assessment rapid damage assessment
situation assessment damage assessmenthellip) The type of product addresses priorities between
attributes to be included in the validation process and their validation ranges
The specific users‟ needs Users‟ needs can change priorities among attributes to be included in
the validation process and their validation ranges with respect to defaults or agreements eg users
50
could need an updated area of interest or a tradeoff between time delivery and accuracy
The availability of reference data On the one hand availability of reference data enables for a
complete validation process namely including the assessment of attributes defined under
ldquoReliability of the information contentrdquo On the other hand in case of absence of reference data it
is still possible to (partially) assess the product focusing on of attributes defined under
ldquoConsistency of information supportrdquo and ldquoReadabilityrdquo This latter approach is considerably less
informative than the former but given its fast application its reduced cost and the wide
applicability deserves to be considered and assessed The presented approach considers the need to achieve a balance between i) a comprehensive validation
of all aspects of a product and ii) a practical validation that helps users to be more effective in their
operations and service providers to improve the quality of the delivered products
6 ACKNOWLEDGMENTS
The research leading to these results has received partial funding from the European Communitys
Seventh Framework Programme (FP72007-2013) under grant agreement ndeg 218802
7 REFERENCES
American Society for Photogrammetry and Remote Sensing (ASPRS) Specifications Standards
Committee (1990) ASPRS Accuracy Standards for Large-Scale Maps Photogrammetric
Engineering and Remote Sensing 56(7) 1068-1070
Bernhardsen T (1999) Geographic Information Systems An Introduction New York
Campbell J B (1996) Introduction to remote sensing (2nd ed) London Taylor and Francis
Canters F (1997) Evaluating the uncertainty of area estimates derived from fuzzy land-cover
classification Photogrammetric Engineering and Remote Sensing 63(4) 403-414
Congalton R G (1991) A review of assessing the accuracy of classifications of remotely sensed
data Remote Sensing of Environment 37(1) 35-46
Congalton R G and K Green (1993) Practical look at the sources of confusion in error matrix
generation Photogrammetric Engineering and Remote Sensing 59(5) 641-644
httpwwwcolorbrewerorg (last access 1st September 2010)
Slocum T R McMaster et al (2005) Thematic Cartography and Geographic Visualization
Strahler A L Boschetti et al (2006) Global land cover validation Recommendations for evaluation
and accuracy assessment of global land cover maps
Zhang J and G M Foody (1998) A fuzzy classification of sub-urban land cover from remotely
sensed imagery International Journal of Remote Sensing 19(14) 2721-2738
European Commission EUR 24496 EN ndash Joint Research Centre ndash Institute for the Protection and Security of the Citizen Title Validation Protocol for Emergency Response Geo-information Products Author(s) Marco Broglia Christina Corbane Daniela Carrion Guido Lemoine and Martino Pesaresi Luxembourg Publications Office of the European Union2010 ndash 52 pp ndash 21 x 30 cm EUR ndash Scientific and Technical Research series ndash ISSN 1018-5593 ISBN 978-92-79-16428-6 doi10278863690 Abstract Europe is making a significant effort to develop (geo)information services for crisis management as part of the Global Monitoring for Environment and Security GMES) programme Recognising the importance of coordinated European response to crises and the potential contribution of GMES the Commission launched a number of preparatory activities in coordination with relevant stakeholders for the establishment of an Emergency Response GMES Core Service (ERCS) GMES Emergency Response Services will rely on information provided by advanced technical and operational capabilities making full use of space earth observation and supporting their integration with other sources of data and information Data and information generated by these services can be used to enhance emergency preparedness and early reaction to foreseeable or imminent crises and disasters From a technical point of view the use of geo-information for emergency response poses significant challenges for spatial data collection data management information extraction and communication The need for an independent formal assessment of crisis products to provide operational services with homogeneous and reliable standards has recently become recognized as an integral component of service development Validation is intended to help end-users decide how much to trust geo-information products (maps spatial dataset) The focus in this document is on geo-information products in particular those derived from Earth Observation data Validation principles have been implemented into a protocol as a tool to check whether the products meet standards and user needs The validation principles methods rules and guidelines provided in this document aim to give a structure that guarantees an overall documented and continuous quality of ERCS products
How to obtain EU publications Our priced publications are available from EU Bookshop (httpbookshopeuropaeu) where you can place an order with the sales agent of your choice The Publications Office has a worldwide network of sales agents You can obtain their contact details by sending a fax to (352) 29 29-42758
The mission of the JRC is to provide customer-driven scientific and technical support for the conception development implementation and monitoring of EU policies As a service of the European Commission the JRC functions as a reference centre of science and technology for the Union Close to the policy-making process it serves the common interest of the Member States while being independent of special interests whether private or national
LB
-NA
-24496-EN-N
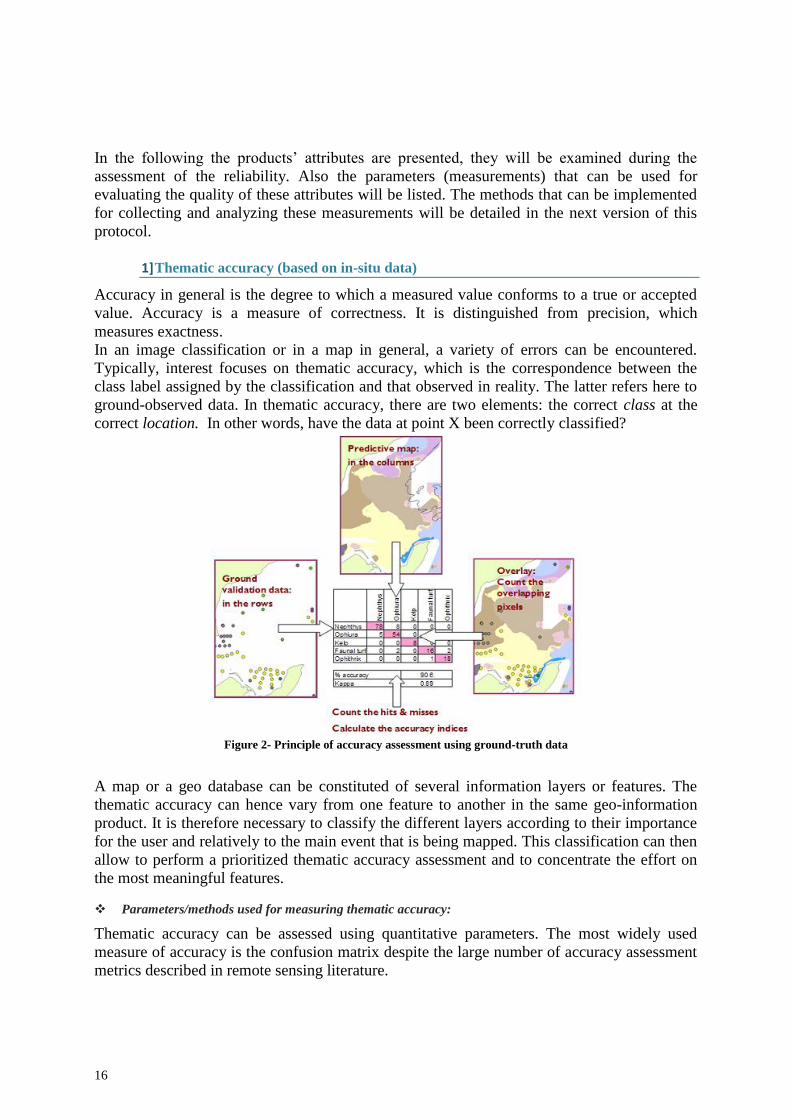
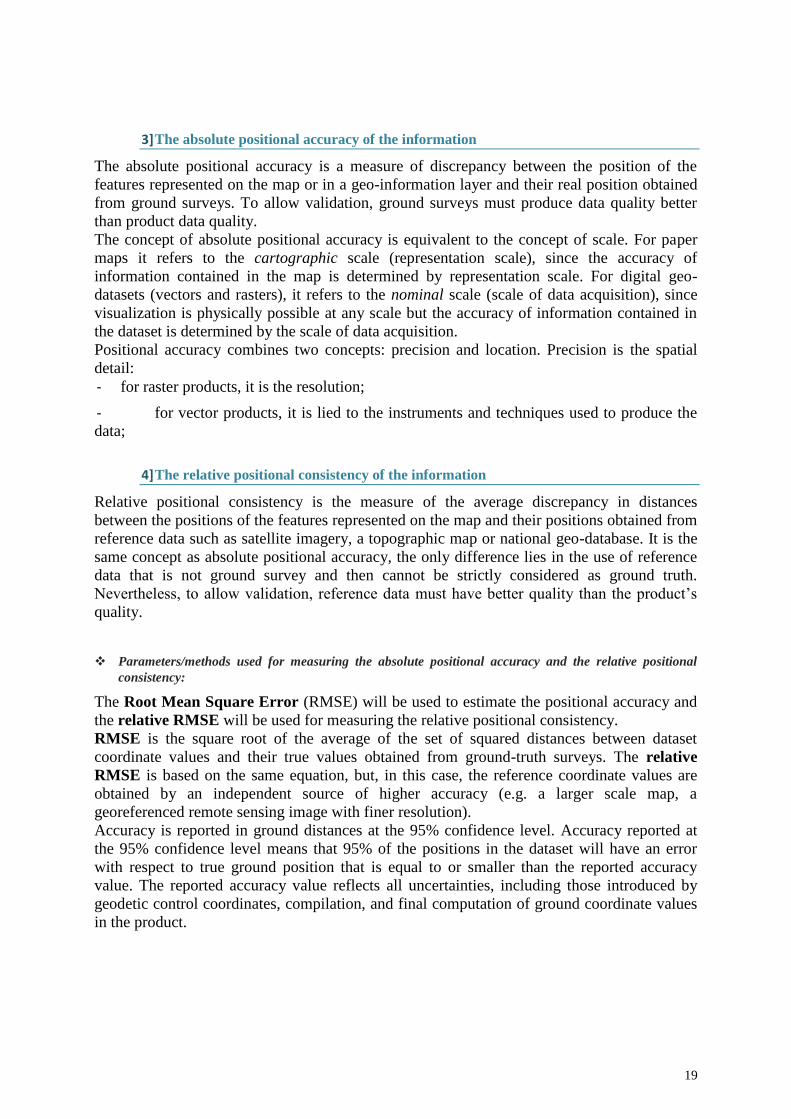
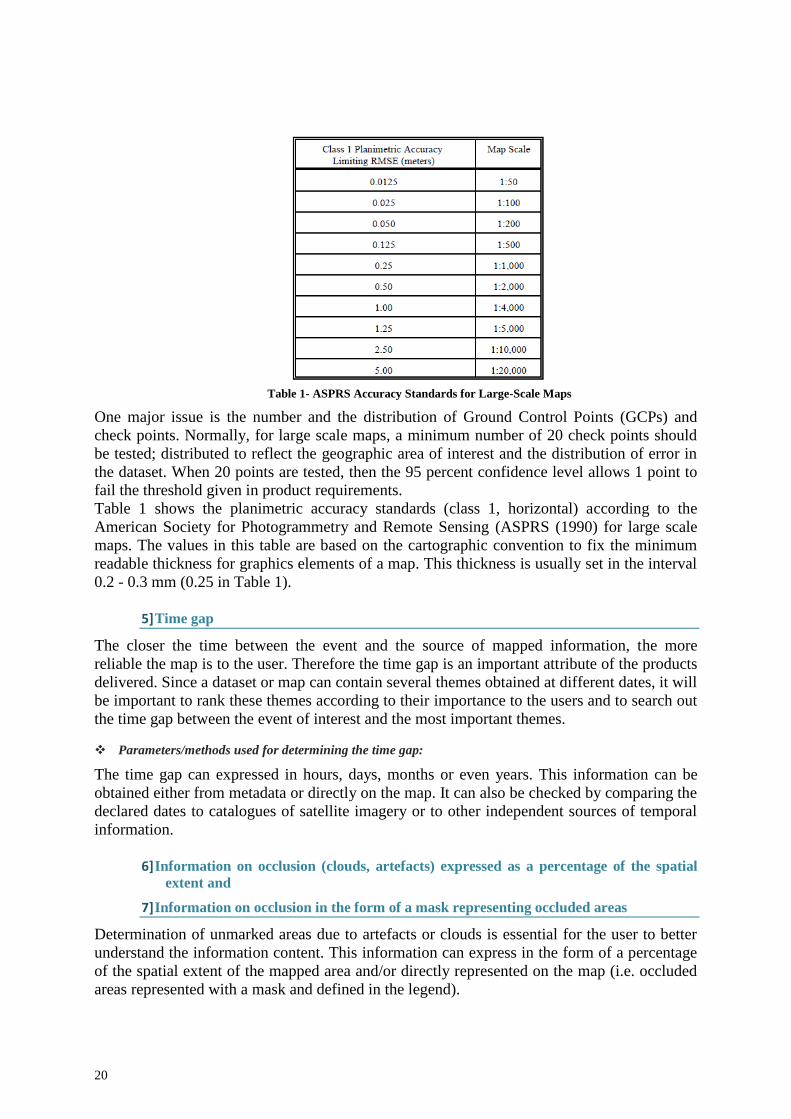
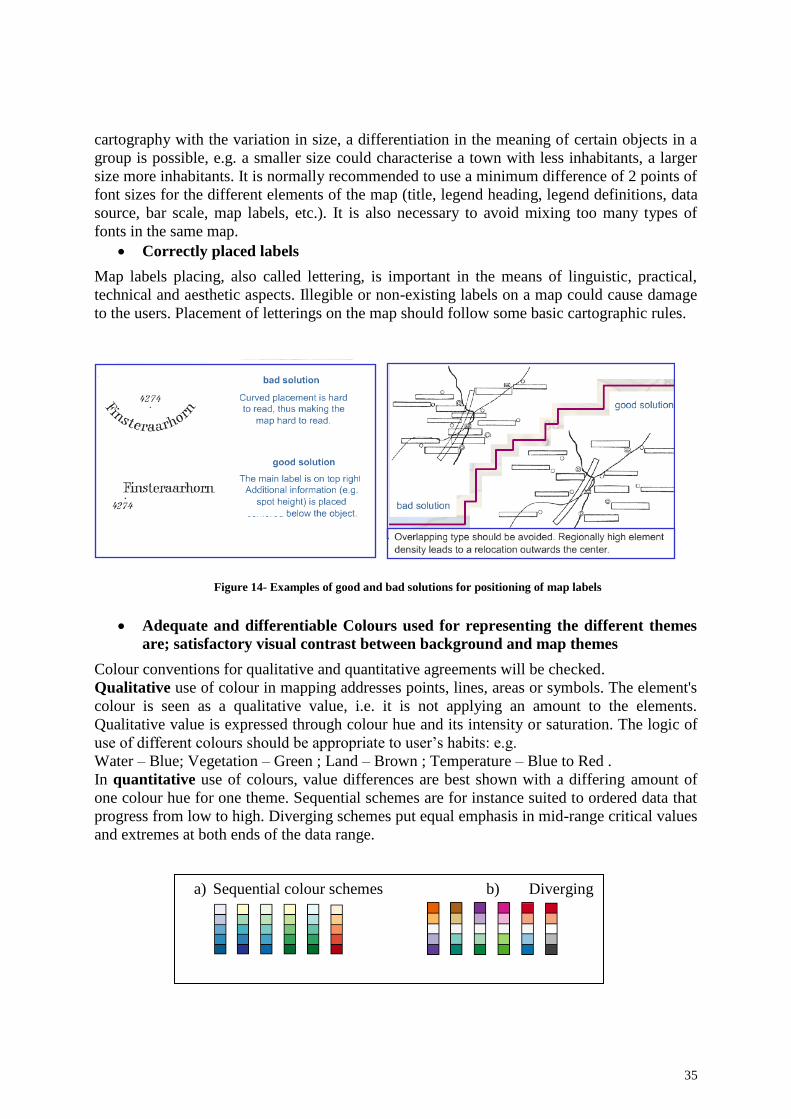
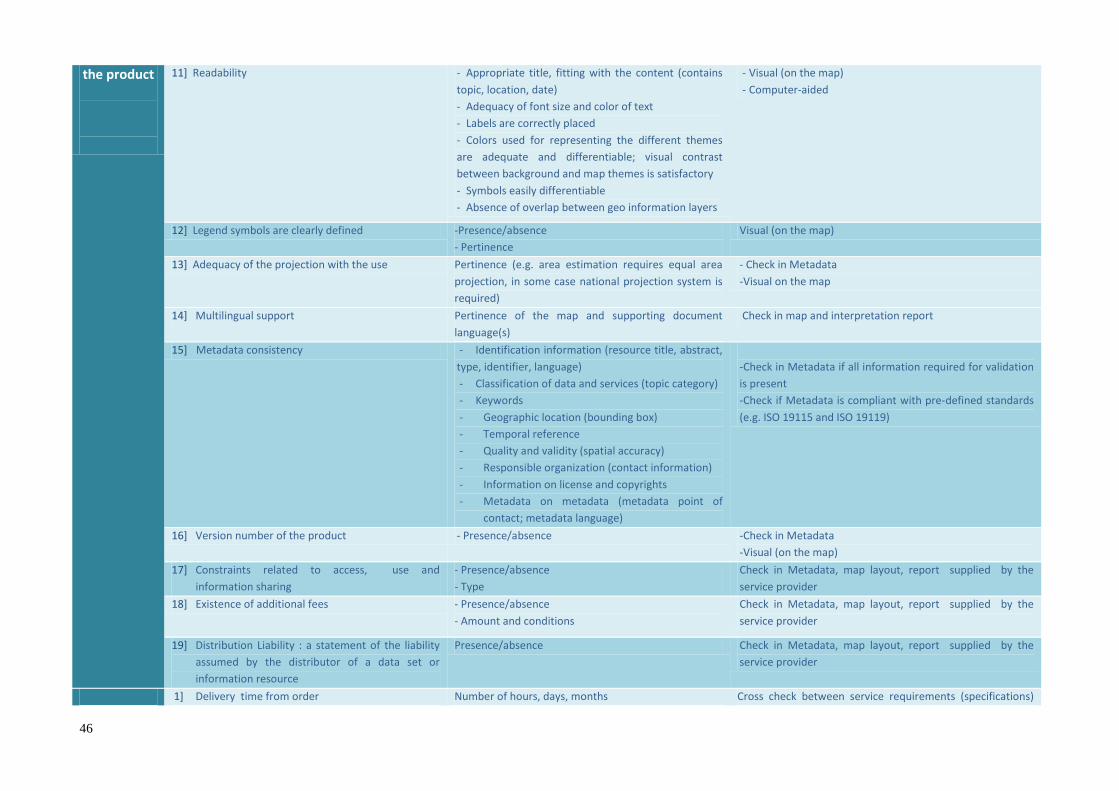


