Page 1
Validation Study of the Scale for Assessment of the Teaching-Learning Process, Student Version (ATLP-S)
Electronic Journal of Research in Educational Psychology, 8(2), 815-840. 2010 (nº 21). ISSN: 1696-2095. - 815 -
Validation Study of the Scale for
Assessment of the Teaching-Learning Process,
Student Version (ATLP-S)
Jesús de la Fuente1, Paul Sander
2, Fernando Justicia
3
M. Carmen Pichardo3, Ana B. García-Berbén
3
1 Dept. of Developmental & Educational Psychology,
University of Almería, Spain 2 University of Wales Institute, Cardiff, UK
3 Dept. of Developmental & Educational Psychology,
University of Granada, Spain
Spain/UK
Correspondence: Jesús de la Fuentes Arias: Department of Educational and Developmental Psychology.
Faculty of Psychology. University of Almería. Carretera de Sacramento s/n. 04120 La Cañada de San Urbano.
Almería, Spain. Tel: + 34 950 015354; Fax: +34 950 015083. E-mail: [email protected]
© Education & Psychology I+D+i and Editorial EOS (Spain)
Page 2
Jesús de la Fuente et al.
- 816 - Electronic Journal of Research in Educational Psychology, 8(2), 815-840. 2010 (nº 21). ISSN: 1696-2095.
Abstract
Introduction. The main goal of this study is to evaluate the psychometric and assessment
features of the Scale for the Assessment of the Teaching-Learning Process, Student Version
(ATLP-S), for both practical and theoretical reasons. From an applied point of view, this self-
report measurement instrument has been designed to encourage student participation in the
daily assessment of how the teaching-learning process occurs. From a theoretical point of
view, this 30-item scale was initially developed with rational criteria, inspired by the most
common curriculum models; in addition, we propose to empirically validate the instrument.
Method. A total sample of 1250 Spanish university students and 275 university students from
the UK participated in the assessment. The analyses made to assess its reliability, internal
validity (exploratory and confirmatory factorial analysis), and external validity (correlations
and MANOVAs).
Results and Discussion. We can be considered adequate and have proved to be powerful
enough to define relations with other variables—learning approach, or teaching and learning
experiences—in the sample with Spanish and UK versions of the instruments.
Keywords: Teaching-learning process, assessment, higher education, internal and external
validity, reliability scale.
Received: 05/18/10 Initial Acceptance: 05/18/10 Definitive Acceptance: 07/29/10
Page 3
Validation Study of the Scale for Assessment of the Teaching-Learning Process, Student Version (ATLP-S)
Electronic Journal of Research in Educational Psychology, 8(2), 815-840. 2010 (nº 21). ISSN: 1696-2095. - 817 -
Estudio de validación de la Escala para la Evaluación del
Proceso de Enseñanza-Aprendizaje, Versión del estudian-
tes (EEPEA-E)
Resumen
Introducción. El objetivo de este estudio ha sido validar empíricamente el instrumento, a
través de la evaluación psicométrica y definir las características de la Escala de Evaluación
del Proceso de Enseñanza-Aprendizaje, versión para estudiantes (ATLP-S), tanto por razones
prácticas como teóricas. Desde el punto de vista aplicado, este instrumento de medición tipo
auto-informe ha sido diseñado para fomentar la participación de los estudiantes en la evalua-
ción diaria de cómo el proceso de enseñanza-aprendizaje tiene lugar. Desde el punto de vista
teórico, esta escala de 30 ítems se desarrolló inicialmente con criterios racionales, inspirados
en el modelo curricular de los planes de estudio.
Método. Una muestra total de 1250 estudiantes universitarios españoles y 275 estudiantes
universitarios del Reino Unido participaron en la evaluación. Los análisis realizados para eva-
luar su fiabilidad, validez interna (exploratorio y confirmatorio análisis factorial), y validez
externa (correlaciones y MANOVAS).
Resultados y Discusión. El instrumento puede ser considerado apropiado y ha demostrado
ser lo suficientemente potente como para definir las relaciones con otras variables -enfoques
de aprendizaje o enseñanza y experiencias de aprendizaje- tanto en la versión española como
anglosajona .
Palabras clave: Proceso enseñanza-aprendizaje, evaluación, educación superior, validez in-
terna y externa, fiabilidad.
Recibido: 18/05/10 Aceptación Inicial: 18/05/10 Aceptación Definitiva: 29/07/10
Page 4
Jesús de la Fuente et al.
- 818 - Electronic Journal of Research in Educational Psychology, 8(2), 815-840. 2010 (nº 21). ISSN: 1696-2095.
Introduction
Since learning is not an isolated and exclusively internal process, it can be guided ex-
ternally, through the teaching process. This fact has been relevant in defining what should be
assessed in educational situations. Thus, as interest in students’ learning processes is increas-
ing, interest has also increased in the teaching process which guides the former (Butler &
Shibaz, 2009; De la Fuente & Eissa, 2010; Cardelle-Elawar, Irving, & Sanz de Acedo, 2007;
Coll, Rochera, Mayordomo & Naranjo, 2007; Entwistle & Tait, 1990; Hugener et al., 2009;
Husbands & Fosh, 1993; Kinchin, Lygo-Baker & Hay, 2008; Ramsden, 2003). This is what
has been defined as the construct “teaching-learning process” (hereafter TL), applying to dif-
ferent teaching situations, whether formal or non-formal. In formal teaching situations this
process is considered to be the design and development of how its three constituent elements
will interact: the curriculum, the teacher’s role and the students’ role.
Additionally, in recent decades there has been growing interest in teaching-learning
processes in Higher Education and in cultural differences (Oyserman, Coon, & Kemmelmeier,
2002; Postareff & Lindblom-Yänne, 2008; Trigwell & Prosser, 2004; Vermunt & Verloop,
1999). The way most students learn is highly influenced by their native culture; these cultural-
ly-defined learning characteristics contrast markedly in students from countries with quite
distinct cultures. For example, there is more in common with how British and American stu-
dents learn than what we find when comparing British students with other Europeans, such as
Spaniards or Italians (Klassen, 2004; Tweed & Lehman, 2002). There is a need to understand
how teaching and learning processes modulate one another, depending on the individuals’
approach to teaching or learning, respectively (Vermunt & Verloop, 1999).
Models and Instruments for Assessment of the Teaching-Learning Process
Several educational models have taken into account this interdependent, systematic
teaching-learning process. The Weinstein and Mayer Model (Weinstein & Mayer, 1986) con-
siders that good teaching must include not only content, but should also teach students how to
learn. The Entwisle Model has focused on evaluation of the most important aspects of the TL
process in order to improve instructional performance. Other models have accurately defined
the variables that should make up assessment of this construct. The Experiences of Teaching
Page 5
Validation Study of the Scale for Assessment of the Teaching-Learning Process, Student Version (ATLP-S)
Electronic Journal of Research in Educational Psychology, 8(2), 815-840. 2010 (nº 21). ISSN: 1696-2095. - 819 -
& Learning Questionnaire (Entwistle & McCune, 2004; Hounsell, Entwistle, et al., 2001-
2003) is the instrument for evaluation of one Model. It evaluates subjective experiences of the
Teaching and Learning Process. Biggs´ 3P Model (2001) is focused on the Presage-Process-
Product factors of the teaching and learning process. The assessment instrument is the R-
SPQ-2F, the revised Two-Factor Study Process Questionnaire SPQ (Biggs, Kember, &
Leung, 2001) which contains four subscales (Deep Motive; Deep Strategy; Surface Motive
and Surface Strategy) aimed at measuring two dimensions: deep and surface learning ap-
proaches. Justicia, Pichardo, Cano, Berbén y De la Fuente (2008) showed a confirmatory fac-
torial structure with a Spanish sample, similar to the study by Biggs et al.. (2001), coinciding
with a first-order factor structure (two factors).
Finally, the interactive instructional model DEDEPRO, acronym for Design-
Development- Product (De la Fuente & Justicia, 2007; De la Fuente, Justicia, & Berben,
2006) has made it possible to establish the factors that make up this process, either conceptu-
ally or empirically, as well as the instrument for evaluating different Teaching-Learning pro-
cesses. The scales for Interactive Assessment of the Teaching Learning Process, IATLP, is a
long self-report instrument to be completed by both teacher and students (De la Fuente &
Martínez, 2007).
However, one limitation of this more comprehensive assessment instrument is the
great number of items included, making it difficult to administer and interpret (Apodaca &
Grad, 2005; Ginns, Prosser, & Barrie, 2007). For this reason, we assume that there is still a
need for simpler instruments that will offer us a quick understanding of the TL process under
way, but without overlooking fundamental statistical values nor the complexity of the phe-
nomenon being studied. The scales for Assessment of the Teaching-Learning Process, ATLP,
is a short self-report version of the instrument, to be completed by the teacher and the students
(De la Fuente & Justicia, 2001, 2010).
The present study
The aims of this study are as follows:
1. To verify the reliability and validity values of this version of the ATLP-S, Assess-
ment of the Teaching-Learning Process - Student Version, with Spanish and UK samples.
2. To evaluate the statistical values that support the construct “teaching-learning pro-
Page 6
Jesús de la Fuente et al.
- 820 - Electronic Journal of Research in Educational Psychology, 8(2), 815-840. 2010 (nº 21). ISSN: 1696-2095.
cess”, assessed with this new self-report instrument.
3. To establish internal and external validity criteria for this version, through the anal-
ysis of interdependent relations between the assessment carried out on the teaching-learning
process, on student approaches to learning, and on teaching and learning experiences.
Method
Participants
The sample included the following groups: (1) a total of 1250 Spanish students (Uni-
versities of Almería and Granada) and 275 UK students (UWIC, Cardiff, UK) for the Re-
search & Development Project. Sample characteristics are shown in Table 1.
Table 1. Characteristic of the study sample
Sample Country University Degree Prog. Year Age Gender (%)
1. N=1250 Spain UAL, UGR 7 1st , 4
th 22.11(3.54) 19.5; 76.2
2. N=275 UK UWIC 1 1st , 2
nd 20.69 (4.97) 14.5; 51.7
Instruments
Assessment of the Teaching-Learning Process, Student version (ATLP-S)
The ATLP is a self-report instrument to be completed by the teacher and the students
(De la Fuente & Justicia, 2001, 2010), in its Spanish and English versions, respectively. It is
made up of a quantitative part with 30 items, 15 that evaluate perception of the teaching pro-
cess and another 15 that evaluate learning process perception. Responses are on a Likert-type
scale, with scores ranging from 1 (totally disagree) to 5 (totally agree). It also includes a
qualitative part where students can make recommendations for improving each of the pro-
cesses evaluated.
This instrument has been designed with curriculum criteria, since its aim is to evaluate
to what extent the different issues inherent in either the teaching process or the learning pro-
cess have been addressed. Initially, it was constructed with rational criteria, setting up the
items as follows (see Table 2). The Scale’s complete composition is presented in the Appen-
dix 1.
Page 7
Validation Study of the Scale for Assessment of the Teaching-Learning Process, Student Version (ATLP-S)
Electronic Journal of Research in Educational Psychology, 8(2), 815-840. 2010 (nº 21). ISSN: 1696-2095. - 821 -
Table 2. Original and rational item distribution within the Scale (De la Fuente & Justicia,
2001, 2010)
Curriculum Aspects Teaching process Learning Process
Why? items 1, 2 items 16, 17
What for? items 3, 4 items 18, 19
What? items, 5, 6, 7, 8 items 20, 21, 23, 24
How and when? items 9, 10, 11, 12, 13 items 25, 26, 27, 28
Evaluation? items 14, 15 items 29, 30
The R-SPQ-2F, The Revised Two-factor Study Process Questionnaire SPQ (Biggs et
al.., 2001).
This instrument contains 20 items in four subscales (Deep Motive; Deep Strategy; Sur-
face Motive and Surface Strategy) aimed to measure two dimensions: Deep and Surface learn-
ing approaches. Students are asked to respond to these items on a 5-point Likert-type scale
ranging from 1 (‘rarely true of me’) to 5 (‘always true of me’). The R-SPQ-2F was translated
into Spanish, adapted to take cultural differences into account, then independently translated
back and further modified where necessary. Justicia et al. (2008) showed a confirmatory fac-
torial structure with a Spanish sample, similar to the study by Biggs et al. (2001), with a first
order factor structure (two factors).
The Experiences of Teaching & Learning Questionnaire
This measurement instrument was used in its Spanish version and in its English ver-
sion (Entwistle & McCune, 2004). The original scale was used in the ETL Project, UK
(Hounsell, Entwistle et al., 2001-2003) and provides a valid, reliable means to evaluate expe-
riences of the Teaching and Learning Process. For more information, see
www.ed.ac.uk/etl/project.html. The values in our samples are: (1) For the 2004/2005 Spanish
sample, internal consistency is .93 (Cronbach’s alpha), and the Guttman split-half coefficient
values are .89 and .88 for the first and second middle Scales, respectively; (2) For the UK
2004/2005 sample, internal consistency is .94 (Cronbach's alpha), and .87 and .91 are the
Guttman split-half coefficient values for the first and second middle Scales, respectively.
Page 8
Jesús de la Fuente et al.
- 822 - Electronic Journal of Research in Educational Psychology, 8(2), 815-840. 2010 (nº 21). ISSN: 1696-2095.
Procedure
These Scales were completed voluntarily and anonymously during class time by uni-
versity students belonging to different groups, at the end of a four-month period in the same
academic year. Part of the data were obtained at different moments of the academic year (Feb-
ruary, for scales 2 and 3), and the other part at the end of the year (May-June for scale 1).
Statistical analysis
First, internal consistency was calculated using the standard means of Cronbach’s Al-
pha and Guttman & Spearman-Brown split-half reliability coefficients. Second, either the
internal or external instrument validity was studied. For internal validity, we used standard
exploratory factor analysis with its pre-requisites of both Barlett's Sphericity Test and the
Kaiser-Meyer-Olkin measure of sampling adequacy (KMO). The standard factorial or explor-
atory analysis was carried out by means of the Principal Components extraction method, us-
ing the classic statistical package SPSS. Moreover, to obtain a clear factorial solution,
Orthotrans/Varimax rotations were implemented. Assessment of internal validity was based
on confirmatory factor analysis (CFA), which is part of a more general class of approaches
called structural equation modeling (SEM). Structural equation modeling is a technique that
has been widely used for instrument validation and model testing (Bentler, 1995). AMOS
16.0 computer software (Arbuckle, 2008) was used to test model fitting. In order to evaluate
model fit, several fit indices were computed: the CMIN/DF index or chi-square to its degrees
of freedom ratio (X2 / df), the comparative fit index (CFI), and the root mean-square error of
approximation (RMSEA). These were calculated using the maximum likelihood estimation
method, a robust technique that has proven powerful against possible biases caused by viola-
tions of the multivariate normality and other statistical assumptions (Bentler, 1995; Bentler &
Dijkstra, 2000).
External validity study was estimated using two different strategies. The first was cor-
relation of the instrument score. In the second, we analyzed interdependent relations between
the instrument score for the level of perception of the Teaching and Learning Process, TLP,
with (1) Learning Approach, and (2) Teaching and Learning Experiences. For this objective,
we defined three levels (low-medium-high) in the perception of TLP, using cluster analysis.
ANOVAs and MANOVAs were executed previously using the SPSS 16.0 statistical package.
Page 9
Validation Study of the Scale for Assessment of the Teaching-Learning Process, Student Version (ATLP-S)
Electronic Journal of Research in Educational Psychology, 8(2), 815-840. 2010 (nº 21). ISSN: 1696-2095. - 823 -
Results
Reliability
In the Spanish sample we obtained: Cronbach Alpha = .930 (complete scale), .930
(first half) and .904 (second half). Spearman-Brown: .8439 and Guttman: .803. For the first
sub-scale, Teaching Process: .96 (total), .93 (first half) and .92 (second half). In the second
subscale, Learning Process: .94 (total), .93 (first half) and .88 (second half). For the British
sample: Cronbach Alpha = .913 (complete scale), .984 (first half) and .847 (second half).
Spearman-Brown: .736 and Guttman: .732. For the first sub-scale, Teaching Process: .88
(total), .83 (first half) and .80 (second half). In the second subscale, Learning Process: .85
(total), .80 (first half) and .73 (second half). Thus, reliability rates of the ATLP-S can be con-
sidered acceptable.
Internal Validity Criteria
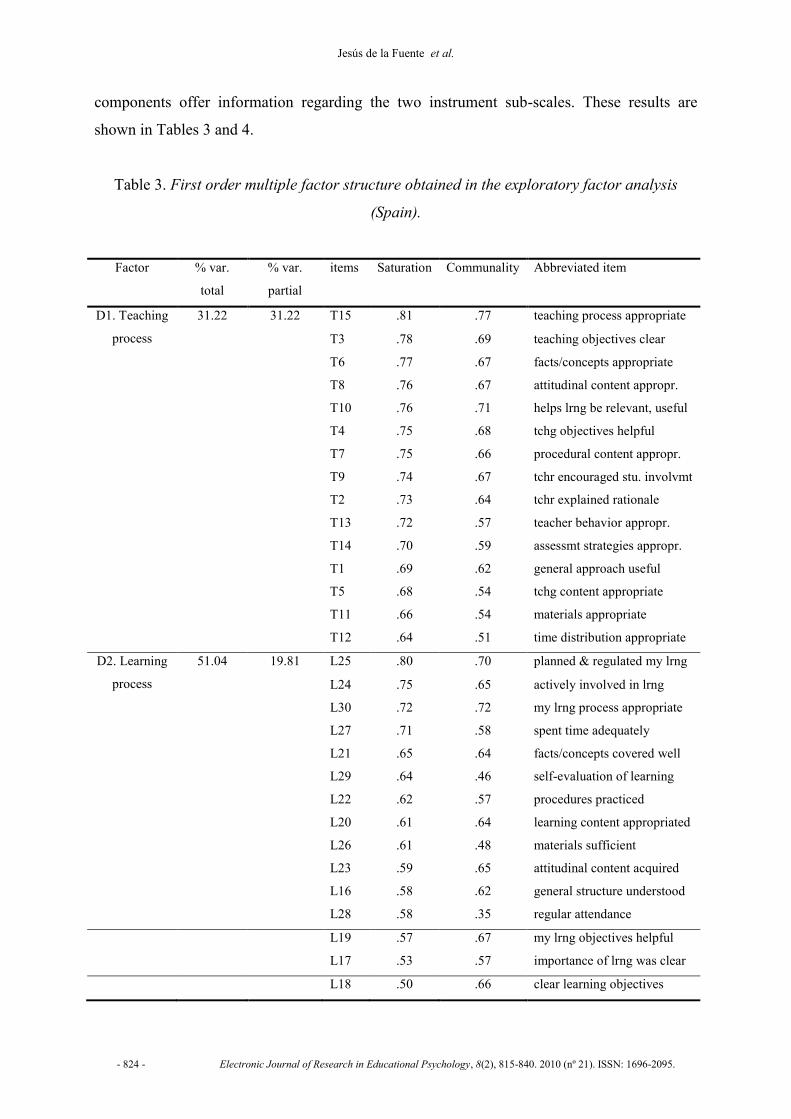
In the Spanish sample, results from exploratory factor analysis of principal compo-
nents show that the questionnaire has a two-factor structure (forced). The Bartlett test, a pre-
requisite to factor analysis, shows a chi-square value (435) =34456.046; p=.0000), demon-
strating that our data structure is valid for the factor analysis. The KMO rate=.971 also dem-
onstrates data suitability for factor analysis. The study of this double dimension of the teach-
ing-learning process, was by Principal Components with varimax rotation (rotation with no
factor limit and ignoring saturations less than .40). The analysis suggested two factors that
explained 51.04% of the variance. Results from the exploratory factor analysis of main com-
ponents offer information regarding the two instrument sub-scales.
In the UK sample, results from exploratory factorial analysis of main components
show that the questionnaire has a two-factor structure (forced). The Bartlett test, a pre-
requisite to the factorial analysis, shows a chi-square value (435) =1482.124 (p=.0000),
demonstrating that our data structure is valid for the factorial analysis. The KMO rate=.820
also demonstrates data suitability for factor analysis. The study of this double dimension of
the teaching/learning process, was by Principal Components with varimax rotation (rotation
with no factor limit and ignoring saturations less than .30). The analysis produced two factors
that explained 39.815% of the variance. Results from the exploratory factor analysis of main
Page 10
Jesús de la Fuente et al.
- 824 - Electronic Journal of Research in Educational Psychology, 8(2), 815-840. 2010 (nº 21). ISSN: 1696-2095.
components offer information regarding the two instrument sub-scales. These results are
shown in Tables 3 and 4.
Table 3. First order multiple factor structure obtained in the exploratory factor analysis
(Spain).
Factor % var.
total
% var.
partial
items Saturation Communality Abbreviated item
D1. Teaching
process
31.22 31.22 T15 .81 .77 teaching process appropriate
T3 .78 .69 teaching objectives clear
T6 .77 .67 facts/concepts appropriate
T8 .76 .67 attitudinal content appropr.
T10 .76 .71 helps lrng be relevant, useful
T4 .75 .68 tchg objectives helpful
T7 .75 .66 procedural content appropr.
T9 .74 .67 tchr encouraged stu. involvmt
T2 .73 .64 tchr explained rationale
T13 .72 .57 teacher behavior appropr.
T14 .70 .59 assessmt strategies appropr.
T1 .69 .62 general approach useful
T5 .68 .54 tchg content appropriate
T11 .66 .54 materials appropriate
T12 .64 .51 time distribution appropriate
D2. Learning
process
51.04 19.81 L25 .80 .70 planned & regulated my lrng
L24 .75 .65 actively involved in lrng
L30 .72 .72 my lrng process appropriate
L27 .71 .58 spent time adequately
L21 .65 .64 facts/concepts covered well
L29 .64 .46 self-evaluation of learning
L22 .62 .57 procedures practiced
L20 .61 .64 learning content appropriated
L26 .61 .48 materials sufficient
L23 .59 .65 attitudinal content acquired
L16 .58 .62 general structure understood
L28 .58 .35 regular attendance
L19 .57 .67 my lrng objectives helpful
L17 .53 .57 importance of lrng was clear
L18 .50 .66 clear learning objectives
Page 11
Validation Study of the Scale for Assessment of the Teaching-Learning Process, Student Version (ATLP-S)
Electronic Journal of Research in Educational Psychology, 8(2), 815-840. 2010 (nº 21). ISSN: 1696-2095. - 825 -
Table 4. First order multiple factor structure obtained in the exploratory factor analysis
(UK).
Factor % var.
total
% var.
partial
items Saturation Communality Abbreviated item
D1. Teaching
process
22.965 22.965 T15 .79 .645 teaching process appropriate
T1 .73 .545 general approach useful
T13 .69 .483 teacher behavior appropr.
T7 .69 .476 procedural content appropr.
T10 .68 .490 helps lrng be relevant, useful
T8 .64 .428 attitudinal content appropr.
T14 .62 .406 assessmt strategies appropr.
T5 .62 .420 tchg content appropriate
T6 .61 .373 facts/concepts appropriate
T3 .56 .435 teaching objectives clear
T2 .51 .394 tchr explained rationale
T9 .49 .325 tchr encouraged stu. involvmt
T4 .48 .485 tchg objectives helpful
T12 .44 .393 time distribution appropriate
T11 .43 .224 materials appropriate
D2. Learning
process
39.815 16.851 L25 .75 .570 planned & regulated my lrng
L30 .71 .538 my lrng process appropriate
L21 .71 .544 facts/concepts covered well
L27 .63 .409 spent time adequately
L24 .54 .384 actively involved in lrng
L19 .53 .406 my lrng objectives helpful
L22 .52 .405 procedures practiced
L20 .49 .332 learning content appropriated
L29 .47 .229 self-evaluation of learning
L16 .45 .409 general structure understood
L18 .44 .409 clear learning objectives
L17 .44 .383 importance of lrng was clear
L28 .42 .381 regular attendance
L23 .40 .301 attitudinal content acquired
L26 .40 .300 materials sufficient
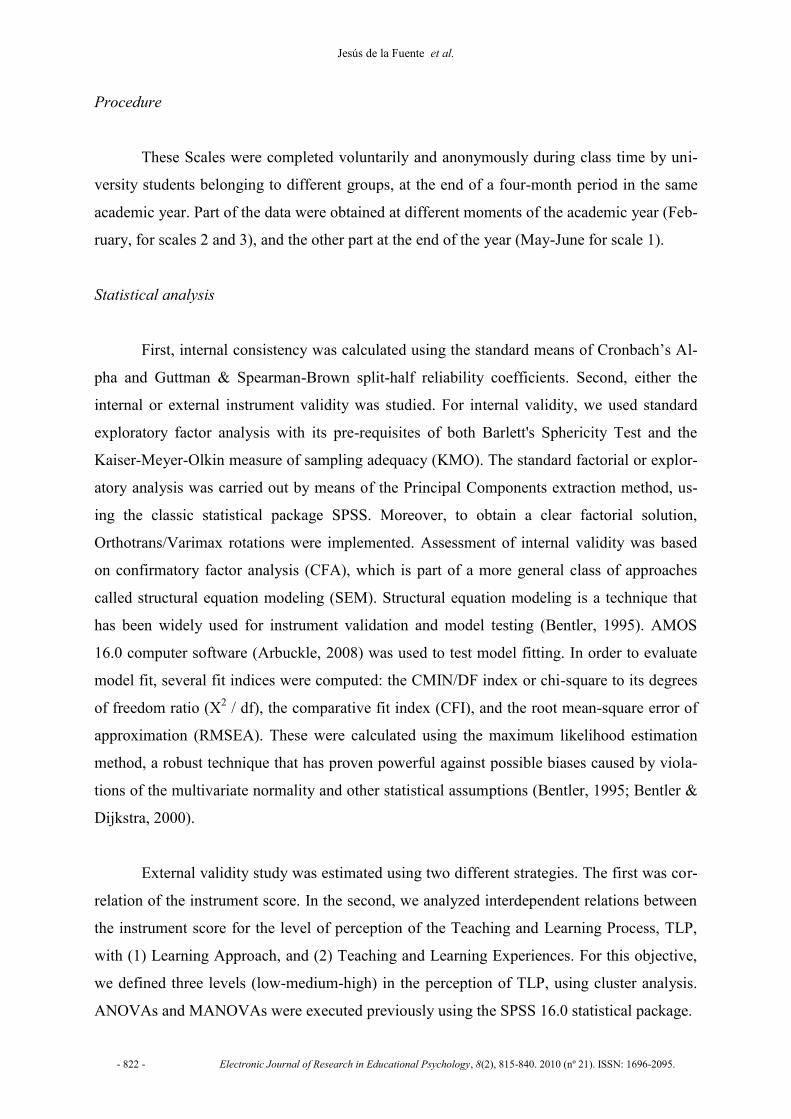
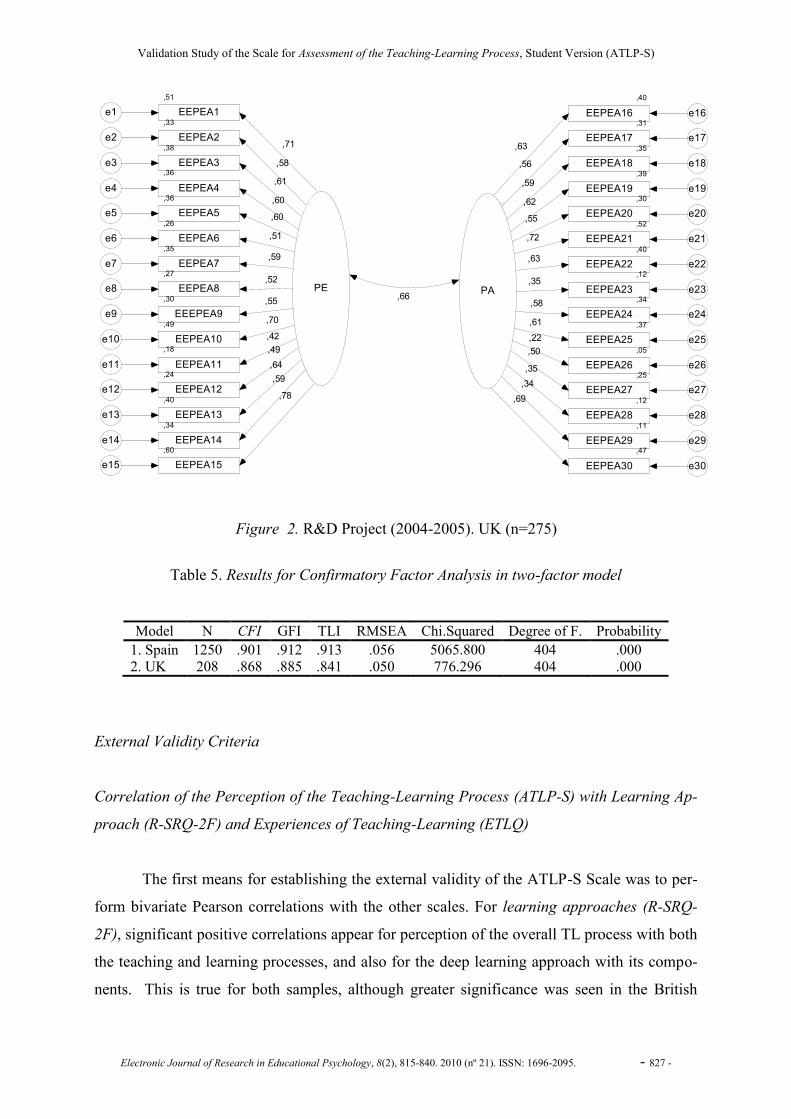
Confirmatory factor analysis was performed on the model using AMOS (op. cit.). The
results from CFA were considered in the light of the absolute-fit statistics: CFI, TLI, RMSEA
Page 12
Jesús de la Fuente et al.
- 826 - Electronic Journal of Research in Educational Psychology, 8(2), 815-840. 2010 (nº 21). ISSN: 1696-2095.
and Chi-Squared. To interpret the output statistics, CFI and TLI values close to .90 indicate a
good fit; RMSEA values in the 0.05-0.08 range represent reasonable approximation errors in
the population (Byrne, 2001). These indices are not exactly a good example of SEM’s best fit,
but it has been demonstrated recently that the choice of cutoff values depends on model speci-
fications, degrees of freedom, and sample size (Chen , Curran, Bollen, Kirby, & Paxton,
2008). Therefore, in global terms, the model can be considered defensible and valid, if we
appeal to the fact that our sample size is relatively small. Table 5 summarizes these statistics
for the default models. Figures 1 and 2 show the graphic outputs from AMOS.
PA
,52
EEPEA16 e16,46
EEPEA17 e17,57
EEPEA18 e18,56
EEPEA19 e19
,75 ,52
EEPEA20 e20,72
,52
EEPEA21 e21,72
,43
EEPEA22 e22,66
,49
EEPEA23 e23,70
,46
EEPEA24 e24,68
,43
EEPEA25 e25
,65
,25
EEPEA26 e26
,50
,32
EEPEA27 e27
,56
,13
EEPEA28 e28,29
EEPEA29 e29,55
EEPEA30 e30
PE
,69
EEPEA15e15
,43
EEPEA14e14
,46
EEPEA13e13
,29
EEPEA12e12
,41
EEPEA11e11
,62
EEPEA10e10
,57
EEEPEA9e9
,52
EEPEA8e8
,52
EEPEA7e7
,53
EEPEA6e6
,40
EEPEA5e5
,56
EEPEA4e4
,56
EEPEA3e3
,47
EEPEA2e2
,44
EEPEA1e1
,54
,64
,79
,76
,72
,72
,72
,64
,75
,67
,69
,83
,65
,75
,68
,72
,68
,76
,74
,54
,36
,83
Figure 1. R&D Project (2005-2008). Spain (n=1250)
Page 13
Validation Study of the Scale for Assessment of the Teaching-Learning Process, Student Version (ATLP-S)
Electronic Journal of Research in Educational Psychology, 8(2), 815-840. 2010 (nº 21). ISSN: 1696-2095. - 827 -
PA
,40
EEPEA16 e16,31
EEPEA17 e17,35
EEPEA18 e18,39
EEPEA19 e19
,62 ,30
EEPEA20 e20,55
,52
EEPEA21 e21,72
,40
EEPEA22 e22,63
,12
EEPEA23 e23,35
,34
EEPEA24 e24,58
,37
EEPEA25 e25
,61
,05
EEPEA26 e26
,22
,25
EEPEA27 e27
,50
,12
EEPEA28 e28,11
EEPEA29 e29,47
EEPEA30 e30
PE
,60
EEPEA15e15
,34
EEPEA14e14
,40
EEPEA13e13
,24
EEPEA12e12
,18
EEPEA11e11
,49
EEPEA10e10
,30
EEEPEA9e9
,27
EEPEA8e8
,35
EEPEA7e7
,26
EEPEA6e6
,36
EEPEA5e5
,36
EEPEA4e4
,38
EEPEA3e3
,33
EEPEA2e2
,51
EEPEA1e1
,49
,42
,70
,55
,52
,59
,51
,60
,60
,71
,58
,78
,59
,61
,64
,63
,56
,59
,69
,34
,35
,66
Figure 2. R&D Project (2004-2005). UK (n=275)
Table 5. Results for Confirmatory Factor Analysis in two-factor model
Model N CFI GFI TLI RMSEA Chi.Squared Degree of F. Probability
1. Spain 1250 .901 .912 .913 .056 5065.800 404 .000
2. UK 208 .868 .885 .841 .050 776.296 404 .000
External Validity Criteria
Correlation of the Perception of the Teaching-Learning Process (ATLP-S) with Learning Ap-
proach (R-SRQ-2F) and Experiences of Teaching-Learning (ETLQ)
The first means for establishing the external validity of the ATLP-S Scale was to per-
form bivariate Pearson correlations with the other scales. For learning approaches (R-SRQ-
2F), significant positive correlations appear for perception of the overall TL process with both
the teaching and learning processes, and also for the deep learning approach with its compo-
nents. This is true for both samples, although greater significance was seen in the British
Page 14
Jesús de la Fuente et al.
- 828 - Electronic Journal of Research in Educational Psychology, 8(2), 815-840. 2010 (nº 21). ISSN: 1696-2095.
sample. Conversely, significant negative correlations appear between the surface approach
and the perception of processes. Correlations are intense but low, meaning a strongly signifi-
cant relationship that guarantees the independence of the related variables.
The intense correlations and modulation by the students’ country of origin deserve
special mention. In the British students, a strong positive association appeared between the
deep approach and perception of the TL process, and a negative association appeared between
the surface approach and perception of the TL process (Table 6). In Spanish students, howev-
er, the negative relationship was consistent with the above result, but with less intensity of the
association.
As for correlation with teaching-learning experiences (ETLQ), results show a marked-
ly significant relationship between each of the processes and the different elements of this
questionnaire. Thus, total perception of the TL process is significantly correlated with the
Total on the Experiences of Teaching and Learning Questionnaire, as well as with its differ-
ent dimensions. The different cultural value given to the factor “level of demands” is worthy
of note. In the Spanish sample, level of demands has a significant, negative correlation with
satisfaction with the TL process, while in the British sample, the correlation is positive. Both
results are shown in Table 6.
Degree of Interdependence between Perception of the Teaching-Learning Process (ATLP-S)
and Learning Approach (R-SPQ-2F) and Experiences of Teaching-Learning (TLQ)
A second way to establish an external validity criterion for the ATLP-S Scale is to de-
termine the relationship between the assessed construct and another preset one. In order to do
so, cluster analyses were carried out for determining the low-medium-high subjects in terms
of their satisfaction with the teaching-learning process. Results show a consistent effect and
significant differences in interdependence levels. The level of perception or satisfaction with
the teaching and learning process (low-medium-high) reveals significant differences in learn-
ing approach (deep or surface) in both samples. Thus, the best perception of the teaching and
learning process involves a deep approach over a surface approach. The opposite effect also
occurs.
Page 15
Validation Study of the Scale for Assessment of the Teaching-Learning Process, Student Version (ATLP-S)
Electronic Journal of Research in Educational Psychology, 8(2), 815-840. 2010 (nº 21). ISSN: 1696-2095. - 829 -
Table 6. Correlations of the Scale for the Assessment of the Teaching Learning Process
(ATLP-S) with Learning Approach (R-SPQ-2F) and Experiences of Teaching and Learning
(ETL)
Spain Deep DM DS Surface SM SS (n=930)
TP .095*
.123*** .054 -.171*** -.131** -.176*** LP .273*** .265*** .240*** -.188*** -.142** -.197***
TLP .191*** .204*** .151*** -.194*** - .148*** -.202***
_________________________________________________________________________________
UK Deep DM DS Surface SM SS (n=208)
TP .341***
.325** .314** .-500*** -.483*** -.439*** LP .483*** .452*** .451*** .-372** -.425** -.264***
TLP .468*** .438*** .436*** .-499*** -.512*** -.407***
Spain ETL.T ETL.L ETL.DEM ETL.CONT ETL.TOTAL (n=930)
TP .692*** .630*** -.258*** .401*** .604***
LP .174*** .406*** -.216*** .426*** .624***
TLP .304*** .722*** -.260*** .448*** .666***
UK ETL.T ETL.L ETL.DEM ETL.CONT ETL.TOTAL (n=208)
TP .691*** .373*** .205*** .614*** .673***
LP .449*** .455*** .334*** .537*** .545***
TLP .469*** .647*** .300*** .650*** .688***
** p<.01 *** p<.001 TP= Teaching Process; LP= Learning Process; TLP= Teaching-Learning Process
DM= Deep Motivation; DS= Deep Strategy; SM= Surface Motivation; SS= Surface Strategy
ETLL= Learning Experience; ETLT= Teaching Experience; ETL.DEM= Experience of Demands, ETL.CONT=
Experience of Content, ETLTOTAL= Total Experience.
More specifically, in both samples, students with a high perception of the teaching
process show significant differences with respect to students with a low perception, scoring
higher on deep approach and lower on surface approach. This effect persists in the specific
analysis of motivation and deep strategy, and is even more consistent in the case of motiva-
tion and surface strategy. As for perception of the learning process, the statistical effect is
more powerful, showing the same trend and with greater strength, indicating that a high per-
ception of the learning process involves significantly greater levels of deep approach and
lower levels of surface approach. This trend is also appreciable in motivation and in strategy,
indicating greater levels of satisfaction with the learning process where students have greater
levels of motivation and deep strategy. See Table 7.
Page 16
Jesús de la Fuente et al.
- 830 - Electronic Journal of Research in Educational Psychology, 8(2), 815-840. 2010 (nº 21). ISSN: 1696-2095.
Table 7. Interdependence relations analysis with levels of the Assessment of the Teaching
Learning Process (ATLP-S) and Learning Approach (R-SPQ-2F)
Spain Teaching Process Perception Level Learning Process Perception Level
1. Low 2.Med 3.High Effect Eta 2 1.Low 2.Med 3. High Effect Eta 2
n=76 n=225 n=191 post n=114 n=249 n=129 post ________________________________________________________________________________________________________________
Approach F (4,978)=5.43*** .022 F(4,978)=11.10*** .043
_________________________________________________________________________________________________________________ DEEP 7.46 27.72 29.38 F(2,489)=4.28** .017 26.81 27.60 31.08 F(2,489)=17.62*** .041
(6.08) (6.64) (6.54) 3>2, 1* (6.04) (6.36) (.6.44) 3>2,1***
SURF 25.47 23.86 22.34 F(2,489)=8.31*** .033 25.05 23.62 21.97 F(2,489)=8.69*** .052
(5.91) (6.01) (5.08) 1> 3** (5.23) (6.09) (6.13) 1 >3***; 2 >3*
_________________________________________________________________________________________________________________ F(8,974)=8.97*** .027 F(8,974)=5.97*** .047
_________________________________________________________________________________________________________________
DM 14.05 14.31 14.51 F(2,489)=4.81** .019 14.04 14.39 16.08 F(2,489)=14.47*** .056 (3.06) (3.47) (3.42) 3>1, 2* (2.96) (3.55) (3.18) 3>1, 2***
DS 13.41 13.22 14.07 F(2,489)=3.09* .012 12.77 13.21 14.99 F(2,489)=15.33*** .059 (3.06) (3.51) (3.03) 3>2 (3.68) (3.32) (3.47) 3>2,1***
_________________________________________________________________________________________________________________
SM 10.97 10.23 9.62 F(2,489)=5.60** .022 10.72 10.12 9.54 F(2,489)=4.45** .018 (3.37) (3.03) (2.96) 1>3** (2.85) (3.17) (3.09) 1>3**
SS 14.50 13.64 12.72 F(2,489)=8.04*** .032 14.33 13.50 12.43 F(2,489)=9.37*** .037
(3.32) (3.56) (3.40) 1>3**, 1>2* (3.61) (3.49) (3.62) 1>3**, 1>2*
_________________________________________________________________________________________________________________ UK Teaching Process Perception Level Learning Process Perception Level
Low Medium High Effect Eta2 Low Medium High Effect Eta2
n=14 n=55 n=33 post n=17 n=52 n=23 post ________________________________________________________________________________________________________________
Approach F(4,170)=5.75* .119 F(4,168)=4.66*** .100 ________________________________________________________________________________________________________________
DEEP 30.20 31.04 32.00 F(2,85)=3.36* .073 30.13 31.10 36.69 F(2.84)=7.96*** .159
(4.78) (4.98) (7.18) 3>2* (4.90) (4.40) (8.30) 3>1,2***
SURF 28.50 24.06 19.52 F(2,85)=12.47*** .227 25.48 23.33 19.25 F(2.84)=5.73** .120
(4.85) (5.94) (4.25) 1,2 > 3 *** (5.60) (4.92) (7.63) 1 > 3**, 2>3* ________________________________________________________________________________________________________________
F(8,166)=3.60*** .148 F(8,164)=3.27** .129
________________________________________________________________________________________________________________ DM 15.40 15.37 17.03 F(2,85)=3.23* .073 15.17 15.35 18.44 F(2,84)=9.14*** .179
(2.36) (2.58) (3.36) 3>2* (2.69) (2.32) (2.90) 3>2,1***
DS 14.80 15.67 17.21 F(2,85)=2.71* .060 14.96 15.75 18.25 F(2,84)=5,30** .112
(2.74) (3.01) (4.09) (2.61) (2.32) (3.48) 3>2,1**
SM 12.30 10.92 8.24 F(2,85)=11.20*** .020 11.65 10.21 8.19 F(2,84)=6.36** .132
(1.76) (3.32) (2.13) 1>2,3*** (2.94) (2.64) (3.90) 1>3**
SS 16.20 13.14 11.28 F(2,85)=10.58*** .191 13.83 13.13 11.06 F(2,84)=3.61* .079
(3.70) (3.20) (2.52) 1>2, 3** (3.31) (2.93) (3.97) 1>3*
* p<.05, ** p<.01, *** p<.001
DM= Deep Motivation; DS= Deep Strategy; SM= Surface Motivation; SS= Surface Strategy
In complementary fashion, high-medium-low levels of perception of the teaching and
learning process are accompanied by similar levels of the experience of teaching-learning, in
total experience, experience of teaching, experience of learning, and of learning content, in
the samples of Spanish and British students. One noteworthy effect that differentiates between
students is the “experience of demands” variable (ETLDE). Mean scores on this variable for
Spanish students are greater than for the British, both for the teaching process and the learning
Page 17
Validation Study of the Scale for Assessment of the Teaching-Learning Process, Student Version (ATLP-S)
Electronic Journal of Research in Educational Psychology, 8(2), 815-840. 2010 (nº 21). ISSN: 1696-2095. - 831 -
process. Moreover, Spanish students who have a low perception of the teaching and learning
process report greater levels of demanding experiences than do those with a high perception
of the process. However, the opposite occurs in the case of British students, where the stu-
dents most satisfied with the teaching and learning process are those who report greater de-
mands and requirements. See Table 8.
Table 8. Interdependence relations analysis with levels of the Assessment of the Teaching-
Learning Process (ATLP-S) and Experiences of Teaching and Learning (ETLQ).
Spain Teaching Process Perception Level Learning Process Perception Level
1. Low 2.Med 3.High 3. Effec Eta 2 1.Low 2.Med 3. High Effect Eta 2
n=76 n=225 n=191 post n=114 n=249 n=129 post
Experience
ETLTO 230.81 252.52 277.52 F(2,634)=160.39*** .336 233.74 257.94 281.77 F(2,634)=168.86*** .348
(27.88) (23.12) (22.86) 3 >2>1*** (25.51) (22.71) (23.65) 3>2>1***
F(8,1264)=42.96*** .214 F(8,1264)=39.65*** .201
ETLT 115.70 135.04 140.08 F(2,634)=226.80*** .417 120.05 140.35 158.11 F(2,634)=177.28*** .359
(20.97) (17.73) (22.84) 3>2>1*** (20.41) (18.14) (16.55) 3>2>1***
ETLL 58.95 59.84 62.41 F(2,634)=13.32*** .040 57.47 60.11 64.68 F(2,634)=53.05*** .143
(7.00) (6.34) (6.99) 3 >1, 2 *** (6.81) (6.20) (6.66) 3>2>1***
ETLDE 31.40 29.85 28.20 F(2,634)=13.48*** .041 31.02 29.40 28.20 F(2,634)=10.48*** .032
(5.37) (4.56) (5.68) 3 <1,2 *** (4.96) (4.90) (7.12) 1>2**, 1>3***
ETLCO 24.76 27.43 30.33 F(2,634)=52.64*** .142 25.20 28.09 30.78 F(2,634)=52.56*** .142
(5.49) (4.42) (5.20) 3 > 2 > 1*** (5.04) (4.32) (5.77) 3 > 2 > 1***
UK Teaching Process Perception Level Learning Process Perception Level
Low Medium High Efect Eta2 Low Medium High Efect Eta2
n=14 n=55 n=33 post n=17 n=52 n=23 post
Experience
ETLTO 142.41 165.66 214.60 F(2,89)=41.80*** .484 131.59 162.38 187.17 F(2,89)=25.15*** .361
(23.20) (20.54) (25.33) 3>2>1*** (17.99) (25.78) (25.56) 3>2>1***
F(8.174)=9.70*** .370 F(8.174)=6.47*** .229
____________________________________________________________________________________________________
ETLT 63.19 81.72 109.50 F(2,89)=42.68*** .490 58.76 79.25 90.57 F(2,89)=17.090*** .278
(14.43) (13.11) (19.70) 3>2>1*** (12.00) (17.47) (19.22) 3>1,2***, 2>1*
ETLL 42.56 44.28 54.70 F(2,89)=13.86*** .230 39.00 44.31 50.26 F(2,89)=15.76*** .262
(5.95) (6.29) (8.55) 3>2>1*** (4.77) (6.07) (7.80) 3>1,2***, 2>1*
ETLEX 23.66 23.24 29.40 F(2,89)=6.38** .126 22.47 23.23 27.09 F(2,89)=5.62** .112
(5.32) (4.26) (6.36) 3>1, 2** (5.25) (4.25) (6.40) 3>2,1***
ETLCO 13.00 16.42 21.00 F(2,89)=18.148*** .290 11.35 15.60 19.26 F(2,89)=21.82*** .329
(3.80) (3.97) (3.36) 3>2>1*** (2.34) (3.59) (4.78) 3>2>1***
* p<.05, ** p<.01, *** p<.001
ETLTO= Total Experience; ETLT= Teaching Experience; ETLL= Learning Experience; ETLDE= Experience of Demands, ETLCO=
Experience of Content
Page 18
Jesús de la Fuente et al.
- 832 - Electronic Journal of Research in Educational Psychology, 8(2), 815-840. 2010 (nº 21). ISSN: 1696-2095.
Discussion and Conclusions
We can make certain reflections about the aims of this study, based on results ob-
tained. As for verification and assessment of the structural and relational aspects of this Scale,
the results are encouraging. Statistical values relating to the instrument’s soundness and valid-
ity are acceptable. As for the construct validity of the instrument, we have demonstrated that
the two-factor structure is consistent for the construct “Teaching Learning Process” as postu-
lated in the theoretical basis for this instrument, defined by several authors (Entwistle & Tait,
op cit). Another relevant result refers to the higher factorial weight of the learning process in
the first order factorial structure. In order to better understand this result, we must consider
the fact that students pay more attention to assessment of the teaching process than to as-
sessing the learning process.
Regarding the instrument’s external validity, the results are also consistent, since there
are different interdependent relationships among the perception of variables which exist in an
academic environment. Variations in scores for the learning process have proved that the
Scale is sensitive to the latter’s influence on the teaching-learning process. We have also
demonstrated that assessment of the teaching process and of the learning process are interde-
pendent, whether we speak of students’ approach to learning, their perception of teaching and
learning experiences, or academic performance. These results provide empirical evidence of
the scale’s external validity.
The nature of one’s learning approach, whether surface or deep, is determined once
again by affective (motivational) and cognitive (strategic) components (Biggs et al.., 2001).
Some empirical studies have demonstrated a high positive correlation between the motiva-
tional and strategic components and a given approach, and a null or negative correlation with
the opposite approach (Berbén, 2005; Biggs et al.., 2001; Harris, Wickline, & Iliescu, 2004;
Leung & Chan, 2001; Pilcher, 2002). Other prior studies have shown similar relationships
between learning approaches and self-regulation (Phan, 2008) and between the teaching-
learning process and self-regulation (De la Fuente, Justicia, & Berben, 2005). Phan (2008)
performed a regression analysis and concluded that deep motivation predicted self-regulated
learning in 603 university students in the South Pacific. Similarly, De la Fuente et al. (2005)
showed that self-regulation has a positive correlation with the deep approach and a negative
Page 19
Validation Study of the Scale for Assessment of the Teaching-Learning Process, Student Version (ATLP-S)
Electronic Journal of Research in Educational Psychology, 8(2), 815-840. 2010 (nº 21). ISSN: 1696-2095. - 833 -
correlation with the surface approach in 492 university students in Almería and Granada
(Spain). Furthermore, the cluster analysis results revealed one group of students (n=99) with
more surface learning and lacking in self-regulation, and another group (n=127) which learns
more deeply and is more self-regulated. However, the current investigation has established a
consistent relationship between perception of the teaching-learning process, learning ap-
proach, and teaching-learning experiences, which to date had not been established with suffi-
cient precision.
In summary, this instrument can contribute to improving the teaching-learning process
at a university level. On one hand, it helps students change some wrong conceptions about
learning and teaching (Eklund-Myrskog, 1998; Kember, Jenkins, & Chi, 2004; Scouller,
1998), since it allows student participation in assessment of the teaching and learning pro-
cesses under way (Coll et al., 2007; Husbands & Fosh, 1993; Kelvin, 1993; Kember & Wong,
2000; Wehmeyer, et al., 2003, 2007). On the other hand, evaluation of the quality of the
teaching-learning process at university is made possible (De la Fuente & Cardelle-Elawar,
2009; Enmanuel & Adams, 2006; Ginns, Prosser, & Barri, 2007; Harvey & Green, 1993;
Print & Hattie, 1997; Zohar & Bracha, 2008). It also gives teaching staff the opportunity to
reflect on these processes (De la Fuente, Justicia, & Berben, 2005; Entwistle & Peterson,
2004; Jarvinen & Kohonen, 1995; Pratt, 1997), especially when teachers are new graduates
with a great deal of formative requirements (Trigwell, Prosser & Taylor, 1994).
Nonetheless, the current research has limitations which should be addressed. The re-
duced size of the British sample is a significant obstacle in carrying out the analyses. It will be
necessary to replicate this work with broader British samples. Future lines of research are
suggested, such as performing cultural validation studies, studying relationships with teaching
and learning approaches, and above all, studying the Aptitude-Treatment Interaction (ATI), in
order to consider how different approaches to learning and teaching interact in university stu-
dents.
Page 20
Jesús de la Fuente et al.
- 834 - Electronic Journal of Research in Educational Psychology, 8(2), 815-840. 2010 (nº 21). ISSN: 1696-2095.
Acknowledgement
This work was carried out under the auspices of:
1) RD&I Project ref. BSO2003-06493. Improving self-regulated learning in university stu-
dents through online regulatory strategies for teaching. Ministry of Science and Technology
and European Found Social (2003-2006), Spain.
2) RD&I Project ref. SEJ2007-66843/educ. The assessment of improvement in the teaching-
learning process and of competencies, in the European Space for Higher Education: Model
and Protocols. Ministry of Education and Science European Found Social (2007-2010). Spain
Page 21
Validation Study of the Scale for Assessment of the Teaching-Learning Process, Student Version (ATLP-S)
Electronic Journal of Research in Educational Psychology, 8(2), 815-840. 2010 (nº 21). ISSN: 1696-2095. - 835 -
References
Arbuckle, J.L., (2008). AMOS 16.0. Chicago: SPSS Corporation.
Apodaca, P. & Grad, H. (2005). The dimensionality of student ratings of teaching: integration
of uni- and multidimensional models. Studies in Higher Education, 30(6), 723-748.
Berbén, A.B.G. (2005). A study of approaches to learning in students of Educational and
School Psychology. Electronic Journal of Research in Educational Psychology, 6, 3(2),
109-126.
Bentler, P. M. (1995). EQS Structural equations program manual. Encino, CA: Multivariate
Software Inc.
Bentler, P. M., & Dijkstra, T. (2000). Efficient estimation via linearization in structural mod-
els. In P. R. Krishnaiah (Ed.), Multivariate Analysis VI (9-42). Amsterdam: North-
Holland
Bigg, J. (2001). Teaching for Quality Learning at University (3rd
ed.). Buckingham: Open
University Press.
Biggs, J., Kember, D. & Leung, D. (2001). The revised two-factor Study Process Question-
naire: R-SPQ-2F. British Journal of Educational Psychology, 71, 133-149.
Butler, R. & Shibaz, L. (2009). Achievement goals for teaching as predictor of students’ per-
ception of instructional practices and students’ help seeking and cheating. Learning &
Instruction, 18(59), 453-467.
Byrne, B. (2001). Structural Equation Modelling in AMOS; Basic Concepts, Applications,
and Programming. New Jersey: Lawrence Erlbaum.
Cardelle-Elawar, M.C., Irving, L., & Sanz de Acedo, M.L. (2007). A cross cultural analysis of
Motivational Factors that Influence the Professional Identity. Electronic Journal of Re-
search in Educational Psychology, 5(3), 565-592.
Coll, C., Rochera, M.J., Mayordomo, R.M., & Naranjo, M. (2007). Continuous assessment
and support for learning. An experience in educational innovation with ICT support in
higher education. Electronic Journal of Research in Educational Psychology, 5(3), 783-
804.
Chen, F., Curran, P.J., Bollen, K.A., Kirby, J., & Paxton, P. (2008). An empirical evaluation
of the use of fixed cutoff points in RMSEA Test Statistic in Structural Equation Models.
Sociological Methods & Research, 36(4), 462-494.
Page 22
Jesús de la Fuente et al.
- 836 - Electronic Journal of Research in Educational Psychology, 8(2), 815-840. 2010 (nº 21). ISSN: 1696-2095.
De la Fuente, J. & Cardelle-Elawar, M.C. (2009). Research on action-emotion style and study
habits: Effects of individual differences on learning and academic performance of under-
graduate students. Learning & Individual Differences, 19 (5), 567-576.
De la Fuente, J. & Eissa, M.A. (2010). International Handbook on Applying Self-Regulated
Learning in Different Settings. Almería (Spain): Education & Psychology I+D+i, e-
Publishing Series.
De la Fuente, J. & Justicia, F. (2001). Escala para la Evaluación del Proceso de Enseñanza-
Aprendizaje, EEPEA. [Scale for the Assessment of the Teaching-Learning Process,
ATLP.] Almería (spain): University Publications Service.
De la Fuente, J. & Justicia, F. (2007). The DEDEPRO Model for Regulating Teaching and
Learning: recent advances. Electronic Journal of Research in Educational Psychology,
5(3), 535-564.
De la Fuente, J. & Justicia, F. (2010). Assessment of the Teaching-Learning Process (ATLP).
Almería (Spain): Education & Psychology I+D+i, e-Publishing Series. In press.
De la Fuente, J., Justicia, F. & Berbén, A.B.G. (2005). Enfoques de aprendizaje, percepción
del proceso de enseñanza/aprendizaje y rendimiento de universitarios. [Learning ap-
proaches, perception of the teaching/learning process and performance of university
students.] Revista de Psicología y Educación, 1(2), 87-102.
De la Fuente, J., Justicia, F., & Berbén, A.B.G. (2006). An Interactive Model of Regulated
Teaching and Self-regulated Learning. International Journal of Learning, 12(7), 217-225.
De la Fuente, J. & Martínez, J. M. (2007). Scale for Interactive Assessment of the Teaching-
Learning Process, IATLP. Almería (Spain): Education & Psychology I+D+i, e-Publishing
Series.
Eklund-Myrskog, G. (1998). Students’ conceptions of learning in different educational con-
texts. Higher Education, 35, 299-316.
Emanuel, R. & Adams, J. N. (2006). Assessing college student perceptions of instructor cus-
tomer service via the quality of instructor service to students (QISS) questionnaire. As-
sessment and Evaluation in Higher Education, 31(5), 535-549.
Entwistle, N., & McCune, V. (2004). The conceptual basis of study strategy inventories. Edu-
cational Psychology Review, 16, 325-345.
Entwistle, N.J. & Peterson, E.R. (2004). Conceptions of learning and knowledge in higher
education: relationships with study behavior and influences of learning environments. In-
ternational Journal of Educational Research, 41(3), 407-428.
Page 23
Validation Study of the Scale for Assessment of the Teaching-Learning Process, Student Version (ATLP-S)
Electronic Journal of Research in Educational Psychology, 8(2), 815-840. 2010 (nº 21). ISSN: 1696-2095. - 837 -
Entwistle, N. & Tait, H. (1990). Approaches to learning, evaluations of teaching, and prefer-
ences for contrasting academic environments. Higher Education, 19, 169-194.
Ginns, P., Prosser, M., & Barrie, S. (2007). Students' perceptions of teaching quality in higher
education: the perspective of currently enrolled students. Studies in Higher Education,
32(5), 603–615.
Harris, J.M., Wickline, V.B., & Iliescu, C.S. (2004). Construct Validation of Revised Study
Process Questionnaire (R-SPQ-2F) with an American College Sample. Poster presented
at the 16th Annual Convention, May, Chicago (Illinois). Accessed on June 10, 2004 at:
http://www.psychologicalscience.org/convention/program/search/results.cfm?Author=40
18
Harvey, L. & Green, D. (1993). Defining Quality. Assessment & Evaluation in Higher Educa-
tion, 18(1), 9-34.
Hounsell, D., Entwistle, N., et al. (2001-2003). ETL project. Enhancing Teaching-Leaning
Environments in Undergraduate Courses. The School of Education, University of Edin-
burgh.
Hugener, I., Pauli, C., Reusser, K., Lipowsky, F., Rakoczy, K., & Klieme, E. (2009). Teach-
ing patterns and learning quality of Swiss and German mathematics lesson. Learning & In-
struction, 19(1), 66-78.
Husbands, C. T & Fosh, P. (1993). Students’ evaluation of Teaching in Higher Education:
experiences from European countries and some implications for practice (1). Assessment
& Evaluation in Higher Education, 18(2), 95-114.
Jarvinen, A. & Kohonen, V. (1995). Promoting Professional Development in Higher Educa-
tion through Portfolio Assessment. Assessment & Evaluation in Higher Education, 20(1),
25-36.
Justicia, F., Pichardo, M. C. Cano, C., Berbén, A.B.G. & De la Fuente, J. (2008). The revised
Two-Factor Study Process Questionnaire (R-SPQ-2F): Exploratory and Confirmatory
Factor Analyses at Item Level. European Journal of Psychology of Education, 23(3),
355-372.
Kelvin, A. (1993). Increasing students’ participation in the learning process. Higher Educa-
tion, 26, 449-469.
Kember, D. & Wong, A. (2000). Implications for evaluation from a study of students’ percep-
tions of good and poor teaching. Higher Education, 40(1), 69–97.
Kember, D., Jenkins, W. & Chi, K. (2004). Adult students’ perceptions of good teaching as a
Page 24
Jesús de la Fuente et al.
- 838 - Electronic Journal of Research in Educational Psychology, 8(2), 815-840. 2010 (nº 21). ISSN: 1696-2095.
function of their conceptions of learning-Part 2. Implications for the evaluation of teach-
ing. Studies in Continuing Education, 26(1), 81-97.
Kinchin, I.M., Lygo-Baker, S., & Hay, D.B. (2008). Universities as centres of non-learning.
Studies in Higher Education, 33(1), 89–103.
Klassen, R.M. (2004). Optimism and realism: a review of self-efficacy from a cross-cultural
perspective. International Journal of Psychology, 39(3), 205-230.
Leung, M. & Chan, K. (2001).Construct Validity and Psychometric Properties of the Revised
Two-factor Study Process Questionnaire (R-SPQ-2F) in the Hong Kong Context. Pa-
per presented at the AARE 2001 Conference, December, Perth (Australia).
Oyserman, D., Coon H., & Kemmelmeier, M. (2002). Rethinking Individualism and Collec-
tivism: Evaluation of Theoretical Assumptions and Meta-Analyses. Psychological
Bulletin, 128(1), 3-72.
Phan, H.P. (2008). Multiple regression analysis of epistemological beliefs, learning approach-
es, and self-regulated learning. Electronic Journal Research in Education Psychology,
14, 6(1), 157-184.
Pilcher, R. (2002). Analysis of the Approaches to Learning by Accounting and Business Stu-
dents in Australia- Evaluating the Classroom. Poster presented at the 2003 Annual
Meeting of the American Accounting Association, August, Honolulu, (Hawaii). Ac-
cessed on October 8th, 2003, at: http://aaahq.org/AM2003/ StrategicLearn-
ing01/05.htm
Postareff, L. & Lindblom-Ylänne, S. (2008). Variation in teachers’ description of teaching:
broadening the understanding of teaching higher education. Learning and Instruction,
18(2), 109-120.
Pratt, D.D. (1997). Reconceptualizing the evaluation of teaching in higher education. Higher
Education, 34, 23-44.
Print, M. & Hattie, J. (1997). Measuring quality in universities: An approach to weighting
research productivity. Higher Education, 33, 453-469.
Ramsden, P. (2003). Learning to teach in higher education (2nd. Ed.) New York: Roudlege
Falmer.
Scouller, K. (1998). The influence of assessment method on students’ learning approaches:
Multiple choice question examination versus assignment essay. Higher Education, 35,
453-472.
Page 25
Validation Study of the Scale for Assessment of the Teaching-Learning Process, Student Version (ATLP-S)
Electronic Journal of Research in Educational Psychology, 8(2), 815-840. 2010 (nº 21). ISSN: 1696-2095. - 839 -
Trigwell, K. & Prosser, M. (2004). Development and use of The Approach to Teaching In-
ventory. Educational Psychology Review, 16, 409-424.
Trigwell, K., Prosser, M. & Taylor, P. (1994). Qualitative differences in approaches to teach-
ing first year university science. Higher Education, 27, 75-84.
Tweed, R.G. & Lehman, D.R. (2002). Learning considered within a cultural context. Ameri-
can Psychologist, 57(2), 89-99.
Vermunt, J.D. & Verloop, N. (1999). Congruence and friction between learning and teaching.
Learning and Instruction, 9, 257-280.
Weinstein, C.D. & Mayer, R.E. (1986). The teaching of learning strategies. In M.Wittrock,
Handbook of Research of Teaching (pp. 257-274). New York: MacMillan.
Wehmeyer, M.L., Abery, B., Mithaug, D.E., & Stancliffe, R.J. (2003). Theory in Self-
Determination: Foundations for Educational Practice. Springfield, IL: Charles C
Thomas Publisher, LTD.
Wehmeyer, M.L., Agran, M., Hughes, C., Martin, J.E., Mithaug, D.E., & Palmer, S.B. (2007).
Promoting self-determination in students with intellectual and developmental disabili-
ties. New York: Guilford Press.
Zohar, A. & Bracha, P. (2008). The effects of explicit teaching of metastrategic knowledge on
low- and high-achieving students. Learning & Instruction, 18(2), 337-352.
Page 26
Jesús de la Fuente et al.
- 840 - Electronic Journal of Research in Educational Psychology, 8(2), 815-840. 2010 (nº 21). ISSN: 1696-2095.
Appendix I. Items that make up the ATLP-S (De la Fuente & Justicia, 2001, 2010).
___________________________________________________________________________
T1. The general approach is useful in my educational development.
T2. The teacher explained the rationale for what we were learning.
T3. Teaching objectives were clear.
T4. The teaching objectives helped me in building my own knowledge.
T5. The teaching content was appropriate.
T6. Course content which addressed facts and concepts seemed appropriate to me.
T7. Course content which taught procedures seemed appropriate to me.
T8. Course content which addressed attitudes, values and rules seemed appropriate to me.
T9. The teacher encouraged my involvement in the learning process.
T10. The teaching approach encouraged relevant, useful learning.
T11. Materials used in the course / module were appropriate.
T12. The time dedicated to each topic was appropriate.
T13. The teacher’s behavior (interaction, attitude, etc.) was appropriate.
T14. I think the assessment strategies used were appropriate.
T15. In general, the teaching process was appropriate.
___________________________________________________________________________
L16. I understood the general structure of the course / module.
L17. The importance of what we were learning was clear to me.
L18. I had clear learning objectives.
L19. My learning objectives helped me build my own knowledge.
L20. I was able to sort out the content to be learned.
L21. I have adequately worked through the facts and concepts to be learned in this course / module.
L22. I have put into practice the procedures to be learned in this course / module
L23. I have acquired the attitudes, values and rules to be learned in this course / module.
L24. I was actively involved in the learning process.
L25. I adequately planned and regulated my own learning.
L26. The resource materials I used (reference books, etc.) were sufficient.
L27. The time I dedicated to learning each topic was adequate.
L28. I had regular attendance, that is, I attended most classes.
L29. I used appropriate self-evaluation strategies during the learning process.
L30. In general, my learning process was appropriate.
___________________________________________________________________________