University of Rhode Island University of Rhode Island
DigitalCommons@URI DigitalCommons@URI
Open Access Master's Theses
1941
Validity of Scale Analysis as a Means of Age Determination of the Validity of Scale Analysis as a Means of Age Determination of the
Winter Flounder Winter Flounder
Edgar L. Arnold Jr. University of Rhode Island
Follow this and additional works at: https://digitalcommons.uri.edu/theses
Recommended Citation Recommended Citation Arnold, Edgar L. Jr., "Validity of Scale Analysis as a Means of Age Determination of the Winter Flounder" (1941). Open Access Master's Theses. Paper 1396. https://digitalcommons.uri.edu/theses/1396
This Thesis is brought to you for free and open access by DigitalCommons@URI. It has been accepted for inclusion in Open Access Master's Theses by an authorized administrator of DigitalCommons@URI. For more information, please contact [email protected].
VALIDITY OF SCALE ANALYSIS
AS A MEANS OF AGE DETER
MINATION OF THE WINTER
FLOUNDER
BY
EDGAR L. ARNOLD, JR.
A THESIS SUBMITTED I N PARTIAL FULFILLMENT
OF THE REQ,UIREMENTS FOR THE DEGREE
OF
MASTER OF SCIENCE
TI~
ZOOLOGY
RHODE ISLAND STATE COLLEGE
1941
MASTER OF SCIENCE THESIS
OF
EDGAR L. ARNOLD, JR .
Approved :
Major Prof ess or ~~ E ~ --~-----------
Head of Department.~L...~z::!:::~:::::!::::::..,,,.../..::.J~~~:.--~~~
Chairman, Graduate
Rhode Island State College
1 941
ABSTRACT
A steadily deereasing yield in the winter flounder stock
has led to a series of investigations into its life history
by the Federal Fish and Wildlife Service, in an attempt to
ascertain the cause of its decline. Disagreement in age de
termination by scale analysis has been responsible for much
delay in solving an urgent problem. To devise an accurate
method for determining age by _scale reading, a series of spec
imens of gradually increasing sizes, beginning with those
known to be of the currently-spawned stock, were selected and
their scales subjected to detailed study.
Results showed that age can definitely be determined by
scale analysis when accompanied by essential supplementary
data on length and date of capture. Age determination of
5og specimens from the population of Point Judith Pond checked
with the findings of ear~bone readings of age.
-1-
TABLE OF CONTENTS
Page I . IN'TRODUCTION • •• o ••••••••••••••••••••••••••• . • • • • • • • • • 3
II. REVIEW OF THE LITERATURE• ••••••••••••••••• • ••••••••• 4
III. INVESTIGATI ON ••••••••••••••••••••••••••••••••••••••• 5
Materials • .••••.•••...•..•.... o • • • • • • • • • • • • • • • • • • 5
Methods of Procedure • •• ••••••••••• •• ••••••••o•••• 7
Explanation of Terms •••••••••••••••••••••••••• 7
Scale Structure ••••••••••••••• o••••••••••••••• 9
Scale Development ••••••••••••••••••••••••••••• 10
Establishment of Area for Scale Removal ••••••• 10
Mounting the Scales ••••••••••••••••••••••••••• 15
Scale Analysis •••••••••••••••••••••••••••••••• 15
IV. RESULTS AND DISCUSSION •••••••••••••••••••••••••••••• 17
Other Methods of Age Determination by Scale Analysis •••••••••••••••••••••••••••••.••••••••.•• 25
Year Class Separation by Size ·Limitations •••••••• 27
False Winter Bands or False Checks ••••••••••••••• 27
Population Analysiso ••••••••••••••••••••••••••••• 29
Possibility of Racial Differences •••••••••••••••• 31
v. CONCLUSIONS ••••••••••••••••••••••••••••••••••••••••• 31
VI . ACKI\J'OWLEDG11ENTS . • • • • • • • • • • • • • • • • • • • • • • • • • • • • • • • • • • • • 36
VII. BIBLIOGR.APII'Y'. . ............... • • • • • • • • • • • • • • • • • • • • • • • 37
-2-
Index of Plates, Figures and Tables
Page Plate I, Flounder Scale Showing More Than Three
Years ' Growth ••• ~·····••••••••••••••••••••••• 8
Plate II, A. Scale from Largest O B. Scale from Smallest Yearling •••••••••••••• 21
Plate III, A. Scale from Winter-spawned Yearling B. Scale from Spring-spawned Yearling •••••••• 23
Plate IV, Scale f'rom Two Year Old Fish••••••••••••••••o 24
Plate v, Scale Showing False Check •••••••••••••••••••• 30
Figure 1 , Drawing of Upper Surface of Flounder ••••••••• 13
Figure la, Drawing of Under Surface of Flounder•••••••o• 14
Figure 2, Scale from Young Speciraens ••••••••••••••••••• 18
Figure 3, Scale from Yow1g Specimens••••• •••••••• •••o• • 19
Figure 5, Length Frequencies of April Population Sample ••••••.•.•••• o •••••••••••••••••••••••. • o 33
Figure 6, Composition of Winter Flounder Population of Point Judith Pond (October) •••••• o• •••••••••• 34
Table 1 , Degree of Legibility of Areas for Scale
Table 2,
Table 3 ,
Table 4,
Tabl e 5,
Removal •••••••••••••••••.•..•••...•••..•••.•• 11
Data on Gradated Series of Specimens ••• •••••• 35
Age Determination by Winter Band Location •••• 26
Scale Structures and Size of P. americanus According to Age Group •••••••••••••••••<>•••o• 26
Percentage of Age Groups i n t he October Point Judith Pond Winter Flounder Population. 31
-3-
I . INTRODUCTION
The recent alarming decline in the abW1dance of the winter
floW1der , Pseudopleuronectes americanus, in the coastal waters
of New England and New York has caused such concern among fish
ery investigators t hat all possible information on the biology
of this species is urgently desired .
The object of the present investigation has been a) to
overcome by scale analysis a serious obstacle, namely, inability
to determine with certainty the age of P. americanus, and b)
provided an accurate method could be devised , application of it
in an analysis of the age composition of a winter floW1der popu
lation .
Scale reading is today the most widely used method of age
determination in fish . With some forms , this method is fairly
simple, in others it is impossible to correlate growth with
scale markings .
The winter flounder has proven to be a difficult subject
for scale analysis because it lacks distinct annuli or winter
rings typical of fishes ranging southward of Cape Cod. It is
a northern fish which grows to some extent throughout the en
tire year . The scales correspond in growth, hence exhibit no
definite annuli indicative of winter cessation. Instead, there
occur alternate narrow, dark bands representing winter growth,
and broad, light bands from more rapid growth in warmer water
at other seasons .
-4-
Uncertainty in reading the early scale development has
been the real obstacle in the ease of the winter flounder.
Different investigators give different interpretation regard
ing the first year's growth as indicated on the scale. So
long as this confusion remains, no population analysis will
be complete.
In attempting to develop a method of age determination
by scale analysis, the author has had in mind limitations in
the application. of the "otolith" method. Ear bones tend to
become increasingly opaqu~ with advancing age and also, to
obtain them the fish must be killed. Since several important
aspects of fishery research involve liberation of tagged spec
imens after study, scale reading forms a particularly desirable
method, for scale samples can be removed without causing injury.
II . REVIEW OF LITERATURE
The essential relief features of the fish scale were first
described by Borel~us in 1856. Later, with the introduction
of the microscope, scales were subjected to more detailed study
by such investigators as von Leeuvenhoeck and L. Agassiz, but
it was not until 1898 that they were regarded as a means by
which age and other salient features in the life history of
the fish could be determined. It was then that Hoffbauer,
working with carp scales, observed on their surface, concen
tric rings which he considered to be indicative of growth
-5-
( Tayl or, 1914). The impetus afforded by these findings has
resulted in a l ong series of important investigations depen
dent upon accurate age determination. Subsequent workers
established the validity of Hoffbauer's conclusions that sur
f ace markings were indeed indicative of periodic growth.
Little has been done on the s cales of the winter f lounder,
however, and references having a direct bearing on t he present prob
l em are few.
B. B. Rae's work on the lemon sole (1939), a closely r e
lated species, are in accord with the author ' s findings re
garding the best areas · ·from which scales giving consistent
and true readings can be removed .
However , the most recent federal surveys in Long Island
waters by Lobell and Perlmutter show definite disagreement
on age determination in P. americanus, particularly regard
ing what markings are indicative of the first year's growth .
III. INVESTIGATION
Materials
The scope of the present investigation has been limited
t o the immediate vicinity of Point Judith Pond. Approximat ely
800 winter flounders ranging in size from 21 millimeters to
355 millimeters were collected for study. These can be di
vided into three groups according to their time of capture .
-6-
1) 509 specimens taken October 31, 1940 in Point Judith
Pond.
2) 60 specimens taken June - August, 1940 in Point Judith
Pond and Lower Narragansett Bay.
3) 208 specimens taken April 9 - . 19, 1941 in Point Judith
Pond.
Specimens obtained in autumn and spring were taken by
dragging with a shrimp trawl from the Narragansett Marine Lab
oratory power boat . The meshes of this trawl were of 1 1/2
inch stretch to ass\l.re ; the capture of the smallest members of
the population . Hauls were of 45 minutes' duration and were
repeated when necessary to obtain sufficient specimens.
The 60 flounders taken during the summer months were part
of the catches made with 50 and 150 foot haul seines at se
lected stations along the shore. It was from this group that
the smallest specimens for scale study were selected.
The time of autumn dragging, October 31st, was chosen to
insure catching the larger fish which leave Point Judith Pond
in late spring and return from offshore with cooling water in
September. Thus a true cross-section sample of the winter
flounder population of the area could be expected. Spring
hauls were made prior to the departure of the larger stock,
but only the smaller fish were kept to plot their lengths and
Widths for determination of the possibility o~ racial differ-
ences.
-?-
Methods of Procedure
Explanation of Terms
The following explanation covers special terms used in
this paper.
0-year class - comprises flounders in their first year.
Yearlings or "l's" - fish which have completed one year's
growth and are in their second year.
Fields. (Taylor 1914)
1. Anterior field is the portion of a scale in
closed in the scale pocket and directed toward
head of fish.
2. Posterior field is the exposed portion of the
scale. In the winter flounder it is the region
where the spines are formed. Herein lies the
focus or nucleus of scale, in fish over 30 mm.
protected by a flap of dermis closely adhering
to the scale surface. This protective structure
must be removed to study focus and adjacent
circuli.
3. Inferior side is that portion next to the body.
Exterior side is the sculptured surface.
Focus or nucleus - that part of the scale first laid down
in early development, and in P. americanus it is
located in the posterior field of the scale about
1/10 scale length from margin or periphery .
Pl ate I
Spines
ff' <:::::::::::::: v1 F o c v s
Circuli I ():) I
'
J Autumn and w int('r
I
bal"ld I , \ \
SpriY19 ~nd &vmm~r band
Radii (F)
Periphery
FloundeY- scale showi'-ng YYJor-e then three years of growth.
-9-
Circuli - These structures occur on the exterior surface
of scales and represent lines of growth concentric
or nearly so with periphery, differences in the dis
tance between circuli forming a basis for age deter
mination (Taylor 1914).
Radii - lines or ridges running from the periphery in the
direction of the focus of the scale . They occur in
the normal scales of flounders over 30 mm. in length,
and are on the anterior field, perpendicular to the
circuli. Their number varies on different scales
depending on the area from which they are taken,
being more numerous on wider scales from areas where
greatest body movement takes place . (Taylor 1914).
Periphery - the outermost edge or margin of the scale .
Spines - projections shaped like carpet tacks, arising in
varying numbers from the posterior field in the area
between the f ocus and periphery.
False checks - abnormal bands of circuli indicating tem
porary retarding of growth and commonly appearing as
a band of narrowly spaced circuli (winter character
istic) inserted among the broader summer circuli .
Scale Structure
Scales may be classified in four basic types (1) Placoid,
or modified teeth, usually small and closely set, being found
in elasmobranchs (sharks, skates and rays) (2) Ganoid, which
-10-
may vary in form and structure. These are commonly rhombic
in shape and form the plates of "armored" fishes . (3) Cycloid,
which overlap like shingles and are embedded in pockets in the
cerium with only part of the outer smooth margin exposed. (4)
ctenoid, the type studied by the author and possessed by most
of the bony fishes. {Classification after Taylor 1914).
Scale Development
Ctenoid and cycloid scales, the types occurring in P . ~
icanus, begin as calcified spots which slowly extend in their
dermal pockets, adhering by their inferior surfaces and peri
pheries. Scleroblasts in the corium secrete two layers, the
upper homogenous and bony, the under fibrillar, containing a
calcareous deposit. Such scales increase in thickness and area
by continued scleroblastic activity, successive additions re
sulting in concentric lines of growth. It is these lines of
growth, or circuli, which form the basis of age determination.
(Adapted from Taylor 1914).
Establishment of Area for Scale Removal
Upon examining scales removed from different regions of
P. americanus, it was plainly noticeable that there existed
on the same fish a difference in shape, size, and even i n the
number of circuli . Seales taken from the extreme caudal area
were long and narrow, while those taken only slightly anterior
Table l Upper Surface Under Surface
Area No . 1 No. 2 No. 3 No. 4 Area No. · 1 No. 2 No . 3 No. 4 175 nrrn 320 mm 416 mm 216 nrrn
1 Poor Poor Poor Poor l Poor Poor Fair Poor
2 Fair Fair Fair Fair 2 Fair Fair Poor Poor
' 3 Fair Fair Poor Fair 3 Fair Fair Fair Poor Very Regen- Regen- very
4 Poor Poor Fair Poor 4 Good erate erate Good '
5 Fair Fair Fair Fair 5-6 Fair Fair Fair Fair Regen- Regen- Regen-
6 Fair Fair erate Fair 7 erate Poor erate Poor reg en-
7 Good Fair Good Poor 8-9 . Fair erate I I-'
r. I-' 8 Good Good Good Good 10-11 Fair Good Fair Fair I
9-10 Good Good Good Good 12 Poor Poor Poor Fair
11-12 Good Fair Good Fair 13 Fair Poor Fair Good
13 Good Fair Good Fair 14 Fair Fair Good Fair
14-15 Good Good Good Good 15 Good Fair Poor Fair
16 Fair Fair Poor Poor 16 Poor Poor Good Poor
17-18 Good Good Good Good Mar-Very Very Very Very gin Poor Poor Poor Poor
19 Good Good Good Good
20 Poor Poor Poor Poor
Mar-gin Poor Poor Poor Poor
Text: Degree of legibility of scales from selected areas on four specimens of P. americanus
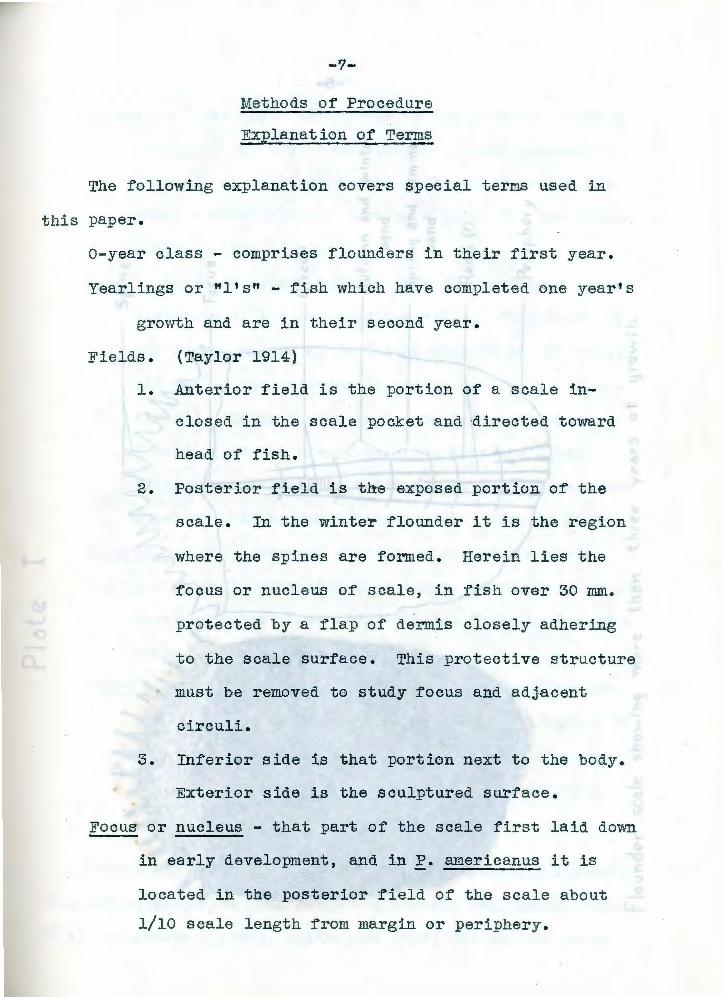
-12-
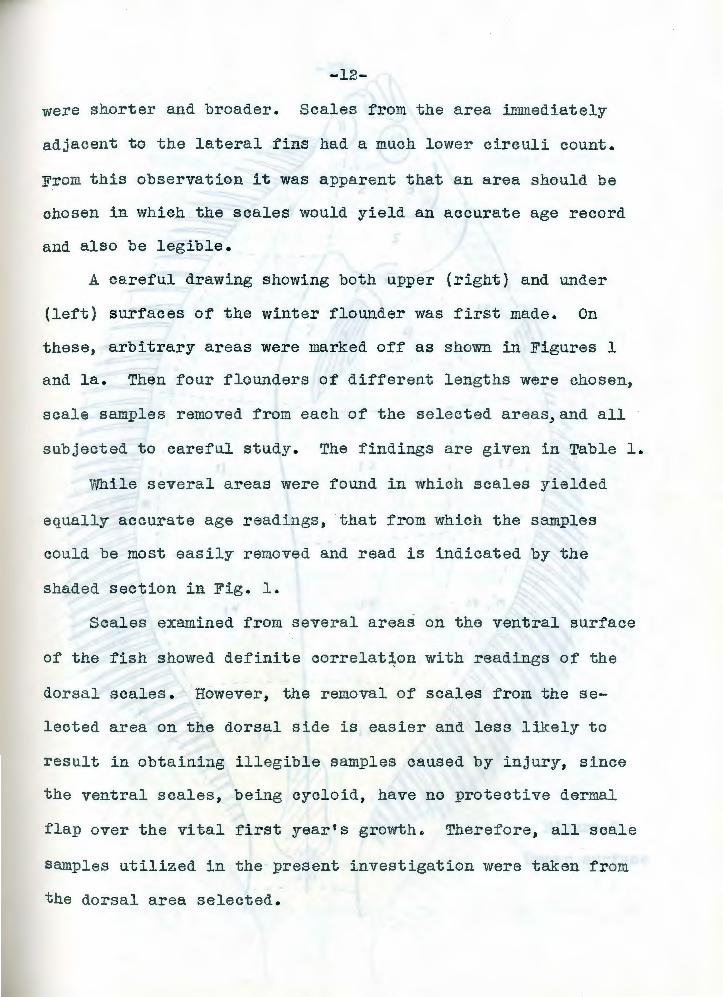
were shorter and broader. Scales from the area immediately
adjacent to the lateral fins had a much lower circuli count.
From this observation it was apparent that an area sheuld be
chosen in which the scales would yield an accurate age record
and also be legible.
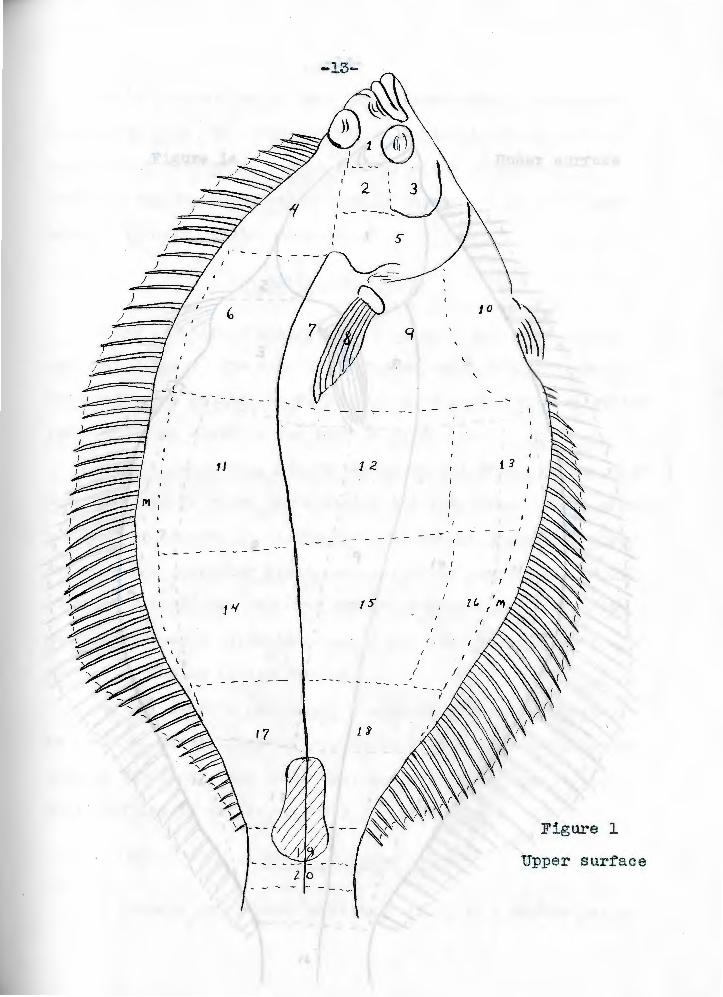
A careful drawing showing both upper {right) and wider
{left) surfaces of the winter flounder was first made. On
these, arbitrary areas were marked off as shown in Figures 1
and la. Then four flounders of different lengths were chosen,
scale samples removed from each of the selected areas, and all
subjected to careful study. The findings are given in Table 1 .
While several areas were found in which scales yielded
equally accurate age readings, that from which the samples
could be most easily removed and read is indicated by the
shaded section in Fig. 1.
Scales examined from several areas on the ventral surface
of the fish showed definite correlat~on with readings of the
dorsal scales . However, the removal of scales from the se
lected area on the dorsal side is easier and less likely to
result in obtaining illegible samples caused by injury, since
the ventral scales, being cycloid, have no protective dermal
flap over the vital first year's growth. Therefore, all scale
samples utilized in the present investigation were taken from
the dorsal area selected.
/
) f J
J
)
J
) b
-- --- -
11
I I- - - -
1 '{
17
2 0
-13-
S'
- - - -
1 z
IS'
-- ---- ---I
I
~ ~
JO \
~ - '- -
z (.
1 1
- '
I
I
Figure 1
Upper surface
-15-
It is interesting to note that subsequently, the author
found that this same area was one selected as having repre
sentative scales by B. B. Rae (1939), after an exhaustive
study on the degree of variations in the scales of the lemon
sole, a closely related species .
Mounting the Scales
After removal of scales with a scalpel they were mounted
on glass slides . The mounting media selected had previously
been used with success by c. w. Creaser and consisted of twelve
parts of water glass to one part of glycerine .
Prior to mounting, six to twelve scales from each specimen
were immersed in water for cleaning and softening . Then, under
a binocular dissecting microscope, the dern1al protective flaps
covering the posterior field were carefully removed with dull
disseeting needles. Mounting was carr~ed out just before the
scales had completely dried, particular care being taken to
prevent formation of air bubbles .
To the author's knowledge, scales from winter flounders
as small as 40 millimeters have never before been obtained and
mounted for study, but while they are extremely fragile, no
great difficulty was experienced in the process .
Scale Analysis
Of primary importance in scale reading is a determination
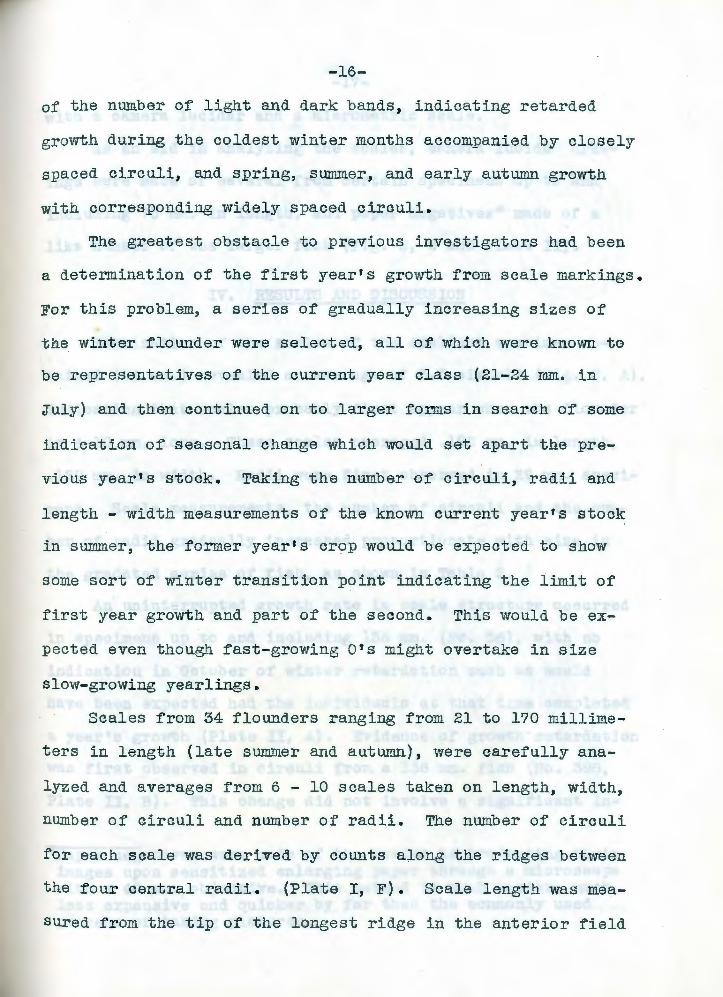
-16-
of the nurnber of light and dark bands, indicating retarded
growth during the coldest winter months accompanied by closely
spaced circuli, and spring, summer, and early autumn growth
with corresponding widely spaced circuli.
The greatest obstacle to previous investigators had been
a determination of the first year's growth from scale markings .
For this problem, a series of gradually increasing sizes of
the winter flounder were selected, all of which were known to
be representatives of the current year class (21-24 mm. in
July) and then continued on to larger forms in search of some
indication of seasonal change which would set apart the pre
vious year's stock. Taking the number of circuli, radii and
length - width measurements of the known current year's stock
in summer, the former year ' s crop would be expected to show
some sort of winter transition point indicating the limit of
first year growth and part of the second . This would be ex
pected even though fast - growing O's might overtake in size
slow-growing yearlings .
Scales from 34 flounders ranging from 21 t o l?O millime
ters in length (late summer and autumn) , were carefully ana
lyzed and averages from 6 - 10 scales taken on length, width,
number of circuli and number of radii. The number of circuli
f or each scale was derived by counts along the ridges between
t he four central radii. (Plate I , F). Scale length was mea
sured from the tip of the longest ridge in the anterior field
-1?-
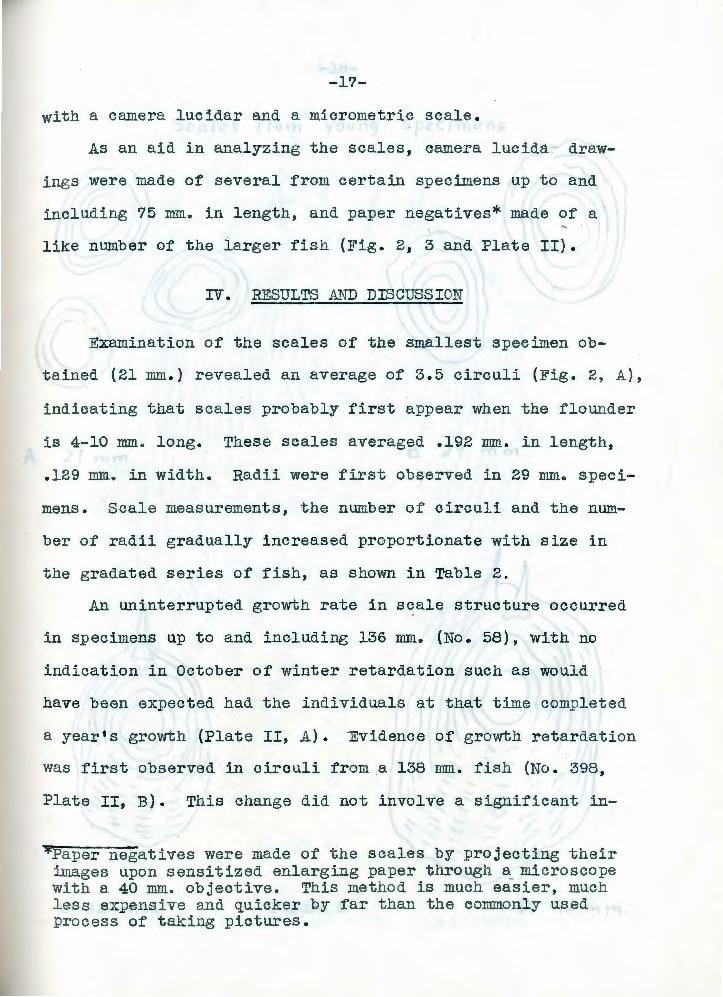
with a camera lucidar and a micrometric scale .
As an aid in analyzing the scales, camera lucida - draw-
i ngs were made of several from certain specimens up t o and
including 75 mm. in length, and paper negatives* made of a
like number of t he larger f ish (Fig . 2 , 3 and Plat e II) .
IV. RESULTS AND DISCUSSI ON
Examinat ion of t he scales of the smallest specimen ob
tained (21 mm. ) revealed an average of 3 . 5 circuli (Fig. 2, A),
indicating that scales probably first appear when the flounder
is 4-10 mm. long . These scales averaged .192 mm. in length,
. 129 mm. in width. Radii were first observed in 29 mm. s peci-
mens . Scale measurements, -the number of cir culi and the nwn-
bar of radii gr adually incr eas ed proportionat e with size in
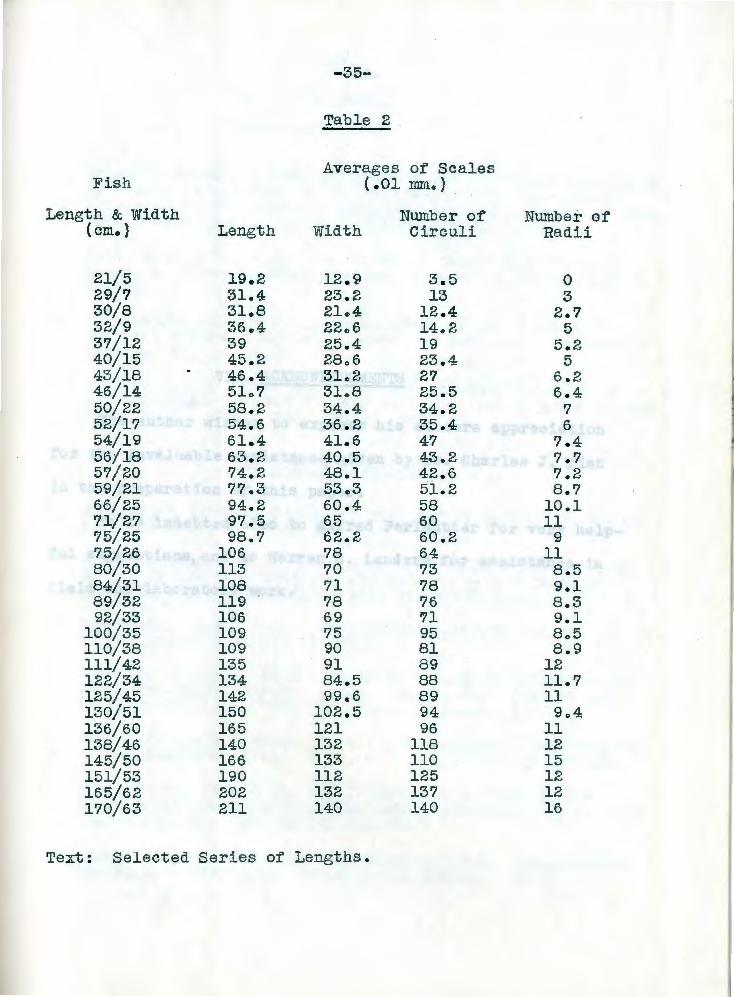
t he gr adat ed ser ies of fis h , as s hown in Table 2 .
An unint errupted gr owth rate i n scale structur e occurred
i n spec i mens up to and i ncl uding 136 mra. (No. 58 ), with no
i ndication in October of wi nt er retardation such as would
have been expected had t he i ndivi duals at that time completed
a year 's growth (Plat e II, A) . Evidenc e of gr o-wth retar dation
was f i r st observed in circuli f rom a 138 mm . fish (No . 398,
Plate II, B}. This change did not involve a significant in-
~Paper negatives were made of the scales by pr ojecting t heir images upon sensitized enlarging paper through B;_micr oscope wit h a 40 mm. objective. This method is much easier , much l es s expens ive and quicker by far than the commonly used process of taking pictures .
- 18-
Sc~/ e s from s pee i mens
A 2 I YY\ yY'l . B. 2 '-f YY\ m .
c. 32 YY) YY\ . Figure 2 D. If I VY) Y"Y\ •
-20-
cr eas e in the number of circuli, but in the spacing of the
first 25-35 laid down, being very much closer together than
t hose in the pr oximal portion of scales from smaller speci
mens . Thes e circuli f ormed a structural arrangement which
could not possibly be confused with circuli of the largest
previously established O' s (Plate I I , A & B) .
The above finding agreed and checked exactly with r e
sults of an investigation carried out by Mr . Lander s on the
same s tock . His gr aph, representing age groups of the popu
lation as determined thr ough ear- bone analysis , s howed the
largest O t o be 136 mm. long, t he smallest yearling 138 mm. ,
the same two specimens being used in t he two analyses .
It has previously been established that south of Cape
Cod P . americanus has a ver y extended spawning season, Decem
ber to early May, wit h the greater par t spawning in late
February, March, or early Apr~l . This accounts for the large
variation in s izes of f lolUlders of the same year class . Thus
it is not illogical to assume that some of t he smaller speci
mens here des i gna t ed as yearlings could have been spawned in
December of t he current year, or even earlier , wi th scales
appearing just as coldest wint er conditions set in. This
would explain the appearance first of closely spaced circuli,
f ollowed by more widely spaced circuli when rising spring
t emperatures occurred . Also in Oct ober (31st), the ages of
such fish actually would be slightly less than a year . How-
-21-
Pl ate II
Spring growth I
~ '
Summer d"hd autUmYl ~p-owth
0 .................
--------- Ci r cu/ i of win f e r ~ \ 9rowt h
Sprin9 growth
Summer ahd autumn ~row th
-22-
ever, since they show distinctly the banding characteristic
of seasonal change, they have been referred to as winter
spawned yearlings.
This presence or absence of a distinguishi?g band of
winter grovfth circuli ·in the proximal portion of the scale
can, in fish of ~ny age, be used to designate winter and
spring spawning, and accordingly, if the date of capture be
known, make possible exact age determination within a few
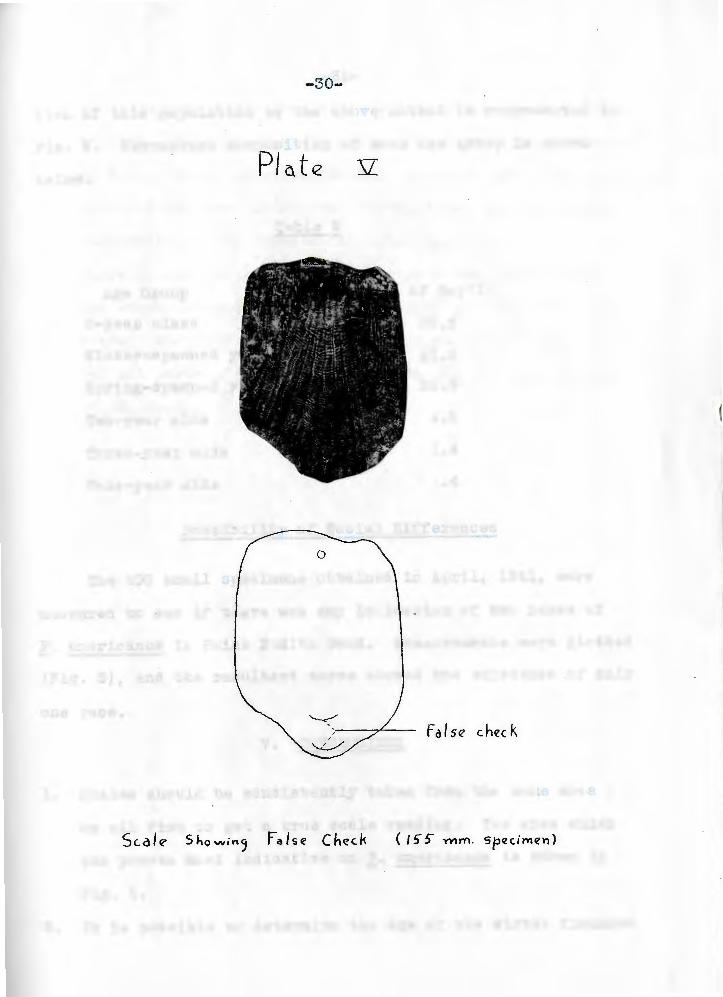
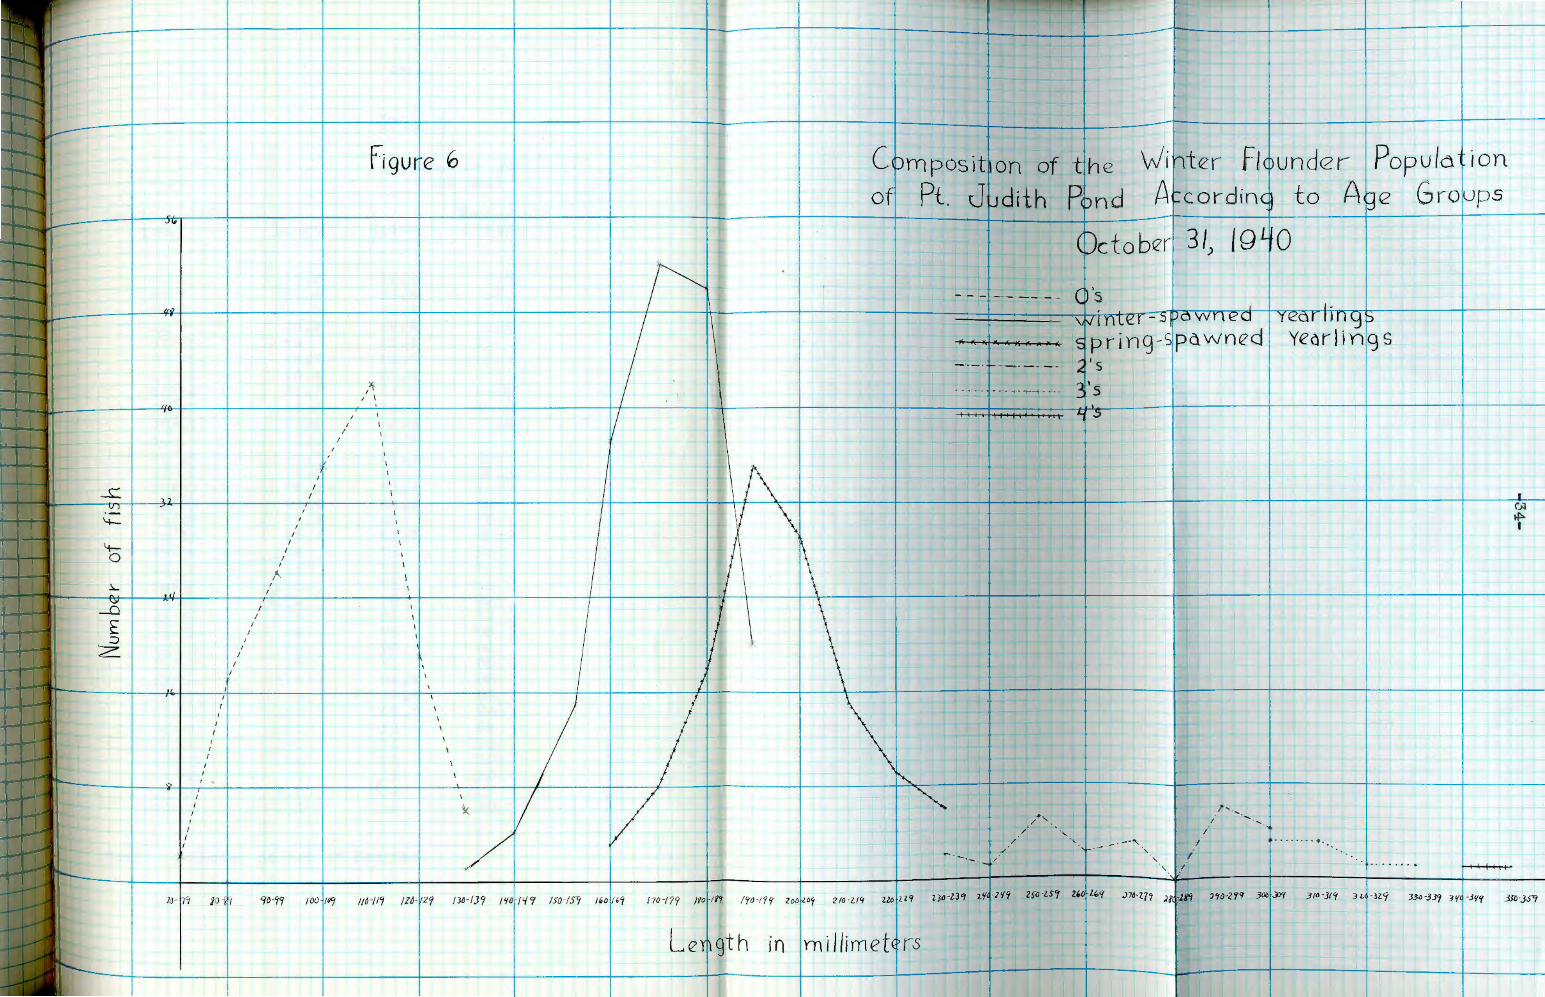
months. Subsequent observations of the population sample
revealed evidence of winter spawni ng in 174 flounders. Of
this group , 169 were between 138 and 195 mm., three between
235 and 245 mm. , and two over 300 mm. All specimens from
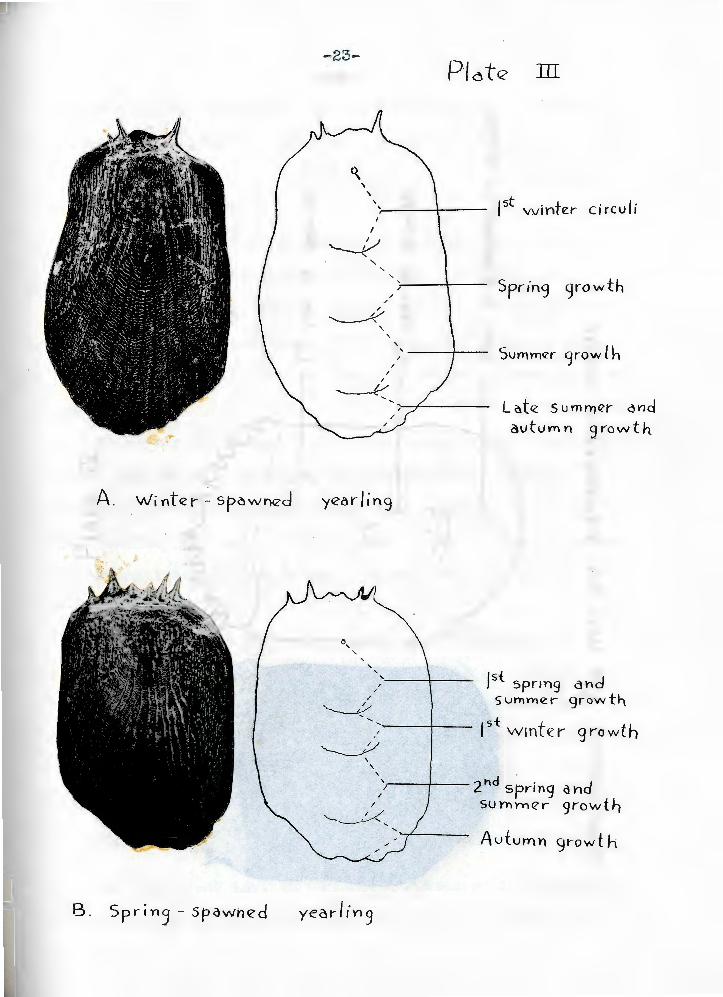
138 to 165 mm. displayed this .type of growth. Normal spring
spawned yearlings, exhibiting first the widely spaced circu
li of warm weather , followed in turn by closely spaced win
ter circuli t hen warm weather markings of the second season's
growth, appeared f or the first time in flounders of 165 milli
meters (Plate III, Type B). In specimens ranging between
165 and 195 mm., the position of the winter bands i ndicated
both winter {early) spawning as in Plate trI, Type A, and the
normal spring spawning shown in Plate III. The winter bands
in all specimens between 195 mm . and .235 mm. were of the
s pr ing-spawned type.
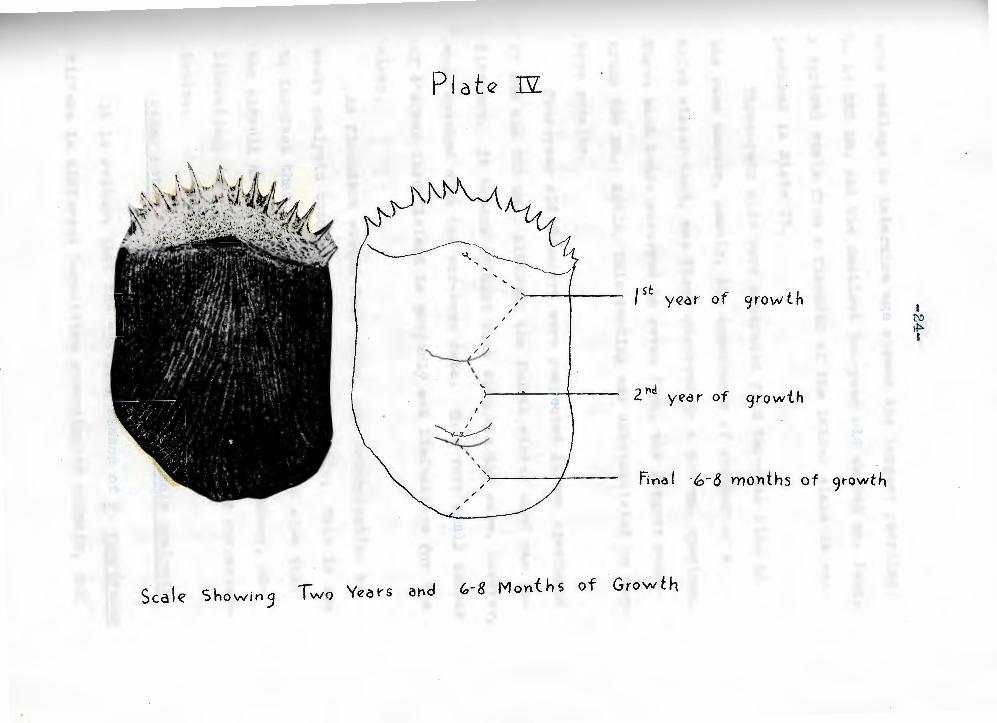
No difficulty was experienced in the s eparation of year
l ings and two year olds by this method . The appearance of
t wo winter bands was first observed in a 245 mm. fish. Ear-
A. Winter - spawned
8. Spr ins - spawned
-23-Plate m
' -~--+---- I st vvinter- c i rcu Ii I
~ ' ' '
/
yearling
'
/
' ,'----, /
~
~ ' '
Spring growth
5vmrner growf h
L ote s u mnier ond avtuvnn 9rovvth
J5 t spring and summer qrowt!--i
I st w1nte r 9 r-o wth
/~~----2nd spring ond / SUYhYrier 9rowth
~' Autumn gr-owt h
year-I iYl 9
Pl cte N
l'-iJ'1'-~ , . ~ o,~
,
~ \
, ,
I
~ ~
\
/
/ /
' ' /
, /
/
I 5t ye~r of 9rowt h
zt1d year of growth
Fina I 0-~ rno-nths of 9rowth
Scale Showin9 Two Years atld C,-8 Months of Growth
I ~
t
-25-
bone readings to determine age showed the largest year l ing
t o be 235 mm. and the smallest two-year old as 245 · mm. long.
A typical scale from a flounder of the latter class is re
produced in Plate IV.
Three-year olds were separated from two-year olds in
the same manner, namely, the appearance of another or a
t hird winter band, was first observed in a 300 mm. specimen.
Three such bands occurred in seven fish, the largest meas
uring 330 nnn. Again, this reading was substantiated by ear
bone results.
Four-year old :t'!ounders were suspected in two specimens
of 345 and 355 nnn., although the f ourth winter band was in
distinct. It became evident that such vras the case, however,
when checked with the ear-bone data. This very small nwnber
of 4 ' s was insufficient to properly set limitations for the
class.
As flounders exceed four years, age determination by
scale analysis becomes increasingly difficult . This is due
to the fact that annual scale growth becomes so slow that
the circuli are cro~ded . together near the periphery, ob
literating, in a large degree, summer and winter character
istics.
Other Methods of Age Determination by Scale Analysis
It is evident that the spawning season of P. americanus
differs in different localities according to climate, and
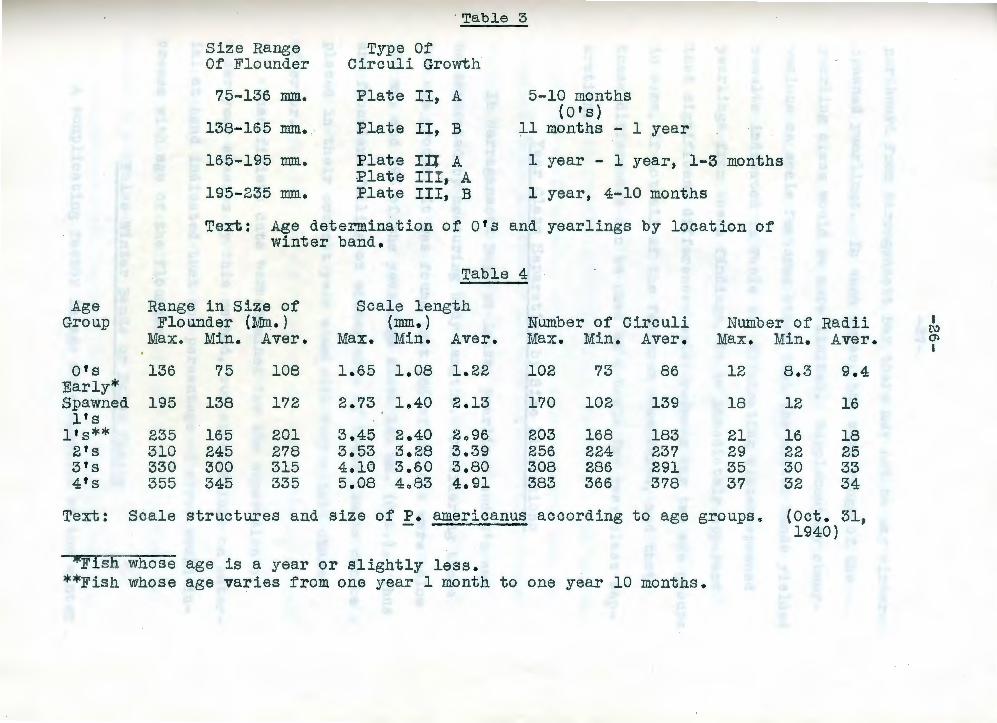
· Table 3
Size Range Type Of Of Flounder Circuli Growth
?5-136 mm. Plate II, A 5-10 months (O's)
138-165 mm. Plate II, B 11 months - l year
165-195 mm. Plate Ill A 1 year - 1 year, 1- 3 months
Age
Plate III, A 195-235 mm. Plate III, B 1 year, 4-10 months
Text: Age determination of O' s and yearlings by location of winter band .
Table 4
Range in Size of Scale length Group Flounder (Mra.) (mm. ) Nwnber of Circuli Nwnber of Radii
Max. Min. Aver. Max . Min . Aver. Max . Min . Aver . Max. Min. Aver .
O's 136 ?5 108 1 . 65 1.08 1.22 102 ?3 86 12 8.3 9.4 Early* Spawned 195 138 1?2 2 .73 1.40 2.13 170 102 139 18 12 16
l ' s l ' s** 235 165 201 3 .45 2.40 2o96 203 168 183 21 16 18 2's 310 245 278 3 .53 3 . 28 3.39 256 224 237 29 22 25 3 ' s 330 300 315 4.10 3.60 3.80 308 286 291 35 30 33 4 ' s 355 345 335 5 . 08 4o83 4.91 383 366 378 3? 32 34
Text: Scale structures and size of P. americanus according to age groups. (Oct. 31, 1940)
*Fisli whose age is a year or slightly less. **Fish whose age varies from one year 1 month to one year 10 months.
I l\:) (j)
I
-2?-
northward from Narragansett Bay there may not be any winter
spawned yearlings. In such areas, the size range of the
yearling class would be more limited. Supplementary obser
vations on scale features other than the winter bands yielded
results indicated in Table 4. Eliminating winter-spawned
yearlings from these findings, it is immediately apparent
that significant differences exist between any two age groups
in some, if not all of the features considered, and that
these differences can be used as a basis for year class sep
aration.
Year Class Separation by Size Limitations
In Narragansett Bay, at least, yearlings and O's can
be separated by measuring body lengths. Considering these
two age groups, it was found that 93% of the O's were below
130 mm. and 99% of the yearlings abov~ 140 mm. (Oct.). Thus
any flounders falling on either side of these limits can be
placed in their correct year cla8swith very slight chance
of error.
InsUfficient data we:reobtained for the separation of
older year classes by this method, but observations on mater
ial at hand indicated that the percentage of error would in
crease with age of the flounder.
False Winter Bands or False Checks
A complicating factor in age determination of the winter
-28-
flounder by scale reading is the frequent appearance of bands
of circuli that show an abnormal rate of growth for the sea
son in which they occur. Rhode Island waters being in the
southern limit of the range of P. americanus, it may well be
that excessive warming of the water, as well as excessive
cooling, would have a decided effect upon its rate of growth.
Dahl (1911), working on trout and salmon scales, concluded
that injuries or adverse environmental conditions produced
rings of growth that strongly resembled annuli.
Upon examination of scales from floWlders of the autumn
stock, one would normally expect to find a slowing down in
marginal growth preceded by the more rapid growth of summer,
shown in both cases by the relative spacing of the cireuli.
However, in a large number of scales examined, this did not
hold true, for during the rapid growth of summer occurred a
band of circuli similar to those laid down in the compara
tively dormant period of mid-winter, followed by a moderately
rapid growth approaching the margin. This marginal band
could not possibly be the result of an entire spring, summer,
and autumn growth, and a logical conclusion is that for
several weeks of excessively warm water, the flounder, if
in a fairly shallow area such as Point Judith Pond, would
become dormant, cease feeding, and show a corresponding de
erease in growth rate.
Flounders of Trustom Pond, cut off for several weeks in
-29-
July, 1940 from cool ocean water, became so lethargic that
they would not move until touched , and many died. Scales from
twenty of these specimens all showed an appreciable slowing
down in marginal growth. This group, known to have been sub
jected to unnatural conditions, affords conclusive evidence
that slowing down of growth rate and accompanying formation
of false checks in scales are caused by excessively warm
water.
It is, therefore, highly advisable if correct age is to
be determined by scale reading with a minimum of trouble,
that the time of capture, of the f lounder be known. For ex
ample, one examining scales from winter flounders taken
October 31st, and not having information on the date of cap
ture would very likely interpret the false checks that occur
on a large percentage of the population sample as winter
bands, and the increased marginal growth as the start of
spring growth .
A typical false check is illustrated by the scale re
production on Plate V taken from a specimen 155 mm. in length .
Population Analysis
Having devised a method by which the age of the winter
flounder can be determined through scale analysis, it was
applied to an analysis of a population sample of 509 fish
obtained in October in Point Judith Pond. The age composi-
-31-
t ion of this population by the above method is represented in
Fig . 6. Percentage composition of each age group is shown
below.
Table 5
Age Group
0-yea r class
Winter-spawned yearlings
Spring- spawned yearlings
Two-year olds
Thr-ee~year olds
Four- year olds
% of Pop' 1.
30.5
41.6
20 . 9
4 . 5
1.4
.4
Possibility of Racial Differences
The 208 small specimens obtained in April, 1941, were
measured to see if there was any indication of two races of
P . americanus in Point Judith Pond . Measurements were plotted
(Fig. 5 ), and the resultant curve showed the existence of only
one race .
V. CONCLUSIONS
1. Scales should be consistently taken from the same area
on all fish to get a true scale reading. The area which
has proven most indicative on P . americanus is shown in
Fig . 1 .
2. It is possible to determine the age of the winter flounder
-32-
b y scale analysis. In the young fish (O's), the time of
capture should be known to avoid misleading interpretation
of false checks as winter bands. However, after one win
ter band has been laid down, a comparison in size would
eliminate a false check as a winter band.
3. There is conclusive evidence that in Point Judith Pond
the winter flowider experiences a very extended spawning
season, shown by the group of yearlings between 138 and
190 mm. possessing winter circuli in the proximal portion
of the scale.
?2.
~3
s'I
I t ~ I I
l + t t ,.
~51 + + + t ~ I
~ ,. + t i I
.....c: -~ 3, I r ,. ~ r t
l J , ' I '+- + + j 'O
.I.. ()I
27 .....C)
~ ::>
'Z
Ii
1
I
)0-,>"f (,O-&'I 70 -?9
I ~ ~ r
+ t t I i
1 +
I
j:' I 1
..
I
Lenqth fre9uency d;stribvUon of P ornericanu.s . ~
Small s r~c.imens ~ Pt. Jud'iih Pond - A pri/ 19'11
/\ . I I I t l ; I j i j ,. t ,. ,. . i t
\ ·:·:;; + I ~ l t r
l t I . , I i : r 1 ~ + t t : 1 ' •
j ,. 1 + \ 1 r • t t
t t t- t F7 I l I i~ . s--
fO·'i'f 'fO ·'t"l 1 /IJO - /0"( /IC -f l"f 00 -1;17 /31-IJy
LtY1fU1 ih 'Ytlill im~ters
I C>I CN I
I
I I
I I
I I
I
I
I
I '
30
I I
I I
I
I I
I
I I
I
I
I
I I ~
I
I I I
I
I I
I
I I
I I
Figu e 6
I l\' I I
I
I
I
I
110 -/ l"f /ZIJ- z9
I
I
I
IJd-/J'f /'f) /'{Cf /SO-/)y /00 W t
rnposit on of the
Pt J dilh R nd
'Wi A
ter fl under to A
Population
e Groups
ctober 31) /Q · 0
/ / ' · ... . / -·- /
(70-/?'f /fO l f't / '(O -/ 'f 'i' ZOO lO~ 2/0 ·l/<f 2l0 ll'f
Le gth in millimet rs
' · ' I
I
/
/
t li l t I
3/0 -J/'f 3L -ll.'f
- 35-
Table 2
Averages of Scales Fish ( . 01 mm. }
Length & Width Number of Number of (cm. } Length Width Circuli Radii
21/5 19. 2 12 . 9 3 . 5 0 29/7 31.4 23 . 2 13 3 30/8 31. 8 21 .4 12 .4 2 . 7 32/9 36.4 22 06 14. 2 5 37/12 39 25 . 4 19 5 . 2 40/15 45 . 2 2806 23 . 4 5 43/18 46 . 4 31 . 2 27 6 . 2 46/14 5l o7 31 ~ 8 25 . 5 6 . 4 50/22 58 . 2 34. 4 34. 2 7 52/17 54 . 6 36 .2 35 .4 6 54/19 61 . 4 41 . 6 47 7 . 4 56/18 63.2 40 . 5 43 . 2 7 . 7 57/20 74 . 2 48.l 4 2. 6 7 . 2 59/21 77 . 3 53 . 3 51 . 2 8 . 7 66/25 94 . 2 60 . 4 58 10 . 1 71/27 97 . 5 65 60 11 75/25 98.'7 62 . 2 60 . 2 9 75/26 106 78 64 11 80/30 113 70 73 8 . 5 84/31 108 71 78 9 . 1 89/32 119 78 76 8.3 92/33 106 69 '71 9 . 1
100/35 109 75 95 8 05 110/38 109 90 81 8 . 9 111/42 135 91 89 12 122/34 134 84. 5 88 11. 7 125/45 142 99 . 6 89 11 130/51 1 50 102 . 5 94 9o 4 136/60 165 121 96 11 138/46 140 132 118 12 145/50 166 133 110 15 151/53 190 112 125 12 165/ 62 202 132 137 12 170/63 211 140 140 16
Text : Selected Series of Lengths .
-36-
VI. ACKNOWLEDGMENTS
The author wishes to express his sincere appreciation
for the invaluable assistance given by Dr. Charles j . Fish
in the preparation of this paper.
He is indebted also to Alfred Perlmutter for very help
ful suggestions, and to Warrens. Landers for assistance in
field and laboratory work .
-3?-
v • IBLIOGRAPHY
Literature Cited
l . Creaser, Chas. w. , 1926 - Structure and Grovvth of the Scales of Fishes in Relation to their Life History, with Special Reference to the Sunfi sh, Eupomotis gibbosus. · Univ. of Mich. Publ. Misc . Publ . No. l?. Museum of Zoology.
2. Dahl, Knut , 1911 - Age and Gr owth of Salmon and Tro ut in Norway as Shown by their Scales . Salmon and Trout Assoc ' n . London.
3 . Rae, Bennet B., 1939 - Age and Grovvth of Lemon Soles in Scottish Waters . Fisheries Board f or Scotland. Scientific Invest. No . ·1: 1- 39 . ·
4 . Taylor, H. F., 1914 - Structure and Growth of the Scales of the Squeteague and the Pigfish as Indicative of Life History. U. S . B. F. Bull. Vol. XXXIV: 285-330.
Liter ature Examined
1 . Bigelow, H., 1934 - Fishes of the Gulf of Maine . u. s . B. F. Publ. Part 1. Vo l . XL
2 . Brown, Wallace , 1901- 1903 - Some Observations on the Young Scales of the Cod, Haddock, and Whit ing before Shedding . Proc. Roy. Soc . Edinburgh. Vol. XXIV: 437-438.
3. Cockerell, T. D., 1912 - Observations on Fish Scales. u. S c B. F. Bull . Vol . 32: 117-1?4.
4. Esdaile , Philippa, 1912 - Intensive Study of the Scales of Three Specimens of Salmo salar . Manchester Literary and Philosophical Soc . Vol. 56. part I memoir IIIo
5 . Green, E. Ho, and Tower, R. w., 1901 - Organic Constituents of the Scales of Fish. u. s . B. F. Bull . Vol XXI:9?-l02.
6 . Hile , Ralph, 1936 - Age and Gro~~h of the Cisco in the
7.
Lakes of t he Northeastern Highlands , Wi sconsin . u. s . B. F. Bull . No . 19 . Vol. XLVIII:218-226.
Hannah, T. H., 1873 - On the Scales of Fish . Sussex Nat . Hist. Soc . 20th Annual Report:
Brighton and 55-5?
-38-
8 . Huntsman, A. G., 1919 - Grovvth of Scales in Fishes. Trans. Roy. Canadian Inst . Vol. 12 : 61-101.
9. Hutton, J . A. , 1909 - Salmon Scales as Indicative of the Life History of the Fish. 27 pp. XIV pl. London.
10. Johns Von, Ho w., 1905 - Scales of the Tay Salmon as Indicative of Age, Growth, and Spawning Habit. Fish Board
11 .
for Scotland. Annual Report 23. pt. 11: 63-79.
Lee , Rosa M., 1920 - A Review of the Methods of Age Growth Determination in Fishes by Means of Scales. of England and Wales . Minister of Agri . and Fish. Invest. Series II Vol . 4. No . 2: 1-32.
and Fish. Fish.
12. Marshall , N., 1939 - Annulus Fonnation in Scales of the Common Shiner, Notropis cornutus chrysocephalus Copeia . No . 3 . Sept . 9: 148-154.
13. Masterman , A. T., 1913 - Report on Investigation upon the -Salmon with Special Reference to Age Determination by Study of Scales. Board of Agri . and Fish. Fish . Invest. Series I . Salmon and Fresh Water Fisheries Vol. I: l-80e
14. Milne, Jo A., 1913 - Pacific Salmon: An Attempt to Evolve Something of their Life History from Examination of their Scales. Proc. zoo. Soc. London: 572-610.
15. McMurrich, J. P., 1912 - Life Cycles of the Pacific Coast Salmon, Oncorhyncus, as Revealed by their Scale and Otolith Mar kings. Roy. Soc . of Canada. Sa:t . IV: 9-29 .
16 . Thompson, Harold, 1923 - Problems in Haddock, with Special Reference to the Validity and Utilization of the Scale Theory . Prelim. Report o Fish. Board for Scotland . Sci. I nvest . Edinburgh o
17 . Thomson, J. s ., 1904 - Periodic Growth of Scales in Gadidae as an Index of Age. Journ . Marine Biol . Assoc ' n . Vol . 7 : 1-109 0
18. , 1929 - Life History of the Lake Herring of Lake Huron as Revealed by its Scales , and a Critique of the Scale Method. U. So B. F. Bull . Vol. XLIX. Washington : 265-428 .
19 . Winge , o., 1915 - On the of the Cod as a Means of by Marking Experiments. eri , Bd . 4 res . 8: 1- 210
Value of the Rings in the Scales Age Determination, Illustrated Medd . Komm. E:avunders, ser. Fisk-