Page 1
May 25, 2017
Developed by CRESST for Smarter Balanced
2014–15 and 2015–16
Technical Report
Interim Assessments
▪ Validity
▪ Reliability, Precision and Errors of Measurement
▪ Test Fairness
▪ Test Design
▪ Administration
▪ Reporting and Interpretation
Page 2
Smarter Balanced 2014-15 and 2015-16 Interim Assessment Technical Report
Introduction
i
Contents
Introduction and Overview .......................................................................................................................... xi
Overview ................................................................................................................................................... xi
Technical Report Approach .................................................................................................................... xii
Overview and Background of the Smarter Balanced Theory of Action .............................................. xiii
Six Principles of Smarter Balanced Underlying the Theory of Action ................................................. xiii
Purposes for the Smarter Balanced Assessment System ................................................................... xv
Overview of Report Chapters: ............................................................................................................... xvi
Chapter 1: Validity ............................................................................................................................. xvii
Chapter 2: Reliability/Precision and Error of Measurement .......................................................... xvii
Chapter 3: Test Fairness .................................................................................................................. xvii
Chapter 4: Test Design .................................................................................................................... xviii
Chapter 5: Test Administration ....................................................................................................... xviii
Chapter 6: Reporting and Interpretation ........................................................................................ xviii
Acknowledgments .................................................................................................................................. xix
Outside Groups and Organizations that Collaborated with the Smarter Balanced Assessment
Consortium ......................................................................................................................................... xix
Contributors to the Accessibility Accommodations Framework. ..................................................... xx
Other Acknowledgments. .................................................................................................................. xxi
References .............................................................................................................................................xxii
Chapter 1 : Validity .................................................................................................................................... 1-1
Introduction ........................................................................................................................................... 1-2
Purposes of the Smarter Balanced System for Interim Assessments .............................................. 1-2
Summary of Validity Argument ............................................................................................................. 1-3
Validity Framework for Interim Assessments ...................................................................................... 1-3
The 2014 Standards’ Five Primary Sources of Validity Evidence ..................................................... 1-8
Conclusion for Interim Test Validity Results........................................................................................ 1-9
References .......................................................................................................................................... 1-10
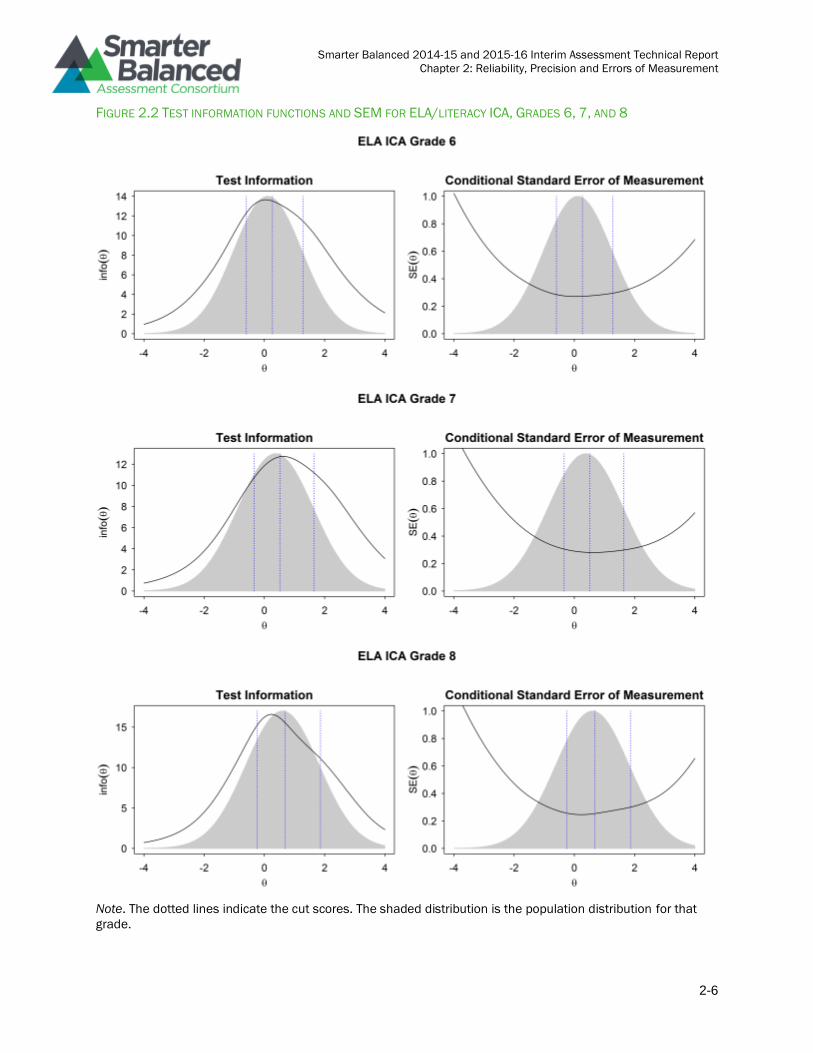
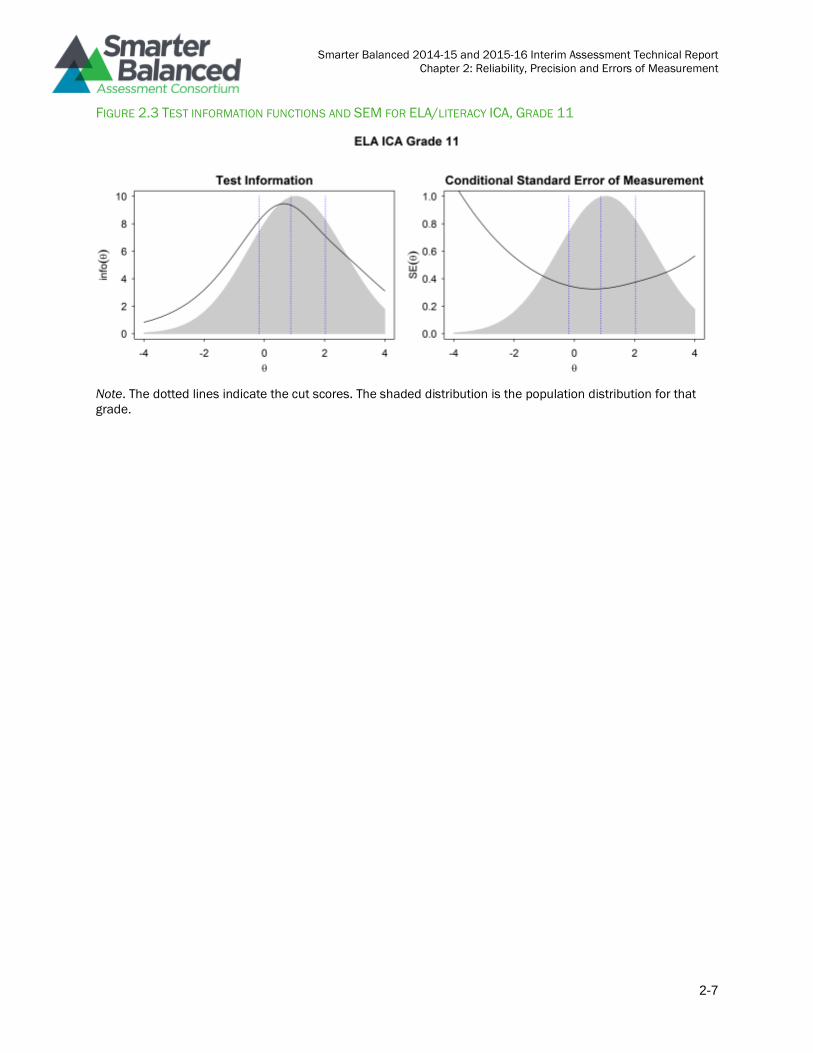
Chapter 2 : Reliability, Precision and Error of Measurement ................................................................ 2-1
Page 3
Smarter Balanced 2014-15 and 2015-16 Interim Assessment Technical Report
Introduction
ii
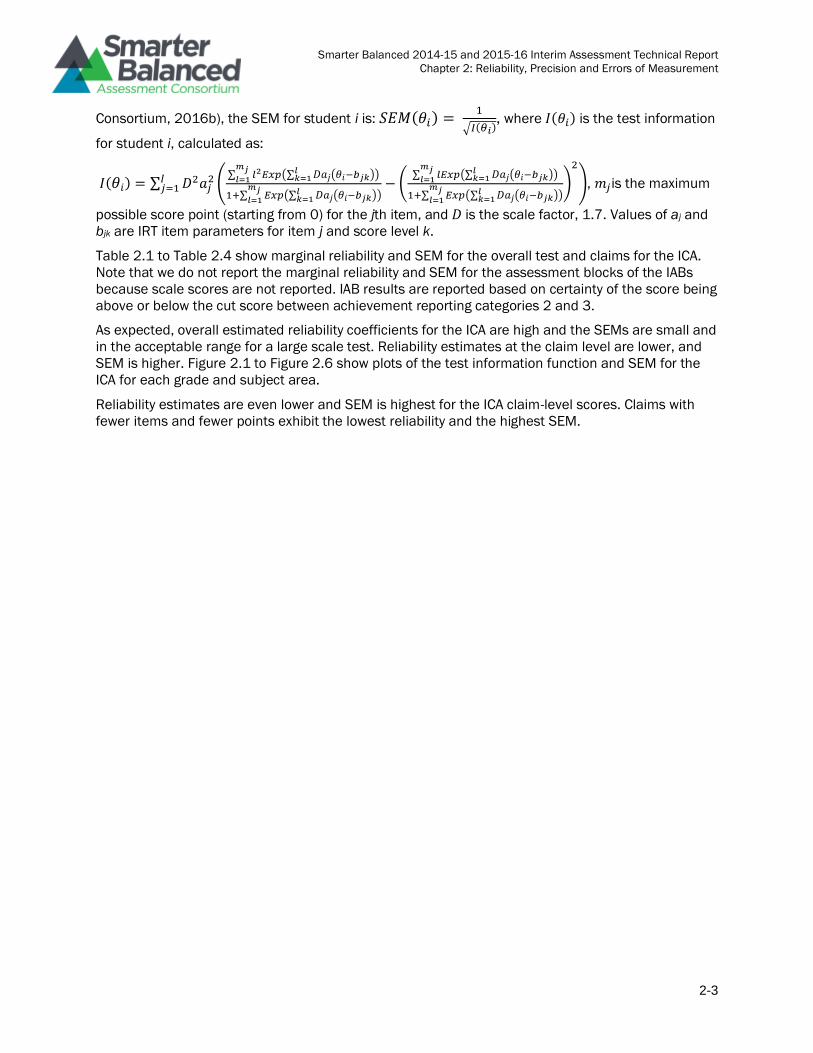
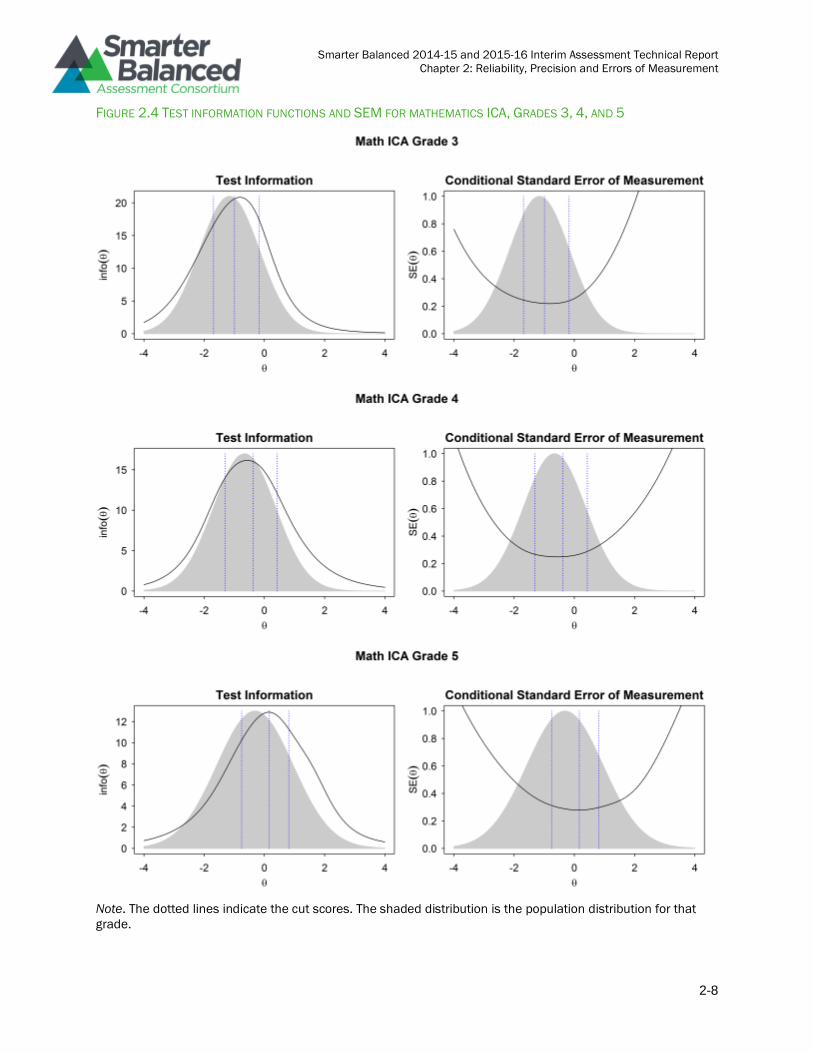
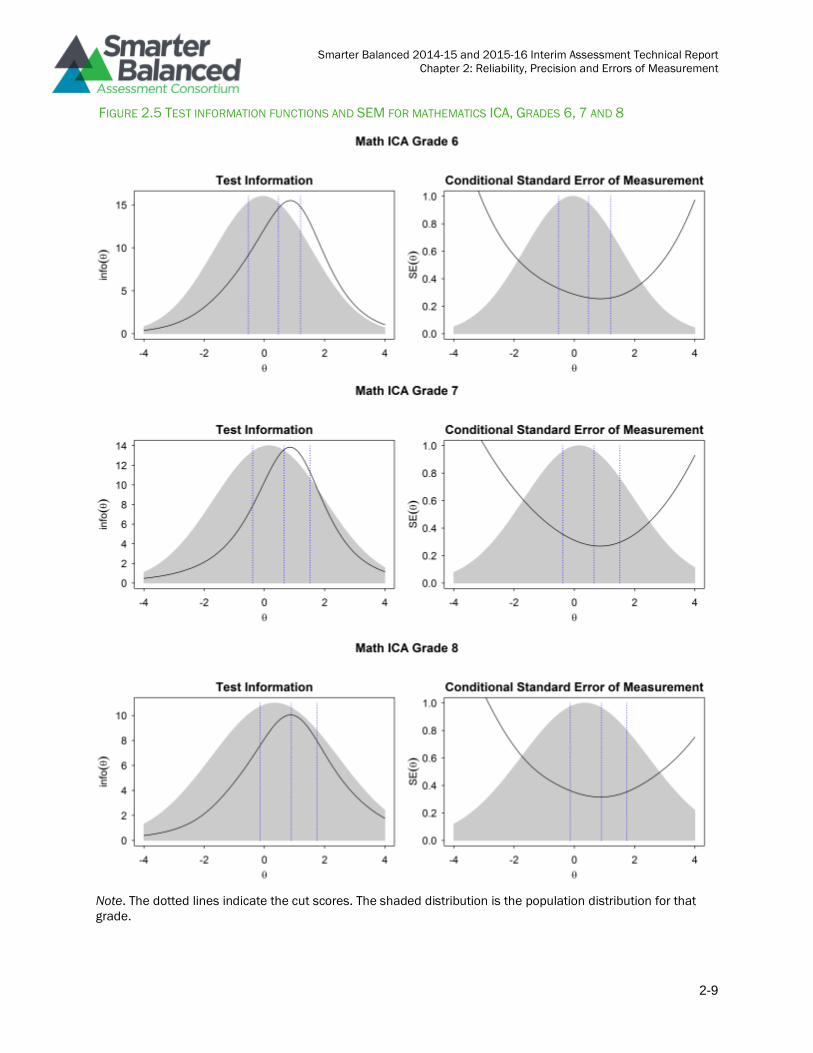
Introduction ........................................................................................................................................... 2-2
Evaluating reliability and precision ...................................................................................................... 2-2
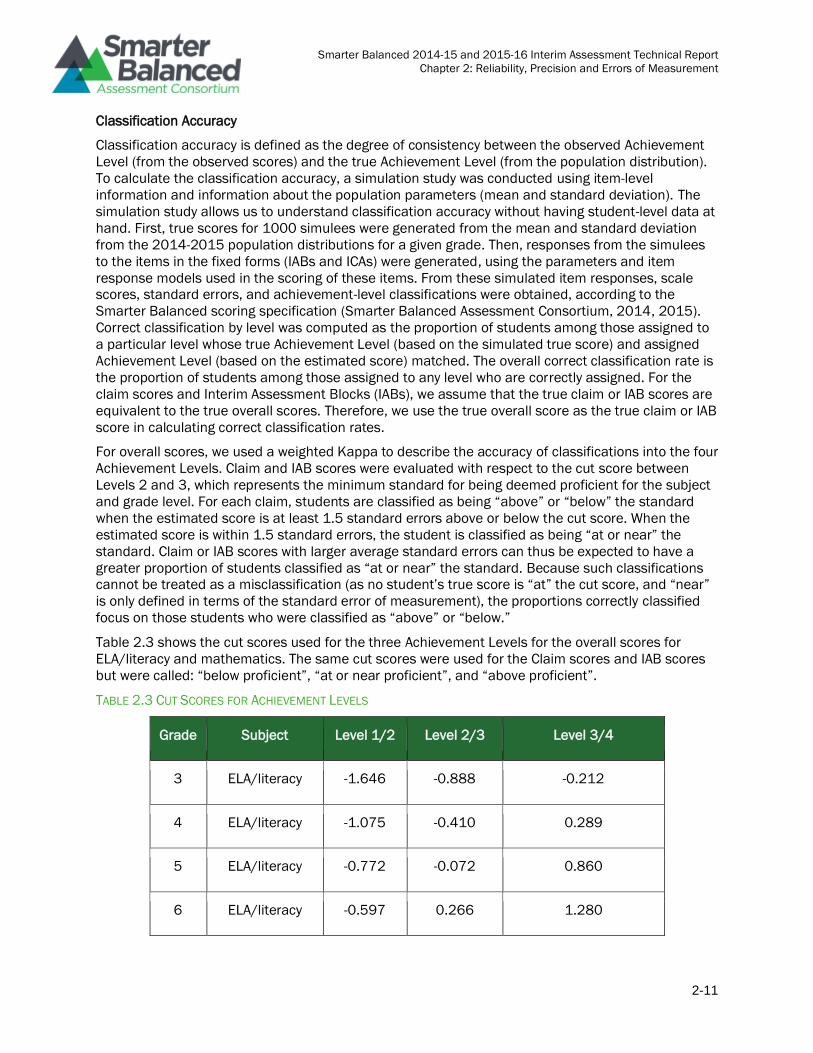
Classification Accuracy ....................................................................................................................... 2-11
References .......................................................................................................................................... 2-22
Chapter 3 : Test Fairness ......................................................................................................................... 3-1
Introduction .......................................................................................................................................... 3-2
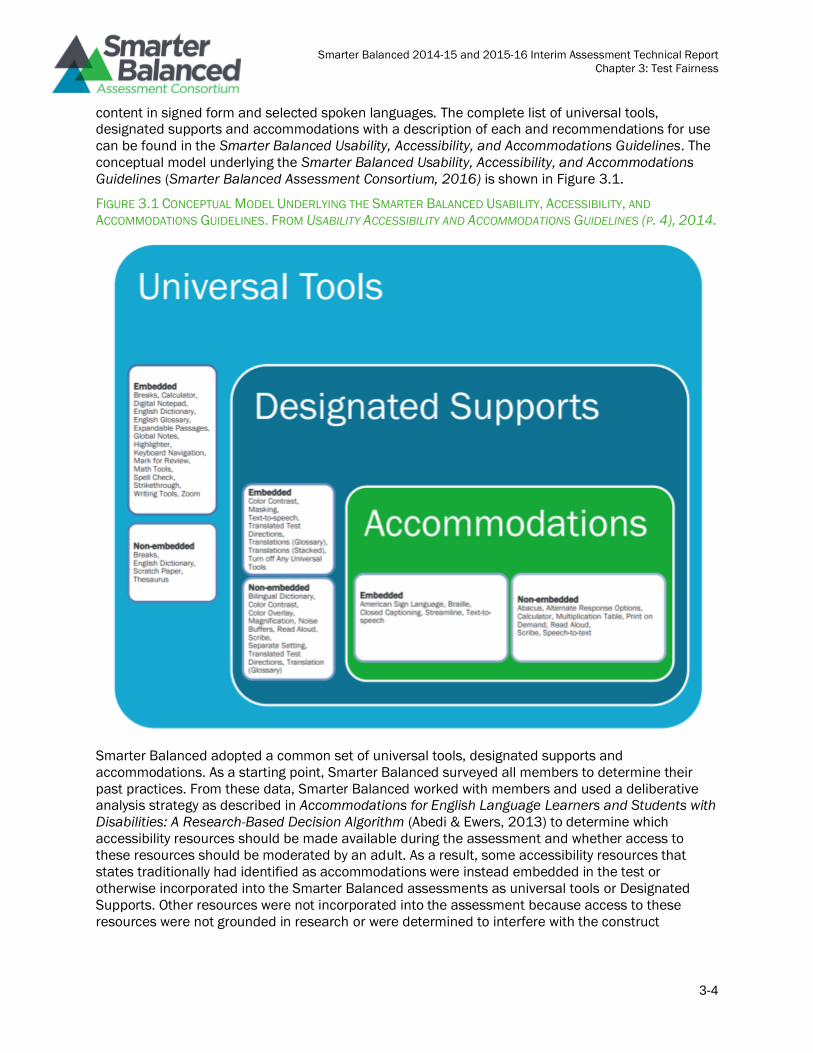
The Smarter Balanced Accessibility and Accommodations Framework ........................................... 3-3
Meeting the Needs of Traditionally Underrepresented Populations. ........................................... 3-5
Usability, Accessibility, and Accommodations Guidelines: Intended Audience and Recommended
Applications. ...................................................................................................................................... 3-7
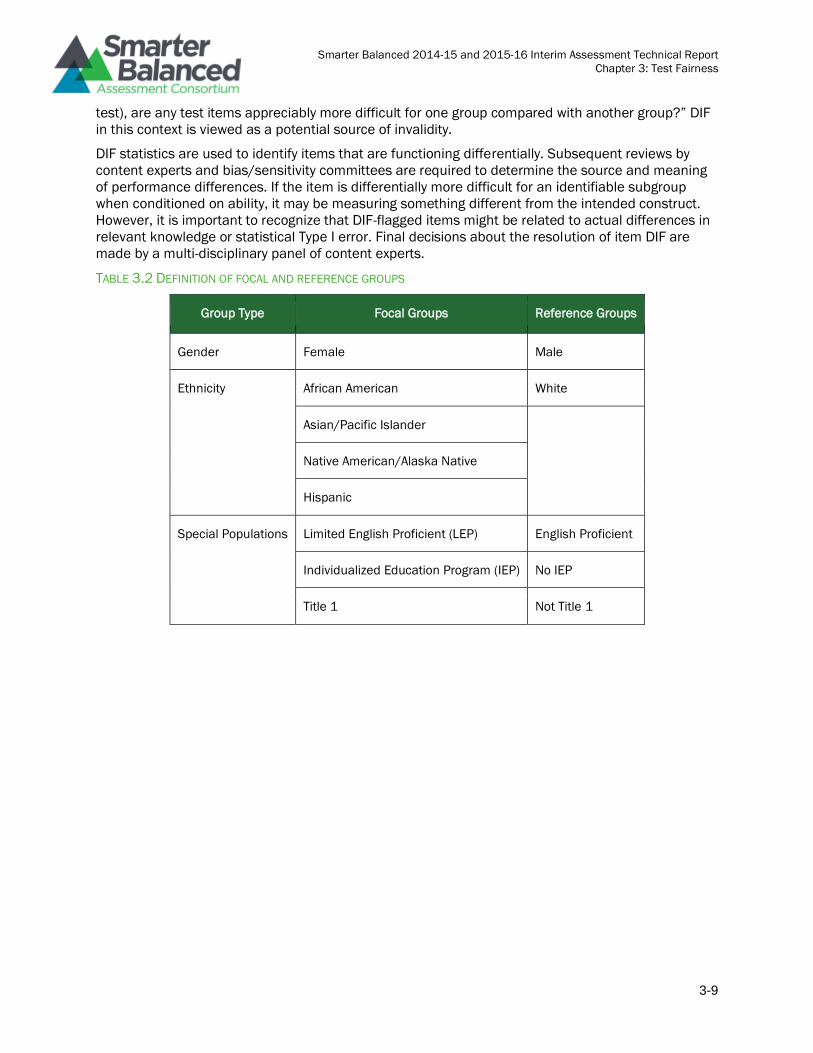
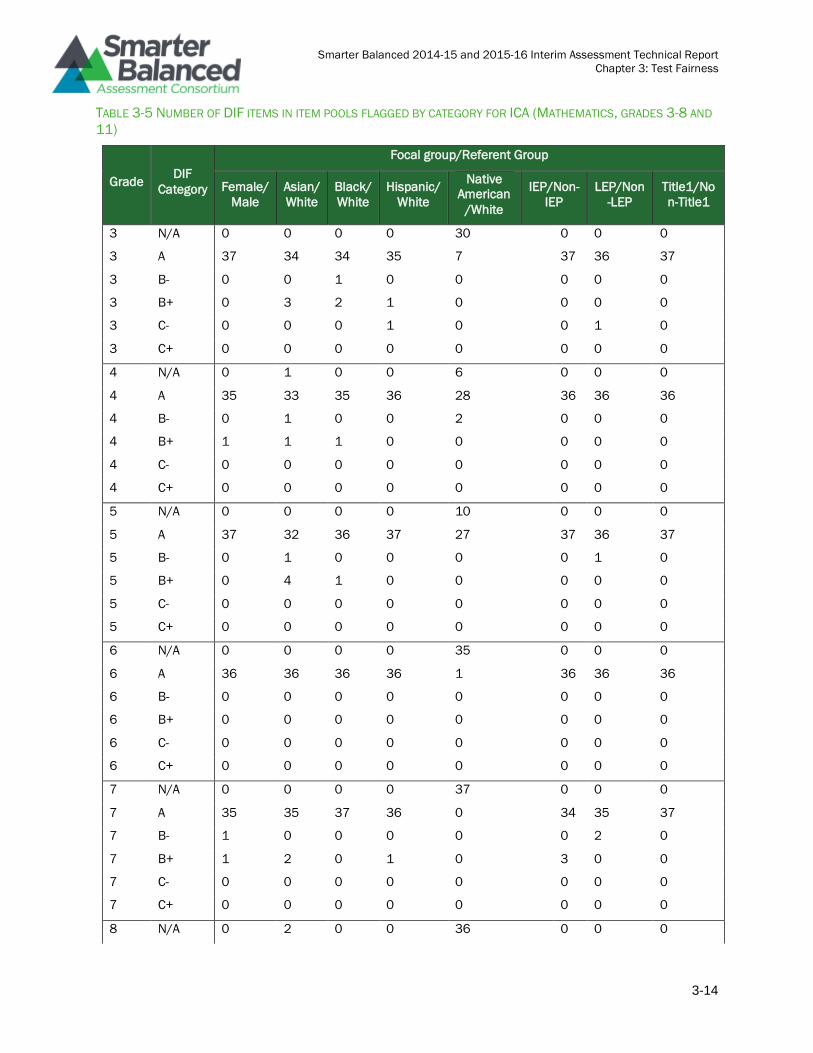
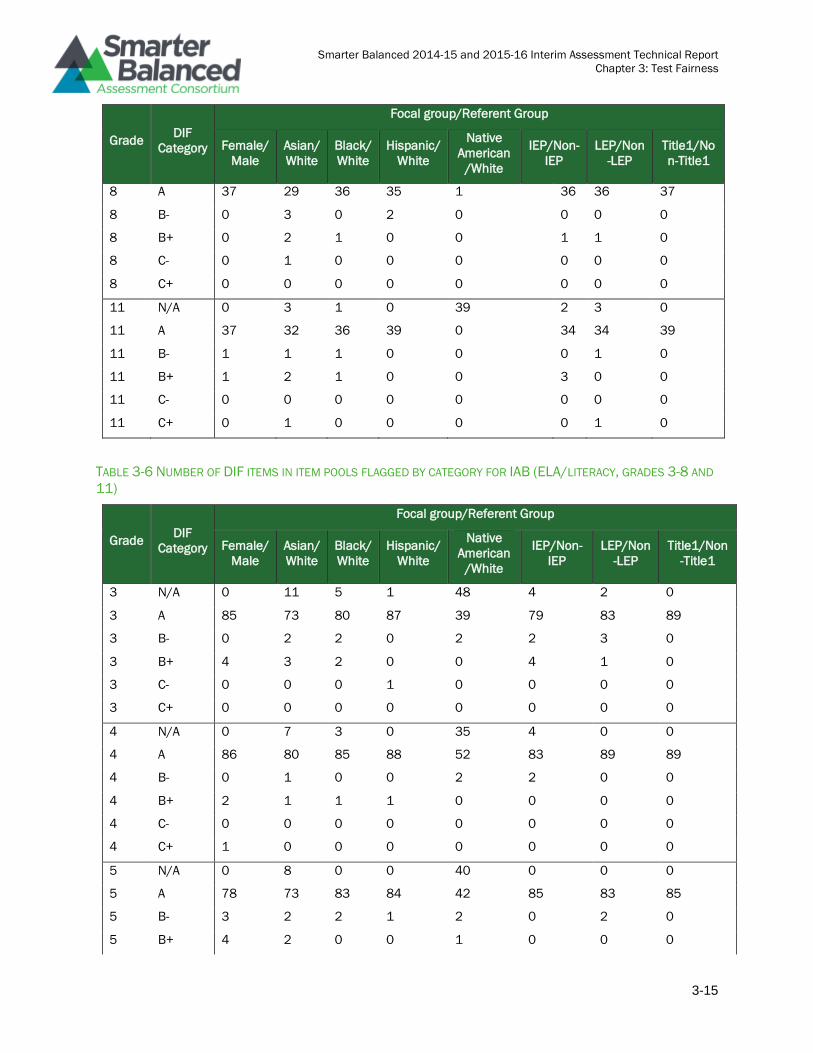
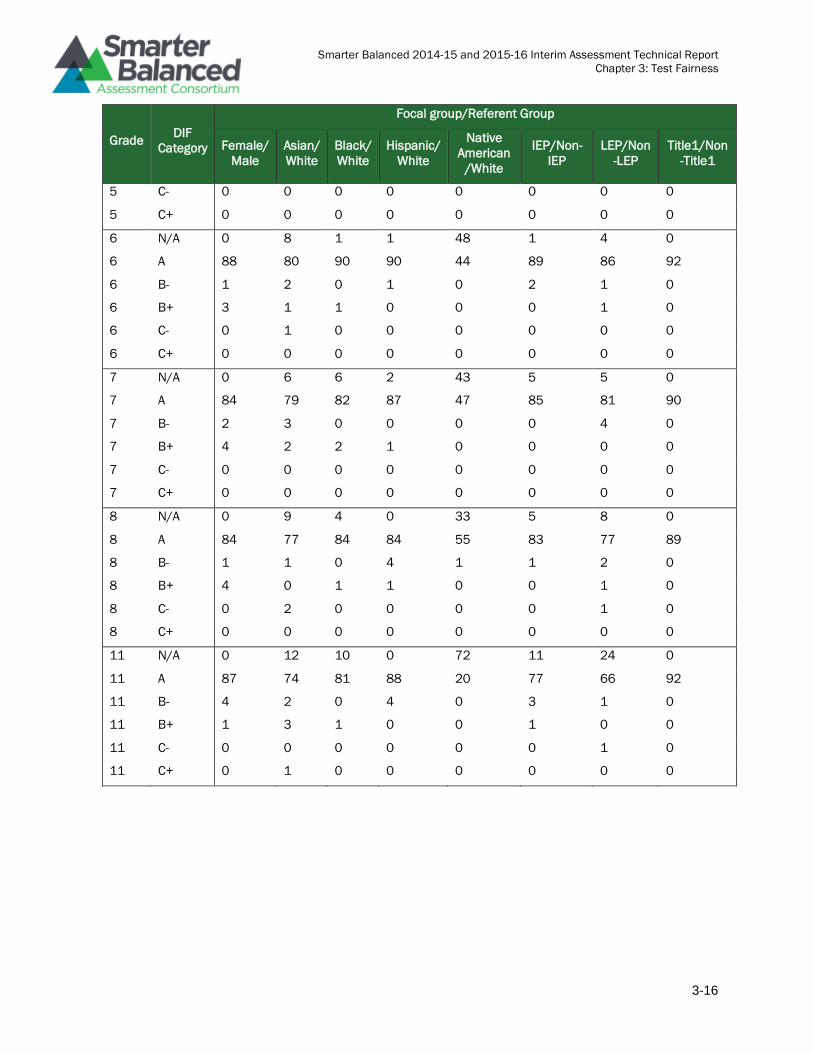
Fairness as a Lack of Measurement Bias: Differential Item Functioning Analyses ......................... 3-8
Differential Item Functioning (DIF) Analyses for the Calibration Item Pool ...................................... 3-8
Test Fairness and Implications for Ongoing Research ..................................................................... 3-18
References .......................................................................................................................................... 3-19
Chapter 4 : Test Design ............................................................................................................................ 4-1
Introduction ........................................................................................................................................... 4-2
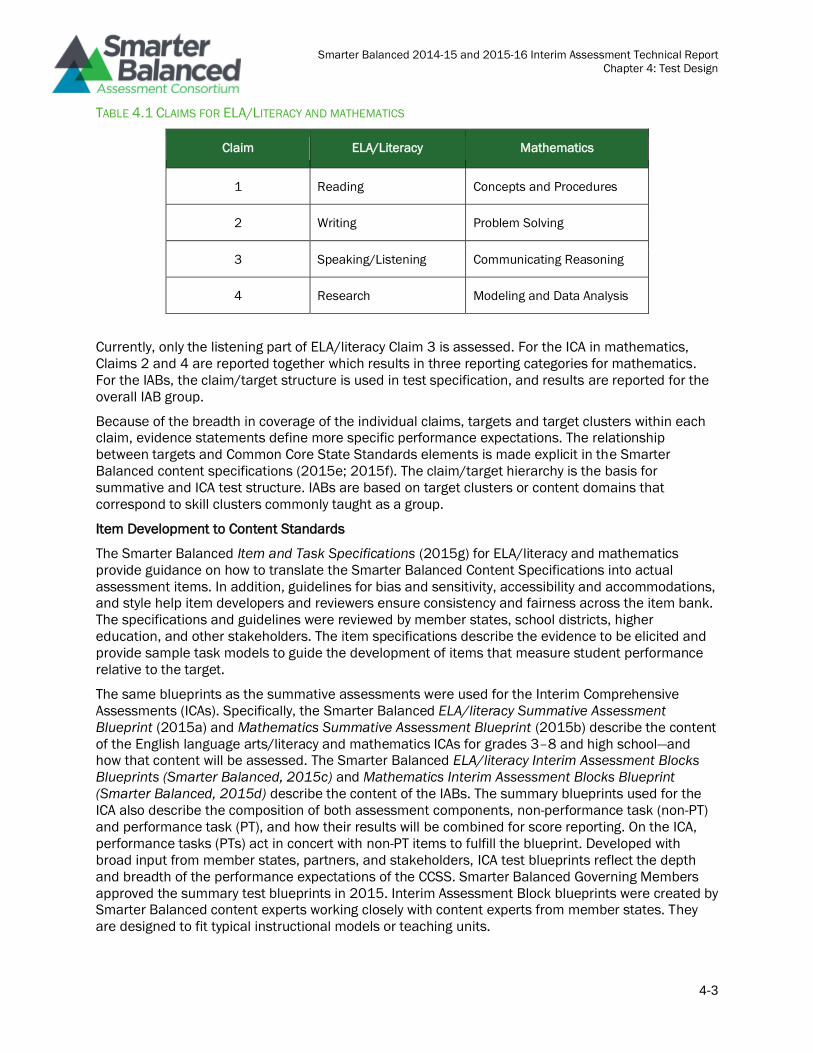
A Brief Description of Smarter Balanced Content Structure.............................................................. 4-2
Synopsis of Comprehensive Assessment System Components ........................................................ 4-4
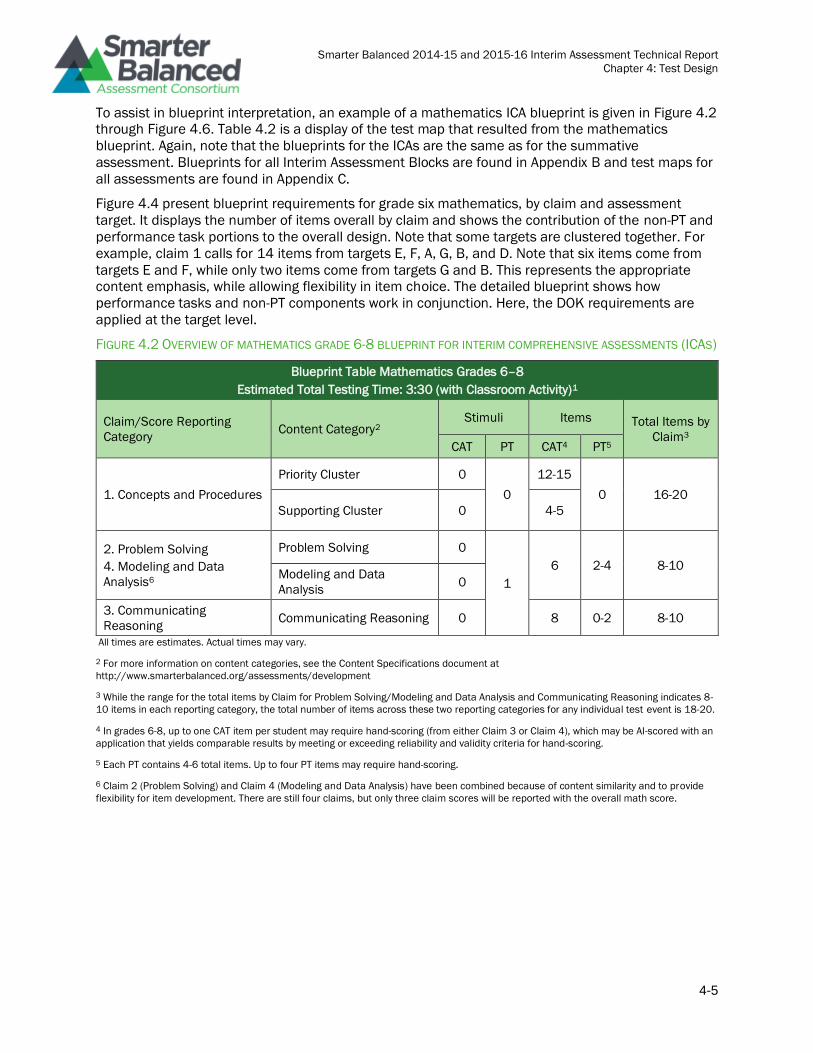
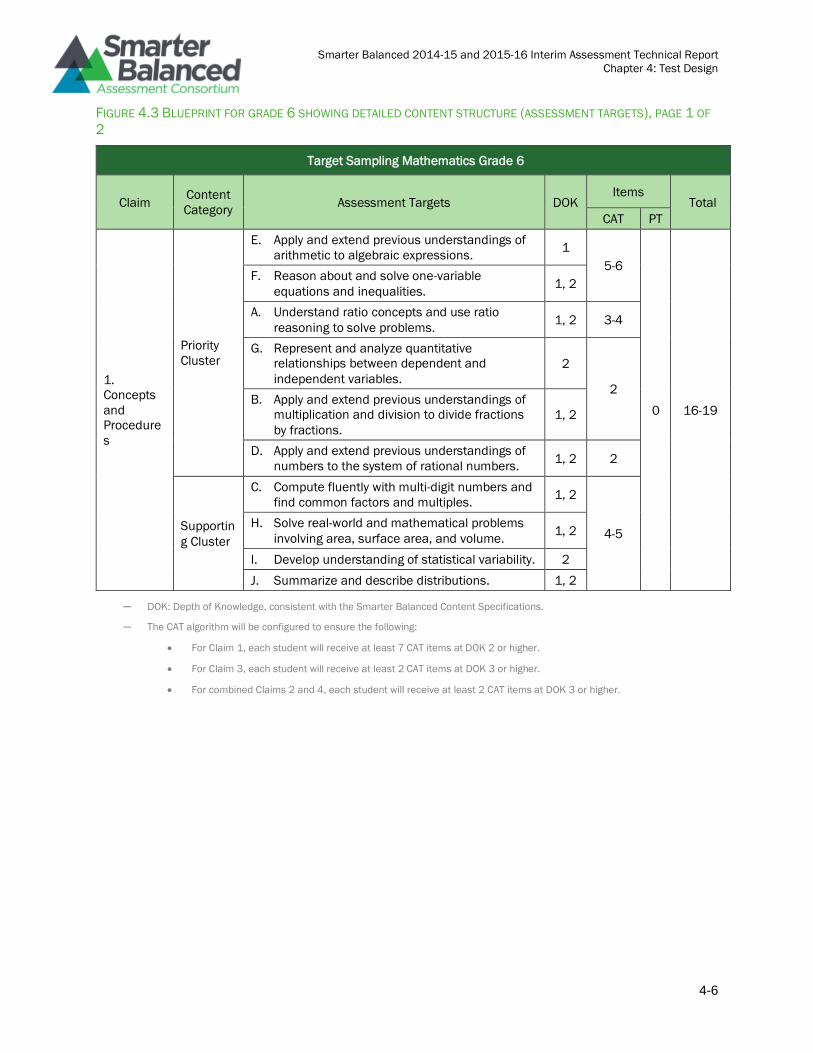
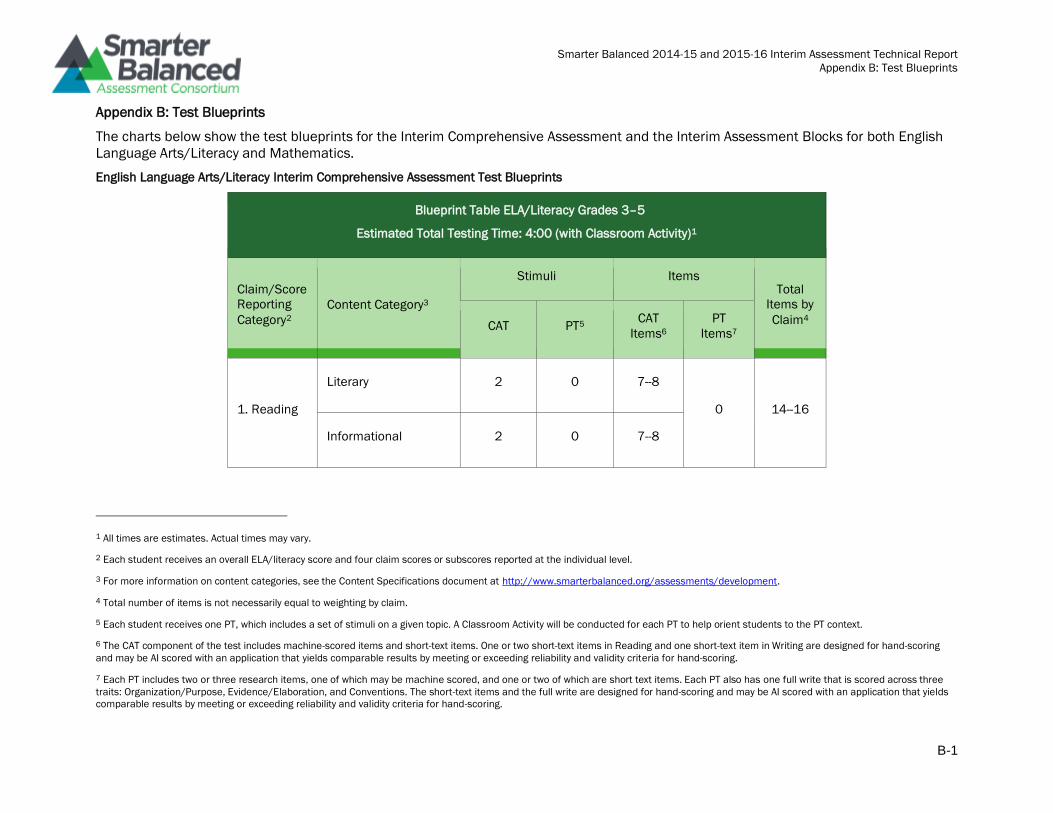
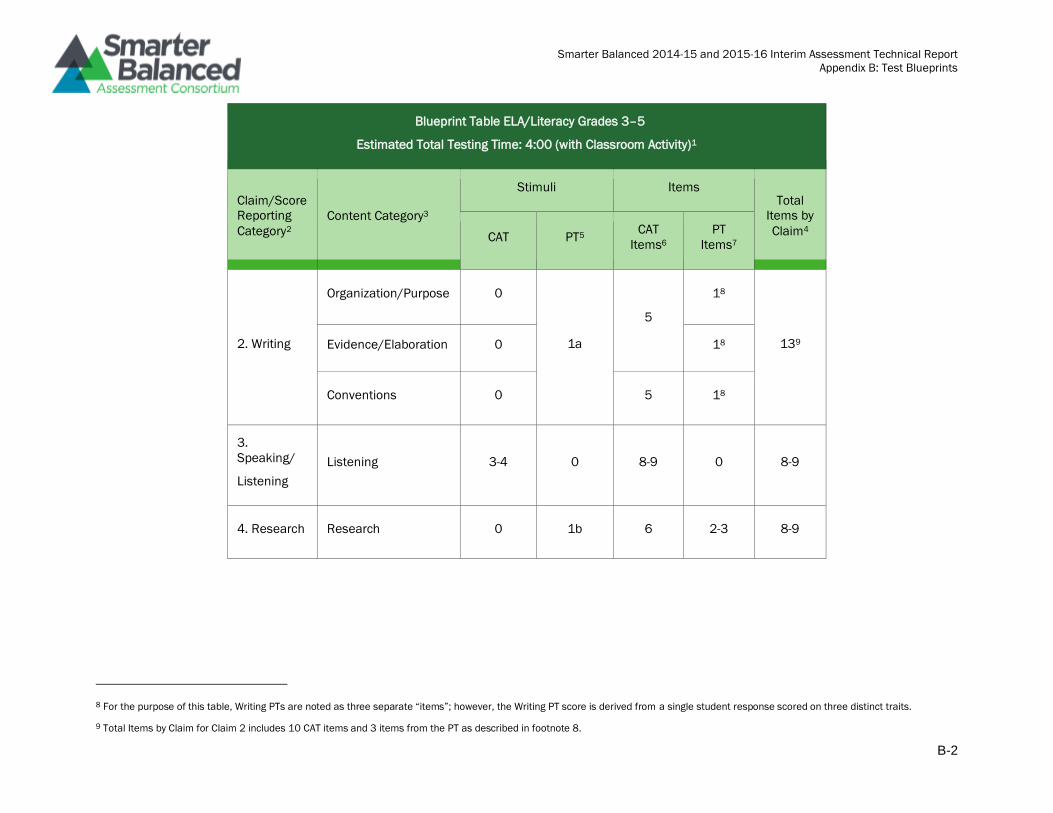
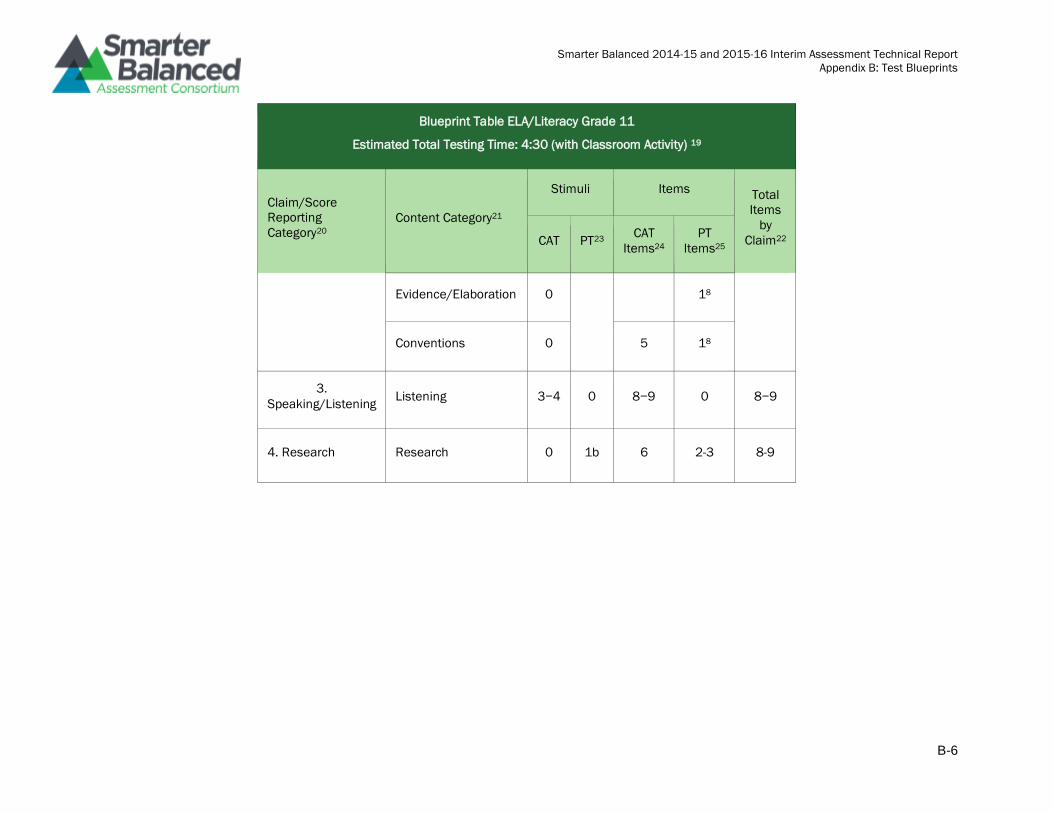
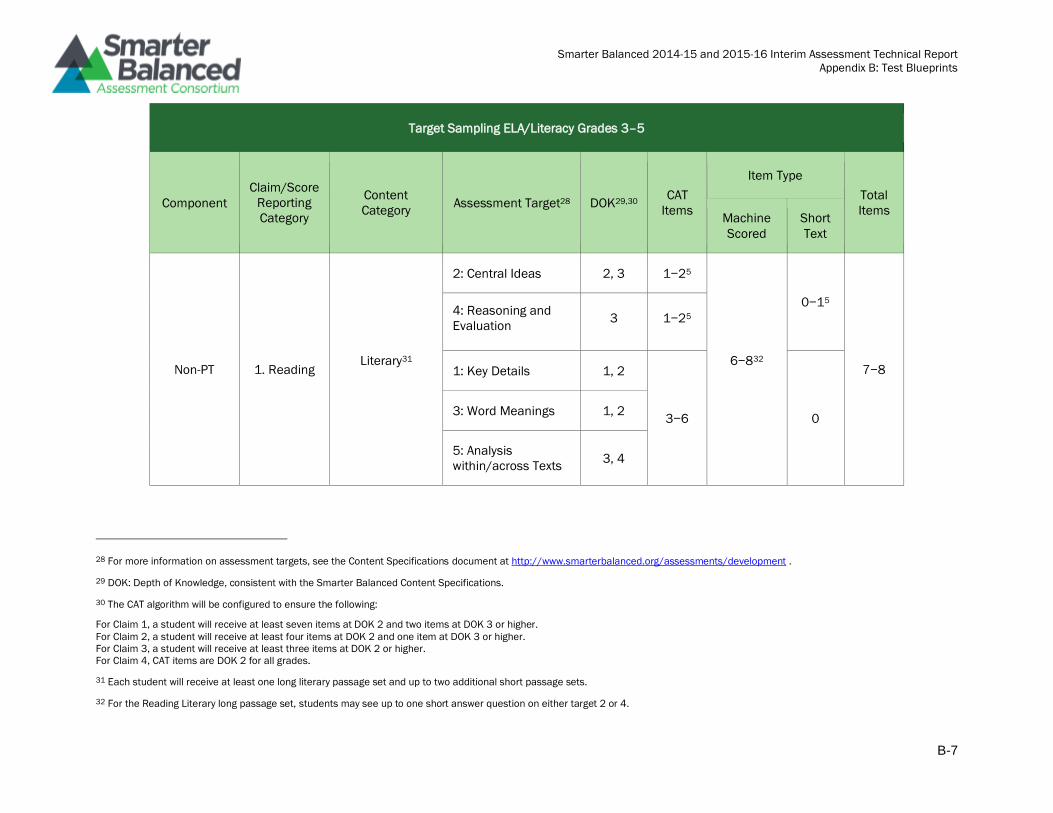
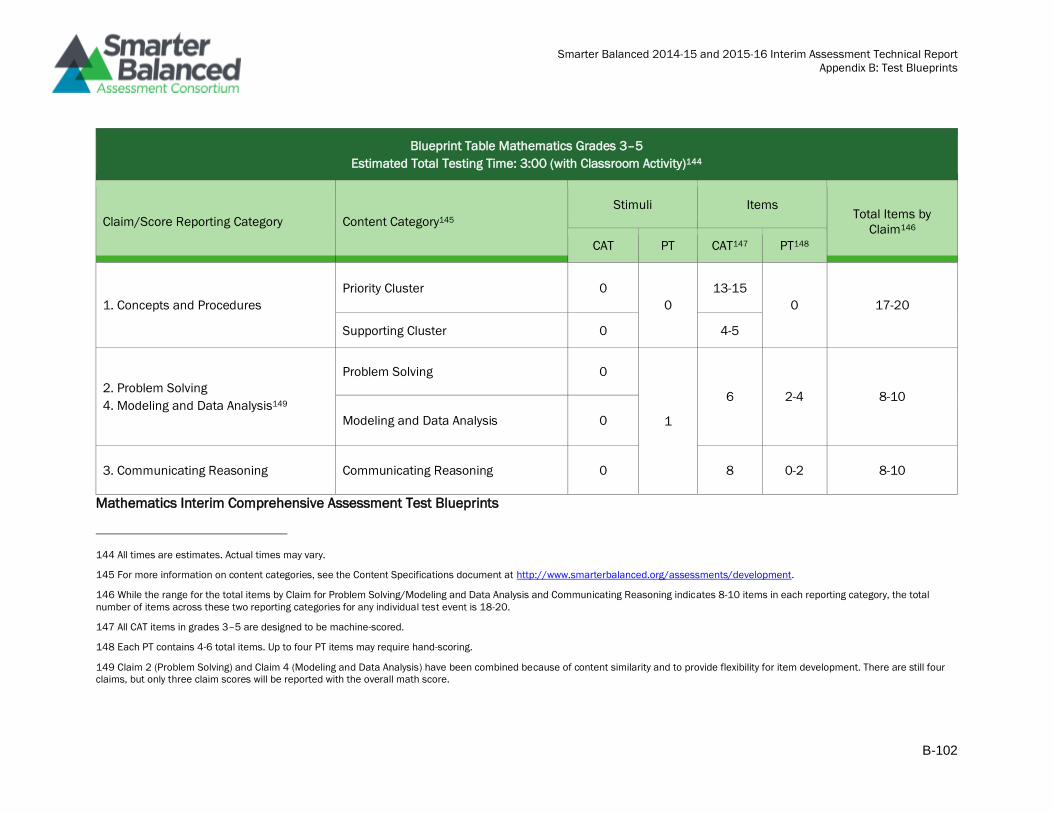
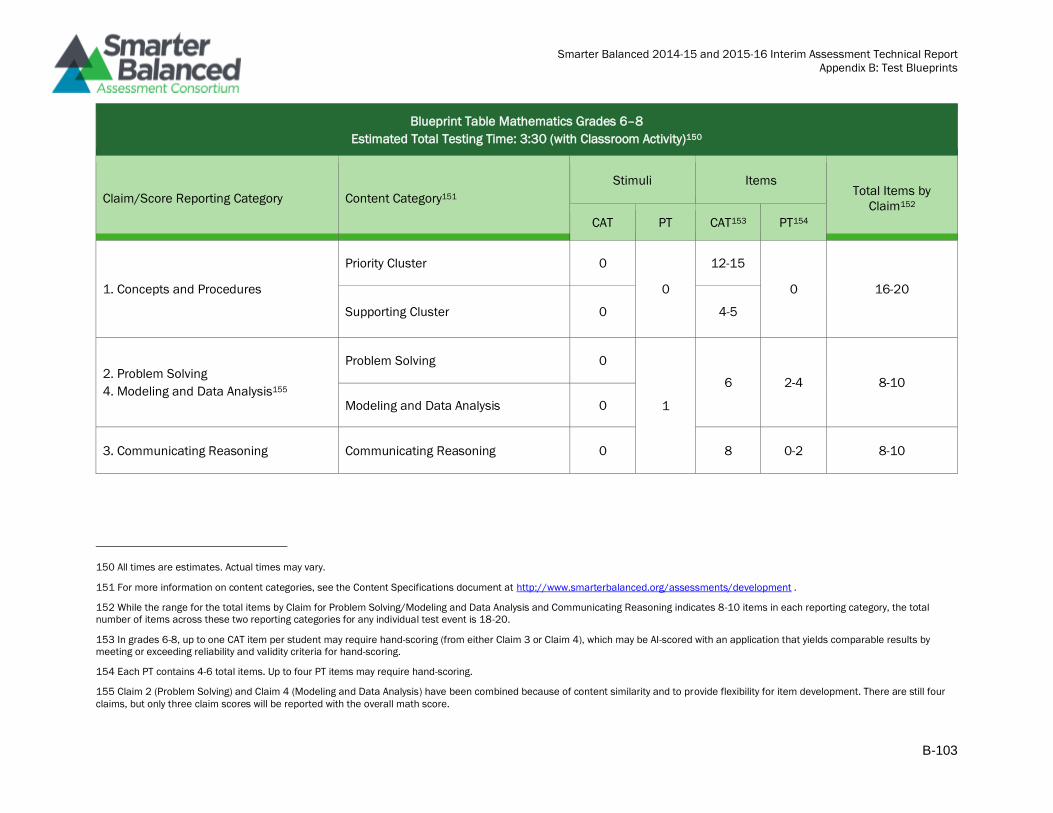
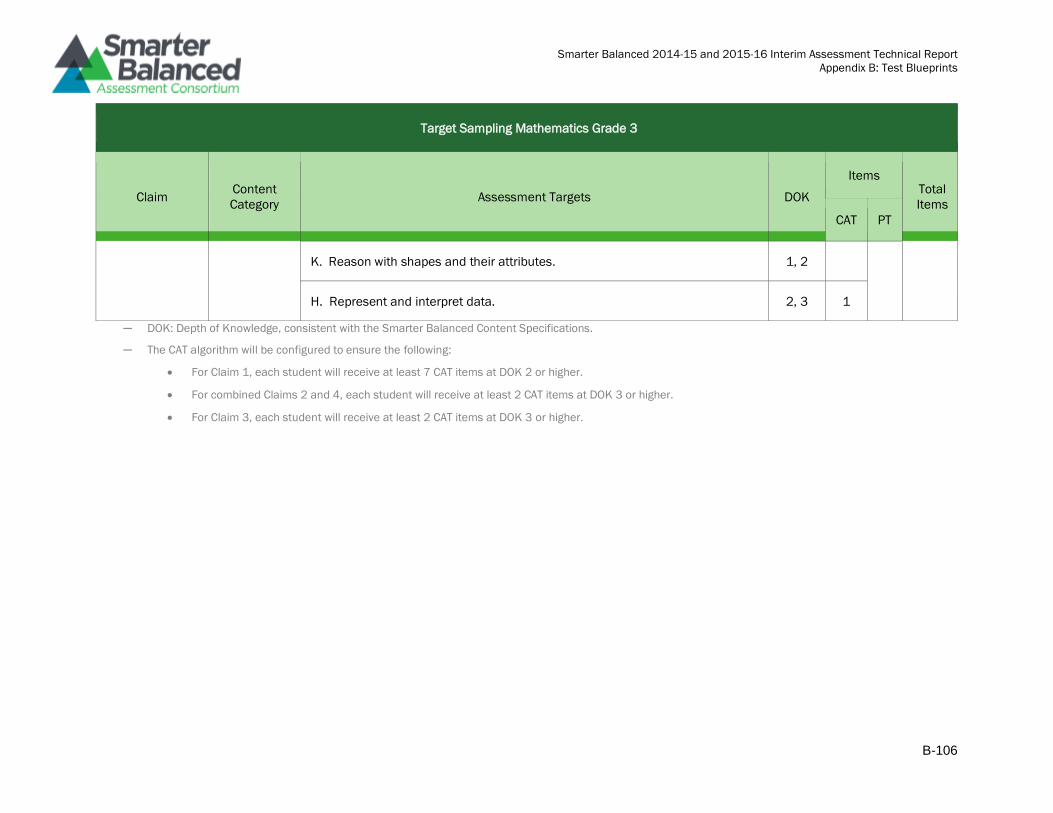
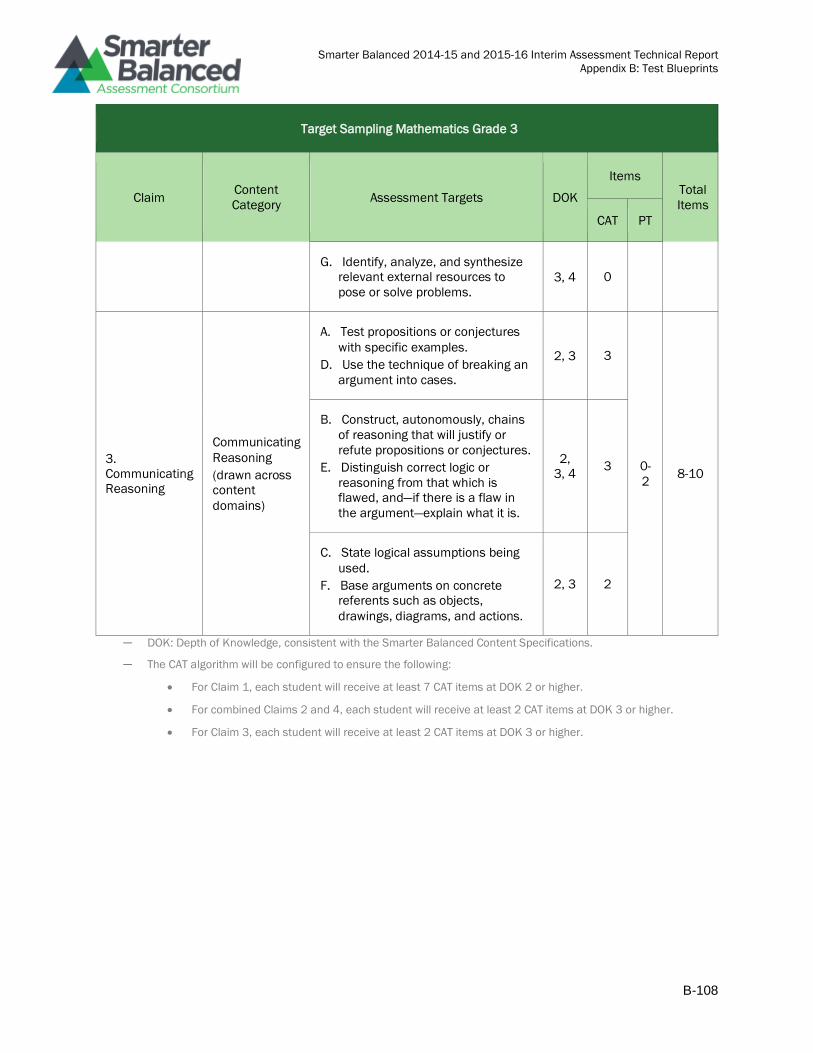
Test Blueprints ...................................................................................................................................... 4-4
Operational Interim Assessment Blueprints and Specifications. .................................................. 4-4
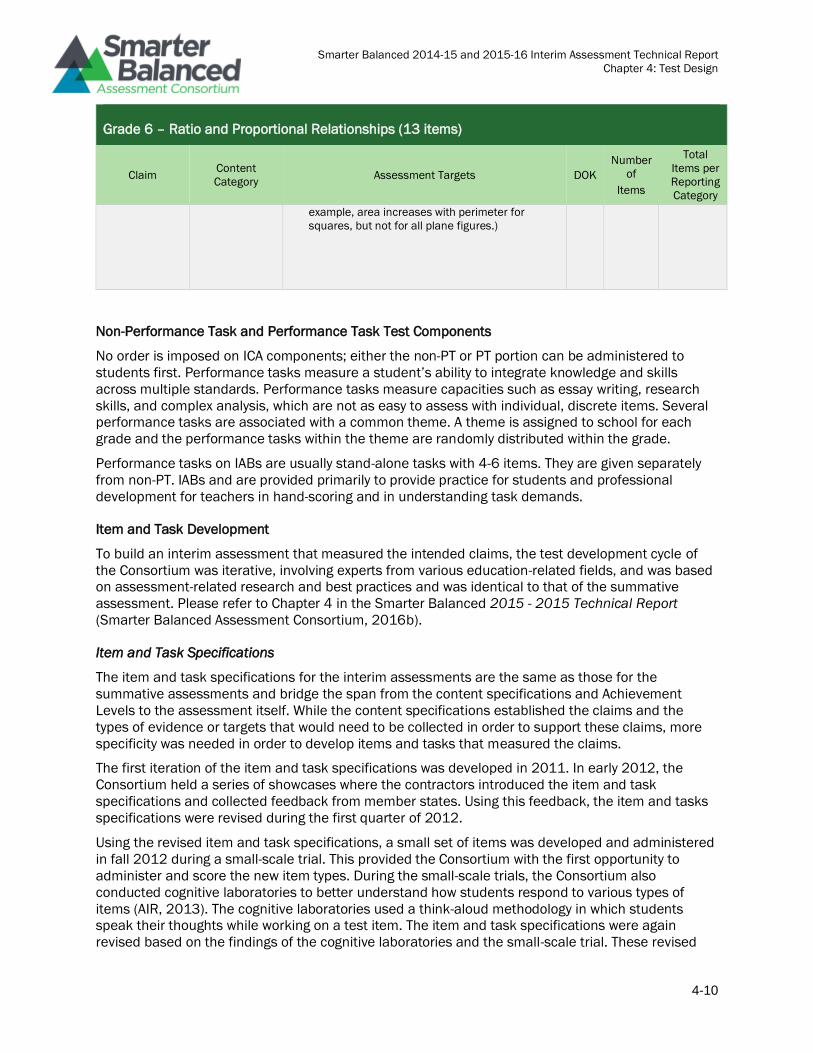
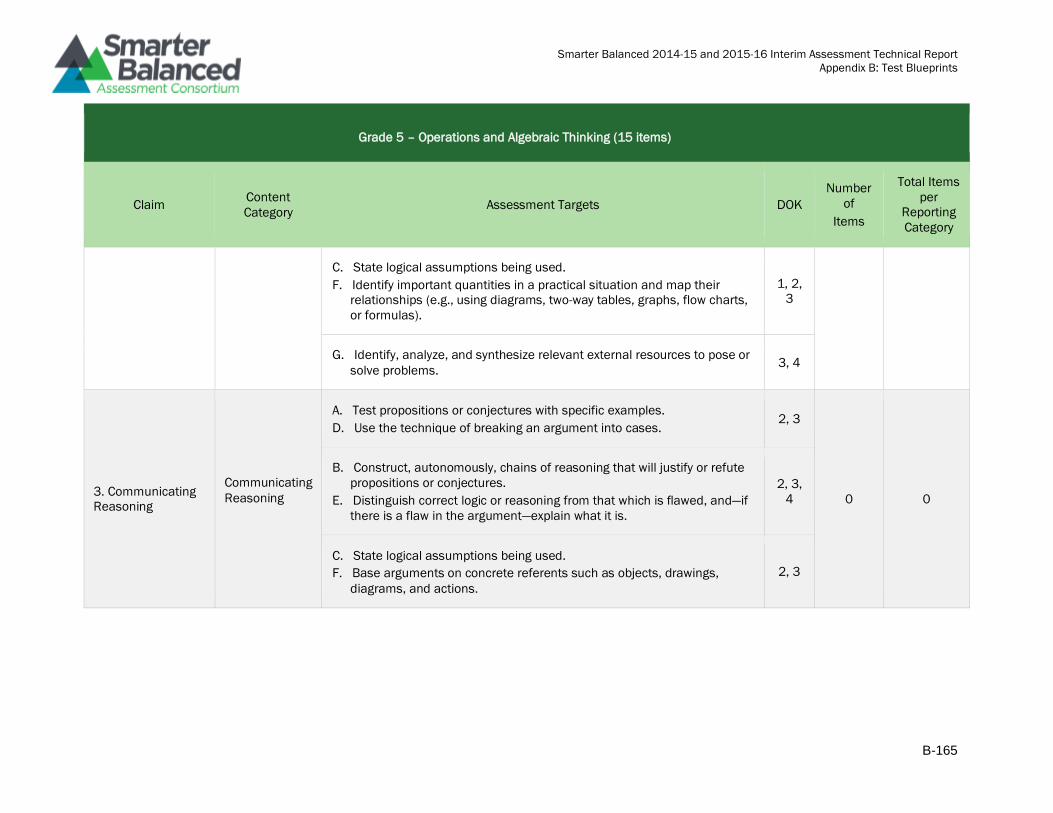
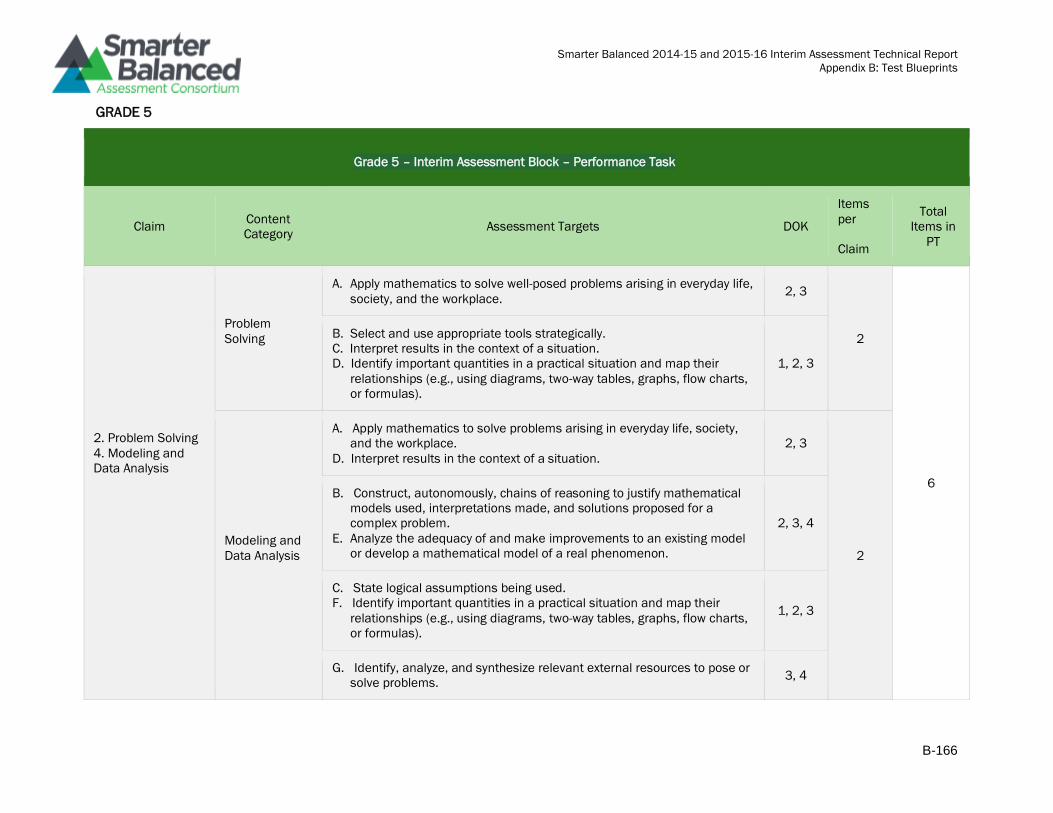
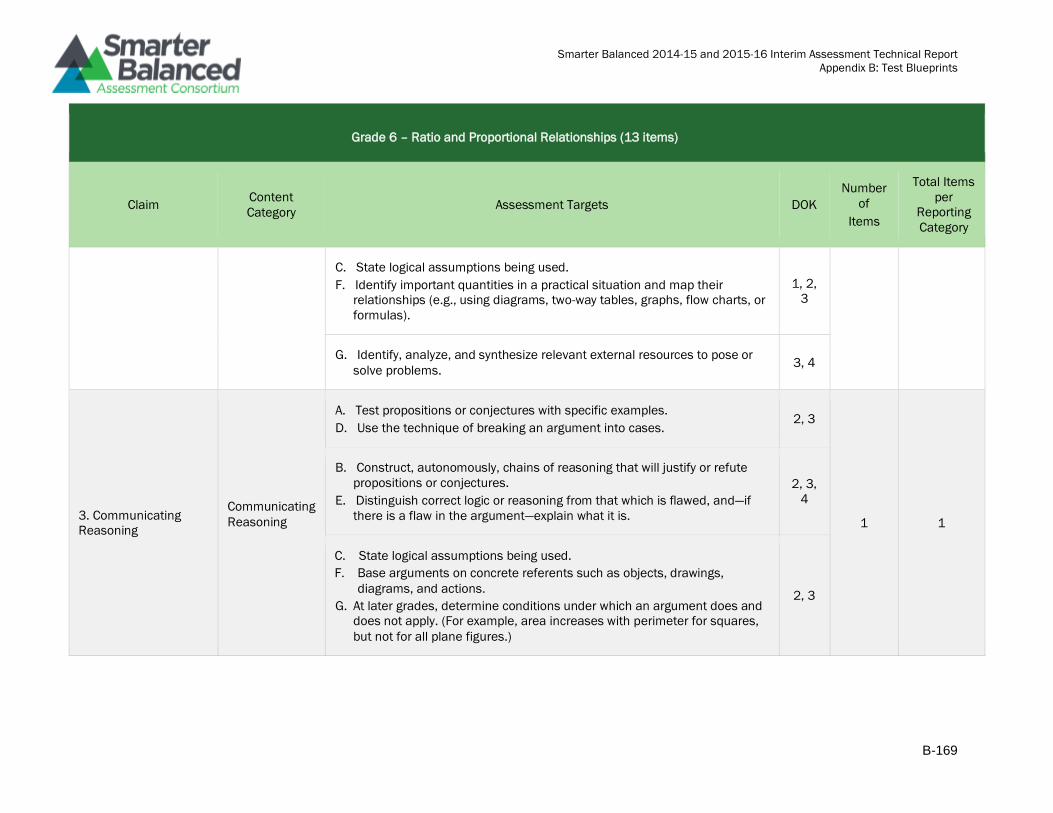
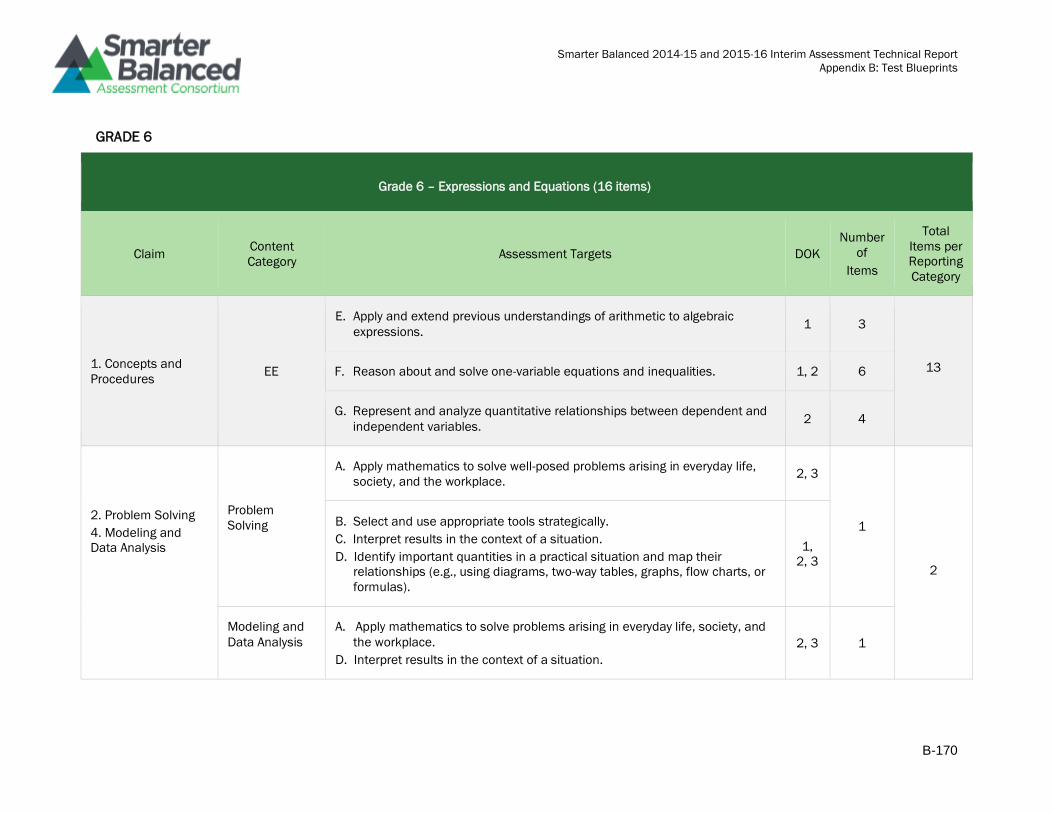
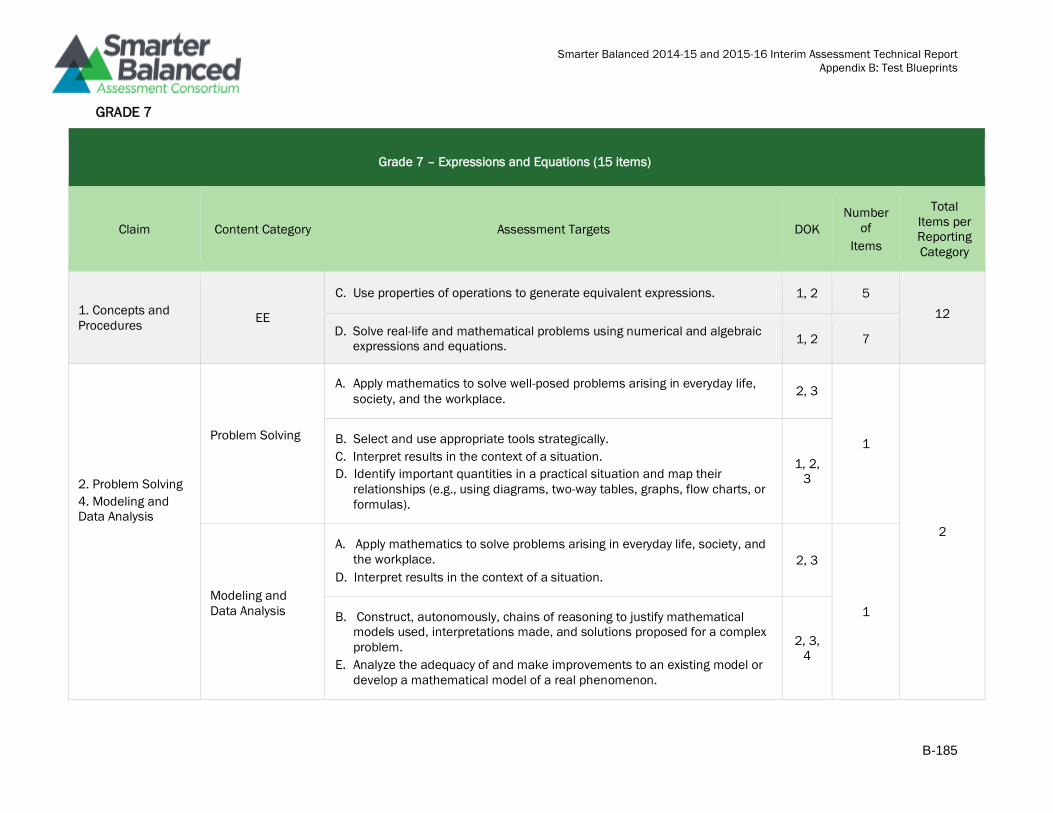
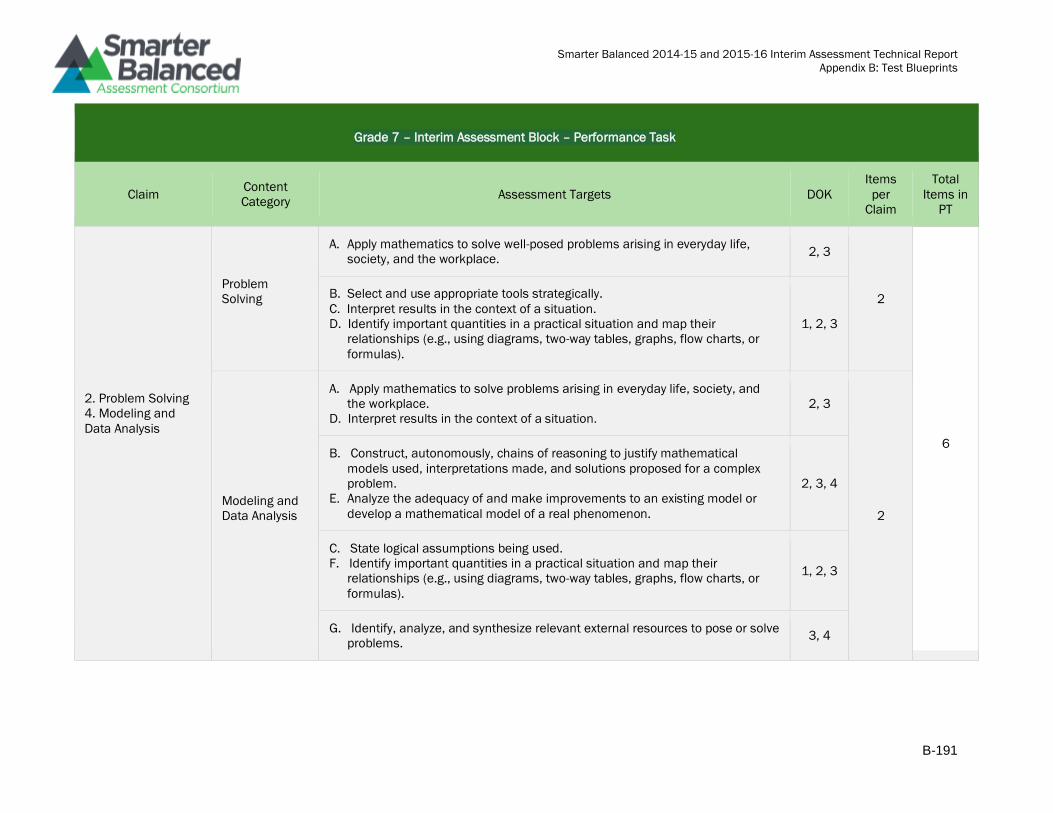
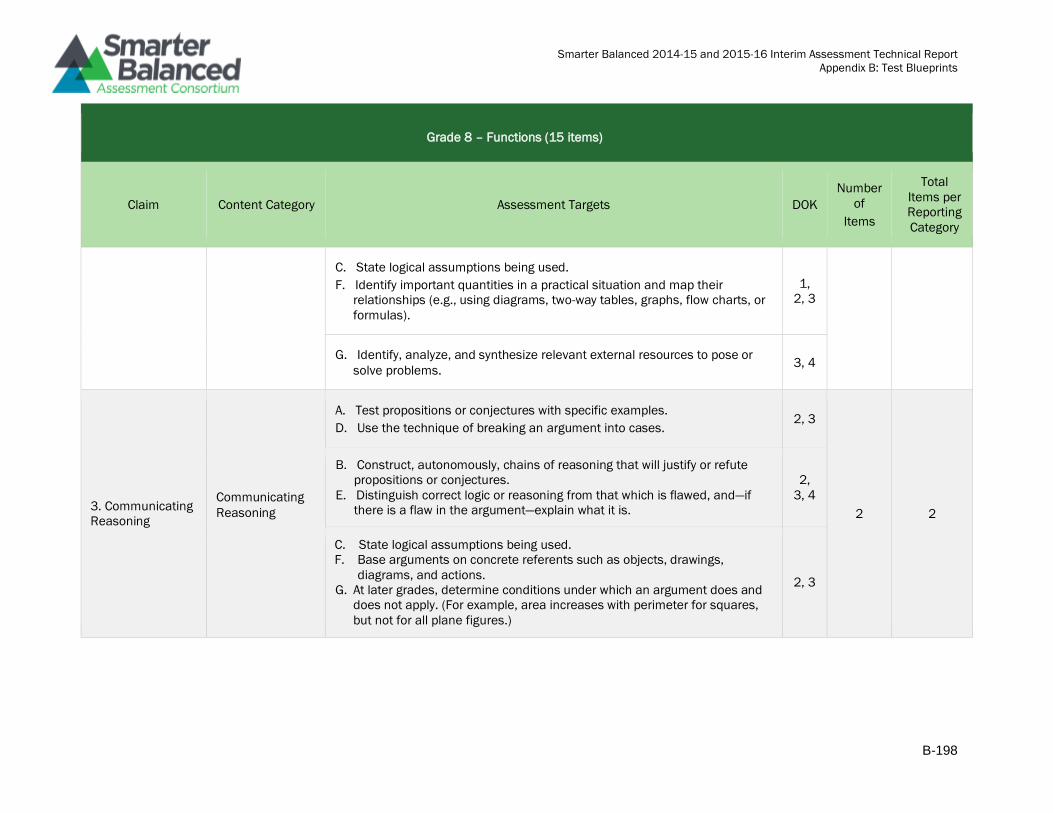
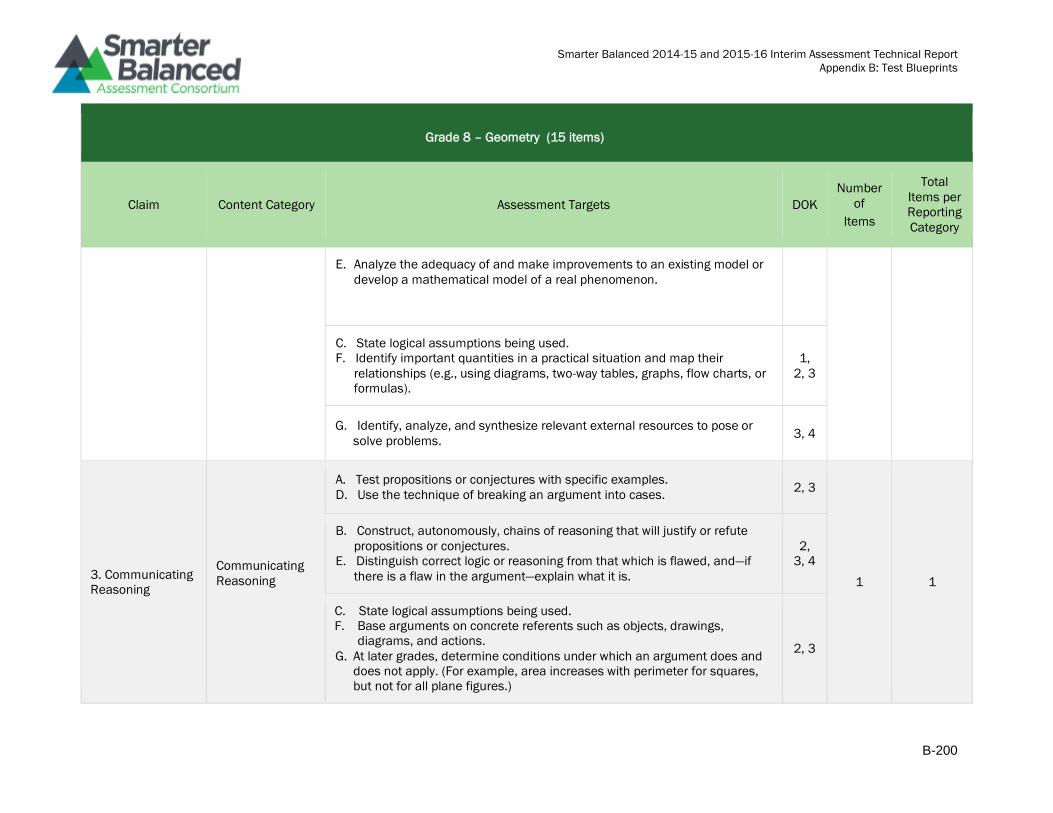
Grade 6 – Ratio and Proportional Relationships (13 items) ......................................................... 4-9
Non-Performance Task and Performance Task Test Components ................................................. 4-10
Item and Task Development .............................................................................................................. 4-10
Item and Task Specifications ......................................................................................................... 4-10
Performance Task Design .............................................................................................................. 4-11
Interim Assessment Blocks based on performance tasks alone yield an indicator of Below
Standard, At or Near Standard or Above Standard. ..................................................................... 4-13
The Item/task Pool Specification .................................................................................................. 4-13
Item Writing ..................................................................................................................................... 4-13
Item Reviews ................................................................................................................................... 4-15
Page 4
Smarter Balanced 2014-15 and 2015-16 Interim Assessment Technical Report
Introduction
iii
Field Testing .................................................................................................................................... 4-15
Item Scoring ........................................................................................................................................ 4-15
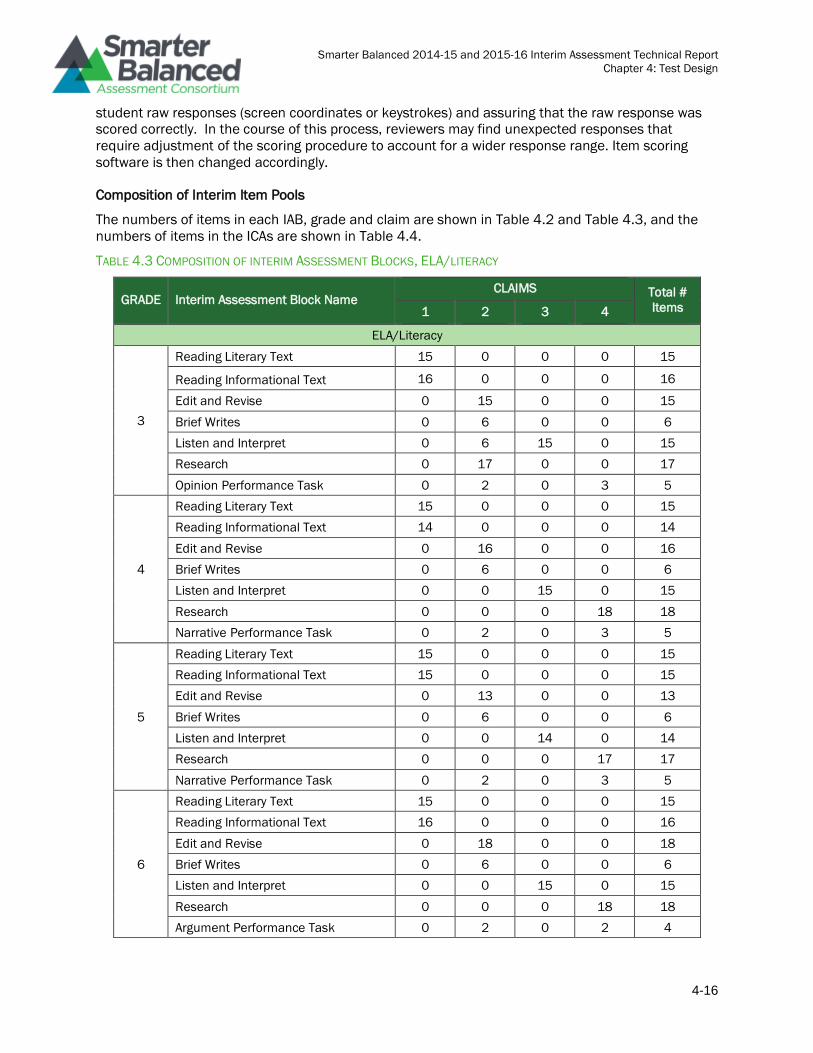
Composition of Interim Item Pools .................................................................................................... 4-16
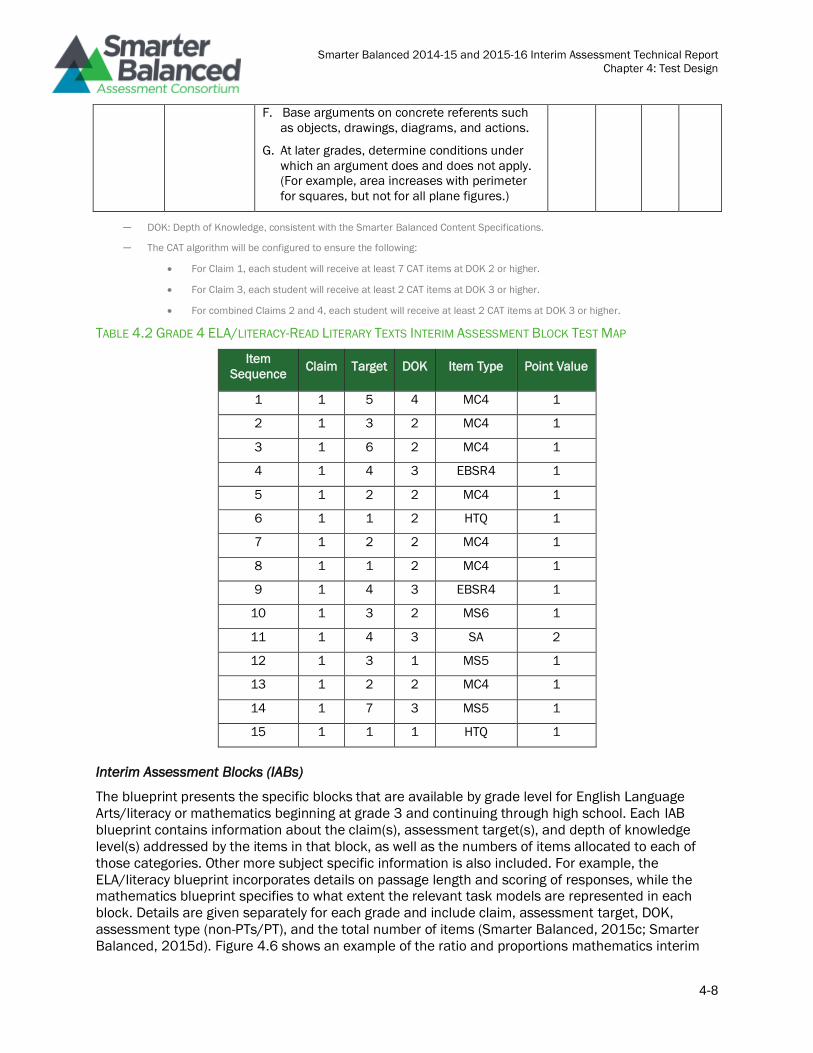
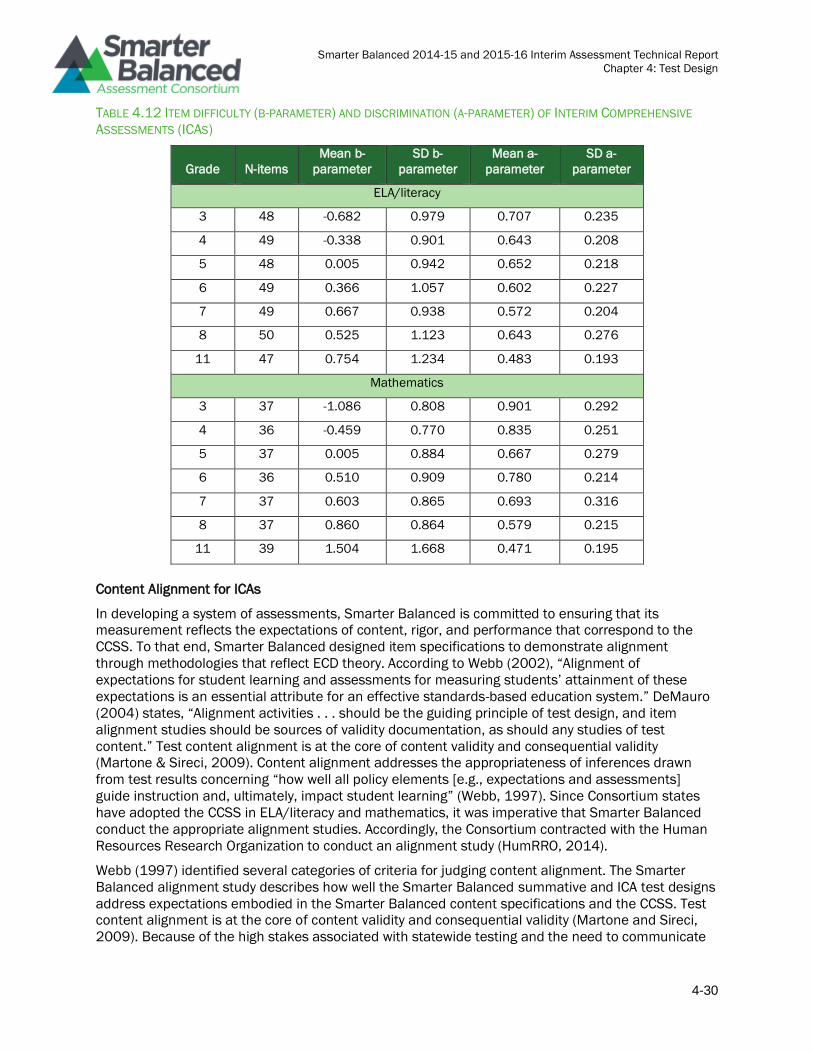
Content Alignment for ICAs ................................................................................................................ 4-31
IAB Test Design ................................................................................................................................... 4-32
Summary of Test Design .................................................................................................................... 4-32
References .......................................................................................................................................... 4-33
Chapter 5 : Test Administration ............................................................................................................... 5-1
Introduction ........................................................................................................................................... 5-2
Test Administration ............................................................................................................................... 5-2
Session Time ..................................................................................................................................... 5-3
Test Administration Manual ................................................................................................................. 5-3
Clear Directions to Ensure Uniform Administration ........................................................................ 5-4
Detailed Instructions for Test Takers .............................................................................................. 5-4
Responsibilities of Test Administrators ........................................................................................... 5-4
Tools, Designated Supports, and Accommodations ....................................................................... 5-5
References ............................................................................................................................................ 5-7
Chapter 6 : Reporting and Interpretation ................................................................................................ 6-1
Introduction ........................................................................................................................................... 6-2
Overall Test Scores ............................................................................................................................... 6-2
Sub-scores and IABs ............................................................................................................................. 6-3
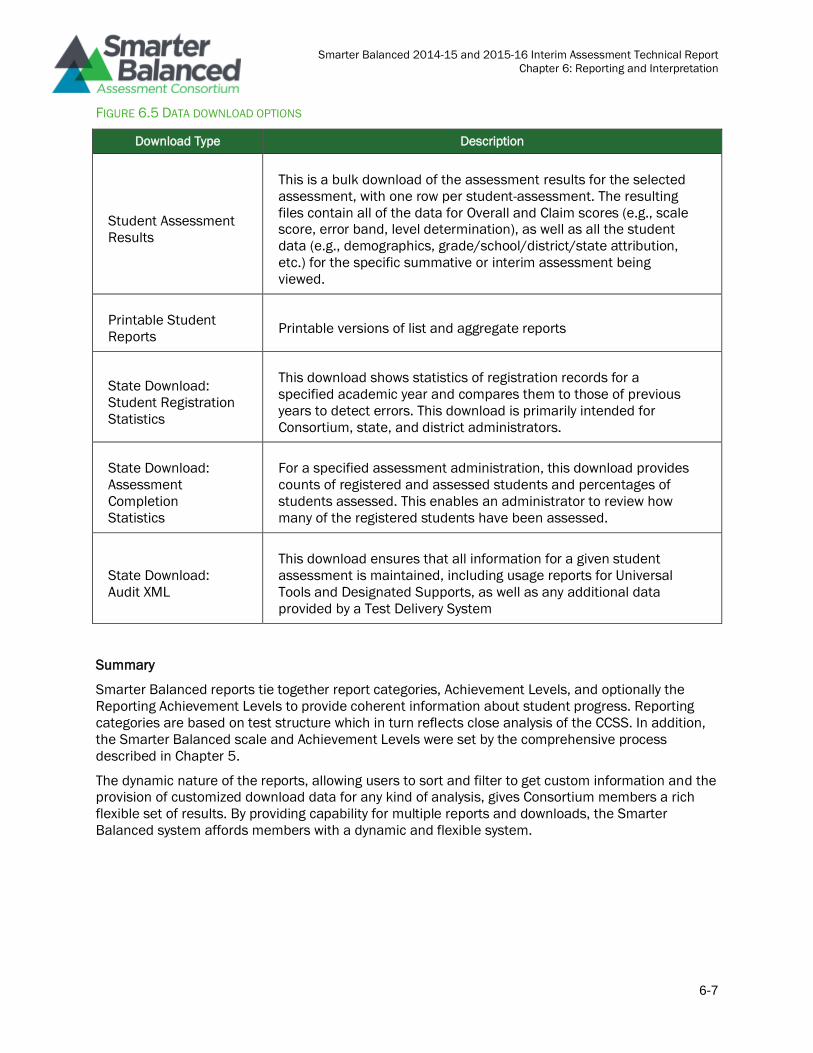
Types of Reports ................................................................................................................................... 6-5
Individual Student Report (ISR) ....................................................................................................... 6-5
Data Downloads .................................................................................................................................... 6-6
Summary ............................................................................................................................................... 6-7
References ............................................................................................................................................ 6-8
Page 5
Smarter Balanced 2014-15 and 2015-16 Interim Assessment Technical Report
Introduction
iv
Introduction and Overview
Overview
The Smarter Balanced Assessment Consortium’s (Smarter Balanced) Assessment System includes a
set of balanced components designed to meet diverse student needs for all Consortium members.
This system provides valid, reliable, and fair assessments of the deep disciplinary understanding and
higher-order thinking skills increasingly demanded by a knowledge-based global economy. The
system is based on the belief that assessment must support ongoing improvements in instruction
and learning experiences for students that lead to outcomes valued by all stakeholders. Smarter
Balanced supports the goals of its members who seek to ensure that all students leave high school
prepared for postsecondary success in college or a career through a planned sequence of
educational experiences and opportunities. The system was grounded in the strong foundational
assessments, policies and procedures of its members including supports and resources from
institutions of higher education (IHEs) and workplace representatives. The Consortium expanded on
these proven successes to create a high quality, balanced, multistate assessment system based on
the Common Core State Standards (CCSS) in English language arts/literacy (ELA/literacy) and
mathematics. The intent of this report is to provide evidence in support of the validity of the Smarter
Balanced interim assessments. This report focuses on both interim assessment types—the interim
comprehensive assessments (ICAs) and the interim assessment blocks (IABs). Information about the
overall system is provided for context.
The Consortium staff provide expert guidance and facilitate member driven decisions regarding the
maintenance and enhancement of the system as required to fulfill its mission to improve teaching
and learning. Smarter Balanced members retain flexibility regarding how to customize the system so
that it may best be used as part of their approach to improving their local educational systems. The
Smarter Balanced assessment system strategically uses a variety of item types including
performance tasks to measure the full range of the CCSS. The Consortium also deploys essential
accessibility resources that are embedded in the test to ensure fair and accurate assessment of all
students, including students with disabilities, English language learners, and low- and high-
performing students. Smarter Balanced implemented a system that features
• Summative assessments that determine students’ progress toward college and career readiness
in ELA/literacy and mathematics. The summative assessments are given at the end of the school
year and consist of two parts: a computer adaptive test and a performance task. These secure
summative assessments incorporate a variety of item types including technology-enhanced
items, items that require constructed response and performance tasks. Items are deliberatively
designed to measure specific content. The assessments include writing at every grade and ask
students to solve multi-step, real world problems in mathematics.
• Interim assessments that allow teachers to check student progress throughout the year,
providing them information that they can use to improve instruction and help students meet the
challenge of college- and career-ready standards. These tools are used at the discretion of
schools and districts, and teachers can employ them to check students’ progress at mastering
specific concepts at strategic points during the school year. There are two types of interim
assessments: the interim comprehensive assessments (ICAs) that test the same content and
report scores on the same scale as the summative assessment and the interim assessment
blocks (IABs) that focus on smaller sets of related concepts and provide more detailed
information for instructional purposes. The interim assessments incorporate items that are
developed along with and according to the same processes as the items in the summative
assessment. This means that items are not identified as intended for use on the interim or
Page 6
Smarter Balanced 2014-15 and 2015-16 Interim Assessment Technical Report
Introduction
v
summative assessments during the item development process. The interim assessments provide
more flexible administration options to assist educations in determining what students know and
can do in relation to the CCSS. In contrast to the summative assessment, these interim
assessments are only available in fixed form.
• A digital library that is an online collection of high-quality instructional and professional learning
resources contributed by educators for educators. These resources are aligned with the intent of
the CCSS and help educators implement the formative assessment process to improve teaching
and learning. Educators can use the materials to engage in professional learning communities,
differentiate instruction for diverse learners, engage students in their own learning, improve
assessment literacy, and design professional development opportunities. The Digital Library also
incorporates features to provide educators opportunities to comment on and rate resources and
share their expertise with colleagues across the country in online discussion forums.
• Open sourced technology that members can use to deliver assessments and report results to
educators, parents and students.
• Cross-member communications to inform stakeholders about Smarter Balanced activities and to
ensure a common focus on the goal of college- and career-readiness for all students.
The innovative and efficient use of technology serves as a central feature of this balanced
assessment system. Some central notions concerning technology use are:
1. the Smarter Balanced system uses computer adaptive testing to increase the precision and
efficiency of the summative tests,
2. the expanded use of technology enables the development of innovative and realistic item
types that measure student achievement across a wide performance continuum providing
opportunities for educator and administrator professional development and local capacity
building, and
3. through the use of an interoperable electronic platform and leveraging of cross-member
state resources, Smarter Balanced delivers assessments and produces standardized reports
that are cost effective, timely, and useful for a range of audiences in tracking and analyzing
student progress toward college- and career-readiness at the individual student, student
subgroup, classroom, school, district, and state levels.
In summary, the Smarter Balanced learning and assessment system is grounded in a sound theory
of action. This system promotes research-supported classroom practice and incorporates a balanced
set of technology-enabled tools, innovative assessments, and classroom support materials intended
to work coherently to facilitate teaching and learning.
Technical Report Approach
The intent of this report is to provide evidence in support of the validity of the Smarter Balanced
interim assessments. This report focuses on both interim test types—the interim comprehensive
assessments (ICAs) and the interim assessment blocks (IABs). Information about the overall system
is provided for context. At the outset, it should be recognized that demonstration of validity is an
ongoing process. Validity evidence provided here refers to initial pilot and field test phases as
needed.
Members do not provide response data or scores to the Consortium for analysis. Consequently,
much of the evidence here focuses on the development of test items and characteristics of test
forms. Interim tests, as noted above, are not secure. They may be administered in a standard
manner or teachers may use interim items or tasks as a basis for class discussion or individual
Page 7
Smarter Balanced 2014-15 and 2015-16 Interim Assessment Technical Report
Introduction
vi
feedback. The interim assessments may be administered to the same students several times during
the year. Evidence of reliability holds only for tests administered the first time in a standardized
setting, assuming that students have not been exposed to the items and each student does his or
her own work. When teachers use interim items or tasks as a basis for class discussion or individual
feedback, information does not have the same properties of generalizability or relationship to the
scale.
In some cases (e.g., the Online Test Administration Manual), the Consortium provides a
customizable template or a guidance document, that allows members to document their test
administration practices.
To inform the Consortium, the Standards for Educational and Psychological Testing (American
Educational Research Association [AERA], American Psychological Association [APA], & National
Council on Measurement in Education [NCME], 2014), hereafter referred to as the Standards, was
used as the foundation for developing the necessary validity evidence. With respect to Smarter
Balanced, this information is necessary for understanding the degree to which the Consortium is
meeting its goals, and in some cases, what further tasks remain to improve the system as it evolves
operationally.
Overview and Background of the Smarter Balanced Theory of Action
The Smarter Balanced Assessment Consortium supports the development and implementation of
learning and assessment systems that reshape education in member states to improve student
outcomes. Through expanded use of technology and targeted professional development, the Theory
of Action calls for the integration of learning and assessment systems, leading to more informed
decision-making and higher-quality instruction and ultimately increasing the number of students who
are well prepared for college and careers.
The ultimate goal of Smarter Balanced is to ensure that all students leave high school prepared for
postsecondary success in college or a career as a result of increased student learning and improved
teaching. This approach suggests that enhanced learning will result when high-quality assessments
support ongoing improvements in instruction and learning. A quality assessment system strategically
“balances” summative, interim, and formative components (Darling-Hammond & Pecheone, 2010).
An assessment system must provide valid measurement across the full range of performance on
common academic content, including assessment of deep disciplinary understanding and higher-
order thinking skills increasingly demanded by a knowledge-based economy.
Six Principles of Smarter Balanced Underlying the Theory of Action
The Smarter Balanced assessment system is guided by a set of six principles shared by systems in
high-achieving nations and a number of high-achieving states in the U.S.
1. Assessments are grounded in a thoughtful, standards-based curriculum and managed as
part of an integrated system of standards, curriculum, assessment, instruction, and teacher
development. Curriculum and assessments are organized around a well-defined set of
learning progressions along multiple dimensions within subject areas. Interim assessments
and formative tools and resources are conceptualized in tandem with summative
assessments; all of them are linked to the CCSS and supported by a unified technology
platform.
2. Assessments produce evidence of student performance on challenging tasks that measure
the CCSS. Instruction and assessments seek to teach and evaluate knowledge and skills that
generalize and can transfer to higher education and multiple work domains. These
assessments emphasize deep knowledge of core concepts and ideas within and across the
Page 8
Smarter Balanced 2014-15 and 2015-16 Interim Assessment Technical Report
Introduction
vii
disciplines—along with analysis, synthesis, problem solving, communication, and critical
thinking—thereby requiring a focus on complex performances as well as on specific concepts,
facts, and skills.
3. Teachers are integrally involved in the development and scoring of the assessments. Most
items in the interim assessments are scored via the computer. However, there are some
constructed response items and performance tasks, including the full write, or essay, that
need to be hand-scored. The Smarter Balanced Teacher Hand-scoring System or a member-
designated alternate system allows educators to score student responses using the same
scoring rules as the summative assessment. Smarter Balanced provides hand-scoring
training materials that include rubrics and sample responses to be used by educators who
will score student responses. Hand-scoring is a valuable professional development activity
that provides educators with an understanding of the scoring process and the expectations
for student learning.
4. The development and implementation of the Smarter Balanced assessment system is a
member-led effort with a transparent and inclusive governance structure. Assessments are
structured to improve teaching and learning. Assessments as, of, and for learning are
designed to develop understanding of content standards, what constitutes high-quality work,
to what degree is growth occurring, and what is needed for further student learning.
5. Assessment, reporting, and accountability systems provide useful information on multiple
measures that is educative for all stakeholders. Reporting of assessment results is timely
and meaningful—offering specific information about areas of performance so that teachers
can follow up with targeted instruction, students can better target their own efforts, and
administrators and policymakers can fully understand what students know and can do—in
order to guide curriculum and professional development decisions.
6. Design and implementation strategies adhere to established professional standards. The
development of an integrated, balanced assessment system is an enormous undertaking,
requiring commitment to established quality standards in order for the system to be credible,
fair, and technically sound. Smarter Balanced continues to be committed to developing an
assessment system that meets critical elements required by the U.S. Department of
Education peer review process relying heavily on the Standards as its core resource for
quality design.
Page 9
Smarter Balanced 2014-15 and 2015-16 Interim Assessment Technical Report
Introduction
viii
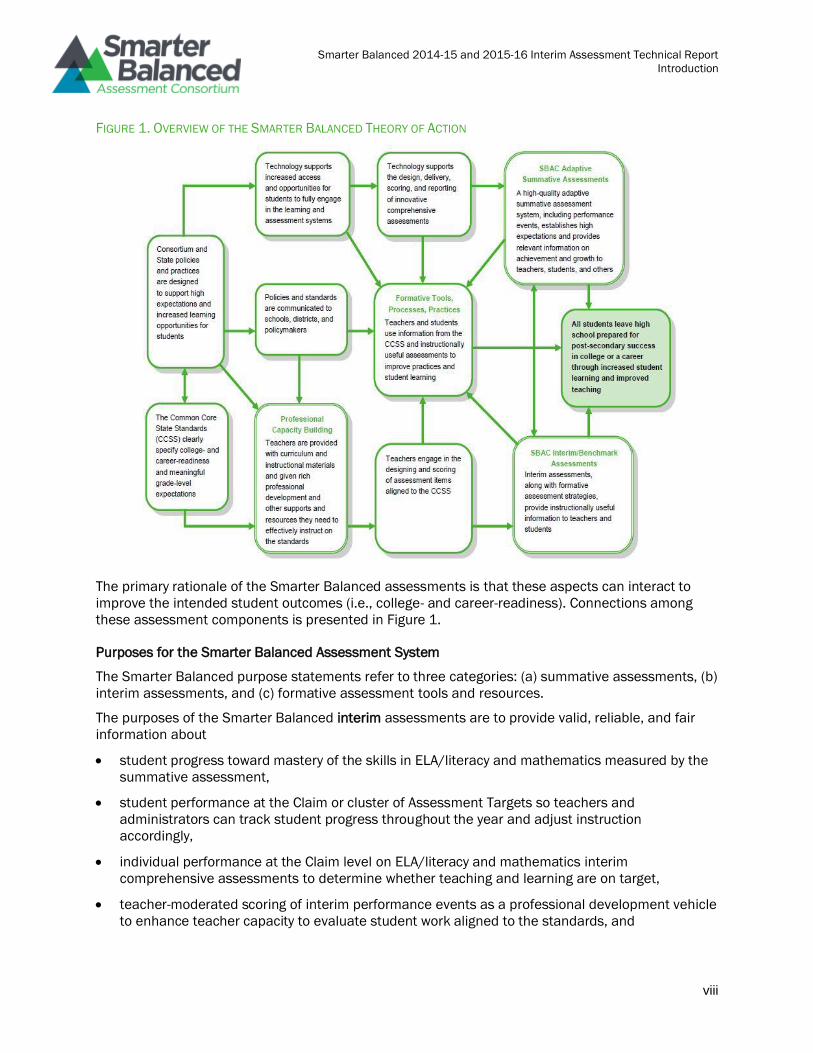
FIGURE 1. OVERVIEW OF THE SMARTER BALANCED THEORY OF ACTION
The primary rationale of the Smarter Balanced assessments is that these aspects can interact to
improve the intended student outcomes (i.e., college- and career-readiness). Connections among
these assessment components is presented in Figure 1.
Purposes for the Smarter Balanced Assessment System
The Smarter Balanced purpose statements refer to three categories: (a) summative assessments, (b)
interim assessments, and (c) formative assessment tools and resources.
The purposes of the Smarter Balanced interim assessments are to provide valid, reliable, and fair
information about
• student progress toward mastery of the skills in ELA/literacy and mathematics measured by the
summative assessment,
• student performance at the Claim or cluster of Assessment Targets so teachers and
administrators can track student progress throughout the year and adjust instruction
accordingly,
• individual performance at the Claim level on ELA/literacy and mathematics interim
comprehensive assessments to determine whether teaching and learning are on target,
• teacher-moderated scoring of interim performance events as a professional development vehicle
to enhance teacher capacity to evaluate student work aligned to the standards, and
Page 10
Smarter Balanced 2014-15 and 2015-16 Interim Assessment Technical Report
Introduction
ix
• student progress toward the mastery of skills measured in ELA/literacy and mathematics across
all students and subgroups.
• the learning targets are and what constitutes adequate performance against those targets.
This report provides technical information about the interim assessments, but the purposes of the
summative assessments and formative tools and resources are given here to provide context for
interim assessments as a component of the assessment system.
The purposes of the Smarter Balanced summative assessments are to provide valid, reliable, and
fair information about
• students’ ELA/literacy and mathematics achievement with respect to those CCSS measured by
the ELA/literacy and mathematics summative assessments in grades 3 to 8 and high school,
• whether students in grades 3-8 have demonstrated adequate academic achievement in
ELA/literacy and mathematics for success in the next grade level,
• whether students in grade 11 have demonstrated adequate academic achievement in
ELA/literacy and mathematics for college given continued learning in grade 12,
• students’ annual progress toward college- and career-readiness in ELA/literacy and
mathematics,
• how instruction can be improved at the classroom, school, district, and state levels,
• students’ proficiency in ELA/literacy and mathematics for federal accountability purposes and
potentially for state and local accountability systems, and
• students’ achievement in ELA/literacy and mathematics that is equitable for all students and
subgroups of students.
The purposes of the Smarter Balanced Digital Library are to provide formative tools and resources to
• improve teaching and learning,
• provide resources to teachers to help them monitor their students’ progress throughout the
school year,
• illustrate how teachers and other educators can use assessment data to engage students in
monitoring their own learning,
• help teachers and other educators align instruction, curricula, and assessments,
• assist teachers and other educators in using the summative and interim assessments to improve
instruction at the individual and classroom levels, and
• offer professional development and resources for how to use assessment information to improve
teacher decision-making in the classroom.
Overview of Report Chapters:
The structure of the Interim Assessment Technical Report follows that of the summative. As such,
chapters in the Technical Report follow elements in the Standards (AERA, APA, & NCME, 2014):
Page 11
Smarter Balanced 2014-15 and 2015-16 Interim Assessment Technical Report
Introduction
x
CH# Chapter title
1 Validity
2 Reliability/Precision and Error of Measurement
3 Test Fairness
4 Test Design
5 Test Administration
6 Reporting and Interpretation
Brief synopses of the chapters contained in this Interim Assessment Technical Report are given
below in order to direct further review. At the suggestion of our members, we have written practical
descriptions of the purpose of evidence in each chapter to provide context for teachers, parents and
other stakeholders.
Chapter 1: Validity
Validity evidence is provided throughout this technical report. This chapter on validity provides
information about test purposes and the overall approach to showing how scores are appropriate for
those purposes.
Description: This chapter provides information to answer the following questions. For what
purposes were the interim assessments designed to be used? What evidence shows that test scores
are appropriate for these uses? What are the intended test score interpretations for specific uses?
Content: Chapter 1 provides the statement of test purposes; valid score uses and
interpretations; outline of validity evidence in this report.
Chapter 2: Reliability/Precision and Error of Measurement
Information about performance of the test in delivering scores is provided in this chapter. The degree
of accuracy and precision of scores contributes to evidence about appropriate test score
interpretation and use. Academic decisions about students must be made with full knowledge of
measurement error and reliability.
Description: How do we know that scores are accurate? What kind of instructional decisions
does precision support? How do we know they are stable and have the same meaning for all
students?
Content: Chapter 2 presents test form standard errors of measurement, marginal reliability,
and test information curves.
Chapter 3: Test Fairness
Test fairness of the interim assessments concerns whether score interpretations are valid and
minimize construct irrelevant variance for all relevant subgroups. The evidence for test fairness of
Page 12
Smarter Balanced 2014-15 and 2015-16 Interim Assessment Technical Report
Introduction
xi
the interim assessments is based on the Smarter Balanced accessibility framework and on item
development processes. All interim assessment items are fully accessible.
Description: How do we know that the interim assessments are fair for all students? How was
fairness guaranteed in developing test items and tasks? How is the test administered so that each
student can demonstrate his or her skills?
Content: Chapter 3 presents the Smarter Balanced Conceptual Framework for Usability,
Accessibility, and Accommodations, bias and sensitivity reviews conducted during item and task
development and differential item functioning (DIF) analyses.
Chapter 4: Test Design
This chapter provides information pertaining to the content validity of the Smarter Balanced interim
assessment system. It describes how tasks and items are structured to achieve desired domain
coverage. For Smarter Balanced ICAs and IABs, test design includes the relationship of claims and
targets to the underlying CCSS.
Description: What's on the test? Is it consistent with stated test purposes?
Content: Chapter 4 provides evidence that the assessments address knowledge and skills
required for college and career readiness. It also describes test structure (claims, targets) and its
relationship to the CCSS, item and task development and alignment studies. Chapter 4 also has
information about the operational blueprints and test scoring method.
Chapter 5: Test Administration
Part of test validity rests on the assumption that interim assessments are administered in a manner
that supports the inferences and comparisons educators make from test scores. Because Smarter
Balanced interim assessments are administered on a large scale, in different policy and operational
contexts, the Consortium provides a common administration manual template that members
customize for specific use.
Description: What are the conditions for test administration to assure that every student was
afforded the same chance for success? How was the test administered to allow for accessibility for
all students? Was the test administration secure or non-secure? Do test records show that the test
was administered as intended?
Content: Chapter 6 describes the customizable Smarter Balanced Online Test Administration
Manual. The interim assessments may be administered at multiple points throughout the school
year and are available in grades 3–8 and high school; however, schools may administer individual
assessments at any grade level.
Chapter 6: Reporting and Interpretation
Examples of Smarter Balanced reports are provided, along with an explanation of report elements.
This chapter discusses intended uses of report information.
Description: What information do Smarter Balanced reports of the interim assessments
contain? What do scores mean? How can the reports best be used by teachers and parents?
Content: Chapter 7 provides examples of the Smarter Balanced suite of reports and
interpretive information.
Page 13
Smarter Balanced 2014-15 and 2015-16 Interim Assessment Technical Report
Introduction
xii
Acknowledgments
Outside Groups and Organizations that Collaborated with the Smarter Balanced Assessment
Consortium
Below is a partial list of individuals and groups that contributed time and expertise to the work of the
Consortium.
2014-15 Technical Advisory Committee
• Jamal Abedi, Ph.D. UC Davis/CRESST
• Randy Bennett, Ph.D. ETS
• Derek C. Briggs, Ph.D. University of Colorado
• Gregory J. Cizek, Ph.D. University of North Carolina
• David T. Conley, Ph.D. University of Oregon
• Linda Darling-Hammond, Ph.D. Stanford University
• Brian Gong, Ph.D. The Center for Assessment
• Edward Haertel, Ph.D. Stanford University
• Joan Herman, Ph.D. UCLA/CRESST
• G. Gage Kingsbury, Ph.D. Psychometric Consultant
• James W. Pellegrino, Ph.D. University of Illinois, Chicago
• W. James Popham, Ph.D. UCLA, Emeritus
• Joseph Ryan, Ph.D. Arizona State University
• Martha Thurlow, Ph.D. University of Minnesota/NCEO
2015-16 Technical Advisory Committee
• Randy Bennett, Ph.D. ETS
• Derek C. Briggs, Ph.D. University of Colorado
• Gregory J. Cizek, Ph.D. University of North Carolina
• David T. Conley, Ph.D. University of Oregon
• Kadriye Ercikan Ph.D. The University of British Columbia
• Brian Gong, Ph.D. The Center for Assessment
• Edward Haertel, Ph.D. Stanford University
• Linda Darling-Hammond, Ph.D. Stanford University
• G. Gage Kingsbury, Ph.D. Psychometric Consultant
• Joseph Martineau Ph.D. National Center for the Improvement of Educational Assessment
• William G. McCallum, Ph.D. The University of Arizona
• Sandra Murphy Ph.D. The University of California, Davis
Page 14
Smarter Balanced 2014-15 and 2015-16 Interim Assessment Technical Report
Introduction
xiii
• James W. Pellegrino, Ph.D. University of Illinois, Chicago
• W. James Popham, Ph.D. UCLA, Emeritus
• Joseph Ryan, Ph.D. Arizona State University
• Martha Thurlow, Ph.D. University of Minnesota/NCEO
• Joseph Willhoft, Ph.D. Educational Consultant
• Gerunda Hughes Ph.D. Howard University
• Guillermo Solano-Flores Ph.D. Stanford University
Contributors to the Accessibility Accommodations Framework.
In February 2012, the Smarter Balanced Assessment Consortium Accessibility and Accommodations
Work Group began work on developing the Accessibility and Accommodations Framework. The
primary goal of this effort was to develop uniform accessibility and accommodation policies and
guidelines to be adopted and used by all Smarter Balanced members. Recognizing the diversity in
policies and practices that currently exist across member states, the legal issues that must be
addressed by the policies, the mixed research findings regarding many accommodation practices,
and the differences in opinion regarding accommodation policies, the work group undertook an
iterative process designed to gather input from a large and diverse audience. This effort began by
contracting with Measured Progress and its partners, who included:
• Members of the Measured Progress Innovation Lab who conducted work in accessibility in digital
environments, developed the Accessible Test Design model, and were leaders in developing the
Accessible Portable Item Protocol (APIP) Standard,
• Experts at Educational Testing Service who have conducted a variety of studies on test
accommodations and accessibility for students with disabilities and for students who are English
language learners, and who have developed industry-recognized guidelines for accessibility in
the context of assessment,
• Experts at the George Washington University Center for Equity and Excellence in Education, who
are nationally recognized experts in accessible assessment for students who are English
language learners and who have worked with several states to develop policies on test
accommodations for students who are English language learners, and
• Experts affiliated with the National Center on Educational Outcomes who have conducted
extensive reviews of state test accommodation policies, worked with the Assessing Special
Education Students (ASES) work group of the Council of Chief State School Officers (CCSSO) to
develop test accommodation policies, and closely monitored research on test accommodations.
In addition to these partners, an expert panel was formed composed of the following members:
• Jamal Abedi assessment of English language learners, UC Davis/CRESST,
• Martha Thurlow assessment of students with disabilities, University of
Minnesota/NCEO,
• Sheryl Lazarus test accommodations for students with disabilities, University of
Minnesota/NCEO,
• Stephanie Cawthon accommodations for students who communicate in American Sign
Language, University of Texas at Austin,
Page 15
Smarter Balanced 2014-15 and 2015-16 Interim Assessment Technical Report
Introduction
xiv
• Richard Jackson accommodations for students with visual impairments, Boston
College,
• Rebecca Kopriva assessment of students who are English language learners,
Wisconsin Center for Education Research, and
• Stephen Sireci validity of test accommodations, University of Massachusetts
Amherst/CEA.
Other Acknowledgments.
This technical report leveraged the Smarter Balanced Comprehensive Research Agenda by Stephen
G. Sireci (2012) as the primary validity framework and sources of evidence. The Smarter Balanced
Technical Advisory Committee provided input on critical aspects of the interim assessments and this
report.
Page 16
Smarter Balanced 2014-15 and 2015-16 Interim Assessment Technical Report
Introduction
xv
References
American Educational Research Association, American Psychological Association, & National Council
on Measurement in Education. (2014). Standards for Educational and Psychological
Testing. Washington, D.C.: American Educational Research Association.
Darling‐Hammond, L., & Pecheone, R. (2010). Developing an Internationally Comparable Balanced
Assessment System that Supports High‐Quality Learning. Retrieved from
https://www.ets.org/Media/Research/pdf/Darling-HammondPechoneSystemModel.pdf
Smarter Balanced Assessment Consortium (2010, June 23). Race to the top assessment program
application for new grants: Comprehensive assessment systems. CFDA Number: 84.395B.
OMB Control Number 1810-0699. Retrieved from
http://www.smarterbalanced.org/assessments/development/additional-technical-
documentation/
U.S. Department of Education (2015, September). Peer review of state assessment systems non-
regulatory guidance for states for meeting requirements of the Elementary and Secondary
Education Act of 1965. Washington, DC: Author.
Sireci, S. G. (2012). Smarter Balanced Assessment Consortium: Comprehensive research agenda.
Los Angeles, CA: Smarter Balanced Assessment Consortium. Retrieved from
http://www.smarterbalanced.org/assessments/development/additional-technical-
documentation/
Page 17
Smarter Balanced 2014-15 and 2015-16 Interim Assessment Technical Report
Chapter 1: Validity
1-1
Chapter 1: Validity
Page 18
Smarter Balanced 2014-15 and 2015-16 Interim Assessment Technical Report
Chapter 1: Validity
1-2
Introduction
Validity refers to the degree to which a specific interpretation or use of a test score is supported by
the accumulated evidence (AERA, APA, & NCME, 2014; ETS, 2002). Validity is the central notion
underlying the development, administration, and scoring of a test and the uses and interpretations
of test scores.
Validation is the process of accumulating evidence to support each proposed score interpretation or
use. This validation process does not rely on a single study or gathering one type of evidence. Rather,
validation involves multiple investigations and different kinds of supporting evidence (AERA, APA, &
NCME, 2014; Cronbach, 1971; ETS, 2002; Kane, 2006). It begins with test design and is implicit
throughout the assessment process, which includes development, field-testing and analyses of
items, test scaling and linking, scoring, and reporting.
This chapter provides an evaluative framework for the validation of the Smarter Balanced interim
assessment. Validity evidence for the interim assessments overlaps substantially with the validity
evidence for the summative assessments. The reader will be pointed to supporting evidence in other
parts of the technical report and other sources that seek to demonstrate that the Smarter Balanced
Assessment System adheres to guidelines for fair and high quality assessment.
The validity argument begins with a statement of interim assessment intended purposes, followed by
the evidentiary framework supporting the validity argument. Evidence is organized around the
principles in the AERA, APA, and NCME’s Standards for Educational and Psychological Testing
(2014), hereafter referred to as the Standards, and the Smarter Balanced Assessment Consortium:
Comprehensive Research Agenda (Sireci, 2012).
The Standards are considered to be “the most authoritative statement of professional consensus
regarding the development and evaluation of educational and psychological tests” (Linn, 2006, p.
27) currently available. The 2014 Standards differ from earlier versions in the emphasis given to the
increased prominence of technology in testing, including computer adaptive testing (CAT). Sireci
based the work on the research agenda on the Standards and his work in operational interpretation
of validity argumentation (Sireci, 2013).
Purposes of the Smarter Balanced System for Interim Assessments
To derive the statements of purpose listed below, panels consisting of Smarter Balanced leadership,
including the Executive Director, Smarter Balanced staff, Dr. Stephen Sireci and key personnel from
Consortium states were convened. There are two types of interim assessments, each with different
purposes. These assessments are the Interim Comprehensive Assessments (ICAs) and the Interim
Assessment Blocks (IABs). The ICAs use the same blueprints as the summative assessments and
assess the same standards. When administered under standard conditions, the ICAs deliver a valid
overall score and associated error and an indicator of performance at the claim level. Unlike the
summative tests, ICAs are fixed form. The IABs focus on smaller sets of targets associated with an
instructional block or unit. They are short fixed-form tests that can be used more flexibly to support
instruction. Importantly, items on the ICAs and IABs are not initially identified as items for the interim
assessment and are instead chosen from a general pool of items that have been treated identically
in development,
Interim assessments can be used in a variety of ways. They can be administered under standard
conditions, as described in the Smarter Balanced Test Administration Manual. They can also be
administered repeatedly to a class or individual. In addition, they may be used as a basis for class
discussion or feedback at the item level. Information about the reliability and meaning of scores
applies only to the first time a test is administered under standard conditions. Subsequent
Page 19
Smarter Balanced 2014-15 and 2015-16 Interim Assessment Technical Report
Chapter 1: Validity
1-3
administrations, or results from collaborating with a class or teacher alter the interpretation of
results. The purposes below apply to the initial standard test administration.
The purposes of the Smarter Balanced interim assessments are to provide valid, reliable, and fair
information about:
1. Student progress toward mastery of the skills measured in ELA/literacy and mathematics by
the summative assessments.
2. Students’ performance at the content cluster level, so that teachers and administrators can
adjust instruction accordingly.
3. Individual and group (e.g., school, district) performance at the claim level in ELA/literacy and
mathematics, to determine whether teaching and learning are on target.
4. Student progress toward the mastery of skills measured in ELA/literacy and mathematics
across all students and subgroups of students.
Summary of Validity Argument
The crux of the argument presented here is that the technical quality of the interim assessments
supports these purposes. The Common Core State Standards (CCSS) are widely recognized content
standards for college and career readiness in high school grades, and for being on track for college
and career readiness in lower grades (Conley et al 2011). Content specifications and test blueprints
show that the Smarter Balanced ICAs cover the breadth and depth of assessable standards. The
assessments contain expanded item types that allow response processes designed to elicit a wide
range of skills and knowledge. IABs are designed to deliver information suitable for informing
instructional decisions when combined with other information. IAB and ICA score reports indicate
directions for gaining further instructional information through classroom assessment and
observation.
Smarter Balanced scale and cut score development
The Consortium chose its psychometric model after investigating a variety of models and
establishing a clear structural relationship across grades. The vertical scale was constructed to
provide measurement across grades, facilitating estimates of progress toward career and college
readiness. The appropriateness of Smarter Balanced achievement standards as predictors of college
and career readiness in grade 11 and of being on-track for next grade readiness in grades three
through eight was established by an extended achievement level setting process. The process began
with authoring Achievement Levels and continued through a rigorous process of setting achievement
criteria. These processes involved participants from member higher education systems to ensure
that readiness criteria represented content knowledge and skills needed in college. Further
information about these processes can be found in the 2014-2015 technical manual (Smarter
Balanced Assessment Consortium, 2016), Scoring Specification (Smarter Balanced Assessment
Consortium, 2014a), and the Standard Setting reports (Smarter Balanced Assessment Consortium,
2014b).
This is a high-level view of the validity argument. A detailed description of evidence appears below.
Validity Framework for Interim Assessments
The Standards describe a process of validation that consists of developing a convincing argument,
based on empirical evidence, that the interpretations and actions based on test scores are sound.
Kane (1992, 2006) characterized this process as a validity argument, which is consistent with the
validation process described by the Standards.
Page 20
Smarter Balanced 2014-15 and 2015-16 Interim Assessment Technical Report
Chapter 1: Validity
1-4
A sound validity argument integrates various strands of evidence into a coherent
account of the degree to which existing evidence and theory support the intended
interpretation of test scores for specific uses. Ultimately, the validity of an intended
interpretation of test scores relies on all the available evidence relevant to the
technical quality of a testing system (AERA et al., 2014, p. 21-22).
The validity framework corresponds to validity evidence sources described in the Standards (AERA et
al. 2014, pp. 26-31). They are also the organizing principles for the Smarter Balanced research
framework document (Sireci, 2012). These five sources of validity evidence consist of:
1. Evidence Based on Test Content
2. Evidence Based on Response Processes
3. Evidence Based on Internal Structure
4. Evidence Based on Relations to Other Variables
5. Evidence for Validity and Consequences of Testing.
This Technical Report provides part of the evidence for this framework. As many observers have
noted, validity is an ongoing process with continuous addition of evidence from a variety of
contributors. This report summarizes development and performance of the instrument itself,
addressing test content, response processes and internal structure. Other elements may come from
supplemental research projects or third party studies.
As the Standards note, “validation is the joint responsibility of the test developer and the test user.”
(AERA, et. al. 2014, p, 13). Certain types of validity evidence are not available for the teacher
administered non-secure ICAs and IABs.
In this report, guidelines for administration and use of the interim assessments are documented.
Each Consortium member determines how to use interim assessments. The Consortium provides
information about test content and technical quality and provides guidance to members on
appropriate uses of interim assessment scores.
In many cases, validity evidence will come from an outside auditor or from an external study or will
simply not be available for the teacher administered non-secure ICAs and IABs. Table 1.1 shows the
components of validity covered in this report.
TABLE 1.1 SOURCES OF VALIDITY ELEMENTS
Purpose
Source of Validity Evidence for Interim Assessments
Test
Content
Internal
Structure
Relations to
Other
Variables
Response
Processes
Testing
consequen
ces
1. For Interim Assessment Blocks
(IABs), students’ performance at
the content cluster level, so that
teachers and administrators can
adjust instruction accordingly.
✓ ✓
✓
2. For Interim Comprehensive
Assessments (ICAs), performance
at the claim level in ELA/literacy
and mathematics, to determine
whether teaching and learning
are on target.
✓ ✓
Page 21
Smarter Balanced 2014-15 and 2015-16 Interim Assessment Technical Report
Chapter 1: Validity
1-5
The Smarter Balanced interim assessments differ from the summative assessments in that they are
optional and non-secure. The use of the interim assessments is customizable across users, and the
interim assessments can be administered multiple times within a school year. IABs are designed to
provide information about student performance in a narrowly defined content domain. Many of the
validity elements described for the summative assessments are relevant to the interim assessments
As indicated in Table 1.1, four purpose statements for validation are associated with the interim
assessments.
Interim Assessment Purpose 1:
Provide valid, reliable, and fair information about students’ progress toward mastery of the skills
measured in ELA/literacy and mathematics by the summative assessments.
To support this purpose, validity evidence should confirm that the knowledge and skills being
measured by the interim assessments cover the knowledge and skills measured on the summative
assessments and that the interim assessment scores are on the same scale as those from the
summative assessments. The ICAs cover the depth and breadth of the knowledge and skills
measured on the summative assessments. The IABs are not comprehensive, but rather provide
information about areas of interest within each subject. The interim assessment scores are on the
same scale as those on the summative assessments. As indicated in Table 1.1, the studies providing
this evidence are primarily based on test content, internal structure, and response processes. The
structure of ICAs comes from the Content Specifications documents (Smarter Balanced Assessment
Consortium, 2015a, 2015b), which relate the Smarter Balanced claim and target structure to the
CCSS.
Validity Studies Based on Test Content. The content validity studies conducted for the summative
assessments provide information relevant to the interim assessments. It is important to note that
during the item development process, items were developed without being designated for use on the
interim or summative assessments The ICA blueprint reflects the content coverage and proportions
on the summative test. For IABs, content experts designed blueprints around target groupings most
likely to comprise an instructional unit. IABs provide a general link back to the Smarter Balanced
scale, providing a direction for additional probing with formative feedback. When combined with a
teacher’s knowledge, IAB reports add a valuable component to the full picture of students’
knowledge and skills.
Validity Studies Based on Internal Structure. Scores from the ICAs are on the same scale as those
from the summative assessments, to best measure students’ progress toward mastery of the
knowledge and skills measured on those assessments.
Items on interim assessments are field tested as part of the general pool. They are not identified as
interim items initially, but are chosen from a general pool of items that have been treated identically
in development, field testing and acceptance processes. They meet the same measurement criteria
as items on the summative test. The procedure for field-testing is described in the 2014 and 2015
summative assessment technical reports, which can be accessed on the Smarter Balanced website.
The structure of ICAs follows that of the summative tests, with a nested hierarchical relationship
between claims and targets and some global constraints applied at the test or claim level. IAB
designs are based on expected instructional groupings as shown in IAB blueprints.
Also under the realm of internal structure is evidence regarding the reliability or measurement
precision of scores from the interim assessments. Less measurement precision relative to that of the
summative assessments is tolerable because (a) the stakes are lower, (b) there are multiple
assessments, (c) these assessments supplement the summative assessments and (d) results are
combined with formative information when used instructionally. This report provides the reliabilities
Page 22
Smarter Balanced 2014-15 and 2015-16 Interim Assessment Technical Report
Chapter 1: Validity
1-6
and errors of measurement (see Chapter 2) associated with ICA scores reported from the interim
assessments so that they can be properly interpreted.
The Consortium does not collect raw or scored data from interim assessments, so only the properties
of test forms are analyzed.
Smarter Balanced provides training and validity papers for all items requiring hand scoring.
Validity Studies Based on Response Processes. Interim Assessment Purpose 1 relates to skills
measured on the summative assessments, and so the validity studies based on response processes
that were described for the summative assessments are relevant here to confirm that the items are
measuring higher-order skills.
Interim Assessment Purpose 2:
Provide valid, reliable, and fair information about students’ performance at the content
cluster level, so that teachers and administrators can track student progress throughout the
year and adjust instruction accordingly
As shown in Table 1.1, validity evidence to support this purpose of the interim assessments relies on
studies of test content, internal structure, and testing consequences.
Validity Studies Based on Test Content. An independent alignment study was conducted by
HumRRO. The goal of this study was to gather comprehensive evidence about the alignment of the
Smarter Balanced summative assessments to the CCSS. Note that this alignment study also pertains
to the ICAs since they follow the same blueprints as the summative assessments. The alignment
analysis included the range of content, the balance of content, and the cognitive complexity. To
determine these facets of alignment, HumRRO conducted a series of workshops during which
participants reviewed the alignment among the Smarter Balanced content and item specifications,
the Smarter Balanced blueprints, and the CCSS. The Smarter Balanced Assessment Consortium
Alignment Study Report can be accessed at https://portal.smarterbalanced.org/library/en/smarter-
balanced-assessment-consortium-alignment-study-report.pdf
Validity Studies Based on Internal Structure. Information regarding the reliability and measurement
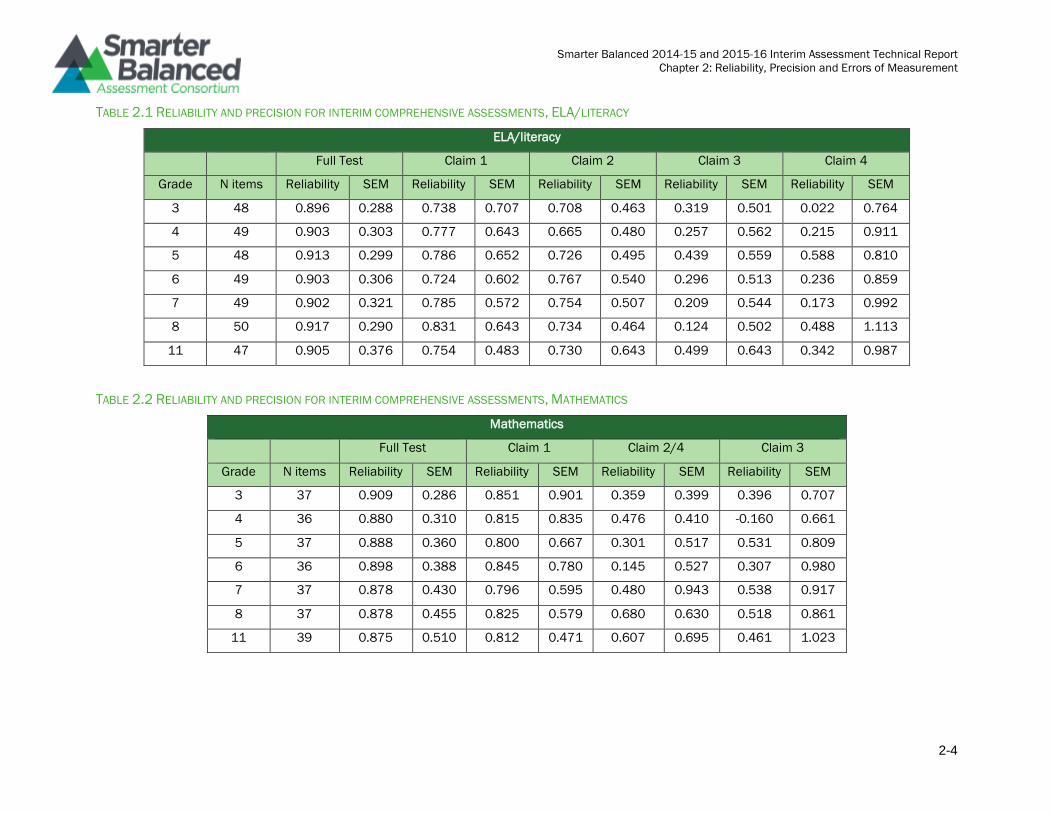
error of cluster-level (IAB) score reporting is provided in this report (Chapter 2; Table 2.1 and Table
2.2.
Interim Assessment Purpose 3:
Provide valid, reliable, and fair information about individual performance at the claim level in
ELA/literacy and mathematics, to determine whether teaching and learning are on target.
As shown in Table 1.1, validity evidence to support this purpose of the interim assessments
will rely on studies of internal structure, relations to other variables, and testing
consequences.
Validity Studies Based on Internal Structure. This purpose statement is similar to purpose 2, with the
difference being that rather than a focus at the content cluster level, the focus here is on the claim
level. The studies described for purpose 2 are all relevant here.
Validity Studies Based on Testing Consequences. Smarter Balanced does not collect interim
assessment data from its members, so only analyses of properties of test forms are conducted.
Interim Assessment Purpose 4:
Provide valid, reliable, and fair information about student progress toward the mastery of
skills measured in ELA/literacy and mathematics across all students and subgroups of
students.
Page 23
Smarter Balanced 2014-15 and 2015-16 Interim Assessment Technical Report
Chapter 1: Validity
1-7
Validity evidence in support of this purpose should come from all five sources. The validity studies
based on test content that were described with respect to purposes 1 and 2 provide the starting
point for equitable measurement across all students. The validity studies based on internal structure
should report any estimates of reliability, measurement precision, decision consistency, or decision
accuracy separately for all subgroups of students, and for students who take different variations of
the interim assessments.
Essential Validity Evidence Derived from the Standards.
The Standards (AERA et al. 2014, p.22) also present a set of essential validity elements consistent
with evidence typically reported for large-scale educational assessments. The essential validity
elements present a traditional synopsis of validity evidence, which form the basis for the evidence
demonstrated for the 2014-15 Smarter Balanced initial operational administration of the summative
assessments
The Standards describe these essential validity elements as
A. evidence of careful test construction;
B. adequate score reliability;
C. appropriate test administration and scoring;
D. accurate score scaling, equating, and standard setting; and
E. attention to fairness, equitable participation and access.
Table 1.2 presents a brief description of the essential validity evidence. Many of these essential
validity elements fall under the validity evidence based on test content (e.g., careful test
construction) and internal structure (adequate score reliability, scaling, equating). The sources of
evidence listed in Table 1.1 will reemerge when considering the five specific validity elements, which
represent the full validity framework. This overlap underscores the fundamental nature of these
elements for supporting the use of Smarter Balanced assessments for their intended purposes.
Table 1.2 is followed by a brief description of the potential types of evidence associated with each
essential element.
TABLE 1.2 SYNOPSIS OF ESSENTIAL VALIDITY EVIDENCE DERIVED FROM STANDARDS (AERA ET AL., 2014, P. 22)
Essential Element Chapter Type of Associated Validation Evidence
Careful Test
Construction
4. Test Design Description of test development steps, including construct
definition (test specifications and blueprints), item writing and
review, item data analysis, alignment studies
Adequate
Measurement
Precision (Reliability)
2. Reliability,
Precision &
Error
Analysis of test information, conditional standard errors of
measurement, decision accuracy and consistency, and reliability
estimates.
Appropriate Test
Administration
5. Test
Administration
Test administration procedures, including protocols for test
irregularities; availability and assignment of test
accommodations. Test, item and data security.
Appropriate Item
Scoring
5. Test
Administration
Scoring procedures, rater agreement analyses.
Page 24
Smarter Balanced 2014-15 and 2015-16 Interim Assessment Technical Report
Chapter 1: Validity
1-8
Essential Element Chapter Type of Associated Validation Evidence
Attention to Fairness,
Equitable
Participation and
Access
3. Test
Fairness
Accommodation policy guidelines, implementation of
accommodations, sensitivity review, DIF analyses, analyses of
accommodated tests; analysis of participation rates, availability
of translations.
The 2014 Standards’ Five Primary Sources of Validity Evidence
The five sources of validity evidence serve as organizing principles and represent a comprehensive
framework for evaluating validity for Smarter Balanced. These sources of validity evidence are
intended to emphasize different aspects of validity. However, since validity is a unitary concept, they
do not constitute distinct types of validity. These five sources of validity evidence consist of (1) test
content, (2) response processes, (3) internal structure, (4) relations to other variables, and (5)
consequences of testing. They are briefly described below:
1. Validity evidence based on test content refers to traditional forms of content validity
evidence, such as the rating of test specifications and test items (Crocker, Miller, & Franks,
1989; Sireci, 1998), as well as “alignment” methods for educational tests that evaluate the
interactions between curriculum frameworks, testing, and instruction (Rothman, Slattery,
Vranek, & Resnick, 2002; Bhola, Impara & Buckendahl, 2003; Martone & Sireci, 2009). The
degree to which (a) the Smarter Balanced test specifications captured the Common Core
State Standards and (b) the items adequately represent the domains delineated in the test
specifications, were demonstrated in the alignment studies. The major assumption here is
that the knowledge, skills, and abilities measured by the Smarter Balanced assessments are
consistent with the ones specified in the Common Core State Standards. Administration and
scoring can be considered as aspects of content-based evidence.
2. Validity evidence based on response processes refers to “evidence concerning the fit
between the construct and the detailed nature of performance or response actually engaged
in by examinees” (AERA et al., 1999 p. 12). This evidence might include documentation of
such activities as interviewing students concerning their responses to test items (i.e., speak
alouds) systematic observations of test response behavior; evaluation of the criteria used by
judges when scoring performance tasks, analysis of student item-response-time data,
features scored by automated algorithms; and evaluation of the reasoning processes
students employ when solving test items (Emberetson, 1983; Messick, 1989; Mislevy,
2009). This type of evidence was used to confirm that the Smarter Balanced assessments
are measuring the cognitive skills that are intended to be the objects of measurement and
that students are using these targeted skills to respond to the items.
3. Validity evidence based on internal structure refers to statistical analyses of item and score
subdomains to investigate the primary and secondary (if any) dimensions measured by an
assessment. Procedures for gathering such evidence include factor analysis or
multidimensional IRT scaling (both exploratory and confirmatory). With a vertical scale, a
consistent primary dimension or construct shift across the levels of the test should be
maintained. Internal structure evidence also evaluates the “strength” or “salience” of the
major dimensions underlying an assessment using indices of measurement precision such
as test reliability, decision accuracy and consistency, generalizability coefficients, conditional
and unconditional standard errors of measurement, and test information functions. In
addition, analysis of item functioning using Item Response Theory (IRT) and differential item
functioning (DIF) fall under the internal structure category. For Smarter Balanced, a
Page 25
Smarter Balanced 2014-15 and 2015-16 Interim Assessment Technical Report
Chapter 1: Validity
1-9
dimensionality study was conducted in the Pilot Test to determine the factor structure of the
assessments and the types of scales developed as well as the associated IRT models used
to calibrate them.
Evidence based on relations to other variables refers to traditional forms of criterion-related validity
evidence such as concurrent and predictive validity, as well as more comprehensive investigations of
the relationships among test scores and other variables such as multitrait-multimethod studies
(Campbell & Fiske, 1959).
Finally, evidence based on consequences of testing refers to the evaluation of the intended and
unintended consequences associated with a testing program. Examples of evidence based on
testing consequences include investigations of adverse impact, evaluation of the effects of testing
on instruction, and evaluation of the effects of testing on issues such as high school dropout rates.
With respect to educational tests, the Standards stress the importance of evaluating test
consequences. For example, they state,
When educational testing programs are mandated the ways in which test results are
intended to be used should be clearly described. It is the responsibility of those who
mandate the use of tests to monitor their impact and to identify and minimize potential
negative consequences. Consequences resulting from the use of the test, both intended and
unintended, should also be examined by the test user (AERA et al., 2014, p. 145).
Investigations of testing consequences relevant to the Smarter Balanced goals include analyses of
students’ opportunity to learn with regard to the Common Core State Standards, and analyses of
changes in textbooks and instructional approaches. Unintended consequences, such as changes in
instruction, diminished morale among teachers and students, increased pressure on students
leading to increased dropout rates, or the pursuit of college majors and careers that are less
challenging, can be evaluated. These studies are beyond the scope of this report.
Conclusion for Interim Test Validity Results
Validation is an ongoing, essentially perpetual endeavor in which additional evidence can be
provided but one can never absolutely “assert” an assessment is perfectly valid (Haertel, 1999). This
is particularly true for the many purposes typically placed on tests. Program requirements are often
subject to change and the populations assessed change over time. Nonetheless, at some point
decisions must be made regarding whether sufficient evidence exists to justify the use of a test for a
particular purpose. A review of the purpose statements and the available validity evidence
determines the degree to which the principles outlined here have been realized. Most of this report
focuses on describing some of the essential validity elements required for necessary evidence. The
essential validity elements presented here constitute critical evidence “relevant to the technical
quality of a testing system” (AERA et al., 2014, p. 22).
Page 26
Smarter Balanced 2014-15 and 2015-16 Interim Assessment Technical Report
Chapter 1: Validity
1-10
References
American Educational Research Association, American Psychological Association, & National Council
on Measurement in Education. (2014). Standards for educational and psychological testing.
Washington, DC: American Educational Research Association.
American Institute for Research. (2013). Cognitive laboratories technical report. Los Angeles, CA:
Smarter Balanced Assessment Consortium. Retrieved from
http://www.smarterbalanced.org/assessments/development/additional-technical-
documentation/
National Governors Association Center for Best Practices, & Council of Chief State School Officers.
(2016). Development Process. Washington, DC: Author. Retrieved from
http://www.corestandards.org/about-the-standards/development-process/
Conley, D. T., Drummond, K. V., de Gonzalez, A., Rooseboom, J., & Stout. O. (2011). Reaching the
goal: The applicability and importance of the Common Core State Standards to college and
career readiness. Eugene, OR: Educational Policy Improvement Center.
Cronbach, L. J. (1971). Test validation. In R. L. Thorndike (Ed.), Educational measurement (2nd ed.).
Washington, DC: American Council on Education.
Dorans, N. J. (2004). Using subpopulation invariance to assess test score equity. Journal of
Educational Measurement, 41, 43–68.
Educational Testing Service (2002). ETS standards for quality and fairness. Princeton, NJ: Author.
Educational Testing Service (ETS). (2012). Specifications for an interim system of assessment.
Princeton, NJ: Author.
Educational Testing Service (2015). Study of the relationship between the early assessment
program and the smarter balanced field tests. Sacramento: California Department of
Education.
Kane, M. T. (1992). An argument-based approach to validity. Psychological Bulletin, 112, 527-535.
Kane, M. (2006). Validation. In R. L. Brennan (Ed). Educational measurement (4th ed., pp. 17-64).
Washington, DC: American Council on Education/Praeger.
Linn, R. L. (2006). The standards for educational and psychological Testing: Guidance in test
development. In S. M. Downing & T. M. Haladyna (Eds.), Handbook of test development (pp.
27-38), Mahwah, NJ: Lawrence Erlbaum.
Pitoniak, M. J., Sireci, S. G., & Luecht, R. M. (2002). A multitrait-multimethod validity investigation of
scores from a professional licensure exam. Educational and Psychological Measurement, 62,
498–516.
Sireci, S. G. (2013). Agreeing on validity arguments. Journal of Educational Measurement. 50, 1,
99–104.
Sireci, S. G. (2012). Smarter Balanced Assessment Consortium: Comprehensive research agenda.
Los Angeles, CA: Smarter Balanced Assessment Consortium. Retrieved from
http://www.smarterbalanced.org/assessments/development/additional-technical-
documentation/
Smarter Balanced Assessment Consortium. (2014a). 2013-2014 Technical report. Los Angeles, CA:
Author. Retrieved from https://portal.smarterbalanced.org/library/en/2013-14-technical-
report.pdf
Page 27
Smarter Balanced 2014-15 and 2015-16 Interim Assessment Technical Report
Chapter 1: Validity
1-11
Smarter Balanced Assessment Consortium. (2014b). Observation and report on Smarter Balanced
standard setting. Los Angeles, CA: Author. Retrieved from
https://www.smarterbalanced.org/wp-content/uploads/2015/08/SBAC-Standard-Setting-
Report-.pdf
Smarter Balanced Assessment Consortium. (2015a). Content specifications for the summative
assessment of the common core state standards for English language arts and literacy in
history/social studies, science, and technical subjects. Los Angeles, CA: Author. Retrieved
from https://portal.smarterbalanced.org/library/en/english-language-artsliteracy-content-
specifications.pdf
Smarter Balanced Assessment Consortium. (2015b). Content specifications for the summative
assessment of the common core state standards for mathematics. Los Angeles, CA: Author.
Retrieved from https://www.smarterbalanced.org/wp-
content/uploads/2015/08/Mathematics-Content-Specifications.pdf
Smarter Balanced Assessment Consortium. (2015c). End of grant report. Los Angeles, CA: Author.
Retrieved from http://www.smarterbalanced.org/wp-content/uploads/2015/08/SB-
EndOfGrantReport-F2.pdf
Smarter Balanced Assessment Consortium. (2016a). English Language Arts/Literacy interim
assessment blocks. Los Angeles, CA: Author. Retrieved from
https://www.smarterbalanced.org/wp-content/uploads/2015/09/ELA-
Interim_Assessment_Blocks_Blueprint.pdf
Smarter Balanced Assessment Consortium. (2016b). Mathematics interim assessment blocks. Los
Angeles, CA: Author. Retrieved from https://www.smarterbalanced.org/wp-
content/uploads/2015/09/Math_Interim_Assessment_Blocks_Blueprint.pdf
Smarter Balanced Assessment Consortium. (2015d). English Language Arts/Literacy summative
assessment blocks. Los Angeles, CA: Author. Retrieved from
https://www.smarterbalanced.org/wp-content/uploads/2015/08/ELA_Blueprint.pdf
Smarter Balanced Assessment Consortium. (2015e). Mathematics summative assessment blocks.
Los Angeles, CA: Author. Retrieved from https://www.smarterbalanced.org/wp-
content/uploads/2015/08/Mathematics_Blueprint.pdf
Smarter Balanced Assessment Consortium. (2016c). Smarter Balanced Assessment Consortium:
2014-2015 technical report. Los Angeles, CA: Author. Retrieved from
https://www.smarterbalanced.org/wp-content/uploads/2015/08/2014-
15_Technical_Report.pdf
Page 28
Smarter Balanced 2014-15 and 2015-16 Interim Assessment Technical Report
Chapter 2: Reliability, Precision and Errors of Measurement
2-1
Chapter 2: Reliability, Precision and
Error of Measurement
Page 29
Smarter Balanced 2014-15 and 2015-16 Interim Assessment Technical Report
Chapter 2: Reliability, Precision and Errors of Measurement
2-2
Introduction
This chapter addresses the technical quality of the interim assessments available in 2014/2015
and 2015/2016 school years functioning with regard to their expected precision and reliability. Part
of the test validity argument is that scores must be consistent and precise enough to be useful for
intended purposes. If scores are to be meaningful, tests should deliver the same results under
repeated administrations or for students of the same ability. In addition, the range of uncertainty
around the score should be small enough to support educational decisions. The concepts of
reliability and precision are examined through analysis of measurement. Specifically, because, states
do not routinely collect or report item responses on the interim assessments, we focus our analyses
on properties of the interim assessment test forms.
Reliability in physical instruments is checked by repeated measurement. For example, reliability of
scales is verified by seeing that the scale always gives the same weight for the same object. For
assessments, it is not possible to give the same test more than once to the same individual without
altering the object of measurement. Consequently, information about precision and reliability holds
only for the first standard administration of the tests. For these fixed form tests, reliability is inferred
from test properties, including test length and the information provided by item parameters. For the
interim assessments, standard errors of measurement, the inverse of the square root of information,
are related to reliability in that they represent the standard deviation of repeated test scores. They
may give information about the range of ICA results, but would not necessarily apply to repeated
administrations of the same test form. Standard errors are used in IABs to establish reporting
categories as described at the end of this chapter.
Evaluating reliability and precision
Reliability was evaluated primarily using an estimate of marginal reliability based on the mean
square error (MSE) between true and estimated latent proficiency (). As usual, 0 indicates
completely unreliable and 1 indicates completely reliable. Reliability of the test form depends on ,
but a marginal estimate facilitates interpretation by providing a more succinct, single summary for
each grade and content area.
The MSE-based marginal reliability estimate (�̅�𝑀𝑆𝐸) is computed using the MSE between the true and
estimated values for each examinee, and the variance of the true : �̅�𝑀𝑆𝐸 = 1 −𝑀𝑆𝐸
𝜎𝜃2 , where
𝑀𝑆𝐸 =∑ (�̂�𝑖−𝜃𝑖)𝑁
𝑖=1
2
𝑁 and 𝜎𝜃
2 is the population variance in the true scores. Here, �̅�𝑀𝑆𝐸 was computed
through a simulation. True values for 1000 examinees were simulated from a normal distribution
with mean and variance equal to the 2014-15 operational values for each grade and content area
(Smarter Balanced Assessment Consortium, 2016a). Next, scores for the items on the form were
generated from the true scores and item parameters. Estimated values were obtained via
maximum likelihood scoring according to the Smarter Balanced scoring specification. The data
simulation and scoring were carried out with flexMIRT software (Cai, 2017). The �̅�𝑀𝑆𝐸 was calculated
for overall and claim scores for the ICAs. Because the Consortium uses item parameters from a
unidimensional calibration to obtain the overall and claim scores, we assume one true and use
that to calculate all claim-specific �̅�𝑀𝑆𝐸 values within each grade and content area.
To evaluate measurement precision, we examined plots of test information and conditional standard
error of measurement for total scores (over the range of ). Conceptually, the conditional SEM is the
expected standard deviation of the true score for a given true scale score and the item parameters.
Consistent with the Smarter Balanced Scoring Specifications (Smarter Balanced Assessment
Page 30
Smarter Balanced 2014-15 and 2015-16 Interim Assessment Technical Report
Chapter 2: Reliability, Precision and Errors of Measurement
2-3
Consortium, 2016b), the SEM for student i is: 𝑆𝐸𝑀(𝜃𝑖) = 1
√𝐼(𝜃𝑖), where 𝐼(𝜃𝑖) is the test information
for student i, calculated as:
𝐼(𝜃𝑖) = ∑ 𝐷2𝑎𝑗2 (
∑ 𝑙2𝐸𝑥𝑝(∑ 𝐷𝑎𝑗(𝜃𝑖−𝑏𝑗𝑘)𝑙𝑘=1 )
𝑚𝑗𝑙=1
1+∑ 𝐸𝑥𝑝(∑ 𝐷𝑎𝑗(𝜃𝑖−𝑏𝑗𝑘)𝑙𝑘=1 )
𝑚𝑗𝑙=1
− (∑ 𝑙𝐸𝑥𝑝(∑ 𝐷𝑎𝑗(𝜃𝑖−𝑏𝑗𝑘)𝑙
𝑘=1 )𝑚𝑗𝑙=1
1+∑ 𝐸𝑥𝑝(∑ 𝐷𝑎𝑗(𝜃𝑖−𝑏𝑗𝑘)𝑙𝑘=1 )
𝑚𝑗𝑙=1
)
2
)𝐼𝑗=1 , 𝑚𝑗is the maximum
possible score point (starting from 0) for the jth item, and 𝐷 is the scale factor, 1.7. Values of aj and
bjk are IRT item parameters for item j and score level k.
Table 2.1 to Table 2.4 show marginal reliability and SEM for the overall test and claims for the ICA.
Note that we do not report the marginal reliability and SEM for the assessment blocks of the IABs
because scale scores are not reported. IAB results are reported based on certainty of the score being
above or below the cut score between achievement reporting categories 2 and 3.
As expected, overall estimated reliability coefficients for the ICA are high and the SEMs are small and
in the acceptable range for a large scale test. Reliability estimates at the claim level are lower, and
SEM is higher. Figure 2.1 to Figure 2.6 show plots of the test information function and SEM for the
ICA for each grade and subject area.
Reliability estimates are even lower and SEM is highest for the ICA claim-level scores. Claims with
fewer items and fewer points exhibit the lowest reliability and the highest SEM.
Page 31
Smarter Balanced 2014-15 and 2015-16 Interim Assessment Technical Report
Chapter 2: Reliability, Precision and Errors of Measurement
2-4
TABLE 2.1 RELIABILITY AND PRECISION FOR INTERIM COMPREHENSIVE ASSESSMENTS, ELA/LITERACY
ELA/literacy
Full Test Claim 1 Claim 2 Claim 3 Claim 4
Grade N items Reliability SEM Reliability SEM Reliability SEM Reliability SEM Reliability SEM
3 48 0.896 0.288 0.738 0.707 0.708 0.463 0.319 0.501 0.022 0.764
4 49 0.903 0.303 0.777 0.643 0.665 0.480 0.257 0.562 0.215 0.911
5 48 0.913 0.299 0.786 0.652 0.726 0.495 0.439 0.559 0.588 0.810
6 49 0.903 0.306 0.724 0.602 0.767 0.540 0.296 0.513 0.236 0.859
7 49 0.902 0.321 0.785 0.572 0.754 0.507 0.209 0.544 0.173 0.992
8 50 0.917 0.290 0.831 0.643 0.734 0.464 0.124 0.502 0.488 1.113
11 47 0.905 0.376 0.754 0.483 0.730 0.643 0.499 0.643 0.342 0.987
TABLE 2.2 RELIABILITY AND PRECISION FOR INTERIM COMPREHENSIVE ASSESSMENTS, MATHEMATICS
Mathematics
Full Test Claim 1 Claim 2/4 Claim 3
Grade N items Reliability SEM Reliability SEM Reliability SEM Reliability SEM
3 37 0.909 0.286 0.851 0.901 0.359 0.399 0.396 0.707
4 36 0.880 0.310 0.815 0.835 0.476 0.410 -0.160 0.661
5 37 0.888 0.360 0.800 0.667 0.301 0.517 0.531 0.809
6 36 0.898 0.388 0.845 0.780 0.145 0.527 0.307 0.980
7 37 0.878 0.430 0.796 0.595 0.480 0.943 0.538 0.917
8 37 0.878 0.455 0.825 0.579 0.680 0.630 0.518 0.861
11 39 0.875 0.510 0.812 0.471 0.607 0.695 0.461 1.023
Page 32
Smarter Balanced 2014-15 and 2015-16 Interim Assessment Technical Report
Chapter 2: Reliability, Precision and Errors of Measurement
2-5
FIGURE 2.1 TEST INFORMATION FUNCTIONS AND SEM FOR ELA/LITERACY ICA, GRADES 3 ,4, AND 5
Note. The dotted lines indicate the cut scores. The shaded distribution is the population distribution for that
grade.
Page 33
Smarter Balanced 2014-15 and 2015-16 Interim Assessment Technical Report
Chapter 2: Reliability, Precision and Errors of Measurement
2-6
FIGURE 2.2 TEST INFORMATION FUNCTIONS AND SEM FOR ELA/LITERACY ICA, GRADES 6, 7, AND 8
Note. The dotted lines indicate the cut scores. The shaded distribution is the population distribution for that
grade.
Page 34
Smarter Balanced 2014-15 and 2015-16 Interim Assessment Technical Report
Chapter 2: Reliability, Precision and Errors of Measurement
2-7
FIGURE 2.3 TEST INFORMATION FUNCTIONS AND SEM FOR ELA/LITERACY ICA, GRADE 11
Note. The dotted lines indicate the cut scores. The shaded distribution is the population distribution for that
grade.
Page 35
Smarter Balanced 2014-15 and 2015-16 Interim Assessment Technical Report
Chapter 2: Reliability, Precision and Errors of Measurement
2-8
FIGURE 2.4 TEST INFORMATION FUNCTIONS AND SEM FOR MATHEMATICS ICA, GRADES 3, 4, AND 5
Note. The dotted lines indicate the cut scores. The shaded distribution is the population distribution for that
grade.
Page 36
Smarter Balanced 2014-15 and 2015-16 Interim Assessment Technical Report
Chapter 2: Reliability, Precision and Errors of Measurement
2-9
FIGURE 2.5 TEST INFORMATION FUNCTIONS AND SEM FOR MATHEMATICS ICA, GRADES 6, 7 AND 8
Note. The dotted lines indicate the cut scores. The shaded distribution is the population distribution for that
grade.
Page 37
Smarter Balanced 2014-15 and 2015-16 Interim Assessment Technical Report
Chapter 2: Reliability, Precision and Errors of Measurement
2-10
FIGURE 2.6 TEST INFORMATION FUNCTIONS AND SEM FOR MATHEMATICS ICA, GRADE 11
Note. The dotted lines indicate the cut scores. The shaded distribution is the population distribution for that
grade.
Page 38
Smarter Balanced 2014-15 and 2015-16 Interim Assessment Technical Report
Chapter 2: Reliability, Precision and Errors of Measurement
2-11
Classification Accuracy
Classification accuracy is defined as the degree of consistency between the observed Achievement
Level (from the observed scores) and the true Achievement Level (from the population distribution).
To calculate the classification accuracy, a simulation study was conducted using item-level
information and information about the population parameters (mean and standard deviation). The
simulation study allows us to understand classification accuracy without having student-level data at
hand. First, true scores for 1000 simulees were generated from the mean and standard deviation
from the 2014-2015 population distributions for a given grade. Then, responses from the simulees
to the items in the fixed forms (IABs and ICAs) were generated, using the parameters and item
response models used in the scoring of these items. From these simulated item responses, scale
scores, standard errors, and achievement-level classifications were obtained, according to the
Smarter Balanced scoring specification (Smarter Balanced Assessment Consortium, 2014, 2015).
Correct classification by level was computed as the proportion of students among those assigned to
a particular level whose true Achievement Level (based on the simulated true score) and assigned
Achievement Level (based on the estimated score) matched. The overall correct classification rate is
the proportion of students among those assigned to any level who are correctly assigned. For the
claim scores and Interim Assessment Blocks (IABs), we assume that the true claim or IAB scores are
equivalent to the true overall scores. Therefore, we use the true overall score as the true claim or IAB
score in calculating correct classification rates.
For overall scores, we used a weighted Kappa to describe the accuracy of classifications into the four
Achievement Levels. Claim and IAB scores were evaluated with respect to the cut score between
Levels 2 and 3, which represents the minimum standard for being deemed proficient for the subject
and grade level. For each claim, students are classified as being “above” or “below” the standard
when the estimated score is at least 1.5 standard errors above or below the cut score. When the
estimated score is within 1.5 standard errors, the student is classified as being “at or near” the
standard. Claim or IAB scores with larger average standard errors can thus be expected to have a
greater proportion of students classified as “at or near” the standard. Because such classifications
cannot be treated as a misclassification (as no student’s true score is “at” the cut score, and “near”
is only defined in terms of the standard error of measurement), the proportions correctly classified
focus on those students who were classified as “above” or “below.”
Table 2.3 shows the cut scores used for the three Achievement Levels for the overall scores for
ELA/literacy and mathematics. The same cut scores were used for the Claim scores and IAB scores
but were called: “below proficient”, “at or near proficient”, and “above proficient”.
TABLE 2.3 CUT SCORES FOR ACHIEVEMENT LEVELS
Grade Subject Level 1/2 Level 2/3 Level 3/4
3 ELA/literacy -1.646 -0.888 -0.212
4 ELA/literacy -1.075 -0.410 0.289
5 ELA/literacy -0.772 -0.072 0.860
6 ELA/literacy -0.597 0.266 1.280
Page 39
Smarter Balanced 2014-15 and 2015-16 Interim Assessment Technical Report
Chapter 2: Reliability, Precision and Errors of Measurement
2-12
Grade Subject Level 1/2 Level 2/3 Level 3/4
7 ELA/literacy -0.340 0.510 1.641
8 ELA/literacy -0.247 0.685 1.862
11 ELA/literacy -0.177 0.872 2.026
3 Mathematics -1.689 -0.995 -0.175
4 Mathematics -1.310 -0.377 0.430
5 Mathematics -0.755 0.165 0.808
6 Mathematics -0.528 0.468 1.199
7 Mathematics -0.390 0.657 1.515
8 Mathematics -0.137 0.897 1.741
11 Mathematics 0.354 1.426 2.561
Table 2.4 and Table 2.5 show the classification accuracy for the IAB scores in ELA/literacy and
mathematics for all grades. Each table shows the percent of simulees assigned to each Achievement
Level as well as the percent—among those assigned to each category and overall—who were correctly
classified. As shown in Table 2.4 and Table 2.5, in both ELA/literacy and mathematics, overall
classification across all grades and claims was between 93% and 99%.
Page 40
Smarter Balanced 2014-15 and 2015-16 Interim Assessment Technical Report
Chapter 2: Reliability, Precision and Errors of Measurement
2-13
TABLE 2.4 OVERALL LEVEL CLASSIFICATION ACCURACY FOR INTERIM ASSESSMENT BLOCKS, ELA/LITERACY
Grade Block Name mean #
Items
Proportion Assigned Proportion Correctly Classified
Below At/Near Above Below At/Near Above Overall
3
Edit and Revise 15.0 0.37 0.52 0.11 0.99 NA 0.98 0.99
Brief Writes 6.0 0.00 0.81 0.19 0.00 NA 0.93 0.93
Listen and Interpret 15.0 0.29 0.54 0.17 0.99 NA 0.96 0.98
Research 17.0 0.33 0.50 0.18 1 NA 0.97 0.99
Reading Informational
Text 16.0 0.27 0.55 0.18 0.98 NA 0.94 0.96
Reading Literary Text 15.0 0.33 0.48 0.20 0.99 NA 0.95 0.98
Grade 3 Performance
Task 5.0 0.00 0.86 0.15 0.00 NA 0.96 0.96
4
Listen and Interpret 15.0 0.31 0.55 0.15 0.98 NA 0.99 0.98
Edit and Revise 16.0 0.33 0.51 0.16 0.99 NA 0.98 0.99
Research 18.0 0.32 0.49 0.19 0.99 NA 0.99 0.99
Brief Writes 6.0 0.09 0.72 0.18 0.97 NA 0.97 0.97
Reading Literary Text 15.0 0.32 0.48 0.20 0.98 NA 0.96 0.97
Reading Informational
Text 14.0 0.25 0.55 0.20 0.97 NA 0.98 0.98
Grade 4 Performance
Task 5.0 0.00 0.81 0.19 0 NA 0.96 0.96
5
Brief Writes 6.0 0.12 0.70 0.18 0.98 NA 0.93 0.95
Edit and Revise 13.0 0.27 0.55 0.19 0.98 NA 0.97 0.98
Reading Informational
Text 15.0 0.15 0.63 0.22 0.97 NA 0.96 0.97
Listen and Interpret 14.0 0.24 0.58 0.18 0.98 NA 0.96 0.97
Research 17.0 0.28 0.48 0.24 0.98 NA 0.98 0.98
Reading Literary Text 15.0 0.26 0.52 0.22 0.97 NA 0.96 0.97
Grade 5 Performance
Task 5.0 0.18 0.59 0.23 0.97 NA 0.96 0.96
6
Brief Writes 6.0 0.04 0.77 0.19 0.93 NA 0.97 0.97
Listen and Interpret 15.0 0.26 0.55 0.19 0.98 NA 0.97 0.98
Edit and Revise 18.0 0.30 0.51 0.19 0.98 NA 0.97 0.98
Research 18.0 0.29 0.48 0.23 0.99 NA 0.98 0.98
Reading Literary Text 15.0 0.23 0.59 0.19 0.97 NA 0.95 0.96
Reading Informational
Text 16.0 0.26 0.54 0.20 0.98 NA 0.98 0.98
Grade 6 Performance
Task 4.0 0.19 0.61 0.20 0.98 NA 0.95 0.96
7
Research 15.0 0.19 0.61 0.20 0.96 NA 0.97 0.97
Edit and Revise 17.0 0.28 0.54 0.18 0.98 NA 0.97 0.98
Listen and Interpret 15.0 0.27 0.56 0.17 0.99 NA 0.96 0.98
Reading Informational
Text 16.0 0.29 0.48 0.23 0.99 NA 0.98 0.99
Brief Writes 6.0 0.14 0.68 0.18 0.99 NA 0.94 0.97
Page 41
Smarter Balanced 2014-15 and 2015-16 Interim Assessment Technical Report
Chapter 2: Reliability, Precision and Errors of Measurement
2-14
Reading Literary Text 16.0 0.32 0.47 0.21 0.99 NA 0.98 0.99
Grade 7 Performance
Task 5.0 0.18 0.63 0.19 0.99 NA 0.96 0.98
8
Research 17.0 0.29 0.52 0.19 0.98 NA 0.96 0.97
Edit and Revise 14.0 0.29 0.55 0.16 0.99 NA 0.96 0.98
Listen and Interpret 15.0 0.26 0.58 0.16 0.97 NA 0.96 0.97
Brief Writes 6.0 0.12 0.69 0.20 0.98 NA 0.96 0.97
Reading Informational
Text 16.0 0.22 0.54 0.24 0.99 NA 0.97 0.98
Reading Literary Text 16.0 0.32 0.45 0.23 1 NA 0.98 0.99
Grade 8 Performance
Task 5.0 0.24 0.55 0.21 0.97 NA 0.99 0.98
11
Research 17.0 0.19 0.51 0.30 0.98 NA 0.98 0.98
Edit and Revise 18.0 0.24 0.51 0.26 0.98 NA 0.98 0.98
Reading Informational
Text 15.0 0.21 0.51 0.28 0.98 NA 0.97 0.97
Listen and Interpret 15.0 0.21 0.59 0.20 0.97 NA 0.98 0.98
Brief Writes 6.0 0.18 0.57 0.25 0.94 NA 0.97 0.96
Reading Literary Text 16.0 0.20 0.53 0.27 0.98 NA 0.97 0.98
Grade HS Performance
Task 5.0 0.12 0.60 0.29 0.97 NA 0.98 0.98
TABLE 2.5 OVERALL LEVEL CLASSIFICATION ACCURACY FOR INTERIM ASSESSMENT BLOCKS, MATHEMATICS
Grade Block Name
mean
#
Items
% Assigned to Level % Correctly Classified
Below At/Near Above Below At/Near Above Overall
3
NF Block 13.0 0.24 0.56 0.20 0.98 NA 0.97 0.98
OA Block 15.0 0.37 0.55 0.09 0.99 NA 0.94 0.98
MD Block 15.0 0.35 0.44 0.21 0.99 NA 0.98 0.99
4
NBT Block 15.0 0.39 0.46 0.15 0.99 NA 0.94 0.97
NF Block 16.0 0.40 0.41 0.19 1 NA 0.97 0.99
OA Block 15.0 0.38 0.45 0.17 0.99 NA 0.95 0.98
5
NBT Block 16.0 0.41 0.45 0.14 0.99 NA 0.97 0.99
NF Block 15.0 0.44 0.42 0.15 1 NA 0.99 0.99
MD Block 14.0 0.35 0.48 0.17 0.99 NA 0.96 0.98
6
Expressions &
Equations Block 15.0 0.43 0.41 0.15 1 NA 0.97 0.99
Geometry Block 13.0 0.17 0.64 0.20 0.98 NA 0.97 0.97
Ratio and Proportional
Relationships Block 14.0 0.46 0.42 0.13 0.99 NA 0.97 0.98
7
Number Systems Block 14.0 0.31 0.52 0.17 0.99 NA 0.96 0.98
Expressions &
Equations Block 15.0 0.38 0.43 0.19 0.99 NA 0.96 0.98
Ratio and Proportional
Relationships Block 14.0 0.30 0.53 0.17 1 NA 0.98 0.99
Page 42
Smarter Balanced 2014-15 and 2015-16 Interim Assessment Technical Report
Chapter 2: Reliability, Precision and Errors of Measurement
2-15
8
Expressions &
Equations II Block 9.0 0.28 0.57 0.14 0.99 NA 0.96 0.98
Expressions &
Equations I Block 5.0 0 1 0 0 1 0 1
Functions Block 15.0 0.38 0.44 0.18 0.99 NA 0.97 0.98
Geometry Block 14.0 0.28 0.56 0.16 0.99 NA 0.98 0.98
11
Algebra and Functions -
Linear Functions 15.0 0.43 0.42 0.15 1 NA 0.97 0.99
Geometry - Right Triangle
Ratios in Geometry 13.0 0.13 0.71 0.16 0.99 NA 0.95 0.97
Algebra and Functions -
Quadratic Functions 13.0 0.21 0.65 0.14 0.98 NA 0.94 0.96
Page 43
Smarter Balanced 2014-15 and 2015-16 Interim Assessment Technical Report
Chapter 2: Reliability, Precision and Errors of Measurement
2-16
Table 2.6 and Table 2.7 show the classification accuracy for the overall scores for all grades for
Interim Comprehensive Assessments (ICA), ELA/literacy and mathematics, respectively. Each table
shows the percent of simulees assigned to each category as well as the percent—among those
assigned to each category and overall—who were correctly classified. As shown in Table 2.6, across
all grades in ELA/literacy, the proportion of all simulees who were correctly classified ranges from
0.68 to 0.88. Weighted kappa ranges from .89 to .92 indicating acceptable classification accuracy.
TABLE 2.6 OVERALL LEVEL CLASSIFICATION ACCURACY FOR INTERIM COMPREHENSIVE ASSESSMENTS, ELA/LITERACY
Grade Mean #
Items
Proportion Assigned Proportion Correctly Classified kappa
L1 L2 L3 L4 L1 L2 L3 L4 Overall
3 48 0.33 0.28 0.21 0.19 0.86 0.77 0.71 0.81 0.79 0.91
4 49 0.37 0.22 0.21 0.20 0.88 0.69 0.68 0.83 0.79 0.92
5 48 0.31 0.24 0.27 0.18 0.88 0.75 0.78 0.81 0.81 0.92
6 49 0.28 0.31 0.27 0.14 0.86 0.77 0.78 0.77 0.80 0.90
7 49 0.30 0.27 0.30 0.13 0.85 0.75 0.76 0.77 0.79 0.90
8 50 0.25 0.30 0.32 0.13 0.84 0.79 0.79 0.79 0.80 0.90
11 47 0.19 0.28 0.33 0.21 0.78 0.75 0.74 0.82 0.77 0.89
Table 2.7 shows the classification accuracy for the overall scores for all grades for ICA in
mathematics. Across all grades, the proportion of all simulees who were correctly classified ranges
from 0.58 to 0.88. Weighted kappa ranges from .89 to .92 indicating acceptable classification
accuracy.
TABLE 2.7 OVERALL LEVEL CLASSIFICATION ACCURACY FOR INTERIM COMPREHENSIVE ASSESSMENTS, MATHEMATICS
Grade Mean #
Items
% Assigned to Level % Correctly Classified kappa
L1 L2 L3 L4 L1 L2 L3 L4 Overall
3 48 0.32 0.27 0.24 0.16 0.86 0.72 0.79 0.81 0.80 0.91
4 49 0.29 0.33 0.23 0.14 0.86 0.80 0.73 0.80 0.80 0.90
5 48 0.38 0.30 0.17 0.15 0.87 0.75 0.58 0.81 0.78 0.90
6 49 0.39 0.29 0.17 0.15 0.88 0.76 0.68 0.87 0.81 0.92
7 49 0.38 0.29 0.18 0.16 0.86 0.75 0.69 0.83 0.80 0.91
8 50 0.42 0.26 0.16 0.17 0.87 0.74 0.69 0.80 0.80 0.91
11 47 0.48 0.25 0.18 0.10 0.88 0.64 0.65 0.81 0.77 0.89
Page 44
Smarter Balanced 2014-15 and 2015-16 Interim Assessment Technical Report
Chapter 2: Reliability, Precision and Errors of Measurement
2-17
Table 2.8 and Table 2.9 show the classification accuracy for ICA claim scores. Again, we show the
percent of simulees assigned to each category as well as the percent of simulees who were correctly
classified in each category. In both ELA and Math, overall classification across all grades and claims
was between 92% and 100%.
Page 45
Smarter Balanced 2014-15 and 2015-16 Interim Assessment Technical Report
Chapter 2: Reliability, Precision and Errors of Measurement
2-18
TABLE 2.8 CLAIM LEVEL CLASSIFICATION ACCURACY FOR INTERIM COMPREHENSIVE ASSESSMENTS, ELA/LITERACY
Grade Claim # of
items
Proportion Assigned Proportion Correctly Classified
Below At/Near Above Below At/Near Above Overall
Claim 1
3 1 11 0.37 0.44 0.19 0.98 NA 0.94 0.97
4 1 9 0.20 0.69 0.12 0.97 NA 0.97 0.97
5 1 12 0.33 0.44 0.22 0.98 NA 0.97 0.97
6 1 9 0.20 0.68 0.12 0.97 NA 0.99 0.98
7 1 12 0.34 0.44 0.23 0.99 NA 0.98 0.99
8 1 12 0.36 0.39 0.25 0.99 NA 0.97 0.98
11 1 8 0.15 0.63 0.22 0.93 NA 0.95 0.94
Claim 2
3 2 9 0.21 0.65 0.14 0.99 NA 0.98 0.98
4 2 12 0.36 0.43 0.21 0.98 NA 0.95 0.97
5 2 19 0.33 0.41 0.26 0.98 NA 0.97 0.98
6 2 12 0.36 0.44 0.20 0.98 NA 0.96 0.97
7 2 8 0.09 0.72 0.19 0.96 NA 0.95 0.95
8 2 8 0.30 0.47 0.23 0.96 NA 0.97 0.97
11 2 11 0.25 0.47 0.28 0.99 NA 0.99 0.99
Claim 3
3 3 8 0.03 0.83 0.15 0.87 NA 0.93 0.92
4 3 20 0.39 0.40 0.21 0.99 NA 1 0.99
5 3 9 0.22 0.64 0.13 0.99 NA 0.93 0.97
6 3 7 0.12 0.68 0.20 0.93 NA 0.95 0.94
7 3 9 0.21 0.67 0.12 0.97 NA 0.89 0.94
8 3 9 0.21 0.79 0.00 0.94 NA 1 0.94
11 3 19 0.23 0.51 0.26 0.98 NA 0.98 0.98
Claim 4
3 4 20 0.38 0.42 0.21 0.99 NA 0.98 0.98
4 4 8 0.13 0.68 0.19 0.97 NA 0.95 0.96
5 4 8 0.23 0.53 0.24 0.97 NA 0.95 0.96
6 4 21 0.33 0.48 0.20 0.98 NA 0.96 0.97
7 4 20 0.35 0.40 0.25 0.99 NA 0.97 0.98
8 4 21 0.34 0.41 0.25 0.99 NA 0.98 0.98
11 4 9 0.19 0.64 0.18 0.96 NA 0.96 0.96
Page 46
Smarter Balanced 2014-15 and 2015-16 Interim Assessment Technical Report
Chapter 2: Reliability, Precision and Errors of Measurement
2-19
TABLE 2.9 CLAIM LEVEL CLASSIFICATION ACCURACY FOR INTERIM COMPREHENSIVE ASSESSMENTS, MATHEMATICS
Grade Claim # of items % Assigned to Level % Correctly Classified
Below At/Near Above Below At/Near Above Overall
Claim 1
3 1 20 0.40 0.36 0.24 0.99 NA 0.99 0.99
4 1 20 0.46 0.33 0.21 0.99 NA 0.97 0.99
5 1 20 0.48 0.37 0.15 0.99 NA 1 0.99
6 1 19 0.49 0.33 0.18 1 NA 0.97 0.99
7 1 20 0.47 0.33 0.20 0.99 NA 0.99 0.99
8 1 20 0.50 0.31 0.19 1 NA 0.99 1
11 1 10 0.40 0.49 0.12 0.99 NA 0.94 0.98
Claim 2 & 4
3 2 9 0.00 0.76 0.24 0.00 NA 0.98 0.98
4 2 9 0.29 0.52 0.19 0.99 NA 0.96 0.98
5 2 9 0.19 0.66 0.16 0.99 NA 0.96 0.98
6 2 8 0.18 0.67 0.15 0.98 NA 0.99 0.98
7 2 9 0.29 0.51 0.20 0.99 NA 0.99 0.99
8 2 9 0.41 0.44 0.15 1 NA 0.99 0.99
11 2 21 0.52 0.34 0.14 0.99 NA 0.98 0.99
Claim 3
3 3 8 0.18 0.61 0.20 1 NA 0.99 0.99
4 3 7 0.00 0.87 0.13 0 NA 0.96 0.96
5 3 8 0.40 0.49 0.11 1 NA 0.95 0.99
6 3 9 0.08 0.74 0.18 1 NA 0.97 0.98
7 3 8 0.33 0.53 0.15 0.99 NA 0.97 0.98
8 3 8 0.31 0.56 0.13 0.98 NA 0.97 0.98
11 3 8 0.29 0.59 0.12 0.99 NA 0.96 0.98
Page 47
Smarter Balanced 2014-15 and 2015-16 Interim Assessment Technical Report
Chapter 2 Addendum
2-20
References
American Institutes for Research (2014a). Smarter Balanced scoring specification: 2014-2015
administration. Los Angeles, CA: Smarter Balanced Assessment Consortium.
American Institutes for Research. (2014b). Testing procedures for adaptive item-selection algorithm.
Los Angeles, CA: Smarter Balanced Assessment Consortium. Retrieved from
http://www.smarterbalanced.org/assessments/development/additional-technical-
documentation/http://www.smarterbalanced.org/assessments/development/additional-
technical-documentation/
Cai, L. (2017). flexMIRT® version 3.51: Flexible multilevel multidimensional item analysis and test
scoring [Computer software]. Chapel Hill, NC: Vector Psychometric Group
Cohen, J. & Albright, L. (2014). Smarter Balanced adaptive item selection algorithm design report.
Los Angeles, CA: Smarter Balanced Assessment Consortium. Retrieved from
http://www.smarterapp.org/specs/AdaptiveAlgorithm.html
Edelen, M. O., Stucky, B. D., & Chandra, A. (2015). Quantifying ‘problematic’ DIF within an IRT
framework: Application to a cancer stigma index. Quality of Life Research, 24(1), 95-103.
National Center for Research on Evaluation, Standards, & Student Testing. (2015a). Simulation-
based evaluation of the smarter balanced summative assessments. Los Angeles, CA:
Smarter Balanced Assessment Consortium. Retrieved from
http://www.smarterbalanced.org/assessments/development/additional-technical-
documentation/
National Center for Research on Evaluation, Standards, & Student Testing. (2015b). Initial report on
the calibration of paper and pencil forms. Los Angeles, CA: Smarter Balanced Assessment
Consortium. Retrieved from
http://www.smarterbalanced.org/assessments/development/additional-technical-
documentation/
National Center for Research on Evaluation, Standards, & Student Testing. (2016). Simulation-based
evaluation of the 2014-2015 smarter balanced summative assessments: accommodated
item pools. Los Angeles, CA: Smarter Balanced Assessment Consortium. Retrieved from
http://www.smarterbalanced.org/assessments/development/additional-technical-
documentation/http://www.smarterbalanced.org/assessments/development/additional-
technical-documentation/
Smarter Balanced Assessment Consortium. (2014). 2013-2014 Technical report. Los Angeles, CA:
Author. Retrieved from https://portal.smarterbalanced.org/library/en/2013-14-technical-
report.pdf
Smarter Balanced Assessment Consortium. (2015). 2014-2015 Scoring Specifications. Los Angeles,
CA: Author. Retrieved from http://www.smarterapp.org/documents/TestScoringSpecs2014-
2015.pdf
Smarter Balanced Assessment Consortium (2016). Smarter Balanced Assessment Consortium:
2014-15 Technical Report. Retrieved from
https://portal.smarterbalanced.org/library/en/2014-15-technical-report.pdf
Page 48
Smarter Balanced 2014-15 and 2015-16 Interim Assessment Technical Report
Chapter 3: Test Fairness
3-1
Chapter 3: Test Fairness
Page 49
Smarter Balanced 2014-15 and 2015-16 Interim Assessment Technical Report
Chapter 3: Test Fairness
3-2
Introduction
The Smarter Balanced Assessment Consortium (Smarter Balanced) has designed the assessment
system to provide all eligible students with a fair assessment and equitable opportunity to participate
in the Smarter Balanced Assessments. Issues around test fairness apply to the entire assessment
system including the summative and interim assessments. Ensuring test fairness is a fundamental
part of validity, starting with test design, and is an important feature built into each step of the test
development process, such as item writing, test administration, and scoring. The 2014 Standards for
Educational and Psychological Testing (AERA, APA, & NCME,2014, p. 49) state, “The term fairness
has no single technical meaning, and is used in many ways in public discourse.” It also suggests that
fairness to all individuals in the intended population is an overriding and fundamental validity
concern. As indicated in the Standards (2014, p. 63), “The central idea of fairness in testing is to
identify and remove construct-irrelevant barriers to maximal performance for any examinee.”
The Smarter Balanced assessment system is designed to provide a valid, reliable, and fair measure
of student achievement based on the Common Core State Standards1 (CCSS). The validity and
fairness of the measures of student achievement are influenced by a multitude of factors; central
among them are:
• a clear definition of the construct—the knowledge, skills, and abilities—that are intended to
be measured,
• the development of items and tasks that are explicitly designed to assess the construct that
is the target of measurement,
• delivery of items and tasks that enable students to demonstrate their achievement of the
construct
• capture and scoring of responses to those items and tasks.
Smarter Balanced uses several processes to address reliability, validity, and fairness. The interim
assessments use the same content specifications as the summative assessments and are fully
accessible. This means that students have access to the same resources on the interim
assessments that are available on the summative assessments. The Smarter Balanced Content
Specifications for the Summative Assessment of the CCSS for English Language Arts/Literacy and
the Smarter Balanced Content Specifications for the Summative Assessment of the CCSS for
Mathematics, developed by Smarter Balanced (2015a; 2015b), define the knowledge, skills, and
abilities to be assessed and their relationship to the CCSS. In doing so, these documents describe
the major constructs—identified as “Claims”—within ELA/literacy and mathematics for which
evidence of student achievement is gathered and which forms the basis for reporting student
performance. Each claim is accompanied by a set of assessment targets that provide more detail
about the range of content and Depth of Knowledge levels. The targets serve as the building blocks
of test blueprints. Much of the evidence presented in this chapter pertains to fairness to students
during the testing process and design elements and procedures that serve to minimize
measurement bias. Fairness in item and test design processes and the design of accessibility
supports (i.e., universal tools, designated supports and accommodations) in content development
are also addressed.
Attention to bias and sensitivity in test development. According to the Standards, bias is “construct
underrepresentation or construct-irrelevant components of tests scores that differentially affect the
performance of different groups of test takers and consequently the reliability/precision and validity
of interpretations and uses of their test scores.” (AERA, APA, & NCME, 2014, p. 216). “Sensitivity”
refers to an awareness of the need to avoid explicit bias in assessment. In common usage, reviews
1 http://www.corestandards.org/
Page 50
Smarter Balanced 2014-15 and 2015-16 Interim Assessment Technical Report
Chapter 3: Test Fairness
3-3
of tests for bias and sensitivity help ensure that test items and stimuli are fair for various groups of
test takers (AERA, APA, & NCME, 2014, p. 64).
The goal of fairness in assessment is to assure that test materials are as free as possible from
unnecessary barriers to the success of diverse groups of students. Smarter Balanced developed Bias
and Sensitivity Guidelines (ETS, 2012) to help ensure that the assessments are fair for all groups of
test takers, despite differences in characteristics including, but not limited to, disability status, ethnic
group, gender, regional background, native language, race, religion, sexual orientation, and
socioeconomic status. Unnecessary barriers can be reduced by following some fundamental rules:
• measuring only knowledge or skills that are relevant to the intended construct
• not angering, offending, upsetting, or otherwise distracting test takers, and
• treating all groups of people with appropriate respect in test materials.
These rules help ensure that the test content is fair for test takers as well as acceptable to the many
stakeholders and constituent groups within Smarter Balanced member organizations. Fairness must
be considered in all phases of test development and use. Smarter Balanced strongly relied on the
Bias and Sensitivity Guidelines in the development and design phases of the Smarter Balanced
assessments, including the training of item writers, item writing and review. Smarter Balanced’s
focus and attention on bias and sensitivity comply with Chapter 3, Standard 3.2 of the Standards
states that: “Test developers are responsible for developing tests that measure the intended
construct and for minimizing the potential for tests being affected by construct-irrelevant
characteristics such as linguistic, communicative, cognitive, cultural, physical or other
characteristics.” (AERA, APA, & NCME., 2014, p. 64).
The Smarter Balanced Accessibility and Accommodations Framework
Smarter Balanced has built a framework of accessibility for all students, including English Learners
(ELs), students with disabilities, and ELs with disabilities, but not limited to those groups. Three
resources—the Smarter Balanced Item Specifications (2015c), the Smarter Balanced General
Accessibility Guidelines (2012), and the Smarter Balanced Bias and Sensitivity Guidelines (ETS,
2012)—are used to guide the development of the assessments, items and tasks to ensure that they
accurately measure the targeted constructs. Recognizing the diverse characteristics and needs of
students who participate in the Smarter Balanced assessments, the states worked together through
the Smarter Balanced Test Administration and Student Access Work Group to develop an
Accessibility and Accommodations Framework (2014a) that guided the Consortium as it worked to
reach agreement on the specific universal tools, designated supports, and accommodations
available for the assessments. This work also incorporated research and practical lessons learned
through Universal Design, accessibility tools, and accommodations (Thompson, Johnstone, &
Thurlow, 2002).
In the process of developing its next-generation assessments to measure students’ knowledge and
skills as they progress toward college and career readiness, Smarter Balanced recognized that the
validity of assessment results depends on each student having appropriate universal tools,
designated supports, and accommodations when needed, based on the constructs being measured
by the assessment. The Smarter Balanced Assessment System uses technology intended to deliver
assessments that meet the needs of individual students to help ensure that the test is fair.
Online/electronic delivery of the assessments helps ensure that students are administered a test
individualized to meet their needs while still measuring the same construct. During the
administration of tests, items and tasks are delivered using a variety of accessibility resources and
accommodations that can be administered to students automatically based on their individual
profiles. Accessibility resources include but are not limited to foreground and background color
flexibility, tactile presentation of content (e.g., braille), and translated presentation of assessment
Page 51
Smarter Balanced 2014-15 and 2015-16 Interim Assessment Technical Report
Chapter 3: Test Fairness
3-4
content in signed form and selected spoken languages. The complete list of universal tools,
designated supports and accommodations with a description of each and recommendations for use
can be found in the Smarter Balanced Usability, Accessibility, and Accommodations Guidelines. The
conceptual model underlying the Smarter Balanced Usability, Accessibility, and Accommodations
Guidelines (Smarter Balanced Assessment Consortium, 2016) is shown in Figure 3.1.
FIGURE 3.1 CONCEPTUAL MODEL UNDERLYING THE SMARTER BALANCED USABILITY, ACCESSIBILITY, AND
ACCOMMODATIONS GUIDELINES. FROM USABILITY ACCESSIBILITY AND ACCOMMODATIONS GUIDELINES (P. 4), 2014.
Smarter Balanced adopted a common set of universal tools, designated supports and
accommodations. As a starting point, Smarter Balanced surveyed all members to determine their
past practices. From these data, Smarter Balanced worked with members and used a deliberative
analysis strategy as described in Accommodations for English Language Learners and Students with
Disabilities: A Research-Based Decision Algorithm (Abedi & Ewers, 2013) to determine which
accessibility resources should be made available during the assessment and whether access to
these resources should be moderated by an adult. As a result, some accessibility resources that
states traditionally had identified as accommodations were instead embedded in the test or
otherwise incorporated into the Smarter Balanced assessments as universal tools or Designated
Supports. Other resources were not incorporated into the assessment because access to these
resources were not grounded in research or were determined to interfere with the construct
Page 52
Smarter Balanced 2014-15 and 2015-16 Interim Assessment Technical Report
Chapter 3: Test Fairness
3-5
measured. The final list of accessibility resources and the recommended use of the resources can be
found in the Usability, Accessibility, and Accommodations Guidelines (2016, pp. 6-21).
A fundamental goal was to design an assessment that is accessible for all students, regardless of
English language proficiency, disability, or other individual circumstances. The three components
(Universal tools, designed supports, and accommodations) of the Accessibility and Accommodations
Framework are designed to meet that need. The intent was to:
• Design and develop items and tasks to ensure that all students have access to the items and
tasks designed to measure the targeted constructs. In addition, deliver items, tasks, and the
collection of student responses in a way that maximizes validity for each student.
• Adopt the conceptual model embodied in the Accessibility and Accommodations Framework
that describes accessibility resources of digitally delivered items/tasks and acknowledges
the need for some adult-monitored accommodations. The model also characterizes
accessibility resources as a continuum from those available to all students ranging to ones
that are implemented under adult supervision available only to those students with a
documented need.
• Implement the use of an individualized and systematic needs profile for students, or
Individual Student Assessment Accessibility Profile (ISAAP), that promotes the provision of
appropriate access and tools for each student. Smarter created an ISAAP process that helps
education teams systematically select the most appropriate accessibility resources for each
student and the ISAAP tool, which helps teams note the accessibility resources chosen.
The conceptual framework that serves as the basis underlying the Usability, Accessibility, and
Accommodations Guidelines is shown in Figure 3.1. This figure portrays several aspects of the
Smarter Balanced assessment resources—universal tools (available for all students), designated
supports (available when indicated by an adult or team), and accommodations as documented in an
Individualized Education Program (IEP) or 504 plan. It also displays the additive and sequentially
inclusive nature of these three aspects. Universal tools are available to all students, including those
receiving designated supports and those receiving accommodations. Designated supports are
available only to students who have been identified as needing these resources (as well as those
students for whom the need is documented). Accommodations are available only to those students
with documentation of the need through a formal plan (e.g., IEP, 504). Those students also may
access designated supports and universal tools.
A universal tool or a designated support may also be an accommodation, depending on the content
target and grade. This approach is consistent with the emphasis that Smarter Balanced has placed
on the validity of assessment results coupled with access. Universal tools, designated supports, and
accommodations are all intended to yield valid scores. Also shown in Figure 3.1 are the universal
tools, designated supports, and accommodations for each category of accessibility resources.
Accessibility resources may be embedded or non-embedded; the distinction is based on how the
resource is provided (either within digitally delivered components of the test or outside of the test
delivery system).
Meeting the Needs of Traditionally Underrepresented Populations.
The policy decision was to make accessibility resources available to all students based on need
rather than eligibility status or student subgroup categorical designation. This reflects a belief among
Consortium states that unnecessarily restricting access to accessibility resources threatens the
validity of the assessment results and places students under undue stress and frustration.
Additionally, accommodations are available for students who qualify for them. The Consortium
utilizes a needs-based approach to providing accessibility resources. A description as to how this
benefits ELs, students with disabilities, and ELs with disabilities is presented here.
Page 53
Smarter Balanced 2014-15 and 2015-16 Interim Assessment Technical Report
Chapter 3: Test Fairness
3-6
How the Framework Meets Needs of Students Who Are ELs.
Students who are ELs have needs that are different from students with disabilities, including
language-related disabilities. The needs of ELs are not the result of a language-related disability, but
instead are specific to the student’s current level of English language proficiency. The needs of ELs
are diverse and are influenced by the interaction of several factors, including their current level of
English language proficiency, their prior exposure to academic content and language in their native
language, the languages to which they are exposed outside of school, the length of time they have
participated in the U.S. education system, and the language(s) in which academic content is
presented in the classroom. Given the unique background and needs of each student, the
conceptual framework is designed to focus on students as individuals and to provide several
accessibility resources that can be combined in a variety of ways. Some of these digital tools, such
as using a highlighter to highlight key information and an audio presentation of test navigation
features, are available to all students, including those at various stages of English language
development. Other tools, such as the audio presentation of items and glossary definitions in
English, may also be assigned to any student, including those at various stages of English language
development. Still other tools, such as embedded glossaries that present translations of construct
irrelevant terms, are intended for those students whose prior language experiences would allow
them to benefit from translations into another language. Collectively, the conceptual framework for
usability, accessibility, and accommodations embraces a variety of accessibility resources that have
been designed to meet the needs of students at various stages in their English language
development.
How the Framework Meets Needs of Students with Disabilities.
Federal law ((Individuals with Disabilities Education Act, 2004) requires that students with
disabilities who have a documented need receive accommodations that address those needs, and
that they participate in assessments. The intent of the law is to ensure that all students have
appropriate access to instructional materials and are held to the same high standards. When
students are assessed, the law ensures that students receive appropriate accommodations during
testing so they can appropriately demonstrate what they know and can do so that their achievement
is measured accurately.
The Accessibility and Accommodations Framework addresses the needs of students with disabilities
in three ways. First, it provides for the use of digital test items that are purposefully designed to
contain multiple forms of the item, each developed to address a specific access need. By allowing
the delivery of a given item to be tailored based on each student’s accommodation, the Framework
fulfills the intent of federal accommodation legislation. Embedding universal accessibility digital
tools, however, addresses only a portion of the access needs required by many students with
disabilities. Second, by embedding accessibility resources in the digital test delivery system,
additional access needs are met. This approach fulfills the intent of the law for many, but not all,
students with disabilities, by allowing the accessibility resources to be activated for students based
on their needs. Third, by allowing for a wide variety of digital and locally provided accommodations
(including physical arrangements), the Framework addresses a spectrum of accessibility resources
appropriate for mathematics and ELA/literacy assessment. Collectively, the Framework adheres to
federal regulations by allowing a combination of universal design principles, universal tools,
designated supports and accommodations to be embedded in a digital delivery system and assigned
and provided based on individual student needs. Therefore, a student with a disability benefits from
the system, because they may be eligible to have access to resources from any of the 3 categories
as necessary to create an assessment tailored to their individual need.
Page 54
Smarter Balanced 2014-15 and 2015-16 Interim Assessment Technical Report
Chapter 3: Test Fairness
3-7
The Individual Student Assessment Accessibility Profile (ISAAP).
Typical practice frequently required schools and educators to document, a priori, the need for
specific student accommodations and then to document the use of those accommodations after the
assessment. For example, most programs require schools to document a student’s need for a large-
print version of a test for delivery to the school. Following the test administration, the school
documented (often by bubbling in information on an answer sheet) which of the accommodations, if
any, a given student received, whether the student actually used the large-print form, and whether
any other accommodations were provided.
Universal tools are available by default in the Smarter Balanced test delivery system. These tools can
be deactivated if they create an unnecessary distraction for the student. Embedded Designated
Supports and Accommodations must be enabled by an informed educator or group of educators,
with the student when appropriate. To facilitate the decision making process around individual
student accessibility needs, Smarter Balanced has established an individual student assessment
accessibility profile (ISAAP). The ISAAP Tool is designed to facilitate selection of the universal tools,
designated supports and accommodations that match student access needs for the Smarter
Balanced assessments, as supported by the Smarter Balanced Usability, Accessibility, and
Accommodations Guidelines. Smarter Balanced recommends that the ISAAP Tool2 be used in
conjunction with the Smarter Balanced Usability, Accessibility and Accommodations Guidelines and
state regulations and policies related to assessment accessibility as a part of the ISAAP process. For
students requiring one or more accessibility resources, schools are able to document this need prior
to test administration. Furthermore, the ISAAP can include information about universal tools that
may need to be eliminated for a given student. By documenting needs prior to test administration, a
digital delivery system is able to activate the specified options when the student logs in to an
assessment. In this way, the profile permits school-level personnel to focus on each individual
student, documenting the accessibility resources required for valid assessment of that student in a
way that is efficient to manage.
The conceptual framework shown in Figure 3.1 provides a structure that assists in identifying which
accessibility resources should be made available for each student. In addition, the conceptual
framework is designed to differentiate between universal tools available to all students and
accessibility resources that must be assigned before the administration of the assessment.
Consistent with recommendations from Shafer and Rivera (2011), Thurlow, Quenemoen, and
Lazarus (2011), Fedorchak (2012), and Russell (2011), Smarter Balanced is encouraging school-
level personnel to use a team approach to make decisions concerning each student’s ISAAP. Gaining
input from individuals with multiple perspectives, including the student, likely results in appropriate
decisions about the assignment of accessibility resources. Consistent with these recommendations
is the avoidance of selecting too many accessibility resources for a student. The use of too many
unneeded accessibility resources can decrease student performance.
Usability, Accessibility, and Accommodations Guidelines: Intended Audience and Recommended
Applications.
Smarter Balanced developed the Usability, Accessibility, and Accommodations Guidelines (UAAG) for
its members to guide the selection and administration of universal tools, designated supports, and
accommodations. All ICAs and IABs are fully accessible and include ASL, Braille, and Spanish. It is
intended for school-level personnel and decision-making teams, particularly Individualized Education
Program (IEP) teams, as they prepare for and implement the Smarter Balanced summative and
interim assessments. The UAAG provides information for classroom teachers, English development
2 http://52.11.155.96/static/isaap/index.html
Page 55
Smarter Balanced 2014-15 and 2015-16 Interim Assessment Technical Report
Chapter 3: Test Fairness
3-8
educators, special education teachers, and related services personnel in selecting and administering
universal tools, designated supports, and accommodations for those students who need them. The
UAAG is also intended for assessment staff and administrators who oversee the decisions that are
made in instruction and assessment. It emphasizes an individualized approach to the
implementation of assessment practices for those students who have diverse needs and participate
in large-scale assessments. This document focuses on universal tools, designated supports, and
accommodations for the Smarter Balanced summative and interim assessments in ELA/literacy and
mathematics. At the same time, it supports important instructional decisions about accessibility for
students. It recognizes the critical connection between accessibility in instruction and accessibility
during assessment. The UAAG is also incorporated into the Smarter Balanced Test Administration
Manuals (Smarter Balanced Assessment Consortium, 2014b).
Fairness as a Lack of Measurement Bias: Differential Item Functioning Analyses
As part of the validity evidence from internal structure, differential item functioning (DIF) analyses
were conducted on items using data from the 2014 field test. It should be noted that the item pool
for the interim assessments is derived from the item pool used in the field test such that items from
this larger item pool were assigned to the interim and summative assessments after being field
tested. This section presents the evidence to support the frameworks’ claims using data from the
2014 field test. DIF analyses are used to identify those items for which identifiable groups of
students (e.g., males, females) with the same underlying level of ability have different probabilities of
answering an item correctly or obtaining a given score level. Students data are aggregated according
to the reported subgroups (e.g. ethnicity, gender, and English language proficiency) for DIF analyses.
Students in each subgroup are then ranked relative to their total test score (conditioning on ability).
Students in the focal group (e.g., females) are then compared to students in the reference group
(e.g., males) relative to their performance on individual items. It is part of the Smarter Balanced
framework to have ongoing study and review of findings to inform iterative, data-driven decisions.
If items are more difficult for some groups of students than for other groups of students, the items
may not necessarily be unfair. For example, if an item were intended to measure the ability to
comprehend a reading passage in English, score differences between groups based on real
differences in comprehension of English would be valid and, therefore, fair. As Cole and Zieky (2001,
p. 375) noted, “If the members of the measurement community currently agree on any aspect of
fairness, it is that score differences alone are not proof of bias.” Fairness does not require that all
groups have the same average item score. Fairness requires assuring that differences in response
patterns to be valid. Evaluations of validity include examination of differences in responses for
groups of students matched on overall ability. An item would be unfair if the source of the difficulty
were not a valid aspect of the item. For example, an item would be unfair if members of a group of
test takers were distracted by an aspect of the item that they found highly offensive. If the difference
in difficulty reflected real and relevant differences in the group’s level of mastery of the tested CCSS,
the item should be considered fair.
Differential Item Functioning (DIF) Analyses for the Calibration Item Pool
Differential item functioning (DIF) analyses were performed on the items during field testing. DIF
analyses are used to identify those items that identify groups of students (e.g., males versus
females) with the same underlying level of ability that have different probabilities of answering an
item correctly. To perform a DIF analysis, student data are aggregated according to the reported
subgroups. Students in each subgroup are then ranked relative to their total test score (conditioning
on ability). Item performance from the focal group to be examined (e.g., females) is compared
conditionally based on ability with the reference group (e.g., males). The definitions for the focal and
references groups used are given in Table 3.2. A DIF analysis asks, “If we compare focal-group and
reference-group students of the same overall ability (as indicated by their performance on the full
Page 56
Smarter Balanced 2014-15 and 2015-16 Interim Assessment Technical Report
Chapter 3: Test Fairness
3-9
test), are any test items appreciably more difficult for one group compared with another group?” DIF
in this context is viewed as a potential source of invalidity.
DIF statistics are used to identify items that are functioning differentially. Subsequent reviews by
content experts and bias/sensitivity committees are required to determine the source and meaning
of performance differences. If the item is differentially more difficult for an identifiable subgroup
when conditioned on ability, it may be measuring something different from the intended construct.
However, it is important to recognize that DIF-flagged items might be related to actual differences in
relevant knowledge or statistical Type I error. Final decisions about the resolution of item DIF are
made by a multi-disciplinary panel of content experts.
TABLE 3.2 DEFINITION OF FOCAL AND REFERENCE GROUPS
Group Type Focal Groups Reference Groups
Gender Female Male
Ethnicity African American White
Asian/Pacific Islander
Native American/Alaska Native
Hispanic
Special Populations Limited English Proficient (LEP) English Proficient
Individualized Education Program (IEP) No IEP
Title 1 Not Title 1
Page 57
Smarter Balanced 2014-15 and 2015-16 Interim Assessment Technical Report
Chapter 3: Test Fairness
3-10
TABLE 3.3 DIF FLAGGING LOGIC FOR SELECTED-RESPONSE ITEMS
DIF Category Definition
A (negligible) Absolute value of the MH D-DIF is not significantly different from zero, or is less
than one.
B (slight to moderate) Absolute value of the MH D-DIF is significantly different from zero but not from
one, and is at least one; or
Absolute value of the MH D-DIF is significantly different from one, but less than
1.5.
Positive values are classified as “B+” and negative values as “B-”
C (moderate to large) Absolute value of the MH D-DIF is significantly different from 1, and is at least
1.5; and
Absolute value of the MH D-DIF is larger than 1.96 times the standard error of
MH D-DIF.
Positive values are classified as “C+” and negative values as “C-“
TABLE 3.4 DIF FLAGGING LOGIC FOR CONSTRUCTED RESPONSE ITEMS
DIF Category Definition
A (negligible) Mantel p-value >0.05 or chi-square |SMD/SD| 0.17
B (slight to moderate) Mantel chi-square p-value <0.05 and |SMD/SD| >0.17, but ≤0.25
C (moderate to large) Mantel chi-square p-value <0.05 and |SMD/SD| > 0.25
Items are classified into three DIF categories of “A,” “B,” or “C.” DIF Category A items contain
negligible DIF, Category B items exhibit slight or moderate DIF, and Category C items have moderate
to large values of DIF. Positive values favor the focus group, and negative values are in favor of the
reference group. The positive and negative values are reported for C-DIF item flagging. DIF analyses
were not conducted if the sample size for either the reference group or the focal group was less than
100 or if the sample size for the two combined groups was less than 400. In subsequent tables, A
levels of DIF are not flagged as they are too small to have perceptible interpretation.
Different DIF analysis procedures are used for dichotomous items (items with 0/1 score categories;
selected-response items) and polytomous items (items with more than two score categories;
constructed-response items). Statistics from two DIF detection methods are computed. The Mantel-
Haenszel procedure (Mantel & Haenszel, 1959) and the standardized mean difference (SMD)
procedure (Dorans & Kulick, 1983, 1986) are used for dichotomous and polytomous items
respectively. Selected-response items are classified into DIF categories of A, B, and C, as described
in Table 3.3 and constructed response items are classified into DIF categories of A, B, and C, as
described in Table 3.4. Further details about the specifics on estimating DIF can be found in
Appendix A.
A relatively small number of items showed performance differences between student groups as
indicated by C-DIF flagging criteria. Table 3-4 and Table 3-5 show the number of items flagged for all
Page 58
Smarter Balanced 2014-15 and 2015-16 Interim Assessment Technical Report
Chapter 3: Test Fairness
3-11
categories of DIF for ELA/literacy and mathematics in grades 3 – 8 and 11 for the ICAs and Table
3-6 and Table 3-7 show the number of items flagged for all categories of DIF for ELA/literacy and
mathematics in grades 3 – 8 and 11 for the IABs. All items had previously undergone bias reviews.
Content editors inspected B and C DIF items and C DIF items were reviewed by committees of
content and accessibility professionals during data review meetings. The task of the review meetings
was to either accept items if the statistical differences were not caused by content issues or bias
issues or reject items if the item was found to be flawed. Only items approved by a multi-disciplinary
panel of experts are eligible to be used on Smarter Balanced summative or interim assessments.
Page 59
Smarter Balanced 2014-15 and 2015-16 Interim Assessment Technical Report
Chapter 3: Test Fairness
3-12
TABLE 3-4 NUMBER OF DIF ITEMS IN ITEM POOLS FLAGGED BY CATEGORY FOR ICA (ELA/LITERACY, GRADES 3-8 AND
11)
Grade DIF
Category
Focal group/Referent Group
Female/
Male
Asian/
White
Black/
White
Hispanic/
White
Native
American/
White
IEP/Non-
IEP
LEP/Non
-LEP
Title1/N
on-Title1
3 N/A 0 3 1 0 15 0 0 0
3 A 46 41 46 47 32 47 47 48
3 B- 0 1 1 1 1 0 1 0
3 B+ 2 3 0 0 0 1 0 0
3 C- 0 0 0 0 0 0 0 0
3 C+ 0 0 0 0 0 0 0 0
4 N/A 0 0 0 0 13 0 0 0
4 A 48 48 49 49 34 48 49 49
4 B- 0 1 0 0 2 1 0 0
4 B+ 1 0 0 0 0 0 0 0
4 C- 0 0 0 0 0 0 0 0
4 C+ 0 0 0 0 0 0 0 0
5 N/A 0 1 0 0 18 0 0 0
5 A 47 45 46 45 27 48 47 48
5 B- 0 2 2 2 2 0 1 0
5 B+ 1 0 0 1 1 0 0 0
5 C- 0 0 0 0 0 0 0 0
5 C+ 0 0 0 0 0 0 0 0
6 N/A 0 3 1 0 18 0 2 0
6 A 46 45 48 49 30 48 46 49
6 B- 0 0 0 0 1 1 0 0
6 B+ 2 1 0 0 0 0 1 0
6 C- 0 0 0 0 0 0 0 0
6 C+ 1 0 0 0 0 0 0 0
7 N/A 0 1 1 0 14 1 1 0
7 A 46 46 45 49 35 48 48 49
7 B- 1 0 0 0 0 0 0 0
7 B+ 2 2 3 0 0 0 0 0
7 C- 0 0 0 0 0 0 0 0
7 C+ 0 0 0 0 0 0 0 0
8 N/A 0 0 0 0 11 0 0 0
Page 60
Smarter Balanced 2014-15 and 2015-16 Interim Assessment Technical Report
Chapter 3: Test Fairness
3-13
Grade DIF
Category
Focal group/Referent Group
Female/
Male
Asian/
White
Black/
White
Hispanic/
White
Native
American/
White
IEP/Non-
IEP
LEP/Non
-LEP
Title1/N
on-Title1
8 A 47 48 49 49 37 50 49 50
8 B- 0 1 0 1 1 0 0 0
8 B+ 2 1 1 0 1 0 0 0
8 C- 0 0 0 0 0 0 1 0
8 C+ 1 0 0 0 0 0 0 0
11 N/A 0 0 0 0 35 0 1 0
11 A 45 45 47 46 12 44 45 47
11 B- 1 1 0 1 0 2 0 0
11 B+ 1 1 0 0 0 1 0 0
11 C- 0 0 0 0 0 0 1 0
11 C+ 0 0 0 0 0 0 0 0
Page 61
Smarter Balanced 2014-15 and 2015-16 Interim Assessment Technical Report
Chapter 3: Test Fairness
3-14
TABLE 3-5 NUMBER OF DIF ITEMS IN ITEM POOLS FLAGGED BY CATEGORY FOR ICA (MATHEMATICS, GRADES 3-8 AND
11)
Grade DIF
Category
Focal group/Referent Group
Female/
Male
Asian/
White
Black/
White
Hispanic/
White
Native
American
/White
IEP/Non-
IEP
LEP/Non
-LEP
Title1/No
n-Title1
3 N/A 0 0 0 0 30 0 0 0
3 A 37 34 34 35 7 37 36 37
3 B- 0 0 1 0 0 0 0 0
3 B+ 0 3 2 1 0 0 0 0
3 C- 0 0 0 1 0 0 1 0
3 C+ 0 0 0 0 0 0 0 0
4 N/A 0 1 0 0 6 0 0 0
4 A 35 33 35 36 28 36 36 36
4 B- 0 1 0 0 2 0 0 0
4 B+ 1 1 1 0 0 0 0 0
4 C- 0 0 0 0 0 0 0 0
4 C+ 0 0 0 0 0 0 0 0
5 N/A 0 0 0 0 10 0 0 0
5 A 37 32 36 37 27 37 36 37
5 B- 0 1 0 0 0 0 1 0
5 B+ 0 4 1 0 0 0 0 0
5 C- 0 0 0 0 0 0 0 0
5 C+ 0 0 0 0 0 0 0 0
6 N/A 0 0 0 0 35 0 0 0
6 A 36 36 36 36 1 36 36 36
6 B- 0 0 0 0 0 0 0 0
6 B+ 0 0 0 0 0 0 0 0
6 C- 0 0 0 0 0 0 0 0
6 C+ 0 0 0 0 0 0 0 0
7 N/A 0 0 0 0 37 0 0 0
7 A 35 35 37 36 0 34 35 37
7 B- 1 0 0 0 0 0 2 0
7 B+ 1 2 0 1 0 3 0 0
7 C- 0 0 0 0 0 0 0 0
7 C+ 0 0 0 0 0 0 0 0
8 N/A 0 2 0 0 36 0 0 0
Page 62
Smarter Balanced 2014-15 and 2015-16 Interim Assessment Technical Report
Chapter 3: Test Fairness
3-15
Grade DIF
Category
Focal group/Referent Group
Female/
Male
Asian/
White
Black/
White
Hispanic/
White
Native
American
/White
IEP/Non-
IEP
LEP/Non
-LEP
Title1/No
n-Title1
8 A 37 29 36 35 1 36 36 37
8 B- 0 3 0 2 0 0 0 0
8 B+ 0 2 1 0 0 1 1 0
8 C- 0 1 0 0 0 0 0 0
8 C+ 0 0 0 0 0 0 0 0
11 N/A 0 3 1 0 39 2 3 0
11 A 37 32 36 39 0 34 34 39
11 B- 1 1 1 0 0 0 1 0
11 B+ 1 2 1 0 0 3 0 0
11 C- 0 0 0 0 0 0 0 0
11 C+ 0 1 0 0 0 0 1 0
TABLE 3-6 NUMBER OF DIF ITEMS IN ITEM POOLS FLAGGED BY CATEGORY FOR IAB (ELA/LITERACY, GRADES 3-8 AND
11)
Grade DIF
Category
Focal group/Referent Group
Female/
Male
Asian/
White
Black/
White
Hispanic/
White
Native
American
/White
IEP/Non-
IEP
LEP/Non
-LEP
Title1/Non
-Title1
3 N/A 0 11 5 1 48 4 2 0
3 A 85 73 80 87 39 79 83 89
3 B- 0 2 2 0 2 2 3 0
3 B+ 4 3 2 0 0 4 1 0
3 C- 0 0 0 1 0 0 0 0
3 C+ 0 0 0 0 0 0 0 0
4 N/A 0 7 3 0 35 4 0 0
4 A 86 80 85 88 52 83 89 89
4 B- 0 1 0 0 2 2 0 0
4 B+ 2 1 1 1 0 0 0 0
4 C- 0 0 0 0 0 0 0 0
4 C+ 1 0 0 0 0 0 0 0
5 N/A 0 8 0 0 40 0 0 0
5 A 78 73 83 84 42 85 83 85
5 B- 3 2 2 1 2 0 2 0
5 B+ 4 2 0 0 1 0 0 0
Page 63
Smarter Balanced 2014-15 and 2015-16 Interim Assessment Technical Report
Chapter 3: Test Fairness
3-16
Grade DIF
Category
Focal group/Referent Group
Female/
Male
Asian/
White
Black/
White
Hispanic/
White
Native
American
/White
IEP/Non-
IEP
LEP/Non
-LEP
Title1/Non
-Title1
5 C- 0 0 0 0 0 0 0 0
5 C+ 0 0 0 0 0 0 0 0
6 N/A 0 8 1 1 48 1 4 0
6 A 88 80 90 90 44 89 86 92
6 B- 1 2 0 1 0 2 1 0
6 B+ 3 1 1 0 0 0 1 0
6 C- 0 1 0 0 0 0 0 0
6 C+ 0 0 0 0 0 0 0 0
7 N/A 0 6 6 2 43 5 5 0
7 A 84 79 82 87 47 85 81 90
7 B- 2 3 0 0 0 0 4 0
7 B+ 4 2 2 1 0 0 0 0
7 C- 0 0 0 0 0 0 0 0
7 C+ 0 0 0 0 0 0 0 0
8 N/A 0 9 4 0 33 5 8 0
8 A 84 77 84 84 55 83 77 89
8 B- 1 1 0 4 1 1 2 0
8 B+ 4 0 1 1 0 0 1 0
8 C- 0 2 0 0 0 0 1 0
8 C+ 0 0 0 0 0 0 0 0
11 N/A 0 12 10 0 72 11 24 0
11 A 87 74 81 88 20 77 66 92
11 B- 4 2 0 4 0 3 1 0
11 B+ 1 3 1 0 0 1 0 0
11 C- 0 0 0 0 0 0 1 0
11 C+ 0 1 0 0 0 0 0 0
Page 64
Smarter Balanced 2014-15 and 2015-16 Interim Assessment Technical Report
Chapter 3: Test Fairness
3-17
TABLE 3-7 NUMBER OF DIF ITEMS IN ITEM POOLS FLAGGED BY CATEGORY FOR IAB (MATHEMATICS, GRADES 3-8 AND
11)
Grade DIF
Category
Focal group/Referent Group
Female/
Male
Asian/
White
Black
/
White
Hispanic/
White
Native
America
n/White
IEP/No
n-IEP
LEP/Non-
LEP
Title1/No
n-Title1
3 N/A 0 1 0 0 43 0 0 0
3 A 51 46 48 50 8 50 50 51
3 B- 0 0 0 0 0 1 0 0
3 B+ 0 4 2 1 0 0 1 0
3 C- 0 0 1 0 0 0 0 0
3 C+ 0 0 0 0 0 0 0 0
4 N/A 0 1 1 0 11 0 0 0
4 A 51 48 49 51 39 52 52 52
4 B- 0 2 0 0 0 0 0 0
4 B+ 1 1 2 1 2 0 0 0
4 C- 0 0 0 0 0 0 0 0
4 C+ 0 0 0 0 0 0 0 0
5 N/A 0 1 2 0 16 0 0 0
5 A 51 45 47 51 33 51 49 51
5 B- 0 1 0 0 0 0 1 0
5 B+ 0 3 2 0 2 0 1 0
5 C- 0 0 0 0 0 0 0 0
5 C+ 0 1 0 0 0 0 0 0
6 N/A 0 0 0 0 46 0 0 0
6 A 48 45 46 48 2 48 48 48
6 B- 0 0 1 0 0 0 0 0
6 B+ 0 1 1 0 0 0 0 0
6 C- 0 1 0 0 0 0 0 0
6 C+ 0 1 0 0 0 0 0 0
7 N/A 0 0 0 0 48 0 0 0
7 A 48 45 47 48 1 45 49 49
7 B- 1 0 0 0 0 0 0 0
7 B+ 0 3 2 1 0 4 0 0
7 C- 0 0 0 0 0 0 0 0
7 C+ 0 1 0 0 0 0 0 0
8 N/A 0 3 0 0 49 0 0 0
Page 65
Smarter Balanced 2014-15 and 2015-16 Interim Assessment Technical Report
Chapter 3: Test Fairness
3-18
Grade DIF
Category
Focal group/Referent Group
Female/
Male
Asian/
White
Black
/
White
Hispanic/
White
Native
America
n/White
IEP/No
n-IEP
LEP/Non-
LEP
Title1/No
n-Title1
8 A 49 41 48 48 0 48 48 49
8 B- 0 3 0 1 0 0 1 0
8 B+ 0 1 1 0 0 1 0 0
8 C- 0 1 0 0 0 0 0 0
8 C+ 0 0 0 0 0 0 0 0
11 N/A 0 9 6 0 49 14 14 0
11 A 48 34 42 49 0 34 33 49
11 B- 0 1 0 0 0 0 0 0
11 B+ 1 5 1 0 0 1 1 0
11 C- 0 0 0 0 0 0 0 0
11 C+ 0 0 0 0 0 0 1 0
Note: In February, 2016, the Consortium’s Technical Advisory Committee suggested that these
criteria may be too conservative. Based on this advice, the Consortium may loosen its thresholds for
determining DIF. Any such change will be reported in subsequent technical manuals.
Test Fairness and Implications for Ongoing Research
There are many features of the Smarter Balanced assessments that support equitable assessment
across all groups of students. The interim assessments are developed using the principles of
evidence-centered design and universal test design. Test accommodations are provided for
students with disabilities, and language-tools and supports were developed for ELLs. The Consortium
developed a set of guidelines to facilitate accessibility to the assessments. In addition to these
general accessibility guidelines embedded in the conceptual framework, procedures for item writing
and reviewing and guidelines for creating audio, sign language, and tactile versions of the items
were implemented. Smarter Balanced developed guidelines for item development that aim toward
reducing construct-irrelevant language complexities for English language learners (Young, Pitoniak,
King, & Ayad, 2012) and comprehensive guidelines for bias and sensitivity (ETS, 2012), and a rubric
specifically geared towards scoring language complexity (Cook & MacDonald, 2013). In addition,
measurement bias was investigated using DIF methods. This evidence underscores the commitment
to fair and equitable assessment for all students, regardless of their gender, cultural heritage,
disability status, native language, and other characteristics.
Page 66
Smarter Balanced 2014-15 and 2015-16 Interim Assessment Technical Report
Chapter 3: Test Fairness
3-19
References
Abedi, J., & Ewers, N (2013). Accommodations for English language learners and students with
disabilities: A research-based decision algorithm. Available from
https://portal.smarterbalanced.org/library/en/accommodations-for-english-language-
learners-and-students-with-disabilities-a-research-based-decision-algorithm.pdf
Abedi, J., & Lord, C. (2001). The language factor in mathematics tests. Applied Measurement in
Education, 14, 219-234.
Abedi, J., Lord, C., & Plummer, J. (1995). Language background as a variable in NAEP mathematics
performance (CSE Technical Report 429). Los Angeles: University of California, National
Center for Research on Evaluation, Standards, and Student Testing.
American Educational Research Association, American Psychological Association, & National Council
on Measurement in Education. (2014). Standards for Educational and Psychological Testing.
Washington, DC: American Psychological Association.
August, D., Carlo, M., Dressler, C., & Snow, C. (2005). The critical role of vocabulary development for
English language learners. Learning Disability Research and Practice, 20(1), 50-57.
Bailey, A. L., Huang, B. H., Shin, H W., Farnsworth, T., & Butler, F. A., (2007) Developing academic
English language proficiency prototypes for 5th grade reading: Psychometric and linguistic
profiles of tasks (CSE Technical Report 727). Los Angeles: University of California, National
Center for Research on Evaluation, Standards, and Student Testing.
Bernhardt, E. (2005). Progress and procrastination in second language reading. Annual Review of
Applied Linguistics, 25, 133–150.
Borgioli, G. (2008). Equity for English language learners in mathematics classrooms. Teaching
Children Mathematics, 15, 185-191.
Cole, N.S., & Zieky, M. J. (2001). The New Faces of Fairness. Journal of Educational Measurement.
38, 4.
Cook, H.G. & McDonald, R. (2013). Tool to Evaluate Language Complexity of Test Items. Wisconsin
Center for Education Research. Retrieved from http://wcer-
web.ad.education.wisc.edu/docs/working-papers/Working_Paper_No_2013_05.pdf
Cummins, D. D., Kintsch, W., Reusser, K., & Weimer, R. (1988). The role of understanding in solving
word problems. Cognitive Psychology, 20, 405-438.
Dorans, N. J., & Kulick, E. (1983). Assessing unexpected differential item performance of female
candidates on SAT and TSWE forms administered in December 1977: An application of the
standardization approach (Research Report No. RR-83-09). Princeton, NJ: Educational
Testing Service
Dorans, N. J., & Kulick, E. (1986). Demonstrating the utility of the standardization approach to
assessing unexpected differential item performance on the Scholastic Aptitude Test. Journal
of Educational Measurement, 23, 355–368.
ETS. (2012). Smarter Balanced Assessment Consortium: Bias and Sensitivity Guidelines. Princeton,
NJ: ETS. Retrieved from http://www.smarterbalanced.org/wp-
content/uploads/2015/08/BiasandSensitivityGuidelines.pdf
Fedorchak, G. (2012). Access by design—Implications for equity and excellence in education. Draft
paper prepared for the Smarter Balanced Assessment Consortium.
Forster, K. I. & Olbrei, I. (1973). Semantic heuristics and syntactic trial. Cognition, 2, 319-347.
Page 67
Smarter Balanced 2014-15 and 2015-16 Interim Assessment Technical Report
Chapter 3: Test Fairness
3-20
Individuals with Disabilities Education Act, 20 U.S.C. § 1400 (2004).
Kopriva, R. (2010, September). Building on student strengths or how to test ELs against challenging
math (and science) standards when they don’t have the English yet. Common Core State
Standards Implementation Conference.
Mantel N. & Haenszel, W. 1959. Statistical aspects of the analysis of data from retrospective studies
of disease. Journal of the National Cancer Institute, 22, 719-748
Messick, S. (1989). Validity. In R. L. Linn (Ed.), Educational Measurement. Washington, DC: American
Council on Education.
Pitoniak, M., Young, J. W., Martiniello, M., King, T., Buteux, A., & Ginsburgh, M. (2009). Guidelines for
the assessment of English language learners. Princeton, NJ: Educational Testing Service.
Russell, M. (2011). Digital Test Delivery: Empowering Accessible Test Design to Increase Test Validity
for All Students. Paper prepared for Arabella Advisors.
Schachter, P. (1983). On syntactic categories. Bloomington, IN: Indiana University Linguistics Club.
Shafer W., L., & Rivera, C. (2011). Are EL needs being defined appropriately for the next generation
of computer-based tests? AccELLerate, 3(2), 12–14.
Smarter Balanced Assessment Consortium. (2012, April 16). General Accessibility Guidelines.
Retrieved from https://portal.smarterbalanced.org/library/en/general-accessibility-
guidelines.pdf
Smarter Balanced Assessment Consortium. (2014a). Accessibility and Accommodations Framework.
Retrieved from http://www.smarterbalanced.org/wp-
content/uploads/2015/09/Accessibility-and-Accommodations-Framework.pdf
Smarter Balanced Assessment Consortium (2014b). Online, summative, test administration manual:
Test of English language arts/literacy and mathematics. Los Angeles, CA: Author.
Smarter Balanced Assessment Consortium. (2015a). Content specifications for the summative
assessment of the common core state standards for English language arts and literacy in
history/social studies, science, and technical subjects. Retrieved from
http://www.smarterbalanced.org/wp-content/uploads/2015/08/ELA_Content_Specs.pdf
Smarter Balanced Assessment Consortium. (2015b). Content specifications for the summative
assessment of the common core state standards for mathematics. Retrieved from
http://www.smarterbalanced.org/wp-content/uploads/2015/08/Mathematics-Content-
Specifications.pdf
Smarter Balanced Assessment Consortium. (2015c). Item and task specifications. Retrieved from
http://www.smarterbalanced.org/assessments/development/
Smarter Balanced Assessment Consortium. (2016, July 1). Usability, Accessibility, and
Accommodations Guidelines. Retrieved from
https://portal.smarterbalanced.org/library/en/usability-accessibility-and-accommodations-
guidelines.pdf
Thurlow, M. L., Quenemoen, R. F., & Lazarus, S. S. (2011). Meeting the Needs of Special Education
Students: Recommendations for the Race to the Top Consortia and States. Paper prepared
for Arabella Advisors.
Young, J., Pitoniak, M. J., King, T. C., & Ayad, E. (2012). Smarter Balanced Assessment Consortium:
Guidelines for Accessibility for English Language Learners. Retrieved from
Page 68
Smarter Balanced 2014-15 and 2015-16 Interim Assessment Technical Report
Chapter 3: Test Fairness
3-21
http://www.smarterbalanced.org/wp-
content/uploads/2015/08/GuidelinesforAccessibilityforELL.pdf
Young, J. W. (2008, December). Ensuring valid content tests for English language learners. R&D
Connections, No. 8. Princeton, NJ: Educational Testing Service.
Page 69
Smarter Balanced 2014-15 and 2015-16 Interim Assessment Technical Report
Chapter 4: Test Design
4-1
Chapter 4: Test Design
Page 70
Smarter Balanced 2014-15 and 2015-16 Interim Assessment Technical Report
Chapter 4: Test Design
4-2
Introduction
Test design entails developing a test philosophy (i.e., Theory of Action), identifying test purposes, and
determining the targeted examinee populations, test specifications, item pool design, and other
features such as test delivery (Schmeiser & Welch, 2006). The Smarter Balanced Theory of Action,
test purposes, and the targeted examinee population were outlined in the introduction of this report.
In developing a system of assessments, the goal of Smarter Balanced was to ensure that its
measurement properties reflected the expectations of content, rigor, and performance that comprise
the Common Core State Standards (CCSS). The primary mechanism for this was to ensure the
alignment of the Smarter Balanced Content Specifications with the CCSS. Item specifications are
then based on Content Specifications. Each item is aligned to a specific claim and target and to a
Common Core standard.
Figure 4.1 briefly encapsulates the Smarter Balanced interim test design process.
FIGURE 4.1 COMPONENTS OF SMARTER BALANCED TEST DESIGN
A Brief Description of Smarter Balanced Content Structure
The Common Core State Standards are the content standards in English language arts/literacy
(ELA/literacy) and mathematics that many states have adopted. Because the CCSS were not
specifically developed for assessment, they contain extensive rationale and information concerning
instruction. Therefore, adopting previous practices used by many state programs, Smarter Balanced
content experts produced Content Specifications in ELA/literacy and mathematics, distilling
assessment-focused elements from the CCSS. The Smarter Balanced Content Specifications for the
Interim Comprehensive Assessment (ICA) and the Interim Assessment Blocks (IABs) are the same as
those for the summative assessments and can be found in Summative Assessment of the CCSS for
English Language Arts/Literacy (2015e) and Content Specifications for the Summative Assessment
of the CCSS for Mathematics (2015f). Within each of the two subject areas in grades 3 to 8 and high
school, there are four broad claims. Within each claim, there are a number of assessment targets.
The claims in ELA/literacy and mathematics are given in Table 4.1.
Common Core
State
Standards
Content
Specifications
Item Specs/
Evidence
Statements
Test Content
Blueprint and
Measurement
Requirements
Item selection
for fixed forms
Item and Task
Pools
Smarter
Balanced
Interim
Assessments
Page 71
Smarter Balanced 2014-15 and 2015-16 Interim Assessment Technical Report
Chapter 4: Test Design
4-3
TABLE 4.1 CLAIMS FOR ELA/LITERACY AND MATHEMATICS
Claim ELA/Literacy Mathematics
1 Reading Concepts and Procedures
2 Writing Problem Solving
3 Speaking/Listening Communicating Reasoning
4 Research Modeling and Data Analysis
Currently, only the listening part of ELA/literacy Claim 3 is assessed. For the ICA in mathematics,
Claims 2 and 4 are reported together which results in three reporting categories for mathematics.
For the IABs, the claim/target structure is used in test specification, and results are reported for the
overall IAB group.
Because of the breadth in coverage of the individual claims, targets and target clusters within each
claim, evidence statements define more specific performance expectations. The relationship
between targets and Common Core State Standards elements is made explicit in the Smarter
Balanced content specifications (2015e; 2015f). The claim/target hierarchy is the basis for
summative and ICA test structure. IABs are based on target clusters or content domains that
correspond to skill clusters commonly taught as a group.
Item Development to Content Standards
The Smarter Balanced Item and Task Specifications (2015g) for ELA/literacy and mathematics
provide guidance on how to translate the Smarter Balanced Content Specifications into actual
assessment items. In addition, guidelines for bias and sensitivity, accessibility and accommodations,
and style help item developers and reviewers ensure consistency and fairness across the item bank.
The specifications and guidelines were reviewed by member states, school districts, higher
education, and other stakeholders. The item specifications describe the evidence to be elicited and
provide sample task models to guide the development of items that measure student performance
relative to the target.
The same blueprints as the summative assessments were used for the Interim Comprehensive
Assessments (ICAs). Specifically, the Smarter Balanced ELA/literacy Summative Assessment
Blueprint (2015a) and Mathematics Summative Assessment Blueprint (2015b) describe the content
of the English language arts/literacy and mathematics ICAs for grades 3–8 and high school—and
how that content will be assessed. The Smarter Balanced ELA/literacy Interim Assessment Blocks
Blueprints (Smarter Balanced, 2015c) and Mathematics Interim Assessment Blocks Blueprint
(Smarter Balanced, 2015d) describe the content of the IABs. The summary blueprints used for the
ICA also describe the composition of both assessment components, non-performance task (non-PT)
and performance task (PT), and how their results will be combined for score reporting. On the ICA,
performance tasks (PTs) act in concert with non-PT items to fulfill the blueprint. Developed with
broad input from member states, partners, and stakeholders, ICA test blueprints reflect the depth
and breadth of the performance expectations of the CCSS. Smarter Balanced Governing Members
approved the summary test blueprints in 2015. Interim Assessment Block blueprints were created by
Smarter Balanced content experts working closely with content experts from member states. They
are designed to fit typical instructional models or teaching units.
Page 72
Smarter Balanced 2014-15 and 2015-16 Interim Assessment Technical Report
Chapter 4: Test Design
4-4
Synopsis of Comprehensive Assessment System Components
The ICA for each subject consists of two parts: a non-PT and a PT and can be administered according
to the guidance provided in the Smarter Balanced State Member Procedures Manual (2015). When
administered in accordance with MPM guidance, ICA scores
• Accurately describe student achievement and can be used to describe student learning in
comparison to summative results.
• Provide valid, reliable, and fair measures of students’ progress toward, and attainment of,
the knowledge and skills required to be college- and career-ready;
• Measure the breadth and depth of the CCSS across the spectrum of student ability by
incorporating a variety of item types (including items and tasks scored by expert raters) that
are supported by a comprehensive set of accessibility resources;
• Utilize performance tasks to provide a measure of the student’s ability to integrate
knowledge and skills.
Test Blueprints
Test specifications and blueprints define the knowledge, skills, and abilities intended to be
measured on each student’s test event. A blueprint also specifies how skills are sampled from a set
of content standards (i.e., the CCSS). Other important factors such as Depth of Knowledge (DOK) are
also specified. Specifically, a test blueprint is a formal document that guides the development and
assembly of an assessment by explicating the following types of essential information:
• content (claims and assessment targets) that is included for each assessed subject and
grade, across various levels of the system (student, classroom, school, district, state);
• the relative emphasis or weighting of different content strata (e.g., claims) if there is any
weighting beyond the proportions of items and points;
• the relative emphasis of content standards generally indicated as the number of items or
percentage of points per claim and assessment target;
• item types used or required, which communicate to item developers how to measure each
claim and assessment target, and to teachers and students about learning expectations; and
• Depth of Knowledge (DOK), indicating the complexity of item types for each claim and
assessment target.
The interim comprehensive assessments are composed of non-PT and PT components. For the ICA,
responses from both components are combined to cover the test blueprint in a grade and content
area and are used to produce the overall and claim scale scores.
Operational Interim Assessment Blueprints and Specifications.
Interim Comprehensive Assessments (ICAs)
The same blueprints as the summative assessments were used for the ICAs (blueprints are found in
Appendix B). For each designated grade range (3 to 5, 6 to 8, and high school), the blueprint
overviews summarize the claim score\reporting category, content category, stimuli used, items by
non-PT or PT, and total number of items by claim. Details are given separately for each grade and
include claim, assessment target, DOK, assessment type (non-PT/PT), and the total number of items
(Smarter Balanced, 2015a; Smarter Balanced, 2015b). Assessment targets are nested within claims
and represent a more detailed specification of content. Note that in addition to the nested
hierarchical structure, each blueprint also specifies a number of rules applied at global or claim
levels. Most of these specifications are in the footnotes, which constitute important parts of the test
designs.
Page 73
Smarter Balanced 2014-15 and 2015-16 Interim Assessment Technical Report
Chapter 4: Test Design
4-5
To assist in blueprint interpretation, an example of a mathematics ICA blueprint is given in Figure 4.2
through Figure 4.6. Table 4.2 is a display of the test map that resulted from the mathematics
blueprint. Again, note that the blueprints for the ICAs are the same as for the summative
assessment. Blueprints for all Interim Assessment Blocks are found in Appendix B and test maps for
all assessments are found in Appendix C.
Figure 4.4 present blueprint requirements for grade six mathematics, by claim and assessment
target. It displays the number of items overall by claim and shows the contribution of the non-PT and
performance task portions to the overall design. Note that some targets are clustered together. For
example, claim 1 calls for 14 items from targets E, F, A, G, B, and D. Note that six items come from
targets E and F, while only two items come from targets G and B. This represents the appropriate
content emphasis, while allowing flexibility in item choice. The detailed blueprint shows how
performance tasks and non-PT components work in conjunction. Here, the DOK requirements are
applied at the target level.
FIGURE 4.2 OVERVIEW OF MATHEMATICS GRADE 6-8 BLUEPRINT FOR INTERIM COMPREHENSIVE ASSESSMENTS (ICAS)
Blueprint Table Mathematics Grades 6–8
Estimated Total Testing Time: 3:30 (with Classroom Activity)1
Claim/Score Reporting
Category Content Category2
Stimuli Items Total Items by
Claim3
CAT PT CAT4 PT5
1. Concepts and Procedures
Priority Cluster 0
0
12-15
0 16-20
Supporting Cluster 0 4-5
2. Problem Solving
4. Modeling and Data
Analysis6
Problem Solving 0
1
6 2-4 8-10 Modeling and Data
Analysis 0
3. Communicating
Reasoning Communicating Reasoning 0 8 0-2 8-10
All times are estimates. Actual times may vary.
2 For more information on content categories, see the Content Specifications document at
http://www.smarterbalanced.org/assessments/development
3 While the range for the total items by Claim for Problem Solving/Modeling and Data Analysis and Communicating Reasoning indicates 8-
10 items in each reporting category, the total number of items across these two reporting categories for any individual test event is 18-20.
4 In grades 6-8, up to one CAT item per student may require hand-scoring (from either Claim 3 or Claim 4), which may be AI-scored with an
application that yields comparable results by meeting or exceeding reliability and validity criteria for hand-scoring.
5 Each PT contains 4-6 total items. Up to four PT items may require hand-scoring.
6 Claim 2 (Problem Solving) and Claim 4 (Modeling and Data Analysis) have been combined because of content similarity and to provide
flexibility for item development. There are still four claims, but only three claim scores will be reported with the overall math score.
Page 74
Smarter Balanced 2014-15 and 2015-16 Interim Assessment Technical Report
Chapter 4: Test Design
4-6
FIGURE 4.3 BLUEPRINT FOR GRADE 6 SHOWING DETAILED CONTENT STRUCTURE (ASSESSMENT TARGETS), PAGE 1 OF
2
Target Sampling Mathematics Grade 6
Claim Content
Category Assessment Targets DOK
Items Total
CAT PT
1.
Concepts
and
Procedure
s
Priority
Cluster
E. Apply and extend previous understandings of
arithmetic to algebraic expressions. 1
5-6
0 16-19
F. Reason about and solve one-variable
equations and inequalities. 1, 2
A. Understand ratio concepts and use ratio
reasoning to solve problems. 1, 2 3-4
G. Represent and analyze quantitative
relationships between dependent and
independent variables.
2
2 B. Apply and extend previous understandings of
multiplication and division to divide fractions
by fractions.
1, 2
D. Apply and extend previous understandings of
numbers to the system of rational numbers. 1, 2 2
Supportin
g Cluster
C. Compute fluently with multi-digit numbers and
find common factors and multiples. 1, 2
4-5 H. Solve real-world and mathematical problems
involving area, surface area, and volume. 1, 2
I. Develop understanding of statistical variability. 2
J. Summarize and describe distributions. 1, 2
─ DOK: Depth of Knowledge, consistent with the Smarter Balanced Content Specifications.
─ The CAT algorithm will be configured to ensure the following:
• For Claim 1, each student will receive at least 7 CAT items at DOK 2 or higher.
• For Claim 3, each student will receive at least 2 CAT items at DOK 3 or higher.
• For combined Claims 2 and 4, each student will receive at least 2 CAT items at DOK 3 or higher.
Page 75
Smarter Balanced 2014-15 and 2015-16 Interim Assessment Technical Report
Chapter 4: Test Design
4-7
FIGURE 4.4 BLUEPRINT FOR GRADE 6 SHOWING DETAILED CONTENT STRUCTURE (ASSESSMENT TARGETS), PAGE 2 OF
2
Target Sampling Mathematics Grade 6
Claim Content
Category Assessment Targets DOK
Items Total
Items CAT PT
2.
Problem
Solving
4.
Modeling
and Data
Analysis
Problem
Solving
(drawn
across
content
domains)
A. Apply mathematics to solve well-posed
problems arising in everyday life, society, and
the workplace. 2, 3 2
1–
2
8-10
B. Select and use appropriate tools strategically.
C. Interpret results in the context of a situation.
D. Identify important quantities in a practical
situation and map their relationships (e.g.,
using diagrams, two-way tables, graphs, flow
charts, or formulas).
1, 2,
3 1
Modeling
and Data
Analysis
(drawn
across
content
domains)
A. Apply mathematics to solve problems arising
in everyday life, society, and the workplace.
D. Interpret results in the context of a situation.
2, 3 1
1–
3
B. Construct, autonomously, chains of reasoning
to justify mathematical models used,
interpretations made, and solutions proposed for
a complex problem.
E. Analyze the adequacy of and make
improvements to an existing model or develop
a mathematical model of a real phenomenon.
2, 3,
4 1
C. State logical assumptions being used.
F. Identify important quantities in a practical
situation and map their relationships (e.g.,
using diagrams, two-way tables, graphs, flow
charts, or formulas).
1, 2,
3 1
G. Identify, analyze, and synthesize relevant
external resources to pose or solve problems. 3, 4 0
3.
Communi
cating
Reasonin
g
Communicat-
ing
Reasoning
(drawn
across
content
domains)
A. Test propositions or conjectures with specific
examples.
D. Use the technique of breaking an argument
into cases.
2, 3 3
0-2 8-10
B. Construct, autonomously, chains of reasoning
that will justify or refute propositions or
conjectures.
E. Distinguish correct logic or reasoning from
that which is flawed, and—if there is a flaw in
the argument—explain what it is.
2, 3,
4 3
C. State logical assumptions being used. 2, 3 2
Page 76
Smarter Balanced 2014-15 and 2015-16 Interim Assessment Technical Report
Chapter 4: Test Design
4-8
─ DOK: Depth of Knowledge, consistent with the Smarter Balanced Content Specifications.
─ The CAT algorithm will be configured to ensure the following:
• For Claim 1, each student will receive at least 7 CAT items at DOK 2 or higher.
• For Claim 3, each student will receive at least 2 CAT items at DOK 3 or higher.
• For combined Claims 2 and 4, each student will receive at least 2 CAT items at DOK 3 or higher.
TABLE 4.2 GRADE 4 ELA/LITERACY-READ LITERARY TEXTS INTERIM ASSESSMENT BLOCK TEST MAP
Item
Sequence Claim Target DOK Item Type Point Value
1 1 5 4 MC4 1
2 1 3 2 MC4 1
3 1 6 2 MC4 1
4 1 4 3 EBSR4 1
5 1 2 2 MC4 1
6 1 1 2 HTQ 1
7 1 2 2 MC4 1
8 1 1 2 MC4 1
9 1 4 3 EBSR4 1
10 1 3 2 MS6 1
11 1 4 3 SA 2
12 1 3 1 MS5 1
13 1 2 2 MC4 1
14 1 7 3 MS5 1
15 1 1 1 HTQ 1
Interim Assessment Blocks (IABs)
The blueprint presents the specific blocks that are available by grade level for English Language
Arts/literacy or mathematics beginning at grade 3 and continuing through high school. Each IAB
blueprint contains information about the claim(s), assessment target(s), and depth of knowledge
level(s) addressed by the items in that block, as well as the numbers of items allocated to each of
those categories. Other more subject specific information is also included. For example, the
ELA/literacy blueprint incorporates details on passage length and scoring of responses, while the
mathematics blueprint specifies to what extent the relevant task models are represented in each
block. Details are given separately for each grade and include claim, assessment target, DOK,
assessment type (non-PTs/PT), and the total number of items (Smarter Balanced, 2015c; Smarter
Balanced, 2015d). Figure 4.6 shows an example of the ratio and proportions mathematics interim
F. Base arguments on concrete referents such
as objects, drawings, diagrams, and actions.
G. At later grades, determine conditions under
which an argument does and does not apply.
(For example, area increases with perimeter
for squares, but not for all plane figures.)
Page 77
Smarter Balanced 2014-15 and 2015-16 Interim Assessment Technical Report
Chapter 4: Test Design
4-9
assessment block blueprint for 6th grade. Blueprints for all Interim Assessment Blocks are found in
Appendix B.
FIGURE 4.6 BLUEPRINT FOR GRADE 6 IAB SHOWING DETAILED CONTENT STRUCTURE (ASSESSMENT TARGETS)
Grade 6 – Ratio and Proportional Relationships (13 items)
Claim Content
Category Assessment Targets DOK
Number
of
Items
Total
Items per
Reporting
Category
1. Concepts
and
Procedures
RP A. Understand ratio concepts and use ratio
reasoning to solve problems. 1, 2 11 11
2. Problem
Solving
4. Modeling
and Data Analysis
Problem
Solving
A. Apply mathematics to solve well-posed problems
arising in everyday life, society, and the
workplace.
2, 3
1
1
B. Select and use appropriate tools strategically.
C. Interpret results in the context of a situation.
D. Identify important quantities in a practical
situation and map their relationships (e.g., using diagrams, two-way tables, graphs, flow charts, or
formulas).
1,
2, 3
Modeling and
Data Analysis
A. Apply mathematics to solve problems arising in
everyday life, society, and the workplace.
D. Interpret results in the context of a situation.
2, 3
0
B. Construct, autonomously, chains of reasoning to justify mathematical models used, interpretations
made, and solutions proposed for a complex
problem.
E. Analyze the adequacy of and make
improvements to an existing model or develop a
mathematical model of a real phenomenon.
2, 3, 4
C. State logical assumptions being used.
F. Identify important quantities in a practical
situation and map their relationships (e.g., using
diagrams, two-way tables, graphs, flow charts, or
formulas).
1,
2, 3
G. Identify, analyze, and synthesize relevant
external resources to pose or solve problems. 3, 4
3.
Communicating
Reasoning
Communicating
Reasoning
A. Test propositions or conjectures with specific
examples.
D. Use the technique of breaking an argument into
cases.
2, 3
1 1
B. Construct, autonomously, chains of reasoning
that will justify or refute propositions or
conjectures.
E. Distinguish correct logic or reasoning from that which is flawed, and—if there is a flaw in the
argument—explain what it is.
2,
3, 4
C. State logical assumptions being used.
F. Base arguments on concrete referents such as
objects, drawings, diagrams, and actions.
G. At later grades, determine conditions under
which an argument does and does not apply. (For
2, 3
Page 78
Smarter Balanced 2014-15 and 2015-16 Interim Assessment Technical Report
Chapter 4: Test Design
4-10
Grade 6 – Ratio and Proportional Relationships (13 items)
Claim Content
Category Assessment Targets DOK
Number
of
Items
Total
Items per
Reporting
Category
example, area increases with perimeter for
squares, but not for all plane figures.)
Non-Performance Task and Performance Task Test Components
No order is imposed on ICA components; either the non-PT or PT portion can be administered to
students first. Performance tasks measure a student’s ability to integrate knowledge and skills
across multiple standards. Performance tasks measure capacities such as essay writing, research
skills, and complex analysis, which are not as easy to assess with individual, discrete items. Several
performance tasks are associated with a common theme. A theme is assigned to school for each
grade and the performance tasks within the theme are randomly distributed within the grade.
Performance tasks on IABs are usually stand-alone tasks with 4-6 items. They are given separately
from non-PT. IABs and are provided primarily to provide practice for students and professional
development for teachers in hand-scoring and in understanding task demands.
Item and Task Development
To build an interim assessment that measured the intended claims, the test development cycle of
the Consortium was iterative, involving experts from various education-related fields, and was based
on assessment-related research and best practices and was identical to that of the summative
assessment. Please refer to Chapter 4 in the Smarter Balanced 2015 - 2015 Technical Report
(Smarter Balanced Assessment Consortium, 2016b).
Item and Task Specifications
The item and task specifications for the interim assessments are the same as those for the
summative assessments and bridge the span from the content specifications and Achievement
Levels to the assessment itself. While the content specifications established the claims and the
types of evidence or targets that would need to be collected in order to support these claims, more
specificity was needed in order to develop items and tasks that measured the claims.
The first iteration of the item and task specifications was developed in 2011. In early 2012, the
Consortium held a series of showcases where the contractors introduced the item and task
specifications and collected feedback from member states. Using this feedback, the item and tasks
specifications were revised during the first quarter of 2012.
Using the revised item and task specifications, a small set of items was developed and administered
in fall 2012 during a small-scale trial. This provided the Consortium with the first opportunity to
administer and score the new item types. During the small-scale trials, the Consortium also
conducted cognitive laboratories to better understand how students respond to various types of
items (AIR, 2013). The cognitive laboratories used a think-aloud methodology in which students
speak their thoughts while working on a test item. The item and task specifications were again
revised based on the findings of the cognitive laboratories and the small-scale trial. These revised
Page 79
Smarter Balanced 2014-15 and 2015-16 Interim Assessment Technical Report
Chapter 4: Test Design
4-11
specifications were used to develop items for the 2013 pilot test, and they were again revised based
on 2013 pilot test results and subsequent review by content experts.
The Smarter Balanced Item and Task Specifications (2015e) are designed to ensure that
assessment items measure the assessment’s claims. Indeed, the purpose of item and task
specifications is to define the characteristics of items and tasks that will provide evidence to support
one or more claims. To do this, the item and task specifications delineate types of evidence that
should be elicited for each claim within a grade level. Then, they provide explicit guidance on how to
write items in order to elicit the desired evidence.
Item and task specifications provide guidelines on how to create items specific to each claim and
assessment target through the use of task models. In mathematics, a task model provides a
description of an item/task’s key features. These task models describe the knowledge, skills, and
processes being measured by each of the item types aligned to particular targets. In addition, task
models sometimes provide examples of plausible distractors. Exemplar items are provided within
every task model. In ELA/literacy these functions are carried out through item specifications.
Task models were developed for each grade level and target to delineate the expectations of
knowledge and skill to be included on test questions in each grade. In addition, both ELA/literacy
and mathematics item and stimulus specifications provide guidance about grade appropriateness of
task and stimulus materials (the materials that a student must refer to in working on a test
question). The task and stimulus models also provide information on characteristics of stimuli or
activities to avoid because they are not germane to the knowledge, skill, or process being measured.
This is important because it underscores the efforts of the Consortium to use universal design
principles to develop items that are accessible to the widest range of students possible. As the name
suggests, the concept of universal design aims to create items that accurately measure the
assessment target for all students. At the same time, universal design recognizes that one solution
rarely works for all students. Instead, this framework acknowledges “the need for alternatives to suit
many different people.” (Rose & Meyer, 2000, p. 4).
To facilitate the application of universal design principles, item writers are trained to consider the full
range of students who may answer a test question. A simple example of this is the use of vocabulary
that is expected to be known by all third-grade students versus only those third-grade students who
play basketball. Almost all third-grade students are familiar with activities (e.g., recess) that happen
during their school day, while only a subset of these students will be familiar with basketball terms
like “double dribble,” “layup,” “zone defense,” or “full-court press.”
Item specifications discuss accessibility issues unique to the creation of items for a particular claim
and/or assessment target. Accessibility issues concern supports that various groups of students may
need to access item content. By considering the supports that may be needed for each item, item
writers are able to create items that can be adapted to a variety of needs.
The use of universal design principles allows the Consortium to collect evidence on the widest
possible range of students. By writing items that adhere to item and task specifications, the
Consortium is assured that assessments measure the claims and assessment targets established in
content specifications as well as the knowledge, skills, and processes found in the CCSS for all
students for whom the assessment is appropriate.
Performance Task Design
The Race to the Top Assessment Program Application for the Smarter Balanced Assessment
Consortium (2010) highlights the importance of performance tasks to “provide a measure of the
student’s ability to integrate knowledge and skills across multiple standards—a key component of
college and career readiness” (p. 42). Performance tasks are also available on the interim
Page 80
Smarter Balanced 2014-15 and 2015-16 Interim Assessment Technical Report
Chapter 4: Test Design
4-12
assessments. The development of an assessment system that fulfills this goal necessitates an
understanding of how the world is changing and what skills are required to compete in an
increasingly global economy. Research suggests that measuring college and career readiness will
increasingly require the use of performance-based assessments (Fadel, Honey, & Pasnik, 2007).
A key component of college and career readiness is the ability to integrate knowledge and skills
across multiple content standards. Smarter Balanced derives inferences concerning this ability
through performance tasks. Performance assessments are intended to represent students’
competence in applying the knowledge and cognitive skills needed to solve substantive, meaningful
problems. Performance assessments give students opportunities to demonstrate their ability to find,
organize, or use information to solve problems, undertake research, frame and conduct
investigations, analyze and synthesize data, and apply learning to novel situations.
A Smarter Balanced performance task involves interaction of students with stimulus materials
and/or engagement in a problem solution, ultimately leading to an exhibition of the students’
application of knowledge and skills. Stimuli include a variety of information forms (e.g., readings,
video clips, data), as well as an assignment or problem situation. As shown in the test blueprints,
performance tasks are an integral part of the Smarter Balanced test design. When a performance
task is assigned and given in its entirety, it fulfills a specific role in the test blueprint for a grade and
content area. Performance tasks are intended to challenge students in applying their knowledge and
skills to complex, contextually rich problems. These activities are meant to measure capacities such
as depth of understanding, writing or research skills, mathematical modeling and complex analysis.
They consist of collections of questions and activities coherently connected to a single scenario. The
performance tasks are administered online via computer (not computer adaptive) and require one to
two class periods to complete.
Performance tasks were constructed so they can be delivered effectively in the school/classroom
environment (Dana and Tippins, 1993). Requirements for task specifications included, but were not
limited to, pre-assessment classroom activities, materials and technology needs, and allotted time
for assessment. Performance tasks adhere to specifications used by item writers to develop new
tasks that focus on different content but are comparable in contribution to the blueprint.
All Smarter Balanced performance tasks consist of three basic components: stimulus presentation,
information processing, and scorable product(s) or performance(s). “Information processing” means
student interactions with the stimulus materials and their content. It could include note taking, data
generation, and any other activities that increase students’ understanding of the stimulus content or
the assignment. All activities within a task must have a rationale for inclusion (e.g., to increase
understanding, for scaffolding, as early steps in product creation or for product creation).
In ELA/literacy, each performance task comprises a targeted research effort in which students read
sources and respond to two to three research items, followed by an essay. During the research
component, students may take notes to which they may later refer. Students then write a full essay
drawing from source material and research notes. On the ICAs, claim level results in writing and
research are based on both non-PT and PT item responses.
In mathematics, each performance task comprises a set of stimulus materials and a follow-up item
set consisting of six items in Claims 2, 3, and 4. On the ICA these are combined with non-PT items in
Claims 2, 3 and 4 to satisfy the blueprint and create a Claim 3 score and a combined Claim 2 and 4
score. Performance tasks address an integrated scenario in middle and high school and a common
theme in grades 3 to 5.
Page 81
Smarter Balanced 2014-15 and 2015-16 Interim Assessment Technical Report
Chapter 4: Test Design
4-13
Interim Assessment Blocks based on performance tasks alone yield an indicator of Below
Standard, At or Near Standard or Above Standard. The Item/task Pool Specification
An item pool refers to a collection of test questions (known as items) that supports the test blueprint
for a particular content area and grade. The Consortium took multiple steps to ensure the quality of
the items in our item pool. Building on the ongoing process of developing item/task specifications
and test blueprints, the Consortium used an iterative process for creating and revising each item as
well as the collection of items. The Consortium tested items and refined its approach to item
development through three steps: small-scale tryouts, a large pilot test, and a large field test. Details
of the pilot and field tests are found in the Smarter Balanced 2013 - 2014 Technical Report
(2016a). During each phase, the Consortium used cognitive laboratories to understand the
strategies that students used to respond to the items. By incorporating this tiered and iterative
approach, the item and task specifications that guided the development of the final operational pool
were improved based on lessons learned during tryouts. Summative and interim assessments draw
from the same item pool.
Using test blueprints, measurement experts specified the number and distribution of items to be
written. Pools of items/tasks were written specifically to support proportions of items and intended
difficulty distribution in the operational blueprint. Teachers were integrally involved in the creation of
the item/task pool from beginning to end. Some participated in the processes described in the flow
charts that appear in the Appendix D. Others developed items through a rigorous item writing
process, and yet others reviewed the items for accuracy and appropriateness of the content
knowledge and skill level required to respond to the items. Teams of content experts reviewed items
for potential issues of bias in favor of or against any demographic group of students, and for
accessibility for students with disabilities and English language learners. Content, bias, and
accessibility reviews were conducted prior to administration to any students. Following pilot and field
test administrations, items were again reviewed if pilot or field test data indicated a potential
problem. Finally, teachers participated in range finding and scoring of constructed-response
items/tasks to ensure that the items/tasks could be properly scored given their scoring rubrics.
In this section, we will examine the primary role that educators played in creating the field-test item
pool by writing, reviewing, and scoring items. This section will end by examining the current
composition of the item pool.
Item Writing
The Consortium worked with educators throughout the test development cycle to develop items for
both the summative and interim assessments. Prior to the spring 2013 pilot test, the Consortium
engaged 136 educators in K-12 and higher education from 19 member states to write items. Prior to
the spring 2014 field test, 184 educators in K-12 and higher education from 16 member states
participated in item writing. All K-12 participants:
• Were certified/licensed to teach ELA/literacy and/or mathematics in a K-12 public school;
• Were currently teaching in a public school within a Smarter Balanced Governing State;
• Had taught ELA/literacy and/or mathematics in grades 3 through 8 and/or high school within
the past three years (second-grade teachers were also recruited to participate in the
development of grade 3 items and/or tasks);
• Had previously reviewed part or all of the CCSS for the content area for which they were
writing items and/or performance tasks;
• Submitted a statement of interest that described their interest in developing Smarter
Balanced items and/or performance tasks as well as their qualifications for doing so;
• Completed training and achieved qualifications through the certification process.
Qualifications for Higher Education Faculty included:
Page 82
Smarter Balanced 2014-15 and 2015-16 Interim Assessment Technical Report
Chapter 4: Test Design
4-14
• Current employment with, or recent retirement from, a college or university located within a
Smarter Balanced Member State;
• Having taught developmental and/or entry-level courses in English, composition,
mathematics, statistics or a related discipline within the last 3 years;
• Having previously reviewed part or all of the CCSS for the content area in which they are
interested in writing items and/or performance tasks;
• Completing training and achieving qualifications through the certification process.
The selected educators were trained on the Consortium content specifications, the item and task
specifications, and ELA/literacy stimulus specifications, as well as the item authoring system in
which the items were developed. In addition, professional item writers and the Consortium held
regular meetings to provide direction and feedback to the educators. Educators, state partners, and
assessment vendors developed the items in the item pool of the Consortium
Training
Educators participated in a series of facilitated, online webinars in order to qualify as item writers. To
facilitate participation, the Consortium scheduled multiple sessions in different time zones, including
evening sessions. In addition to the facilitated sessions, the Consortium provided training modules
that covered background on the Consortium, assessment design principles, and detailed information
about item and performance task development. All modules were available in three formats: a
PowerPoint presentation with notes, a streaming presentation with narration that could be viewed
online, and a downloadable audio/video presentation.
The item writers were specifically trained on Consortium content and item specifications, stimulus
specifications, sensitivity and bias guidelines, and general accessibility guidelines. Training on these
specifications and guidelines helped ensure that item writers were trained to write items that
allowed the widest possible range of students to demonstrate their knowledge, skills, and cognitive
processes with regard to the content. This meant that item writers needed to understand the content
for which they were writing items as well as accessibility and sensitivity issues that might hinder
students’ ability to answer an item. Item writers were also trained to be aware of issues that might
unintentionally bias an item for or against a particular group. More information on item writer training
can be found in the 2013-2014 Technical Report and the End of Grant Report (Smarter Balanced
Assessment Consortium, 2015i; Smarter Balanced Assessment Consortium, 2016a).
Educator Participation
Consistent with the Consortium process, educators were the primary developers of items. The active
involvement of educators was critical to the success of the item writing activities. Educators engage
with students on a daily basis, and they understand the ways in which students can demonstrate
their knowledge. Their involvement in item writing helped ensure that the assessment system is
accurate and efficient, and provides valid evidence of student learning.
State-Managed Item Development
The Consortium invited member states to participate in a separate effort to write items. This
voluntary effort, known as State-Managed Item Development, was conducted to build the capacity of
states to write items and to support the overall sustainability of the Consortium. To this end, six
states (HI, ID, MI, WA, WV, and WY) participated in the state-managed field test item development
opportunity. During this opportunity, educators within the six states developed approximately 3,100
items in mathematics and ELA/literacy across grades 3 through 8 and high school. These items were
not operational in the Smarter Balanced 2015 summative assessments but were included as
embedded field test items.
Page 83
Smarter Balanced 2014-15 and 2015-16 Interim Assessment Technical Report
Chapter 4: Test Design
4-15
Item Reviews
Once items were written, groups of educators reviewed items prior to their pilot test administration in
spring 2013 and their field test administration in spring 2014. Items that met technical quality
criteria from the pilot test were again reviewed prior to their use in the spring 2014 field test.
Accessibility, Bias/Sensitivity, and Content Reviews
Panels of educators review all items, performance tasks, and item stimuli for accessibility,
bias/sensitivity, and content. Item stimuli refer to the reading passages used on the ELA/literacy
assessments or the figures and graphics used on the mathematics assessments. This is part of the
standard item development protocol employed by the consortium. Prior to field testing, educators
review items and performance tasks for accessibility, bias/sensitivity, or content.
The educator qualifications for the accessibility, bias/sensitivity, and content reviews are the same
as those for item writing except that participants are not required to submit a statement of interest.
In addition, it is preferred (but not required) that educators have previous experience reviewing
items, tasks, and/or stimuli.
During the accessibility reviews, panelists identify issues that may negatively affect a student’s ability
to access stimuli, items, or performance tasks, or to elicit valid evidence about an assessment
target. During the bias and sensitivity review, panelists identify content in stimuli, items, or
performance tasks that may negatively affect a student’s ability to produce a correct response
because of their background. The content review focuses on developmental appropriateness and
alignment of stimuli, items, and performance tasks to the content specifications and appropriate
depths of knowledge. Panelists in the content review also check the accuracy of the content, answer
keys, and scoring materials. Items flagged for accessibility, bias/sensitivity, and/or content concerns
are either revised to address the issues identified by the panelists or removed from the item pool.
Details about the item development process in ELA/literacy and mathematics are found in Appendix
D. These are the steps each item goes through before it can be presented to students.
Field Testing
When all of the developmental reviews have been conducted, items that pass all developmental
reviews become eligible for an operational Field Test. Briefly, the field test is uses examinee
responses to assess whether items fit the statistical model and to provide item statistical and
parameters used in test scoring. Field test items are embedded in the adaptive portion of
operational summative tests.
Item Scoring
For those items that cannot be machine scored, the Consortium engages participants from member
states and from vendor subcontractors in range finding. Range finding improves the consistency and
validity of scoring for the assessment. During range finding, educators focus on the performance
tasks for mathematics and ELA/literacy. The participants review student responses against item
rubrics, validate the rubrics’ accuracy, and select anchor papers for use during operational item
scoring.
The educator qualifications for range finding are the same as those for item writing, except that
participants are not required to submit a statement of interest. In addition, it is preferred (but not
required) that educators have had previous range finding experience.
To verify correct scoring for machine-scored items, a rubric validation activity is conducted. For
multiple choice items, this is a simple key check. For other item types, such as grid interaction items
(drag-and-drop), matching tables or equation entry, the procedure involves looking at a sample of
Page 84
Smarter Balanced 2014-15 and 2015-16 Interim Assessment Technical Report
Chapter 4: Test Design
4-16
student raw responses (screen coordinates or keystrokes) and assuring that the raw response was
scored correctly. In the course of this process, reviewers may find unexpected responses that
require adjustment of the scoring procedure to account for a wider response range. Item scoring
software is then changed accordingly.
Composition of Interim Item Pools
The numbers of items in each IAB, grade and claim are shown in Table 4.2 and Table 4.3, and the
numbers of items in the ICAs are shown in Table 4.4.
TABLE 4.3 COMPOSITION OF INTERIM ASSESSMENT BLOCKS, ELA/LITERACY
GRADE Interim Assessment Block Name CLAIMS Total #
Items 1 2 3 4
ELA/Literacy
3
Reading Literary Text 15 0 0 0 15
Reading Informational Text 16 0 0 0 16
Edit and Revise 0 15 0 0 15
Brief Writes 0 6 0 0 6
Listen and Interpret 0 6 15 0 15
Research 0 17 0 0 17
Opinion Performance Task 0 2 0 3 5
4
Reading Literary Text 15 0 0 0 15
Reading Informational Text 14 0 0 0 14
Edit and Revise 0 16 0 0 16
Brief Writes 0 6 0 0 6
Listen and Interpret 0 0 15 0 15
Research 0 0 0 18 18
Narrative Performance Task 0 2 0 3 5
5
Reading Literary Text 15 0 0 0 15
Reading Informational Text 15 0 0 0 15
Edit and Revise 0 13 0 0 13
Brief Writes 0 6 0 0 6
Listen and Interpret 0 0 14 0 14
Research 0 0 0 17 17
Narrative Performance Task 0 2 0 3 5
6
Reading Literary Text 15 0 0 0 15
Reading Informational Text 16 0 0 0 16
Edit and Revise 0 18 0 0 18
Brief Writes 0 6 0 0 6
Listen and Interpret 0 0 15 0 15
Research 0 0 0 18 18
Argument Performance Task 0 2 0 2 4
Page 85
Smarter Balanced 2014-15 and 2015-16 Interim Assessment Technical Report
Chapter 4: Test Design
4-17
Grade Interim Assessment Block Name CLAIMS Total #
Items 1 2 3 4
ELA/Literacy
7
Reading Literary Text 16 0 0 0 16
Reading Informational Text 16 0 0 0 16
Edit and Revise 0 17 0 0 17
Brief Writes 0 6 0 0 6
Listen and Interpret 0 0 15 0 15
Research 0 0 0 15 15
Argument Performance Task 0 2 0 3 5
8
Reading Literary Text 16 0 0 0 16
Reading Informational Text 16 0 0 0 16
Edit and Revise 0 14 0 0 14
Brief Writes 0 6 0 0 6
Listen and Interpret 0 0 15 0 15
Research 0 0 0 17 17
Argument Performance Task 0 2 0 3 5
11
Reading Literary Text 16 0 0 0 16
Reading Informational Text 15 0 0 0 15
Edit and Revise 0 18 0 0 18
Brief Writes 0 6 0 0 6
Listen and Interpret 0 0 15 0 15
Research 0 0 0 17 17
Explanatory Performance Task 0 2 0 3 5
Page 86
Smarter Balanced 2014-15 and 2015-16 Interim Assessment Technical Report
Chapter 4: Test Design
4-18
TABLE 4.4 COMPOSITION OF INTERIM ASSESSMENT BLOCKS, MATHEMATICS
Grade Interim Assessment Block Name CLAIMS Total #
Items 1 2 3 4
Mathematics
3
Operations and Algebraic Thinking 12 1 1 1 15
Fractions 12 0 1 0 13
Measurement and Data 12 1 1 1 15
Mathematics Performance Task 0 2 2 2 6
4
Operations and Algebraic Thinking 9 1 2 3 15
Numbers and Operations in Base 10 12 1 2 0 15
Fractions 13 1 2 0 16
Mathematics Performance Task 0 2 2 2 6
5
Measurement and Data 7 4 2 1 14
Numbers and Operations in Base 10 12 1 2 1 16
Fractions 11 1 2 1 15
Mathematics Performance Task 0 2 2 2 6
6
Ratio and Proportional Relationships 12 1 1 0 14
Expressions and Equations 12 1 1 1 15
Geometry 9 1 1 1 12
Mathematics Performance Task 0 2 2 2 6
7
Ratio and Proportional Relationships 11 1 1 1 14
Number System 11 0 2 1 14
Expressions and Equations 12 1 1 1 15
Mathematics Performance Task 0 2 2 2 6
8
Expressions & Equations I Block 5 0 0 0 5
Expressions & Equations II Block 7 1 0 1 9
Functions Block 11 1 2 1 15
Geometry Block 12 0 1 1 14
Mathematics Performance Task 0 2 2 2 6
11
Algebra and Functions - Linear Functions 8 4 1 2 15
Algebra and Functions - Quadratic Functions 7 0 1 3 11
Geometry - Right Triangle Ratios in Geometry 13 0 0 0 13
Mathematics Performance Task 0 1 2 3 6
Page 87
Smarter Balanced 2014-15 and 2015-16 Interim Assessment Technical Report
Chapter 4: Test Design
4-19
TABLE 4.5 COMPOSITION OF INTERIM COMPREHENSIVE ASSESSMENTS
GRADE CLAIMS
Total 1 2 3 4
ELA/Literacy
3 20 11 9 8 48
4 20 12 9 8 49
5 19 12 9 8 48
6 21 12 9 7 49
7 20 12 9 8 49
8 21 12 9 8 50
11 19 11 9 8 47
Total 140 82 63 55 340
Mathematics
3 20 4 8 5 37
4 20 4 7 5 36
5 20 4 8 5 37
6 19 6 8 3 36
7 20 4 8 5 37
8 20 5 8 4 37
11 21 3 8 7 39
Total 140 30 55 34 259
The Consortium developed many different types of items beyond the traditional multiple-choice item.
This was done to measure claims and assessment targets with varying degrees of complexity by
allowing students to respond in a variety of ways rather than simply recognizing a correct response.
These different item types and their distribution are listed in Table 4.5 through Table 4.8. Note that
each Essay written is associated with two items. Essays are scored on three traits, two of which are
combined, resulting in two items for each essay.
Page 88
Smarter Balanced 2014-15 and 2015-16 Interim Assessment Technical Report
Chapter 4: Test Design
4-20
TABLE 4.6 ITEM TYPES USED IN THE INTERIM ASSESSMENT BLOCKS, ELA/LITERACY
Grade Interim Assessment Block
Name
Item Types Total #
Items MC MS EBSR MI HTQ SA WER EQ GI TI
3
Reading Literary Text 9 0 2 0 3 1 0 0 0 0 15
Reading Informational Text 8 1 2 0 4 1 0 0 0 0 16
Edit and Revise 10 1 0 0 4 0 0 0 0 0 15
Brief Writes 0 0 0 0 0 6 0 0 0 0 6
Listen and Interpret 7 1 3 4 0 0 0 0 0 0 15
Research 12 2 0 0 3 0 0 0 0 0 17
Opinion Performance Task 0 0 0 1 0 2 2 0 0 0 5
4
Reading Literary Text 7 3 2 0 2 1 0 0 0 0 15
Reading Informational Text 5 4 1 0 3 1 0 0 0 0 14
Edit and Revise 12 1 0 0 3 0 0 0 0 0 16
Brief Writes 0 0 0 0 0 6 0 0 0 0 6
Listen and Interpret 7 3 3 2 0 0 0 0 0 0 15
Research 11 5 0 1 1 0 0 0 0 0 18
Narrative Performance Task 0 0 0 1 0 2 2 0 0 0 5
5
Reading Literary Text 4 4 3 0 2 2 0 0 0 0 15
Reading Informational Text 6 3 1 0 3 2 0 0 0 0 15
Edit and Revise 7 2 0 0 4 0 0 0 0 0 13
Brief Writes 0 0 0 0 0 6 0 0 0 0 6
Listen and Interpret 6 2 4 2 0 0 0 0 0 0 14
Research 7 8 0 0 2 0 0 0 0 0 17
Narrative Performance Task 1 0 0 0 0 2 2 0 0 0 5
6
Reading Literary Text 10 2 0 0 2 1 0 0 0 0 15
Reading Informational Text 3 5 4 0 3 0 0 0 0 0 16
Edit and Revise 9 4 0 0 5 0 0 0 0 0 18
Brief Writes 0 0 0 0 0 6 0 0 0 0 6
Listen and Interpret 5 4 5 1 0 0 0 0 0 0 15
Research 6 5 0 0 7 0 0 0 0 0 18
Argument Performance Task 0 0 0 0 0 2 2 0 0 0 4
Page 89
Smarter Balanced 2014-15 and 2015-16 Interim Assessment Technical Report
Chapter 4: Test Design
4-21
Grade Interim Assessment Block
Name
Item Types Total #
Items MC MS EBSR MI HTQ SA WER EQ GI TI
7
Reading Literary Text 8 2 3 0 2 1 0 0 0 0 16
Reading Informational Text 2 6 3 0 4 1 0 0 0 0 16
Edit and Revise 9 3 0 0 5 0 0 0 0 0 17
Brief Writes 0 0 0 0 0 6 0 0 0 0 6
Listen and Interpret 9 3 3 0 0 0 0 0 0 0 15
Research 5 4 0 3 3 0 0 0 0 0 15
Argument Performance Task 0 0 0 1 0 2 2 0 0 0 5
8
Reading Literary Text 8 4 1 0 2 1 0 0 0 0 16
Reading Informational Text 3 5 1 0 5 2 0 0 0 0 16
Edit and Revise 7 4 0 0 3 0 0 0 0 0 14
Brief Writes 0 0 0 0 0 6 0 0 0 0 6
Listen and Interpret 11 1 2 1 0 0 0 0 0 0 15
Research 7 2 0 1 7 0 0 0 0 0 17
Argument Performance Task 0 1 0 0 0 2 2 0 0 0 5
11
Reading Literary Text 9 2 1 0 3 1 0 0 0 0 16
Reading Informational Text 5 3 1 0 5 1 0 0 0 0 15
Edit and Revise 10 1 0 0 7 0 0 0 0 0 18
Brief Writes 0 0 0 0 0 6 0 0 0 0 6
Listen and Interpret 10 4 0 1 0 0 0 0 0 0 15
Research 8 2 0 0 7 0 0 0 0 0 17
Explanatory Performance Task 0 0 0 1 0 2 2 0 0 0 5
Page 90
Smarter Balanced 2014-15 and 2015-16 Interim Assessment Technical Report
Chapter 4: Test Design
4-22
TABLE 4.7 ITEM TYPES USED IN THE INTERIM ASSESSMENT BLOCKS, MATHEMATICS
Grade Interim Assessment Block Name
Item Types Total
#
Items MC MS EBSR MI HTQ SA WER EQ GI TI
3
Operations and Algebraic Thinking 2 0 0 1 0 0 0 10 0 2 15
Fractions 2 1 0 1 0 0 0 9 0 0 13
Measurement and Data 5 1 0 0 0 0 0 9 0 0 15
Mathematics Performance Task 0 0 0 0 0 4 0 2 0 0 6
4
Operations and Algebraic Thinking 5 0 0 3 0 0 0 7 0 0 15
Numbers and Operations in Base 10 5 2 0 2 0 0 0 6 0 0 15
Fractions 0 2 0 5 0 0 0 9 0 0 16
Mathematics Performance Task 1 0 0 0 0 3 0 1 0 1 6
5
Measurement and Data 1 1 0 1 0 0 0 11 0 0 14
Numbers and Operations in Base 10 6 0 0 3 0 0 0 7 0 0 16
Fractions 8 2 0 0 0 0 0 5 0 0 15
Mathematics Performance Task 0 0 0 0 0 2 0 3 0 1 6
6
Ratio and Proportional Relationships 0 0 0 1 0 0 0 13 0 0 14
Expressions and Equations 1 5 0 2 0 0 0 7 0 0 15
Geometry 1 1 0 0 0 0 0 11 0 0 13
Mathematics Performance Task 0 0 0 0 0 2 0 4 0 0 6
7
Ratio and Proportional Relationships 5 1 0 0 0 0 0 8 0 0 14
Number System 4 2 0 1 0 0 0 7 0 0 14
Expressions and Equations 6 3 0 0 0 0 0 6 0 0 15
Mathematics Performance Task 1 0 0 0 0 2 0 1 0 2 6
8
Expressions & Equations I Block 4 0 0 0 0 0 0 1 0 0 5
Expressions & Equations II Block 1 1 0 0 0 0 0 7 0 0 9
Functions Block 7 4 0 1 0 0 0 3 0 0 15
Geometry Block 3 1 0 5 0 0 0 5 0 0 14
Mathematics Performance Task 0 0 0 0 0 2 0 3 0 1 6
11
Algebra and Functions - Linear
Functions 5 1 0 3 0 0 0 6 0 0 15
Algebra and Functions - Quadratic
Functions 7 1 0 3 0 0 0 1 0 0 12
Geometry - Right Triangle Ratios in
Geometry 0 1 0 4 0 0 0 8 0 0 13
Mathematics Performance Task 1 0 0 0 0 4 0 1 0 0 6
Page 91
Smarter Balanced 2014-15 and 2015-16 Interim Assessment Technical Report
Chapter 4: Test Design
4-23
TABLE 4.8 ITEM TYPES USED IN THE INTERIM COMPREHENSIVE ASSESSMENTS, ELA/LITERACY
Grade Claim Item Types Total #
Items MC MS EBSR MI HTQ SA WER EQ GI TI
3
1 12 0 3 0 3 12 0 0 0 0 20
2 7 0 0 0 1 1 2 0 0 0 11
3 3 1 2 3 0 0 0 0 0 0 9
4 4 1 0 1 0 2 0 0 0 0 8
4
1 11 2 2 0 3 2 0 0 0 0 20
2 7 0 0 0 2 1 2 0 0 0 12
3 5 2 1 1 0 0 0 0 0 0 9
4 3 1 0 2 0 2 0 0 0 0 8
5
1 6 3 4 0 4 2 0 0 0 0 19
2 7 1 0 0 1 1 2 0 0 0 12
3 4 0 3 2 0 0 0 0 0 0 9
4 4 2 0 0 0 2 0 0 0 0 8
6
1 10 3 2 0 4 2 0 0 0 0 21
2 6 2 0 0 1 1 2 0 0 0 12
3 5 1 2 1 0 0 0 0 0 0 9
4 2 0 0 0 3 2 0 0 0 0 7
7
1 7 3 4 0 4 2 0 0 0 0 20
2 5 2 0 0 2 1 2 0 0 0 12
3 6 3 0 0 0 0 0 0 0 0 9
4 4 0 0 1 1 2 0 0 0 0 8
8
1 11 2 2 0 4 2 0 0 0 0 21
2 5 2 0 0 2 1 2 0 0 0 12
3 9 0 0 0 0 0 0 0 0 0 9
4 3 1 0 0 2 2 0 0 0 0 8
11
1 12 0 1 0 4 2 0 0 0 0 19
2 5 0 0 0 3 1 2 0 0 0 11
3 6 2 0 1 0 0 0 0 0 0 9
4 5 0 0 1 0 2 0 0 0 0 8
Page 92
Smarter Balanced 2014-15 and 2015-16 Interim Assessment Technical Report
Chapter 4: Test Design
4-24
TABLE 4.9 ITEM TYPES USED IN THE INTERIM COMPREHENSIVE ASSESSMENTS, MATHEMATICS
Grade Claim Item Types Total #
Items MC MS EBSR MI HTQ SA WER EQ GI TI
3
1 0 0 0 1 0 0 0 17 0 2 20
2 1 0 0 0 0 1 0 2 0 0 4
3 3 1 0 2 0 2 0 0 0 0 8
4 q 0 0 0 0 1 0 2 0 0 5
4
1 2 0 0 5 0 0 0 13 0 0 20
2 1 0 0 1 0 0 0 1 0 1 4
3 3 1 0 0 0 2 0 1 0 0 7
4 1 0 0 0 0 1 0 3 0 0 5
5
1 11 0 0 5 0 0 0 4 0 0 20
2 1 0 0 0 0 0 0 3 0 0 4
3 3 2 0 0 0 2 0 1 0 0 8
4 3 0 0 0 0 0 0 1 0 1 5
6
1 1 2 0 4 0 0 0 12 0 0 19
2 1 0 0 0 0 0 0 5 0 0 6
3 3 1 0 1 0 1 0 2 0 0 8
4 0 1 0 0 0 1 0 1 0 0 3
7
1 5 4 0 2 0 0 0 9 0 0 20
2 0 0 0 0 0 0 0 3 0 1 4
3 5 0 0 0 0 2 0 1 0 0 8
4 3 0 0 0 0 0 0 0 0 2 5
8
1 7 2 0 2 0 0 0 9 0 0 20
2 1 0 0 0 0 0 0 3 0 1 5
3 6 0 0 0 0 0 2 0 0 0 8
4 1 0 0 0 0 0 0 3 0 0 4
11
1 11 0 0 5 0 0 0 5 0 0 21
2 1 0 0 0 0 0 0 2 0 0 3
3 5 1 0 0 0 2 0 0 0 0 8
4 1 1 0 1 0 3 0 1 0 0 7
Each grade’s item pool for the Consortium test was large enough to support the interim blueprints.
In addition to the items for the non-PT portion, the Consortium also developed performance tasks. All
students take performance tasks designed to measure a student’s ability to integrate knowledge and
skills across multiple claims and assessment targets. Each ELA/literacy performance task has a set
of related stimuli presented with two or three research items and an essay. Each Mathematics
performance task has 4 to 6 items relating to a central problem or stimulus. Performance tasks are
calibrated concurrently with non-PT items.
The distribution of item parameters by grade are shown below Table 4.9 through Table 4.11.
Page 93
Smarter Balanced 2014-15 and 2015-16 Interim Assessment Technical Report
Chapter 4: Test Design
4-25
TABLE 4.10 ITEM DIFFICULTY (B-PARAMETER) AND DISCRIMINATION (A-PARAMETER) OF INTERIM ASSESSMENT
BLOCKS, ELA/LITERACY
ELA/literacy
Grade
Interim
Assessment
Block Name
N
items
Mean b-
parameter
SD b-
parameter
Mean
a-
parameter
SD
a-parameter
3
Edit and Revise 15 -1.342 0.929 0.718 0.267
Brief Writes 6 0.256 0.265 0.715 0.076
Listen and
Interpret 15 -0.710 0.658 0.633 0.146
Research 17 -0.714 0.956 0.644 0.226
Reading
Informational
Text
16 -0.180 1.086 0.642 0.234
Reading
Literary Text 15 -0.499 0.957 0.778 0.300
Grade 3
Performance
Task
5 0.543 0.903 0.830 0.158
4
Listen and
Interpret 15 -0.404 0.990 0.525 0.155
Edit and Revise 16 -0.886 0.886 0.603 0.137
Research 18 -0.158 0.908 0.587 0.207
Brief Writes 6 0.642 0.439 0.657 0.121
Reading
Literary Text 15 -0.123 1.040 0.708 0.274
Reading
Informational
Text
14 0.074 0.873 0.662 0.226
Grade 4
Performance
Task
5 0.545 0.750 0.830 0.167
5
Brief Writes 6 0.898 0.667 0.605 0.058
Edit and Revise 13 0.028 1.053 0.613 0.216
Reading
Informational
Text
15 0.865 1.002 0.547 0.160
Listen and
Interpret 14 -0.039 1.017 0.568 0.142
Research 17 0.134 0.993 0.657 0.210
Reading
Literary Text 15 0.693 1.119 0.661 0.233
Page 94
Smarter Balanced 2014-15 and 2015-16 Interim Assessment Technical Report
Chapter 4: Test Design
4-26
ELA/literacy
Grade
Interim
Assessment
Block Name
N
items
Mean b-
parameter
SD b-
parameter
Mean
a-
parameter
SD
a-parameter
Grade 5
Performance
Task
5 0.558 0.399 0.782 0.238
6
Brief Writes 6 1.301 0.535 0.680 0.121
Listen and
Interpret 15 0.485 0.760 0.605 0.160
Edit and Revise 18 0.474 1.421 0.553 0.177
Research 18 0.712 0.726 0.660 0.237
Reading
Literary Text 15 0.660 1.155 0.468 0.132
Reading
Informational
Text
16 1.010 0.958 0.632 0.197
Grade 6
Performance
Task
4 0.819 0.863 0.917 0.203
7
Research 15 1.505 1.177 0.503 0.121
Edit and Revise 17 0.544 1.067 0.505 0.141
Listen and
Interpret 15 0.594 1.032 0.486 0.149
Reading
Informational
Text
16 0.989 1.178 0.630 0.217
Brief Writes 6 1.415 0.514 0.620 0.133
Reading
Literary Text 16 0.392 1.160 0.670 0.258
Grade 7
Performance
Task
5 1.636 1.229 0.900 0.162
8
Research 17 1.789 1.388 0.563 0.245
Edit and Revise 14 0.401 1.043 0.570 0.218
Listen and
Interpret 15 0.216 1.184 0.494 0.153
Brief Writes 6 1.540 0.469 0.673 0.150
Reading
Informational
Text
16 1.501 1.087 0.621 0.195
Page 95
Smarter Balanced 2014-15 and 2015-16 Interim Assessment Technical Report
Chapter 4: Test Design
4-27
ELA/literacy
Grade
Interim
Assessment
Block Name
N
items
Mean b-
parameter
SD b-
parameter
Mean
a-
parameter
SD
a-parameter
Reading
Literary Text 16 0.700 1.174 0.703 0.259
Grade 8
Performance
Task
5 1.788 1.535 0.851 0.415
11
Research 17 1.566 1.120 0.523 0.156
Edit and Revise 18 0.666 0.834 0.495 0.157
Reading
Informational
Text
15 1.465 1.160 0.538 0.235
Listen and
Interpret 15 0.426 1.178 0.480 0.081
Brief Writes 6 1.743 0.744 0.521 0.065
Reading
Literary Text 16 1.332 1.262 0.472 0.130
Grade HS
Performance
Task
5 2.263 1.729 0.667 0.213
Page 96
Smarter Balanced 2014-15 and 2015-16 Interim Assessment Technical Report
Chapter 4: Test Design
4-28
TABLE 4.11 ITEM DIFFICULTY (B-PARAMETER) AND DISCRIMINATION (A-PARAMETER) OF INTERIM ASSESSMENT
BLOCKS (IABS), MATHEMATICS
Mathematics
Grade Interim Assessment Block Name N items
Mean
b-
parameter
SD b-
parameter
Mean
a-
parameter
SD
a-
parameter
3
Fractions 13 -0.986 0.867 0.668 0.266
Operations and Algebraic Thinking 15 -1.843 0.743 0.926 0.197
Measurement and Data 15 -1.201 0.851 0.878 0.267
Mathematics Performance Task 6 -0.634 0.375 1.163 0.264
4
Numbers and Operations in Base 10 15 -0.723 0.943 0.705 0.187
Fractions 16 -0.335 0.876 0.890 0.328
Operations and Algebraic Thinking 15 -0.431 0.810 0.786 0.304
Mathematics Performance Task 6 0.147 0.528 0.731 0.175
5
Numbers and Operations in Base 10 16 -0.347 0.933 0.661 0.297
Fractions 15 0.124 1.097 0.824 0.282
Measurement and Data 14 0.435 0.947 0.767 0.180
Mathematics Performance Task 6 0.710 0.698 0.841 0.292
6
Math Gr 6 Interim Expressions &
Equations Block 15 0.292 1.097 0.732 0.206
Math Gr 6 Interim Geometry Block 13 1.367 0.729 0.913 0.200
Math Gr 6 Interim Ratio and
Proportional Relationships Block 14 -0.033 0.933 0.862 0.190
Mathematics Performance Task 6 1.259 0.720 0.833 0.074
7
Interim Number Systems Block 14 1.308 1.435 0.612 0.223
Interim Expressions & Equations
Block 15 1.329 1.130 0.634 0.327
Ratio and Proportional Relationships
Block 14 1.317 1.031 0.597 0.283
Mathematics Performance Task 6 1.036 0.969 0.964 0.227
8
Expressions & Equations II Block 9 1.459 0.959 0.582 0.182
Expressions & Equations I Block 5 0.987 1.183 0.426 0.222
Interim Functions Block 15 1.126 1.039 0.577 0.222
Interim Geometry Block 14 1.549 1.190 0.531 0.179
Mathematics Performance Task 6 0.808 1.233 0.713 0.144
11 Algebra and Functions - Linear
Functions 15 1.772 1.193 0.499 0.226
Page 97
Smarter Balanced 2014-15 and 2015-16 Interim Assessment Technical Report
Chapter 4: Test Design
4-29
Mathematics
Grade Interim Assessment Block Name N items
Mean
b-
parameter
SD b-
parameter
Mean
a-
parameter
SD
a-
parameter
Geometry - Right Triangle Ratios in
Geometry 13 2.345 0.607 0.677 0.186
Algebra and Functions - Quadratic
Functions 13 2.710 1.636 0.439 0.352
Mathematics Performance Task 6 3.655 2.093 0.546 0.294
Page 98
Smarter Balanced 2014-15 and 2015-16 Interim Assessment Technical Report
Chapter 4: Test Design
4-30
TABLE 4.12 ITEM DIFFICULTY (B-PARAMETER) AND DISCRIMINATION (A-PARAMETER) OF INTERIM COMPREHENSIVE
ASSESSMENTS (ICAS)
Grade N-items
Mean b-
parameter
SD b-
parameter
Mean a-
parameter
SD a-
parameter
ELA/literacy
3 48 -0.682 0.979 0.707 0.235
4 49 -0.338 0.901 0.643 0.208
5 48 0.005 0.942 0.652 0.218
6 49 0.366 1.057 0.602 0.227
7 49 0.667 0.938 0.572 0.204
8 50 0.525 1.123 0.643 0.276
11 47 0.754 1.234 0.483 0.193
Mathematics
3 37 -1.086 0.808 0.901 0.292
4 36 -0.459 0.770 0.835 0.251
5 37 0.005 0.884 0.667 0.279
6 36 0.510 0.909 0.780 0.214
7 37 0.603 0.865 0.693 0.316
8 37 0.860 0.864 0.579 0.215
11 39 1.504 1.668 0.471 0.195
Content Alignment for ICAs
In developing a system of assessments, Smarter Balanced is committed to ensuring that its
measurement reflects the expectations of content, rigor, and performance that correspond to the
CCSS. To that end, Smarter Balanced designed item specifications to demonstrate alignment
through methodologies that reflect ECD theory. According to Webb (2002), “Alignment of
expectations for student learning and assessments for measuring students’ attainment of these
expectations is an essential attribute for an effective standards-based education system.” DeMauro
(2004) states, “Alignment activities . . . should be the guiding principle of test design, and item
alignment studies should be sources of validity documentation, as should any studies of test
content.” Test content alignment is at the core of content validity and consequential validity
(Martone & Sireci, 2009). Content alignment addresses the appropriateness of inferences drawn
from test results concerning “how well all policy elements [e.g., expectations and assessments]
guide instruction and, ultimately, impact student learning” (Webb, 1997). Since Consortium states
have adopted the CCSS in ELA/literacy and mathematics, it was imperative that Smarter Balanced
conduct the appropriate alignment studies. Accordingly, the Consortium contracted with the Human
Resources Research Organization to conduct an alignment study (HumRRO, 2014).
Webb (1997) identified several categories of criteria for judging content alignment. The Smarter
Balanced alignment study describes how well the Smarter Balanced summative and ICA test designs
address expectations embodied in the Smarter Balanced content specifications and the CCSS. Test
content alignment is at the core of content validity and consequential validity (Martone and Sireci,
2009). Because of the high stakes associated with statewide testing and the need to communicate
Page 99
Smarter Balanced 2014-15 and 2015-16 Interim Assessment Technical Report
Chapter 4: Test Design
4-31
learning goals, the HumRRO study directed attention to test alignment in addition to individual item
alignment. The emphasis on test content in alignment and validity studies is understandable. After
all, a test is a small sampling of items from a much larger universe of possible items/tasks
representing a very broad domain. For inferences from test results to be justifiable, that sample of
items has to be an adequate representation of the broad domain, providing strong evidence to
support claims based on the test results. Full results of the HumRRO study can be found at
https://portal.smarterbalanced.org/library/en/v1.0/smarter-balanced-assessment-consortium-
alignment-study-report.pdf
Assessment is always constrained to some extent by time and resources. Items and tasks that
require extensive time (performance tasks and text responses), items that require expensive scoring,
and items that require a lot of computer bandwidth (videos, animations) must be limited and chosen
carefully. Smarter Balanced content experts carefully scrutinized each blueprint to assure optimal
content coverage and prudent use of time and resources. In general, the Smarter Balanced
summative and ICA blueprints represent content sampling proportions that reflect intended
emphasis in instruction and mastery at each grade level. Specifications for numbers of items by
claim, assessment target, depth-of-knowledge, and item type demonstrate the desired proportions
within test delivery constraints. The blueprints were subject to state approval through a formal vote.
IAB Test Design
Interim Assessment Blocks are designed by teams of content experts to reflect groups of skills most
likely to be addressed in instructional units. These tests are short and contain a focused set of skills.
They provide an indicator of whether a student is clearly above or below standard, or whether
information is not sufficient to make a judgement with regard to meeting standard.
Summary of Test Design
The intent of this chapter is to show how the assessment design supports the purposes of Smarter
Balanced interim assessments. Content specifications were derived directly from the CCSS,
expressing the standards as measurable elements and made explicit in Smarter Balanced claims
and assessment targets structure. Building on these, test blueprints provide appropriate proportions
of CCSS content coverage. Using interim blueprints, item writers wrote items and tasks in quantities
that supported non-PT and performance task delivery. Expansion of item and task types promoted
student responses that provide more insight into proficiency than that provided by multiple choice
items alone. The use of performance tasks in ICAs and in some IABs addresses the need to assess
application and integration of skills.
Page 100
Smarter Balanced 2014-15 and 2015-16 Interim Assessment Technical Report
Chapter 4: Test Design
4-32
References
American Institutes for Research (2013). Cognitive Laboratories Technical Report. Los Angeles, CA:
Smarter Balanced Assessment Consortium.
American Institutes for Research (2014). Smarter Balanced scoring specification: 2014–2015
Administration. Los Angeles, CA: Smarter Balanced Assessment Consortium.
Cohen, J. & Albright, L. (2014). Smarter Balanced adaptive item selection algorithm design report.
Retrieved from http://www.smarterapp.org/specs/AdaptiveAlgorithm.html
Council of Chief State School Officers (2014). Criteria for procuring and evaluating high quality
assessments.
Dana, T. M., & Tippins, D. J. (1993). Considering alternative assessment for middle level learners.
Middle School Journal, 25, 3-5.
DeMauro, G. E. (2004). Test alignment considerations for the meaning of testing. Paper presented at
the CCSSO Annual Conference on Large Scale Assessment, Boston, MA.
Doorey, N., & Polikoff, M. (2016). Evaluating the content and quality of next generation
assessments. Washington DC: Thomas B. Fordham Institute.
Fadel, C., Honey, M., & Pasnik, S. (2007, May). Assessment in the age of innovation. Education
Week. May 18, 2007. Retrieved on July 2, 2012 from
http://www.edweek.org/ew/articles/2007/05/23/38fadel.h26.html?print=1
Hansen, E. G. and Mislevy, R. J. (2008), Design patterns for improving accessibility for test takers
with disabilities. ETS Research Report Series, 2008: i–32. doi: 10.1002/j.2333-
8504.2008.tb02135.x
Martone, A., & Sireci, S. G. (2009). Evaluating alignment between curriculum, assessment, and
instruction. Review of Educational Research, 79, 1-76.
Mislevy R., & Haertel G., (2006). Implications of evidence-centered design for educational testing.
Menlo Park, CA: SRI International.
Mislevy, R.J., Steinberg, L.S., & Almond, R.G. (2003). On the structure of educational assessments.
Measurement: Interdisciplinary Research and Perspectives, 1, 3-67.
Reckase, M. D. (2003). Item pool design for computerized adaptive tests. Paper presented at the
National Council on Measurement in Education, Chicago, IL.
Rose, D., & Meyer, A. (2000). Universal design for learning, associate editor column. Journal of
Special Education Technology 15 (1): 1-12.
Schmeiser, C. B., & Welch, C. J. (2006). Test Development. In R. L. Brennan (Ed.) Educational
Measurement, 4th Edition (307-353). Washington, DC: American Council on Education.
Schultz, S. R., Michaels, H. R., Dvorak, R. N., & Wiley, C. R. H. (2016). Evaluating the content and
quality of next generation high school assessments. Alexandria, VA: HumRRO.
Smarter Balanced Assessment Consortium (2010, June 23). Race to the Top Assessment Program
Application for New grants: Comprehensive Assessment Systems, CFDA Number: 84.395B.
OMB Control Number 1810-0699.
Smarter Balanced Assessment Consortium. (2014). State procedures manual. Los Angeles, CA:
Smarter Balanced Assessment Consortium.
Page 101
Smarter Balanced 2014-15 and 2015-16 Interim Assessment Technical Report
Chapter 4: Test Design
4-33
Smarter Balanced Assessment Consortium. (2015a). ELA/Literacy summative assessment blueprint.
Retrieved from http://www.smarterbalanced.org/wp-
content/uploads/2015/08/ELA_Blueprint.pdf
Smarter Balanced Assessment Consortium. (2015b). Mathematics summative assessment
blueprint. Retrieved from http://www.smarterbalanced.org/wp-
content/uploads/2015/08/Mathematics_Blueprint.pdf
Smarter Balanced Assessment Consortium. (2015c). ELA/Literacy interim assessment blocks
blueprint. Retrieved from http://www.smarterbalanced.org/wp-
content/uploads/2016/05/ELA-IAB-Blueprint_2015-16.pdf
Smarter Balanced Assessment Consortium. (2015d). Mathematics interim assessment blocks
blueprint. Retrieved from http://www.smarterbalanced.org/wp-
content/uploads/2016/05/Math_Blueprint_IAB_2015-16.pdf
Smarter Balanced Assessment Consortium. (2015e). Content specifications for the summative
assessment of the common core state standards for English language arts and literacy in
history/social studies, science, and technical subjects. Retrieved from
http://www.smarterbalanced.org/wp-content/uploads/2015/08/ELA_Content_Specs.pdf
Smarter Balanced Assessment Consortium. (2015f). Content specifications for the summative
assessment of the common core state standards for mathematics. Retrieved from
http://www.smarterbalanced.org/wp-content/uploads/2015/08/Mathematics-Content-
Specifications.pdf
Smarter Balanced Assessment Consortium. (2015g). Item and task specifications. Retrieved from
http://www.smarterbalanced.org/assessments/development/
Smarter Balanced Assessment Consortium. (2015h). Achievement level setting final report.
Retrieved from http://www.smarterbalanced.org/assessments/development/additional-
technical-documentation/
Smarter Balanced Assessment Consortium. (2015i). End of grant report. Retrieved from
https://portal.smarterbalanced.org/library/en/v1.0/end-of-grant-report.pdf
Smarter Balanced Assessment Consortium. (2016a). 2013-2014 Technical Report. Retrieved from
http://www.smarterbalanced.org/wp-content/uploads/2015/08/2013-
14_Technical_Report.pdf
Smarter Balanced Assessment Consortium. (2016b). 2014-2015 Technical Report. Retrieved from
https://portal.smarterbalanced.org/library/en/2014-15-technical-report.pdf
van der Linden, W. J. (2005). Linear models for optimal test design. New York: Springer.
Webb, N. L. (1997a, April). Criteria for alignment of expectations and assessments in mathematics
and science education. Research Monograph No. 6. Washington, DC: Council of Chief State
School Officers.
Webb, N. L. (March 28, 2002) Depth-of-Knowledge Levels for Four Content Areas, unpublished
paper.
Zhang, T., Haertel, G., Javitz, H., Mislevy, R., Murray, E., & Wasson, J. (2009). A Design Pattern for a
Spelling Bee Assessment for Students with Disabilities. A paper presented at the annual
conference of the American Psychological Association, Montreal, Canada
Page 102
Smarter Balanced 2014-15 and 2015-16 Interim Assessment Technical Report
Chapter 5: Test Administration
5-1
Chapter 5: Test Administration
Page 103
Smarter Balanced 2014-15 and 2015-16 Interim Assessment Technical Report
Chapter 5: Test Administration
5-2
Introduction
“The usefulness and interpretability of test scores require that a test be administered and scored
according to the developer’s instructions” (AERA, APA, & NCME, 2014, p. 111). Smarter Balanced
created and disseminated a customizable test administration manual (2014a) to ensure
standardized test administration procedures and, thus, uniform test administration conditions for all
students in Smarter Balanced member states. This chapter describes the customizable Smarter
Balanced Online Test Administration Manual (TAM; Smarter Balanced Assessment Consortium,
2014a).
For these fixed form tests(interim assessments are currently only available as fixed forms), the
information on reliability and error comes from the properties of items on test forms. This
information holds true only when tests are administered in the standardized manner described in the
TAM and only for the first administration. In many cases non-standard administration is used. Tests
may be administered at several points in the school year, and items on the IABs and ICA are shared.
This means that items have been exposed and no longer have the same parameters. Some teachers
use the tests as a tool for discussion, working through each item with the class. When tests are used
in these manners they no longer have the statistical properties outlined in other chapters, but results
can be useful when test-taking conditions are known. Members should be advised that when interim
scores are stored for future reference, the conditions of administration should be noted so that
results can be interpreted correctly.
Test Administration
The ICAs and IABs may be administered online through the open-source test administration system
or through an alternate system the member may secure through a service provider. The ICAs will use
the same specifications as the summative assessments. The specifications for the IABs will have the
following additional content constraints.
• Multiple configurations: Districts/schools may elect to administer both the ICA and IAB during
the school year.
• Multiple administrations: The ICAs and IABs (including those for the same block) may be
administered multiple times within an academic year. Members may determine the schedule
for interim assessments or delegate the administration of interim assessments to
schools/districts. The Consortium will not limit the number of times that the ICAs and/or IABs
are administered. Members will need to work with service providers to determine contractual
expectations related to the number of administrations. Despite this allowance, members
should be aware of risks associated with administering these assessments multiple times
within an academic year.
• Item over-exposure: testing multiple times a year limits the item pool available to
students, which will increase the possibility of students encountering the same item
several times. Over-exposed items are unlikely to hold their original parameters and may
skew performance results. To prevent this, schools and classrooms may want to limit
their testing program to either a judicious use of ICAs or to coordinated use of IABs.
• Hand-scoring: Some of the interim items require hand-scoring. Members will have to
allocate resources (either vendor resources or local resources) to hand-scoring and
multiple administrations may add to this effort.
• Grade levels: The ICA and IAB are composed of items aligned to the CCSS in grades 3–8 and
high school. However, the interim assessments are not constrained by grade level. Students
may take an off-grade-level interim assessment.
Page 104
Smarter Balanced 2014-15 and 2015-16 Interim Assessment Technical Report
Chapter 5: Test Administration
5-3
Session Time
Table 6.1 presents the estimated testing times for the ICA as it follows the same format as the
summative assessment. Session times are not available for the interim assessment blocks as these
are administered at the discretion of the teacher. These were provided within the Online Test
Administration Manual (Smarter Balanced, 2014a, pp. 25-26). The estimated times for each session
of each content area test provides sufficient time for students to attempt all items.
TABLE 5.1: ESTIMATED TESTING TIMES FOR SMARTER BALANCED ASSESSMENTS (ICA ONLY)
Content Area Grades
Computer
Adaptive Test
(CAT) items
hrs : mins
Performance
Task (PT)
hrs : mins
Total
hrs : mins
Classroom
Activity
(administered
prior to the
PT)*
hrs : mins
Total
hrs : mins
ELA/Literacy
3–5 1: 30 2:00 3:30 :30 4:00
6–8 1:30 2:00 3:30 : 30 4:00
HS 2:00 2:00 4:00 : 30 4:30
Mathematics
3–5 1:30 1:00 2:30 : 30 3:00
6–8 2:00 1:00 3:00 : 30 3:30
HS 2:00 1:30 3:30 : 30 4:00
Both
3–5 3:00 3:00 6:00 1:00 7:00
6–8 3:30 3:00 6:30 1:00 7:30
HS 4:00 3:30 7:30 1:00 8:30
* Classroom Activities are designed to fit into a thirty-minute window; however, the time within the window
will vary due to the complexity of the topic and individual student needs.
Test Administration Manual
The Smarter Balanced Assessment Consortium State Members Procedures Manual (Smarter
Balanced Assessment Consortium, 2014c )provides a high-level overview of the assessment system
(including summative and interim assessments), including expected policies and procedures for
administration, required trainings, general information about the open source platform, information
about the evidence states must provide to Smarter Balanced annually, procurement information,
and links to resource documents.
Specific instructions for member states to administer Smarter Balanced interim assessments are
developed by each state and are available on the state’s website as states are able to customize the
uses of the interim assessments to fit their needs. Specific components of these user guides and
Page 105
Smarter Balanced 2014-15 and 2015-16 Interim Assessment Technical Report
Chapter 5: Test Administration
5-4
manuals require customization to meet unique needs in each member state. These components
include:
• Help Desk information
• Test expiration dates
• Administration and Registration Tools (ART) user roles
• State user roles
• Test security policy
• Links to where materials and modules are posted
• Test Security/Administration training policy
• Instructions for identifying and retrieving the Classroom Activity
• Role–specific checklists
The development of the Smarter Balanced test administration manuals was guided by the AERA,
APA, and NCME 2014 Standards. In regard to test administration, the Standards provide guidance to
test developers that the directions for test administration should be sufficiently clear to allow for
standardized implementation in a variety of conditions (see Standard 4.15). In addition, the
standards provide guidance that test developers should provide sufficient detail so that test takers
can respond to items and tasks in the manner intended by the test developer (see Standard 4.16).
Clear Directions to Ensure Uniform Administration
Smarter Balanced test administration manuals (Smarter Balanced Assessment Consortium 2014d,
2014e) include instructions that clearly articulate various aspects of the administration process. The
TAMs, developed by each member state, cover an extensive amount of material for events that occur
before, during, and after testing. In addition, the TAMs point the user to training materials that
further provide detail and clarity to support reliable test administration by qualified test
administrators. The details provided in the TAMs describe the general rules of online testing,
including; pause rules; scheduling tests; recommended order of test administration; classroom
activity information; assessment duration, timing, and sequencing information; and the materials
that the test administrator and students need for testing.
Detailed Instructions for Test Takers
The state-specific TAM provides step-by-step instructions to test administrators (TA) on how to start a
standardized test session, monitor a test session, and end a test session. Smarter Balanced
provides tutorials and practice tests0F
3 for each content area to familiarize students with how to
navigate the online test delivery system and practice with the item types and the functionality of the
testing environment. Together with the detailed instructions, the tutorials and practice tests assure
that students are able to answer the items and tasks in the manner intended by Smarter Balanced.
Responsibilities of Test Administrators
The AERA, APA, and NCME Standards (2014) also provide guidance to test administrators and test
users. Test administrators are guided to carefully follow the standardized procedures (Standard 6.1);
inform test takers of available accommodations (Standard 6.2); report changes or disruptions to the
standardized test administration (Standard 6.3); furnish a comfortable environment with minimal
distractions (Standard 6.4); provide appropriate instructions, practice, and other supports (Standard
6.5); and ensure the integrity of the test by eliminating opportunities for test taker malfeasance
(Standard 6.6). In addition, test users are responsible for test security at all times (Standard 6.7).
3 http://www.smarterbalanced.org/assessments/practice-and-training-tests/
Page 106
Smarter Balanced 2014-15 and 2015-16 Interim Assessment Technical Report
Chapter 5: Test Administration
5-5
Interim tests are not secure in the same manner as summative tests. Interim items may be
discussed or used as classroom examples. They are however, secure in the sense that they are not
to be made public through social media or other means.
When administering interim tests under standard conditions, guidelines in the TAM should be
followed:
• careful direction to TAs to strictly adhere to the directions in the TAM;
• available universal tools, designated supports, and accommodations;
• requirements of the test environment, including student seating, providing a quiet
environment, and access to allowable universal tools, designated supports, and
accommodations;
• descriptions of testing improprieties, irregularities, and breaches.
Tools, Designated Supports, and Accommodations
All interim assessments are fully accessible and feature all elements in the Smarter accessibility
system. To enhance student access to the assessment content during test administration, Smarter
Balanced developed a conceptual model that included universal tools, designated supports, and
accommodations (Smarter Balanced Assessment Consortium, 2014b, p.4). Universal Tools are
access features of the Smarter Balanced assessment that are either provided as digitally-delivered
components of the test delivery system (embedded) or provided separately from the test delivery
system (non-embedded). Universal tools are available to all students based on student preference
and selection. Embedded universal tools include (but are not limited to) such features as a “pause”
feature that allows the student to take a break of 20 minutes or less during the assessment; a digital
calculator that the student may access by clicking on a calculator button; and a digital notepad. Non-
embedded universal tools include (but are not limited to) provision of an English dictionary for the
full-write portion of the ELA/literacy performance task and the provision of physical scratch paper for
all content area tests.
Designated supports for the Smarter Balanced assessments are embedded and non-embedded
features that are available for use by any student for whom the need has been indicated by an
educator or team of educators (along with the student and his/her parent/guardian) familiar with the
student’s instructional needs. Embedded designated supports include (but are not limited to) such
features as color contrast, which enables students to adjust background or font color; translated test
directions, translated glossaries, and stacked translations for mathematics items. Non-embedded
designated supports include (but are not limited to) provision of color overlays; printing test content
with different colors; use of magnification devices; and use of noise buffers.
Accommodations are changes in procedures or materials that increase equitable access during the
Smarter Balanced assessments. Students receiving accommodations must have a need for those
accommodations documented in an Individualized Education Program (IEP) or 504 accommodation
plan. Like universal tools and designated supports, accommodations may be either embedded or
non-embedded. Examples of embedded accommodations include (but are not limited to) closed
captioning and test content translated into American Sign Language (ASL) video. Non-embedded
accommodations include (but are not limited to) use of an abacus, print on demand, and use of an
external communication device (speech-to-text). Universal tools, designated supports, and
accommodations all yield valid scores that count as participation in assessments that meet the
requirements of ESEA when used in a manner consistent with the Smarter Balanced Usability,
Accessibility, and Accommodations Guidelines (Smarter Balanced Assessment Consortium, 2014b).
A complete summary of all embedded and non-embedded universal tools, designated supports, and
accommodations is included in the Usability, Accessibility, and Accommodations Guidelines (Smarter
Balanced Assessment Consortium, 2014b).
Page 107
Smarter Balanced 2014-15 and 2015-16 Interim Assessment Technical Report
Chapter 5: Test Administration
5-6
References
American Educational Research Association, American Psychological Association, & National Council
on Measurement in Education. (2014). Standards for educational and psychological testing.
Washington, DC: American Educational Research Association.
Smarter Balanced Assessment Consortium. (2014a, August 25). Online, summative, test
administration manual: Test of English language arts/literacy and mathematics. Los
Angeles, CA: Author.
Smarter Balanced Assessment Consortium. (2014b, November 5). Usability, Accessibility, and
Accommodations Guidelines. Los Angeles, CA: Author.
Smarter Balanced Assessment Consortium. (2014c). Test administrator user guide. Los Angeles, CA:
Author.
Smarter Balanced Assessment Consortium. (2014d, December). English language arts summative
assessment: Paper-pencil test administration manual. Los Angeles, CA: Author.
Smarter Balanced Assessment Consortium. (2014e, December). Mathematics summative
assessment: Paper-pencil test administration manual. Los Angeles, CA: Author.
Page 108
Smarter Balanced 2014-15 and 2015-16 Interim Assessment Technical Report
Chapter 6: Reporting and Interpretation
6-1
Chapter 6: Reporting and
Interpretation
Page 109
Smarter Balanced 2014-15 and 2015-16 Interim Assessment Technical Report
Chapter 6: Reporting and Interpretation
6-2
Introduction
The use of the Smarter Balanced reporting system is optional and configurable, therefore
information about a specific member’s reports should be gathered from member websites and
materials. Scores from the ICAs provide information about student achievement with regard to
college and career readiness. As noted in chapters on test design and scoring, the ICA provide an
overall indicator of proficiency and a set of claim indicators corresponding to broad areas within the
content areas. Information from IABs is reported in the same manner as Claim level information on
the ICAs. The Consortium provides a set of reports based on these scores and claim information that
members may customize for their own use.
This chapter provides an overview of the Smarter report system. For detailed information, consult the
Smarter Balanced Reporting System User Guide (Smarter Balanced, 2014). Smarter Balanced
reports are based on information provided in the output of the test scoring algorithm. Overall scores
and sub-scores each have an associated standard error of measurement (SEM) that indicates the
reliability of the score. (For a fuller explanation of the SEM, refer to Chapter 2.)
Overall Test Scores
Scale scores are the basic units of overall reporting for summative and ICA tests. These scores fall
along a continuous vertical scale (from approximately 2000 to 3000) that increases across grade
levels. Scores are used to describe an individual student’s current level of achievement. They can
also be used to track growth over time. When aggregated, scale scores are used to describe
achievement for different groups of students.
For the ICA, the Smarter Balanced reporting system communicates an overall scale score in relation
to Achievement Levels using graphics similar to Figure 6.1. By default, the system uses generic
terms for the Achievement Levels, Level 1, Level 2, Level 3, and Level 4, but members may
customize them using terms such as “novice, developing, proficient, advanced” or others.
FIGURE 6.1 PORTRAYAL OF ICA SCORE REPORTING LEVELS. FROM REPORTING SYSTEM USER GUIDE, P.13.
ICA scale scores are reported with an error band based on the SEM (see Chapter 2). In Figure 6.1,
the overall score is 2475, which is in Level 2, and the score’s error band encompasses Level 3.
Smarter Balanced reporting provides information to help users understand the meaning of the error
bands, as shown in Figure 6.2.
Page 110
Smarter Balanced 2014-15 and 2015-16 Interim Assessment Technical Report
Chapter 6: Reporting and Interpretation
6-3
FIGURE 6.2 EXPLANATION OF ERROR BANDS DISPLAYED ON SMARTER BALANCED REPORTS. FROM REPORTING
SYSTEM USER GUIDE, P.120.
Depicting errors and error bands in score reporting is an important measurement principle. In this
portrayal, the score is represented by the vertical line and black triangle. The error band is shown by
the brackets. If the test were to be given again, the score is likely to fall within this band.
Smarter Balanced has developed a set of optional Reporting Achievement Levels for ELA/literacy
and mathematics that are aligned with the Common Core State Standards (CCSS) and Smarter
Balanced assessment claims. The intent of these descriptors is to specify, in content terms, the
knowledge and skills that students may display at four levels of achievement. The full set of optional
Reporting Achievement Levels s are shown in Appendix E.
Sub-scores and IABs
ICA claim and reporting category indicators are based on sub-scores for important domain areas
within each content area. IAB results are reported in the same manner as claim results on the ICA
and summative tests. The claims and reporting categories are primary structural elements in ICA test
blueprints. IAB results are based on the IAB blueprints which reflect instructional target or domain
grouping.
Table 6.1 and Table 6.2 provide the claims or sub-score reporting categories for ICAs.
TABLE 6.1 ENGLISH LANGUAGE ARTS/LITERACY CLAIMS
Claim #1- Reading
• Students can read closely and analytically to comprehend a range of increasingly complex literary
and informational texts.
Claim #2- Writing
• Students can produce effect and well-grounded writing for a range of purposes and audiences.
Claim #3- Speaking and Listening
• Students can employ effective speaking and listening skills for a range of purposes and audiences.
At this time, only listening is assessed.
Claim #4- Research
• Students can engage in research /inquiry to investigate topics and to analyze, integrate, and
present information.
Page 111
Smarter Balanced 2014-15 and 2015-16 Interim Assessment Technical Report
Chapter 6: Reporting and Interpretation
6-4
TABLE 6.2 MATHEMATICS CLAIMS AND SCORE REPORTING CATEGORIES
Claim #1- Concepts and Procedures
• Students can explain and apply mathematical concepts and interpret and carry out mathematical
procedures with precision and fluency.
Claim #2- Problem Solving/ Claim #4- Modeling and Data Analysis
• Students can solve a range of complex well-posed problems in pure and applied mathematics, making
productive use of knowledge and problem solving strategies. Students can analyze complex, real-
world scenarios and can construct and use mathematical models to interpret and solve problems
• Students can analyze complex, real-world scenarios and can construct and use mathematical models
to interpret and solve problems
Claim #3- Communicating Reasoning
• Students can clearly and precisely construct viable arguments to support their own reasoning and to
critique the reasoning of others.
Achievement Levels for claims and IABs are not established, so claim and IAB results are not
portrayed in Achievement Levels. In addition, SEMs for ICA claims and IABs are fairly large.
Consequently, sub-scores are reported as “Below Standard”, “At or Near Standard”, or “Above
Standard”. These designations are based on the SEM of the claim or IAB score and its distance from
the cut score between levels 2 and 3, which is an indicator of being on-track for college or career
readiness. If the Level 2/3 cut score falls within a 1.5 SEM error band, it is designated as “At or Near
Standard”. If the Level 2/3 cut score is above the error band, the claim or IAB score is designated as
“Below Standard”; if the cut score is below the error band, the sub-score is “Above Standard”.
TABLE 6.3 IAB SCORE AND ICA SUB-SCORE CATEGORIES
Above Standard
Score is > 1.5 SEMs above the Level 2/3 cut
score
At or Near Standard
The Level 2/3 cut score falls within an error
band of +/- 1.5 SEMs around the sub-score
Below Standard
Score is > 1.5 SEMs below the Level 2/3 cut
score
A practical way to understand this is portrayed in the graphic below. Instead of using error bands, it
shows the reporting level area that would result from a scale score and SEM.
Page 112
Smarter Balanced 2014-15 and 2015-16 Interim Assessment Technical Report
Chapter 6: Reporting and Interpretation
6-5
FIGURE 6.3 PORTRAYAL OF IAB SCORE AND ICA SUB-SCORE REPORTING. FROM REPORTING SYSTEM USER GUIDE,
PP.116-117.
Although IAB scores and ICA sub-scores are portrayed in Smarter Balanced reports by the three-level
system above (also called “traffic-light” indicators) sub-score scale scores and SEMs are available to
members in the data provided from their vendors. Members may use these in local reporting
systems.
Results for IABs are reported in the same manner as claim results on summative tests or ICAs. That
is, the results are given as “Below Standard”. “At or Near Standard” and “Above Standard”. The
same rules are used to establish categories.
Reporting for IABs is focused on communicating the block-level results for a list of students by
assessment grade, and for individual student reporting. Like the ICA, IAB results are not aggregated.
As IABs are locally scored, educators will see individual student responses to hand-scored items
through the Scoring component. A single Individual student report is provided for all the interim block
assessments that a student has taken in a given academic year.
Educators, students, parents and guardians may use these reports to understand a student’s
achievement, progress toward mastery of the Common Core State Standards and attainment of the
academic knowledge and skills required to be college content- and career-ready. The report may
provide context for a parent-teacher conference or, together with other instructional data, may help
to identify areas for instructional focus.
Types of Reports
The Smarter Balanced reporting system is an interactive, online reporting platform that provides a
range of reports. Members can log into the system to create reports and configure the system to
show a state or group logo or test name. They can use their own labels for Achievement Levels and
their own student groups if desired. There is one type of report available for the interim
assessments: Individual student reports (ISRs). The ISR will be described briefly here, but the reader
is urged to consult the Smarter Balanced Reporting System User Guide for more detail.
Individual Student Report (ISR)
These reports present individual student assessment scores, SEMs and achievement levels. They
also display the reporting levels for claim/sub-score results along with claim level Achievement
Levels. The scores and descriptions provide context for understanding what the assessment has
measured and how to interpret the scores and sub-scores. Teachers, students and parents use this
report to understand a student’s achievement and progress toward mastery of the CCSS. The report
may be part of a larger set of information to provide context for instructional focus. IAB scores and
ICA sub-scores are reported as shown in Figure 6.4 below.
Page 113
Smarter Balanced 2014-15 and 2015-16 Interim Assessment Technical Report
Chapter 6: Reporting and Interpretation
6-6
FIGURE 6.4 ILLUSTRATION OF IAB SCORE AND ICA SUB-SCORE REPORTING ON INDIVIDUAL STUDENT REPORTS
Individual Student Reports can be downloaded as PDF files for easy printing and distribution to
parents.
Data Downloads
In addition to the predesigned reports, the reporting system offers authorized users the ability to
download data for distribution or further review and analysis in external systems. User authorization
is closely controlled for ISRs and personally identifiable information (PII) in files. The list of available
data downloads appears below. Note that these downloads assume that members have loaded data
into the Smarter Balanced Data Warehouse. In practice, many members get this information directly
from test delivery service providers and do not go through the Data Warehouse.
Page 114
Smarter Balanced 2014-15 and 2015-16 Interim Assessment Technical Report
Chapter 6: Reporting and Interpretation
6-7
FIGURE 6.5 DATA DOWNLOAD OPTIONS
Download Type Description
Student Assessment
Results
This is a bulk download of the assessment results for the selected
assessment, with one row per student-assessment. The resulting
files contain all of the data for Overall and Claim scores (e.g., scale
score, error band, level determination), as well as all the student
data (e.g., demographics, grade/school/district/state attribution,
etc.) for the specific summative or interim assessment being
viewed.
Printable Student
Reports Printable versions of list and aggregate reports
State Download:
Student Registration
Statistics
This download shows statistics of registration records for a
specified academic year and compares them to those of previous
years to detect errors. This download is primarily intended for
Consortium, state, and district administrators.
State Download:
Assessment
Completion
Statistics
For a specified assessment administration, this download provides
counts of registered and assessed students and percentages of
students assessed. This enables an administrator to review how
many of the registered students have been assessed.
State Download:
Audit XML
This download ensures that all information for a given student
assessment is maintained, including usage reports for Universal
Tools and Designated Supports, as well as any additional data
provided by a Test Delivery System
Summary
Smarter Balanced reports tie together report categories, Achievement Levels, and optionally the
Reporting Achievement Levels to provide coherent information about student progress. Reporting
categories are based on test structure which in turn reflects close analysis of the CCSS. In addition,
the Smarter Balanced scale and Achievement Levels were set by the comprehensive process
described in Chapter 5.
The dynamic nature of the reports, allowing users to sort and filter to get custom information and the
provision of customized download data for any kind of analysis, gives Consortium members a rich
flexible set of results. By providing capability for multiple reports and downloads, the Smarter
Balanced system affords members with a dynamic and flexible system.
Page 115
Smarter Balanced 2014-15 and 2015-16 Interim Assessment Technical Report
Chapter 6: Reporting and Interpretation
6-8
References
Smarter Balanced Assessment Consortium. (2014f, November 14). Interpretation and Use of Scores
and Achievement Levels. Los Angeles, CA: Author. Retrieved from
https://www.smarterbalanced.org/wp-content/uploads/2015/08/Interpretation-and-Use-of-
Scores.pdf
Smarter Balanced Assessment Consortium. (2014, September 7). Reporting System User Guide. Los
Angeles, CA: Author. Retrieved from http://www.smarterapp.org/manuals/Reporting-
UserGuide.html
Page 116
Smarter Balanced 2014-15 and 2015-16 Interim Assessment Technical Report
Appendix A: Estimating DIF
A-1
Appendix A: Estimating Differential Item Functioning
For dichotomous items, the statistic described by Holland and Thayer (1988), known as Mantel-Haenszel D-DIF (MH
D-DIF), is reported. This statistic is reported on the delta scale, which is a normalized transformation of item difficulty
(p-value) with a mean of 13 and a standard deviation of 4. Items that are not significantly different based on the MH
D-DIF (p > 0.05) are considered to have similar performance between the two studied groups; these items are
considered to be functioning appropriately. For items where the statistical test indicates significant differences (p <
0.05), the effect size is used to determine the direction and severity of the DIF. The formula for the estimate of
constant odds ratio is
rm fm
m
m
MH
fm rmm
m
WR
N= ,
WR
N
where
Rrm = number in reference group at ability level m answering the item right;
Wfm = number in focal group at ability level m answering the item wrong;
Rfm = number in focal group at ability level m answering the item right;
Wrm = number in reference group at ability level m answering the item wrong; and
Nm = total group at ability level m.
This value can then be used as follows (Holland & Thayer, 1988):
- ln MHMH D-DIF = 2.35 [ ] .
The Mantel-Haenszel chi-square statistic used to classify items into the three DIF categories is
21( ( ) )
2
( )
rm rmm m
rmm
R E R
MH CHISQ =Var R
,
where2
( ) / , ( )( 1)
rm fm Nm Nm
rm rm Nm m rm
m m
N N R WE R N R N Var R
N N
, rmN and fmN are the numbers of examinees in the reference and
focal groups, respectively, NmR and NmW are the number of examinees who answered the item correctly and
incorrectly, respectively. The classification logic used for flagging items is based on a combination of absolute
differences and significance testing. Items that are not statistically different based on the MH D-DIF (p > 0.05) are
considered to have similar performance between the two studied groups; these items are considered to be
functioning appropriately. For items where the statistical test indicates significant differences (p < 0.05), the effect
size is used to determine the direction and severity of the DIF. The classification logic for selected–response items is
based on a combination of absolute differences and significance testing, is shown in Figure 3.1.
The standardized mean difference compares item performance of two subpopulations adjusting for differences in
the distributions of the two subpopulations. The standardized mean difference statistic can be divided by the total
standard deviation to obtain a measure of the effect size. A negative value of the standardized mean difference
shows that the item is more difficult for the focal group, whereas a positive value indicates that it is more difficult for
the reference group. The standardized mean difference used for polytomous items is defined as:
FK FK FK RKSMD p m p m ,
where Fkp is the proportion of the focal group members who are at the kth level of the matching variable, Fk
m is the
mean score for the focal group at the kth level, and Rkm is the mean item score for the reference group at the kth level.
The standardized mean difference is divided by the total item group standard deviation to get a measure of the
effect size. The classification logic for polytomous items is based on a combination of absolute differences and
Page 117
Smarter Balanced 2014-15 and 2015-16 Interim Assessment Technical Report
Appendix A: Estimating DIF
A-2
significance testing. Items that are not statistically different are considered to have similar performance between the
two studied groups; these items are considered to be functioning appropriately.
Page 118
Smarter Balanced 2014-15 and 2015-16 Interim Assessment Technical Report
Appendix B: Test Blueprints
B-1
Appendix B: Test Blueprints
The charts below show the test blueprints for the Interim Comprehensive Assessment and the Interim Assessment Blocks for both English
Language Arts/Literacy and Mathematics.
English Language Arts/Literacy Interim Comprehensive Assessment Test Blueprints
Blueprint Table ELA/Literacy Grades 3–5
Estimated Total Testing Time: 4:00 (with Classroom Activity)1
Claim/Score
Reporting
Category2
Content Category3
Stimuli Items Total
Items by
Claim4 CAT PT5
CAT
Items6
PT
Items7
1. Reading
Literary 2 0 7--8
0 14--16
Informational 2 0 7--8
1 All times are estimates. Actual times may vary.
2 Each student receives an overall ELA/literacy score and four claim scores or subscores reported at the individual level.
3 For more information on content categories, see the Content Specifications document at http://www.smarterbalanced.org/assessments/development.
4 Total number of items is not necessarily equal to weighting by claim.
5 Each student receives one PT, which includes a set of stimuli on a given topic. A Classroom Activity will be conducted for each PT to help orient students to the PT context.
6 The CAT component of the test includes machine-scored items and short-text items. One or two short-text items in Reading and one short-text item in Writing are designed for hand-scoring
and may be AI scored with an application that yields comparable results by meeting or exceeding reliability and validity criteria for hand-scoring.
7 Each PT includes two or three research items, one of which may be machine scored, and one or two of which are short text items. Each PT also has one full write that is scored across three
traits: Organization/Purpose, Evidence/Elaboration, and Conventions. The short-text items and the full write are designed for hand-scoring and may be AI scored with an application that yields
comparable results by meeting or exceeding reliability and validity criteria for hand-scoring.
Page 119
Smarter Balanced 2014-15 and 2015-16 Interim Assessment Technical Report
Appendix B: Test Blueprints
B-2
Blueprint Table ELA/Literacy Grades 3–5
Estimated Total Testing Time: 4:00 (with Classroom Activity)1
Claim/Score
Reporting
Category2
Content Category3
Stimuli Items Total
Items by
Claim4 CAT PT5
CAT
Items6
PT
Items7
2. Writing
Organization/Purpose 0
1a
5
18
139 Evidence/Elaboration 0 18
Conventions 0 5 18
3.
Speaking/
Listening
Listening 3-4 0 8-9 0 8-9
4. Research Research 0 1b 6 2-3 8-9
8 For the purpose of this table, Writing PTs are noted as three separate “items”; however, the Writing PT score is derived from a single student response scored on three distinct traits.
9 Total Items by Claim for Claim 2 includes 10 CAT items and 3 items from the PT as described in footnote 8.
Page 120
Smarter Balanced 2014-15 and 2015-16 Interim Assessment Technical Report
Appendix B: Test Blueprints
B-3
Blueprint Table ELA/Literacy Grades 6–8
Estimated Total Testing Time: 4:00 (with Classroom Activity)10
Claim/Score
Reporting
Category11
Content Category12
Stimuli Items Total
Items
by
Claim13 CAT PT14 CAT
Items15
PT
Items16
1. Reading
Literary 1-2 0 4-710
0 13-17
Informational 2-3 0 9-10
2. Writing Organization/Purpose 0 1a 5 117 1318
10 All times are estimates. Actual times may vary.
11 Each student receives an overall ELA/literacy score and four claim scores or subscores reported at the individual level.
12 For more information on content categories, see the Content Specifications document at http://www.smarterbalanced.org/assessments/development
13 Total number of items is not necessarily equal to weighting by claim.
14 Each student receives one PT, which includes a set of stimuli on a given topic. A Classroom Activity will be conducted for each PT to help orient students to the PT context.
15 The CAT component of the test includes machine-scored items and short-text items. One or two short-text items in Reading and one short-text item in Writing are designed for hand-scoring
and may be AI scored with an application that yields comparable results by meeting or exceeding reliability and validity criteria for hand-scoring.
16 Each PT includes two or three research items, one of which may be machine scored, and one or two of which are short text items. Each PT also has one full write that is scored across three
traits: Organization/Purpose, Evidence/Elaboration, and Conventions. The short-text items and the full write are designed for hand-scoring and may be AI scored with an application that yields
comparable results by meeting or exceeding reliability and validity criteria for hand-scoring.
17 For the purpose of this table, Writing PTs are noted as three separate “items”; however, the Writing PT score is derived from a single student response scored on three distinct traits.
18 Total Items by Claim for Claim 2 includes 10 CAT items and 3 items from the PT as described in footnote 10.
10 In 2015 and 2016, students will receive 4 literary items.
Page 121
Smarter Balanced 2014-15 and 2015-16 Interim Assessment Technical Report
Appendix B: Test Blueprints
B-4
Blueprint Table ELA/Literacy Grades 6–8
Estimated Total Testing Time: 4:00 (with Classroom Activity)10
Claim/Score
Reporting
Category11
Content Category12
Stimuli Items Total
Items
by
Claim13 CAT PT14 CAT
Items15
PT
Items16
Evidence/Elaboration 0 18
Conventions 0 5 18
3.
Speaking/Listening Listening 3−4 0 8−9 0 8−9
4. Research Research 0 1b 6 2-3 8-9
Page 122
Smarter Balanced 2014-15 and 2015-16 Interim Assessment Technical Report
Appendix B: Test Blueprints
B-5
Blueprint Table ELA/Literacy Grade 11
Estimated Total Testing Time: 4:30 (with Classroom Activity) 19
Claim/Score
Reporting
Category20
Content Category21
Stimuli Items Total
Items
by
Claim22 CAT PT23 CAT
Items24
PT
Items25
1. Reading
Literary 1 0 4
0 15−16
Informational 3 0 11−12
2. Writing Organization/Purpose 0 1a 5 126 1327
19 All times are estimates. Actual times may vary.
20 Each student receives an overall ELA/literacy score and four claim scores or subscores reported at the individual level.
21 For more information on content categories, see the Content Specifications document at http://www.smarterbalanced.org/assessments/development
.
22 Total number of items is not necessarily equal to weighting by claim.
23 Each student receives one PT, which includes a set of stimuli on a given topic. A Classroom Activity will be conducted for each PT to help orient students to the PT context.
24 The CAT component of the test includes machine-scored items and short-text items. One or two short-text items in Reading and one short-text item in Writing are designed for hand-scoring
and may be AI scored with an application that yields comparable results by meeting or exceeding reliability and validity criteria for hand-scoring.
25 Each PT includes two or three research items, one of which may be machine scored, and one or two of which are short text items. Each PT also has one full write that is scored across three
traits: Organization/Purpose, Evidence/Elaboration, and Conventions. The short-text items and the full write are designed for hand-scoring and may be AI scored with an application that yields
comparable results by meeting or exceeding reliability and validity criteria for hand-scoring.
26 For the purpose of this table, Writing PTs are noted as three separate “items”; however, the Writing PT score is derived from a single student response scored on three distinct traits.
27 Total Items by Claim for Claim 2 includes 10 CAT items and 3 items from the PT as described in footnote 8.
Page 123
Smarter Balanced 2014-15 and 2015-16 Interim Assessment Technical Report
Appendix B: Test Blueprints
B-6
Blueprint Table ELA/Literacy Grade 11
Estimated Total Testing Time: 4:30 (with Classroom Activity) 19
Claim/Score
Reporting
Category20
Content Category21
Stimuli Items Total
Items
by
Claim22 CAT PT23 CAT
Items24
PT
Items25
Evidence/Elaboration 0 18
Conventions 0 5 18
3.
Speaking/Listening Listening 3−4 0 8−9 0 8−9
4. Research Research 0 1b 6 2-3 8-9
Page 124
Smarter Balanced 2014-15 and 2015-16 Interim Assessment Technical Report
Appendix B: Test Blueprints
B-7
Target Sampling ELA/Literacy Grades 3–5
Component
Claim/Score
Reporting
Category
Content
Category Assessment Target28 DOK29,30
CAT
Items
Item Type
Total
Items Machine
Scored
Short
Text
Non-PT 1. Reading Literary31
2: Central Ideas 2, 3 1−25
6−832
0−15
7−8
4: Reasoning and
Evaluation 3 1−25
1: Key Details 1, 2
3−6 0 3: Word Meanings 1, 2
5: Analysis
within/across Texts 3, 4
28 For more information on assessment targets, see the Content Specifications document at http://www.smarterbalanced.org/assessments/development .
29 DOK: Depth of Knowledge, consistent with the Smarter Balanced Content Specifications.
30 The CAT algorithm will be configured to ensure the following:
For Claim 1, a student will receive at least seven items at DOK 2 and two items at DOK 3 or higher.
For Claim 2, a student will receive at least four items at DOK 2 and one item at DOK 3 or higher.
For Claim 3, a student will receive at least three items at DOK 2 or higher.
For Claim 4, CAT items are DOK 2 for all grades.
31 Each student will receive at least one long literary passage set and up to two additional short passage sets.
32 For the Reading Literary long passage set, students may see up to one short answer question on either target 2 or 4.
Page 125
Smarter Balanced 2014-15 and 2015-16 Interim Assessment Technical Report
Appendix B: Test Blueprints
B-8
Target Sampling ELA/Literacy Grades 3–5
Component
Claim/Score
Reporting
Category
Content
Category Assessment Target28 DOK29,30
CAT
Items
Item Type
Total
Items Machine
Scored
Short
Text
6: Text Structures
and Features 2, 3
7: Language Use 2, 3
Informational33
9: Central Ideas 2, 3 1−234
6−87
0−17
7−8
11: Reasoning and
Evaluation 3 1−27
8: Key Details 1, 2
3−6 0
10: Word Meanings 1, 2
12: Analysis
within/across Texts 3, 4
13: Text Structures
and Features 2, 3
33 Each student will receive at least one long informational passage set and up to two additional short informational passage sets.
34 For the Reading Informational long passage set, students may see up to one short answer question on either target 9 or 11.
Page 126
Smarter Balanced 2014-15 and 2015-16 Interim Assessment Technical Report
Appendix B: Test Blueprints
B-9
Target Sampling ELA/Literacy Grades 3–5
Component
Claim/Score
Reporting
Category
Content
Category Assessment Target28 DOK29,30
CAT
Items
Item Type
Total
Items Machine
Scored
Short
Text
14: Language Use 2, 3
2. Writing
Organization/
Purpose
1a/3a/6a: Write
Brief Texts35 3
3
0 0–18
10
1b/3b/6b: Revise
Brief Texts 2 0–28 0
Evidence/
Elaboration
1a/3a/6a: Write
Brief Texts8 3 0 0–18
1b/3b/6b: Revise
Brief Texts 2 0–28 0
8: Language and
Vocabulary Use36 1, 2 2 2 0
Conventions 9: Edit/Clarify 1, 2 5 5 0
35 Each student will receive at least one item in Organization/Purpose and at least one item in Evidence/Elaboration, for a total of three items, assessed in either Write Brief Texts or Revise
Brief Texts. Among these three items will be one and only one Write Brief Text.
36 Language and Vocabulary Use contributes two items to Evidence/Elaboration.
Page 127
Smarter Balanced 2014-15 and 2015-16 Interim Assessment Technical Report
Appendix B: Test Blueprints
B-10
Target Sampling ELA/Literacy Grades 3–5
Component
Claim/Score
Reporting
Category
Content
Category Assessment Target28 DOK29,30
CAT
Items
Item Type
Total
Items Machine
Scored
Short
Text
3.
Speaking/
Listening
Listening 4: Listen/Interpret 1, 2, 3 8 8 0 8
4. Research Research
2: Interpret and
Integrate
Information
2
6 6 0 6 3: Analyze
Information/Sources 2
4: Use Evidence 2
Page 128
Smarter Balanced 2014-15 and 2015-16 Interim Assessment Technical Report
Appendix B: Test Blueprints
B-11
Target Sampling ELA/Literacy Grades 3–5
Component
Claim/Score
Reporting
Category
Content Category Assessment Target DOK
Item Type
Scores Machine
Scored
Short
Text
Full
Write
PT
2. Writing
Organization/Purpose 2/4/7: Compose Full
Texts
4 0 0 1
1
Evidence/Elaboration
2/4/7: Compose Full
Texts
1
8: Language and
Vocabulary Use
Conventions 9: Edit/Clarify
1
4. Research Research
2: Interpret and
Integrate Information 3
0-1 1-2 0 2-3 3: Analyze
Information/Sources 3, 4
4: Use Evidence 3
Page 129
Smarter Balanced 2014-15 and 2015-16 Interim Assessment Technical Report
Appendix B: Test Blueprints
B-12
Target Sampling ELA/Literacy Grades 6–8
Component
Claim/Score
Reporting
Category
Content
Category Assessment Target37 DOK38,39
CAT
Items
Item Type
Total
Items Machine
Scored
Short
Text
CAT
1. Reading
Literary40
2: Central Ideas 2, 3 15
1−241 0−15
4-742
4: Reasoning and
Evaluation 3, 4 15
1: Key Details 2
2-5 2-5 0 3: Word Meanings 1, 2
5: Analysis within/across
Texts 3, 4
37 For more information on assessment targets, see the Content Specifications document at http://www.smarterbalanced.org/assessments/development
38 DOK: Depth of Knowledge, consistent with the Smarter Balanced Content Specifications.
39 The CAT algorithm will be configured to ensure the following:
For Claim 1, a student will receive no more than 5 items at DOK 1 and at least 2 items at DOK 3 or higher. For Claim 2, a student will receive at least five items at DOK 2 or higher, at least one of which will be DOK 3 or higher. For Claim 3, a student will receive at least three items at DOK 2 or higher. For Claim 4, CAT items are DOK 2 for all grades.
40 Each student will receive at least one literary passage set.
41 For the Reading Literary long passage set, students may see up to 1 short answer question on either target 2 or 4.
42 In 2015 and 2016, students receive 4 literary items.
Page 130
Smarter Balanced 2014-15 and 2015-16 Interim Assessment Technical Report
Appendix B: Test Blueprints
B-13
Target Sampling ELA/Literacy Grades 6–8
Component
Claim/Score
Reporting
Category
Content
Category Assessment Target37 DOK38,39
CAT
Items
Item Type
Total
Items Machine
Scored
Short
Text
6: Text Structures and
Features 2, 3, 4
7: Language Use 3
Informational43
9: Central Ideas 2, 3
1−37
9-10
0−144
9-10
11: Reasoning and
Evaluation 3, 4
8: Key Details 2
7-8 0
10: Word Meanings 1, 2
12: Analysis within/across
Texts 3, 4
13: Text Structures and
Features 2, 3
43 Each student will receive at least one informational passage set and up to two additional short informational passage sets.
44 For the Reading Informational long passage set, students may see up to one short answer question on either target 9 or 11.
Page 131
Smarter Balanced 2014-15 and 2015-16 Interim Assessment Technical Report
Appendix B: Test Blueprints
B-14
Target Sampling ELA/Literacy Grades 6–8
Component
Claim/Score
Reporting
Category
Content
Category Assessment Target37 DOK38,39
CAT
Items
Item Type
Total
Items Machine
Scored
Short
Text
14: Language Use 3
CAT 2. Writing
Organization/
Purpose
1a/3a/6a: Write Brief
Texts45 3
3
0 0–110
10
1b/3b/6b: Revise Brief
Texts 2 0–210 0
Evidence/
Elaboration
1a/3a/6a: Write Brief
Texts10 3 0 0–110
1b/3b/6b: Revise Brief
Texts 2 0–210 0
8: Language and
Vocabulary Use46 1, 2 2 2 0
Conventions 9: Edit/Clarify 1, 2 5 5 0
45 Each student will receive at least one item in Organization/Purpose and at least one item in Evidence/Elaboration, for a total of three items, assessed in either Write Brief Texts or Revise
Brief Texts. Among these three items will be one and only one Write Brief Text.
46 Language and Vocabulary Use contributes 2 items to Evidence/Elaboration.
Page 132
Smarter Balanced 2014-15 and 2015-16 Interim Assessment Technical Report
Appendix B: Test Blueprints
B-15
Target Sampling ELA/Literacy Grades 6–8
Component
Claim/Score
Reporting
Category
Content
Category Assessment Target37 DOK38,39
CAT
Items
Item Type
Total
Items Machine
Scored
Short
Text
3. Speaking/
Listening Listening 4: Listen/Interpret 1, 2, 3 8−9 8−9 0 8−9
4. Research Research
2: Analyze/Integrate
Information 2
6 6 0 6 3: Evaluate
Information/Sources 2
4: Use Evidence 2
Page 133
Smarter Balanced 2014-15 and 2015-16 Interim Assessment Technical Report
Appendix B: Test Blueprints
B-16
Target Sampling ELA/Literacy Grades 6-8
Component
Claim/Score
Reporting
Category
Content Category Assessment Target DOK
Item Type
Scores Machine
Scored
Short
Text
Full
Write
PT
2. Writing
Organization/Purpose 2/4/7: Compose Full Texts
4 0 0 1
1
Evidence/Elaboration
2/4/7: Compose Full Texts
1 8: Language and Vocabulary
Use
Conventions 9: Edit/Clarify 1
4. Research Research
2: Analyze/Integrate
Information 3, 4
0-1 1-2 0 2-3 3: Evaluate
Information/Sources 3, 4
4: Use Evidence 3, 4
Page 134
Smarter Balanced 2014-15 and 2015-16 Interim Assessment Technical Report
Appendix B: Test Blueprints
B-17
Target Sampling ELA/Literacy Grade 11
Component
Claim/Score
Reporting
Category
Content Category Assessment Target50 DOK51,52 CAT
Items
Item Type
Total Items
Machine
Scored Short Text
CAT
1. Reading Literary53
2: Central Ideas 2, 3 15
1−254 0−15
4
4: Reasoning and
Evaluation 3, 4 15
1: Key Details 2
2
2 0
3: Word Meanings 1, 2
50 For more information on assessment targets, see the Content Specifications document at http://www.smarterbalanced.org/assessments/development .
51 DOK: Depth of Knowledge, consistent with the Smarter Balanced Content Specifications.
52 The CAT algorithm will be configured to ensure the following:
For Claim 1, a student will receive no more than 4 items at DOK 1 and at least 3 items at DOK 3 or higher.
For Claim 2, a student will receive at least five items at DOK 2 or higher, at least one of which will be DOK 3 or higher.
For Claim 3, a student will receive at least four items at DOK 2 or higher.
For Claim 4, CAT items are DOK 2 for all grades.
53 Each student will receive at least one literary long passage set.
54 For the Reading Literary long set, students may see up to one short answer question on either target 2 or 4.
Page 135
Smarter Balanced 2014-15 and 2015-16 Interim Assessment Technical Report
Appendix B: Test Blueprints
B-18
Target Sampling ELA/Literacy Grade 11
Component
Claim/Score
Reporting
Category
Content Category Assessment Target50 DOK51,52 CAT
Items
Item Type
Total Items
Machine
Scored Short Text
Non-PT
5: Analysis
within/across Texts 3, 4
6: Text Structures
and Features 3, 4
7: Language Use 3
Informational55
9: Central Ideas 2,3
2−456
10−127
0−17
11−12
11: Reasoning and
Evaluation 3, 4
8: Key Details 2
7−10 0 10: Word Meanings 1, 2
12: Analysis
within/across Texts 3, 4
55 Each student will receive at least one long informational passage set and up to two additional short informational passage sets.
56 For the Reading Informational long passage set, students may see up to one short answer question on either target 9 or 11.
Page 136
Smarter Balanced 2014-15 and 2015-16 Interim Assessment Technical Report
Appendix B: Test Blueprints
B-19
Target Sampling ELA/Literacy Grade 11
Component
Claim/Score
Reporting
Category
Content Category Assessment Target50 DOK51,52 CAT
Items
Item Type
Total Items
Machine
Scored Short Text
13: Text Structures
and Features 3, 4
14: Language Use 3
2. Writing
Organization/Purpose
1a/3a/6a: Write
Brief Texts57 3
3
0 0–18
10
1b/3b/6b: Revise
Brief Texts 2 0–28 0
Evidence/Elaboration
1a/3a/6a: Write
Brief Texts8 3 0 0–18
1b/3b/6b: Revise
Brief Texts 2 2 0
57 Each student will receive at least one item in Organization/Purpose and at least one item in Evidence/Elaboration, for a total of three items, assessed in either Write Brief Texts or Revise
Brief Texts. Among these three items will be one and only one Write Brief Text.
Page 137
Smarter Balanced 2014-15 and 2015-16 Interim Assessment Technical Report
Appendix B: Test Blueprints
B-20
Target Sampling ELA/Literacy Grade 11
Component
Claim/Score
Reporting
Category
Content Category Assessment Target50 DOK51,52 CAT
Items
Item Type
Total Items
Machine
Scored Short Text
8: Language and
Vocabulary Use58 1, 2 2 2 0
Conventions 9: Edit/Clarify 1, 2 5 5 0
3. Speaking/
Listening Listening 4: Listen/Interpret 1, 2, 3 8−9 8−9 0 8−9
4. Research Research
2: Analyze/Integrate
Information 2
6 6 0 6 3: Evaluate
Information/Sources 2
4: Use Evidence 2
58 Language and Vocabulary Use contributes 2 items to Evidence/Elaboration.
Page 138
Smarter Balanced 2014-15 and 2015-16 Interim Assessment Technical Report
Appendix B: Test Blueprints
B-21
Target Sampling ELA/Literacy Grade 11
Component
Claim/Score
Reporting
Category
Content Category Assessment Target DOK
Item Type
Scores Machine
Scored
Short
Text
Full
Write
PT
2. Writing
Organization/Purpose 2/4/7: Compose Full Texts
4 0 0 1
1
Evidence/Elaboration
2/4/7: Compose Full Texts
1
8: Language and Vocabulary Use
Conventions 9: Edit/Clarify 1
4. Research Research
2: Analyze/Integrate Information 3, 4
0-1 1-2 0 2-3 3: Evaluate Information/Sources 3, 4
4: Use Evidence 3, 4
Page 139
Smarter Balanced 2014-15 and 2015-16 Interim Assessment Technical Report
Appendix B: Test Blueprints
B-22
English Language Arts/Literacy Interim Assessment Block Test Blueprints
SUMMARY: GRADES 3–5
Block Number Block Name Number of Items59
1 Read Literary Texts 15
2 Read Informational Texts 14-16
3 Brief Writes 6
460 Revision 15
52 Language and Vocabulary Use 15
62 Editing 14-15
7 Listen/Interpret 14-15
59 During the early phase of the Smarter Balanced Interim Assessment, the number of items may vary slightly depending on the size of the item pool.
60 New block for 2016–17
Page 140
Smarter Balanced 2014-15 and 2015-16 Interim Assessment Technical Report
Appendix B: Test Blueprints
B-23
SUMMARY: GRADES 3–5
Block Number Block Name Number of Items59
861 Research 18
9 Informational Performance Task 062
10 Opinion Performance Task 64 (grade 3)
11 Narrative Performance Task 64 (grade 4,5)
61 Block contains new item(s) for 2016–17
62 For the purpose of this table, Writing PTs are noted as three separate “items”; however, the Writing PT score is derived from a single student response scored on three distinct traits. There
are also two or three Research items in each PT, for a total of five or six items per task.
Page 141
Smarter Balanced 2014-15 and 2015-16 Interim Assessment Technical Report
Appendix B: Test Blueprints
B-24
SUMMARY: GRADES 6–7
Block Number Block Name Number of Items63
1 Read Literary Texts 15-16
2 Read Informational Texts 16
3 Brief Writes 6
464 Revision 15
56 Language and Vocabulary Use 15
66 Editing 14-15
7 Listen/Interpret 15
63 During the early phase of the Smarter Balanced Interim Assessment, the number of items may vary slightly depending on the size of the item pool.
64 New block for 2016–17
Page 142
Smarter Balanced 2014-15 and 2015-16 Interim Assessment Technical Report
Appendix B: Test Blueprints
B-25
SUMMARY: GRADES 6–7
Block Number Block Name Number of Items63
865 Research 18
9 Explanatory Performance Task 666 (grade 7)
10 Argument Performance Task 58 (grade 6)
11 Narrative Performance Task 08
10 Argument Performance Task 58 (grade 6)
11 Narrative Performance Task 08
65 Block contains new item(s) for 2016–17
66 For the purpose of this table, Writing PTs are noted as three separate “items”; however, the Writing PT score is derived from a single student response scored on three distinct traits. There
are also two or three Research items in each PT, for a total of five or six items per task.
Page 143
Smarter Balanced 2014-15 and 2015-16 Interim Assessment Technical Report
Appendix B: Test Blueprints
B-26
SUMMARY: GRADE 8
Block Number Block Name Number of Items67
1 Read Literary Texts 16
2 Read Informational Texts 16
3 Brief Writes 6
4 Edit/Revise 14
5 Listen/Interpret 15
668 Research 18
7 Explanatory Performance Task 669
8 Argument Performance Task 011
9 Narrative Performance Task 011
67 During the early phase of the Smarter Balanced Interim Assessment, the number of items may vary slightly depending on the size of the item pool.
68 Block contains new item(s) for 2016–17
69 For the purpose of this table, Writing PTs are noted as three separate “items”; however, the Writing PT score is derived from a single student response scored on three distinct traits. There are also two or three Research items in each PT, for a total of five or six items per task.
Page 144
Smarter Balanced 2014-15 and 2015-16 Interim Assessment Technical Report
Appendix B: Test Blueprints
B-27
SUMMARY: High School
Block Number Block Name Number of Items70
1 Read Literary Texts 16
2 Read Informational Texts 15
3 Brief Writes 6
471 Revision 15
513 Language and Vocabulary Use 15
613 Editing 15
7 Listen/Interpret 15
70 During the early phase of the Smarter Balanced Interim Assessment, the number of items may vary slightly depending on the size of the item pool.
71 New block
Page 145
Smarter Balanced 2014-15 and 2015-16 Interim Assessment Technical Report
Appendix B: Test Blueprints
B-28
SUMMARY: High School
Block Number Block Name Number of Items70
872 Research 18
9 Explanatory Performance Task 573
10 Argument Performance Task 015
72 New Item(s)
73 For the purpose of this table, Writing PTs are noted as three separate “items”; however, the Writing PT score is derived from a single student response scored on three distinct traits. There
are also two or three Research items in each PT, for a total of five or six items per task.
Page 146
Smarter Balanced 2014-15 and 2015-16 Interim Assessment Technical Report
Appendix B: Test Blueprints
B-29
Grade 3
Block 1: Read Literary Texts
Claim Assessment Target DOK74
Items
Total Items Short
Passage
Short
Passage
Long
Passage
Reading
2. Central Ideas 2 0-2 0-275 1-276 3
4. Reasoning & Evidence 3 0-2 0-22 1-23 4
1. Key Details 1,2 0-1 0-1 0-1 0
3. Word Meaning 1,2 0-1 0-1 0-1
1
5. Analysis within or across Texts 3,4 0-1 0-1 0-1 2
6. Test Structures & Features 2,3 0-1 0-1 0-1 3
74 The goal is for a student to receive no more than 4 items at DOK 1 and at least 3 items at DOK 3 or higher.
75 If necessary, the second short passage will be used to achieve item counts.
76 At least one of these items will be human scored; the other(s) will be machine scored.
Page 147
Smarter Balanced 2014-15 and 2015-16 Interim Assessment Technical Report
Appendix B: Test Blueprints
B-30
Block 1: Read Literary Texts
Claim Assessment Target DOK74
Items
Total Items Short
Passage
Short
Passage
Long
Passage
7. Language Use 2,3 0-1 0-1 0-1 2
TOTAL ITEMS
15
Page 148
Smarter Balanced 2014-15 and 2015-16 Interim Assessment Technical Report
Appendix B: Test Blueprints
B-31
Grade 3
Block 2: Read Informational Texts
Claim Assessment Target DOK77
Items
Total Items Short
Passage
Short
Passage
Long
Passage
Reading
9. Central Ideas 2 0-2 0-278 1-279 3
11. Reasoning & Evidence 3 0-2 0-22 1-2 3
8. Key Details 1, 2 0-1 0-1 0-1 2
10. Word Meanings 1, 2 0-1 0-1 0-1 2
12. Analysis within or across Texts 3, 4 0-1 0-1 0-1 1
13. Text Structures or Text Features 2, 3 0-1 0-1 0-1 3
77 The goal is for a student to receive no more than 4 items at DOK 1 and at least 3 items at DOK 3 or higher.
78 If necessary, the second short passage will be used to achieve item counts.
79 At least one of these items will be human scored; the other(s) will be machine scored.
Page 149
Smarter Balanced 2014-15 and 2015-16 Interim Assessment Technical Report
Appendix B: Test Blueprints
B-32
Block 2: Read Informational Texts
Claim Assessment Target DOK77
Items
Total Items Short
Passage
Short
Passage
Long
Passage
14. Language Use 2, 3 0-1 0-1 0-1 2
TOTAL ITEMS
16
Page 150
Smarter Balanced 2014-15 and 2015-16 Interim Assessment Technical Report
Appendix B: Test Blueprints
B-33
Grade 3
Block 3: Brief Writes
Claim Assessment Target DOK
Items
Total Items
Machine Scored Short Text80
Writing
1a. Write Brief Texts (Narrative) 3 0 4
6 3a.Write Brief Texts (Informational)
3 0 1
6a. Write Brief Texts (Opinion) 3 0 1
TOTAL ITEMS
6
80 These items are designed for hand scoring and may be AI scored with an application that yields comparable results by meeting or exceeding reliability and validity criteria for hand scoring.
Page 151
Smarter Balanced 2014-15 and 2015-16 Interim Assessment Technical Report
Appendix B: Test Blueprints
B-34
Block 4: Revision
Claim Assessment Target DOK
Items
Total Items
Machine Scored Short Text
Writing
1b. Revise Brief Texts (Narrative) 2 5 0 5
3b. Revise Brief Texts (Informational) 2 5 0 5
6b. Revise Brief Texts (Opinion) 2 5 0 5
TOTAL ITEMS
15
Block 5: Language and Vocabulary Use
Claim Assessment Target DOK
Items
Claim
Machine Scored Short Text
Writing 8. Language and Vocabulary Use 1, 2 15 0 15
TOTAL ITEMS 15
Page 152
Smarter Balanced 2014-15 and 2015-16 Interim Assessment Technical Report
Appendix B: Test Blueprints
B-35
Grade 3
Block 6: Editing
Claim Assessment Target DOK
Items
Total Items
Machine Scored Short Text
Writing 9. Edit 1, 2 15 0 15
TOTAL ITEMS
15
Block 7: Listen and Interpret
Claim Assessment Target DOK
Items
Claim
Machine Scored Short Text
Listening 4. Listen/Interpret
1,2,3 15 0 15
TOTAL ITEMS
15
Grade 3
Page 153
Smarter Balanced 2014-15 and 2015-16 Interim Assessment Technical Report
Appendix B: Test Blueprints
B-36
Block 8: Research
Claim Assessment Target DOK
Items
Total Items
Machine Scored Short Text
Research
2. Interpret & Integrate Information 2 6 0 6
3. Analyze Information/Sources 2 6 0 6
4. Use Evidence 2 6 0 6
TOTAL ITEMS
18
Page 154
Smarter Balanced 2014-15 and 2015-16 Interim Assessment Technical Report
Appendix B: Test Blueprints
B-37
Grade 3
Block 9: Informational Performance Task
Claim Assessment Target DOK
Items
Total
Items Machine Scored
Human
Scored
Writing 4. Compose Full Texts (Informational) 4 0 1 081
Research
2. Interpret & Integrate Information 3
1 2 0 3. Analyze Information/Sources
4
4. Use Evidence 3
TOTAL ITEMS NA
81 For the purpose of this table, Writing PTs are noted as three separate “items”; however, the Writing PT score is derived from a single student response scored on three distinct traits.
Page 155
Smarter Balanced 2014-15 and 2015-16 Interim Assessment Technical Report
Appendix B: Test Blueprints
B-38
Grade 3
82 For the purpose of this table, Writing PTs are noted as three separate “items”; however, the Writing PT score is derived from a single student response scored on three distinct traits.
Block 10: Opinion Performance Task
Claim Assessment Target DOK
Items
Total
Items Machine Scored
Human
Scored
Writing 7. Compose Full Texts (Informational) 4 0 1 382
Research
2. Interpret & Integrate Information (1) 3
1 2 3 3. Analyze Information/Sources (0)
4
4. Use Evidence (2) 3
TOTAL ITEMS
6
Page 156
Smarter Balanced 2014-15 and 2015-16 Interim Assessment Technical Report
Appendix B: Test Blueprints
B-39
Grade 3
83 For the purpose of this table, Writing PTs are noted as three separate “items”; however, the Writing PT score is derived from a single student response scored on three distinct traits.
Block 11: Narrative Performance Task
Claim Assessment Target DOK
Items
Total
Items Machine Scored
Human
Scored
Writing 2. Compose Full Texts (Narrative) 4 0 1 083
Research
2. Interpret & Integrate Information 3
1 2 0 3. Analyze Information/Sources 4
4. Use Evidence 3
TOTAL ITEMS NA
Page 157
Smarter Balanced 2014-15 and 2015-16 Interim Assessment Technical Report
Appendix B: Test Blueprints
B-40
Grade 4
Block 1: Read Literary Texts
Claim Assessment Target DOK84
Items
Total Items
Short Passage Short Passage Long Passage
Reading
2. Central Ideas 2 0-2 0-285 1-2 3
4. Reasoning & Evidence 3 0-2 0-227 1-286 3
1. Key Details 1,2 0-1 0-1 0-1 3
3. Word Meaning 1,2 0-1 0-1 0-1
3
5. Analysis within or across Texts 3,4 0-1 0-1 0-1 1
6. Test Structures & Features 2,3 0-1 0-1 0-1 1
7. Language Use 2,3 0-1 0-1 0-1
1
84 The goal is for a student to receive no more than 4 items at DOK 1 and at least 3 items at DOK 3 or higher.
85 If necessary, the second short passage will be used to achieve item counts.
86 At least one of these items will be human scored; the other(s) will be machine scored.
Page 158
Smarter Balanced 2014-15 and 2015-16 Interim Assessment Technical Report
Appendix B: Test Blueprints
B-41
Block 1: Read Literary Texts
Claim Assessment Target DOK84
Items
Total Items
Short Passage Short Passage Long Passage
TOTAL ITEMS
15
Page 159
Smarter Balanced 2014-15 and 2015-16 Interim Assessment Technical Report
Appendix B: Test Blueprints
B-42
Grade 4
Block 2: Read Informational Texts
Claim Assessment Target DOK87
Items
Total Items Short
Passage
Short
Passage
Long
Passage
Reading
9. Central Ideas 2 0-2 0-288 1-289 2
11. Reasoning & Evidence 3 0-2 0-230 1-2 2
8. Key Details 1, 2 0-1 0-1 0-1 2
10. Word Meanings 1, 2 0-1 0-1 0-1 3
12. Analysis within or across Texts 3, 4 0-1
0-1 0-1 1
13. Text Structures or Text Features 2, 3 0-1 0-1 0-1 2
87 The goal is for a student to receive no more than 4 items at DOK 1 and at least 3 items at DOK 3 or higher.
88 If necessary, the second short passage will be used to achieve item counts.
89 At least one of these items will be human scored; the other(s) will be machine scored.
Page 160
Smarter Balanced 2014-15 and 2015-16 Interim Assessment Technical Report
Appendix B: Test Blueprints
B-43
Block 2: Read Informational Texts
Claim Assessment Target DOK87
Items
Total Items Short
Passage
Short
Passage
Long
Passage
14. Language Use 2, 3 0-1 0-1 0-1 2
TOTAL ITEMS
14
Page 161
Smarter Balanced 2014-15 and 2015-16 Interim Assessment Technical Report
Appendix B: Test Blueprints
B-44
Grade 4
90 These items are designed for hand scoring and may be AI scored with an application that yields comparable results by meeting or exceeding reliability and validity criteria for hand scoring.
Block 3: Brief Writes
Claim Assessment Target DOK
Items
Total Items
Machine Scored Short Text90
Writing
1a. Write Brief Texts (Narrative) 3 0 3 3
3a.Write Brief Texts (Informational) 2
0 2 2
6a. Write Brief Texts (Opinion) 2 0 1 1
TOTAL ITEMS
6
Page 162
Smarter Balanced 2014-15 and 2015-16 Interim Assessment Technical Report
Appendix B: Test Blueprints
B-45
Grade 4
Block 4: Revision
Claim Assessment Target DOK
Items
Total Items
Machine Scored Short Text
Writing
1b. Revise Brief Texts (Narrative) 2 6 0 6
3b. Revise Brief Texts (Informational) 2 6 0 6
6b. Revise Brief Texts (Opinion) 2 3 0 3
TOTAL ITEMS
15
Block 5: Language and Vocabulary Use
Claim Assessment Target DOK
Items
Claim
Machine Scored Short Text
Writing 8. Language and Vocabulary Use 1, 2
15 0 15
TOTAL ITEMS
15
Page 163
Smarter Balanced 2014-15 and 2015-16 Interim Assessment Technical Report
Appendix B: Test Blueprints
B-46
Grade 4
Block 6: Editing
Claim Assessment Target DOK
Items
Total Items
Machine Scored Short Text
Writing 9. Edit 1, 2 15 0 15
TOTAL ITEMS
15
Block 7: Listen and Interpret
Claim Assessment Target DOK
Items
Claim
Machine Scored Short Text
Listening 4. Listen/Interpret
1, 2, 3 15 0 15
TOTAL ITEMS
15
Page 164
Smarter Balanced 2014-15 and 2015-16 Interim Assessment Technical Report
Appendix B: Test Blueprints
B-47
Grade 4
Block 8: Research
Claim Assessment Target DOK
Items
Total Items
Machine Scored Short Text
Research
2. Interpret & Integrate Information 2 6 0 6
3. Analyze Information/Sources 2 6 0 6
4. Use Evidence 2 6 0 6
TOTAL ITEMS
18
Page 165
Smarter Balanced 2014-15 and 2015-16 Interim Assessment Technical Report
Appendix B: Test Blueprints
B-48
Grade 4
91 For the purpose of this table, Writing PTs are noted as three separate “items”; however, the Writing PT score is derived from a single student response scored on three distinct traits.
Block 9: Informational Performance Task
Claim Assessment Target DOK
Items
Total
Items Machine Scored
Human
Scored
Writing 4. Compose Full Texts (Informational) 4 0 1 091
Research
2. Interpret & Integrate Information 3
1 2 0 3. Analyze Information/Sources
4
4. Use Evidence 3
TOTAL ITEMS NA
Page 166
Smarter Balanced 2014-15 and 2015-16 Interim Assessment Technical Report
Appendix B: Test Blueprints
B-49
Grade 4
92 For the purpose of this table, Writing PTs are noted as three separate “items”; however, the Writing PT score is derived from a single student response scored on three distinct traits.
Block 10: Opinion Performance Task
Claim Assessment Target DOK
Items
Total
Items Machine Scored
Human
Scored
Writing 7. Compose Full Texts (Opinion) 4 0 1 092
Research
2. Interpret & Integrate Information 3
1 2 0 3. Analyze Information/Sources 4
4. Use Evidence 3
TOTAL ITEMS NA
Page 167
Smarter Balanced 2014-15 and 2015-16 Interim Assessment Technical Report
Appendix B: Test Blueprints
B-50
Grade 4
93 For the purpose of this table, Writing PTs are noted as three separate “items”; however, the Writing PT score is derived from a single student response scored on three distinct traits.
Block 11: Narrative Performance Task
Claim Assessment Target DOK
Items Total
Items Machine Scored Short Text
Writing 2. Compose Full Texts (Narrative) 4 0 1 393
Research
2. Interpret & Integrate Information (1) 3
1 2 3 3. Analyze Information/Sources (0) 4
4. Use Evidence (2) 3
TOTAL ITEMS
6
Page 168
Smarter Balanced 2014-15 and 2015-16 Interim Assessment Technical Report
Appendix B: Test Blueprints
B-51
Grade 5
Block 1: Read Literary Texts
Claim Assessment Target DOK94
Items
Total Items
Short Passage Short Passage Long Passage
Reading
2. Central Ideas 2 0-2 0-295 1-296 3
4. Reasoning & Evidence 3 0-2 0-237 1-238 3
1. Key Details 1,2 0-1 0-1 0-1 3
3. Word Meaning 1,2 0-1 0-1 0-1 3
5. Analysis within or across Texts 3,4 0-1 0-1 0-1 1
6. Test Structures & Features 2,3 0-1 0-1 0-1 0
7. Language Use 2,3 0-1 0-1 0-1 2
TOTAL ITEMS
15
94 The goal is for a student to receive no more than 4 items at DOK 1 and at least 3 items at DOK 3 or higher.
95 If necessary, the second short passage will be used to achieve item counts.
96 At least one of these items will be human scored; the other(s) will be machine scored.
Page 169
Smarter Balanced 2014-15 and 2015-16 Interim Assessment Technical Report
Appendix B: Test Blueprints
B-52
Grade 5
Block 2: Read Informational Texts
Claim Assessment Target DOK97
Items
Total Items Short
Passage
Short
Passage
Long
Passage
Reading
9. Central Ideas 2
0-2 0-298 1-2 1
11. Reasoning & Evidence 3 0-2 0-240 1-299 3
8. Key Details 1, 2 0-1 0-1 0-1 2
10. Word Meanings 1, 2 0-1
0-1 0-1 3
12. Analysis within or across Texts 3, 4 0-1 0-1 0-1 2
13. Text Structures or Text Features 2, 3 0-1 0-1 0-1 2
97 The goal is for a student to receive no more than 4 items at DOK 1 and at least 3 items at DOK 3 or higher.
98 If necessary, the second short passage will be used to achieve item counts.
99 At least one of these items will be human scored; the other(s) will be machine scored.
Page 170
Smarter Balanced 2014-15 and 2015-16 Interim Assessment Technical Report
Appendix B: Test Blueprints
B-53
Block 2: Read Informational Texts
Claim Assessment Target DOK97
Items
Total Items Short
Passage
Short
Passage
Long
Passage
14. Language Use 2, 3 0-1 0-1 0-1 2
TOTAL ITEMS
15
Page 171
Smarter Balanced 2014-15 and 2015-16 Interim Assessment Technical Report
Appendix B: Test Blueprints
B-54
Grade 5
Block 3: Brief Writes
Claim Assessment Target DOK
Items
Total Items
Machine Scored Short Text100
Writing
1a. Write Brief Texts (Narrative) 3 0
2 2
3a. Write Brief Texts (Informational) 3
0 2 2
6a. Write Brief Texts (Opinion) 3 0 2 2
TOTAL ITEMS
6
100 These items are designed for hand scoring and may be AI scored with an application that yields comparable results by meeting or exceeding reliability and validity criteria for hand scoring.
Page 172
Smarter Balanced 2014-15 and 2015-16 Interim Assessment Technical Report
Appendix B: Test Blueprints
B-55
Grade 5
Block 4: Revision
Claim Assessment Target DOK
Items
Total Items
Machine Scored Short Text
Writing
1b. Revise Brief Texts (Narrative) 2 5 0 5
3b. Revise Brief Texts (Informational) 2 5 0 5
6b. Revise Brief Texts (Opinion) 2 5 0 5
TOTAL ITEMS
15
Page 173
Smarter Balanced 2014-15 and 2015-16 Interim Assessment Technical Report
Appendix B: Test Blueprints
B-56
Block 5: Language and Vocabulary Use
Claim Assessment Target DOK
Items
Claim
Machine Scored Short Text
Writing 8. Language and Vocabulary Use
1, 2 15 0 15
TOTAL ITEMS
15
Block 6: Editing
Claim Assessment Target DOK
Items
Total Items
Machine Scored Short Text
Writing 9. Edit 1, 2 14 0 14
TOTAL ITEMS
14
Page 174
Smarter Balanced 2014-15 and 2015-16 Interim Assessment Technical Report
Appendix B: Test Blueprints
B-57
Grade 5
Block 7: Listen and Interpret
Claim Assessment Target DOK
Items
Claim
Machine Scored Short Text
Listening 4. Listen/Interpret
1, 2,3 15 0 14
TOTAL ITEMS
14
Block 8: Research
Claim Assessment Target DOK
Items
Total Items
Machine Scored Short Text
Research
2. Interpret & Integrate Information 2 6 0 6
3. Analyze Information/ Sources 2 6 0 6
4. Use Evidence 2 6 0 6
TOTAL ITEMS
18
Page 175
Smarter Balanced 2014-15 and 2015-16 Interim Assessment Technical Report
Appendix B: Test Blueprints
B-58
Grade 5
Block 9: Informational Performance Task
Claim Assessment Target DOK
Items
Total
Items Machine Scored
Human
Scored
Writing 4. Compose Full Texts (Informational) 4 0 1
0101
Research
2. Interpret & Integrate Information 3
1 2 0 3. Analyze Information/Sources
4
4. Use Evidence 3
TOTAL ITEMS NA
101 For the purpose of this table, Writing PTs are noted as three separate “items”; however, the Writing PT score is derived from a s ingle student response scored on three distinct traits.
Page 176
Smarter Balanced 2014-15 and 2015-16 Interim Assessment Technical Report
Appendix B: Test Blueprints
B-59
Grade 5
Block 10: Opinion Performance Task
Claim Assessment Target DOK
Items
Total
Items Machine Scored
Human
Scored
Writing 7. Compose Full Texts (Opinion) 4 0 1
0102
Research
2. Interpret & Integrate Information 3
1 2 0 3. Analyze Information/Sources
4
4. Use Evidence 3
TOTAL ITEMS NA
Grade 5
102 For the purpose of this table, Writing PTs are noted as three separate “items”; however, the Writing PT score is derived from a single student response scored on three distinct traits.
Page 177
Smarter Balanced 2014-15 and 2015-16 Interim Assessment Technical Report
Appendix B: Test Blueprints
B-60
Block 11: Narrative Performance Task
Claim Assessment Target DOK
Items
Total
Items Machine Scored
Human
Scored
Writing 2. Compose Full Texts (Narrative) 4 0 1
3103
Research
2. Interpret & Integrate Information (2) 3
1 2 3 3. Analyze Information/Sources (0)
4
4. Use Evidence (1) 3
TOTAL ITEMS
6
103 For the purpose of this table, Writing PTs are noted as three separate “items”; however, the Writing PT score is derived from a single student response scored on three distinct traits.
Page 178
Smarter Balanced 2014-15 and 2015-16 Interim Assessment Technical Report
Appendix B: Test Blueprints
B-61
Grade 6
Block 1: Read Literary Texts
Claim Assessment Target DOK104
Items
Total Items Short
Passage
Short
Passage
Long
Passage
Reading
2. Central Ideas 2 0-2
0-
2105
1-
2106 3
4. Reasoning & Evidence 3 0-2 0-247 1-2 1
1. Key Details 1,2 0-1 0-1 0-1 1
3. Word Meaning 1,2 0-1 0-1
0-1 3
5. Analysis within or across Texts 3,4 0-1 0-1 0-1 2
6. Test Structures & Features 2,3 0-1 0-1 0-1 4
104 The goal is for a student to receive no more than 4 items at DOK 1 and at least 3 items at DOK 3 or higher.
105 If necessary, the second short passage will be used to achieve item counts.
106 At least one of these items will be human scored; the other(s) will be machine scored.
Page 179
Smarter Balanced 2014-15 and 2015-16 Interim Assessment Technical Report
Appendix B: Test Blueprints
B-62
Block 1: Read Literary Texts
Claim Assessment Target DOK104
Items
Total Items Short
Passage
Short
Passage
Long
Passage
7. Language Use 2,3 0-1
0-1 0-1 1
TOTAL ITEMS
15
Page 180
Smarter Balanced 2014-15 and 2015-16 Interim Assessment Technical Report
Appendix B: Test Blueprints
B-63
Grade 6
Block 2: Read Informational Texts
Claim Assessment Target DOK107
Items
Total Items Short
Passage
Short
Passage
Long
Passage
Reading
9. Central Ideas 2 0-2
0-2108 1-2 3
11. Reasoning & Evidence 3 0-2 0-250
1-
2109 3
8. Key Details 1, 2 0-1 0-1 0-1 2
10. Word Meanings 1, 2 0-1 0-1 0-1 2
12. Analysis within or across Texts 3, 4 0-1 0-1 0-1 2
13. Text Structures or Text Features 2, 3 0-1 0-1 0-1 2
107 The goal is for a student to receive no more than 4 items at DOK 1 and at least 3 items at DOK 3 or higher.
108 If necessary, the second short passage will be used to achieve item counts.
109 At least one of these items will be human scored; the other(s) will be machine scored.
Page 181
Smarter Balanced 2014-15 and 2015-16 Interim Assessment Technical Report
Appendix B: Test Blueprints
B-64
Block 2: Read Informational Texts
Claim Assessment Target DOK107
Items
Total Items Short
Passage
Short
Passage
Long
Passage
14. Language Use 2, 3
0-1 0-1 0-1 2
TOTAL ITEMS
16
Page 182
Smarter Balanced 2014-15 and 2015-16 Interim Assessment Technical Report
Appendix B: Test Blueprints
B-65
Grade 6
Block 3: Brief Writes
Claim Assessment Target DOK
Items
Total Items
Machine Scored Short Text110
Writing
1a. Write Brief Texts (Narrative) 3 0 3
3
3a. Write Brief Texts (Explanatory) 3 0 1 1
6a. Write Brief Texts (Argument) 3 0 2 2
TOTAL ITEMS
6
110 These items are designed for hand scoring and may be AI scored with an application that yields comparable results by meeting or exceeding reliability and validity criteria for hand scoring.
Page 183
Smarter Balanced 2014-15 and 2015-16 Interim Assessment Technical Report
Appendix B: Test Blueprints
B-66
Grade 6
Block 4: Revision
Claim Assessment Target DOK
Items
Total Items
Machine Scored Short Text
Writing
1b. Revise Brief Texts (Narrative) 2 5 0 5
3b. Revise Brief Texts (Explanatory) 2 5 0 5
6b. Revise Brief Texts (Argument) 2 5 0 5
TOTAL ITEMS
15
Block 5: Language and Vocabulary Use
Claim Assessment Target DOK
Items
Claim
Machine Scored Short Text
Writing 8. Language and Vocabulary Use
1, 2 15 0 15
TOTAL ITEMS
15
Page 184
Smarter Balanced 2014-15 and 2015-16 Interim Assessment Technical Report
Appendix B: Test Blueprints
B-67
Grade 6
Block 6: Editing
Claim Assessment Target DOK
Items
Total Items
Machine Scored Short Text
Writing 9. Edit 1, 2 15 0 15
TOTAL ITEMS
15
Block 7: Listen and Interpret
Claim Assessment Target DOK
Items
Claim
Machine Scored Short Text
Listening 4. Listen/Interpret
1,2,3 15 0 15
TOTAL ITEMS
15
Page 185
Smarter Balanced 2014-15 and 2015-16 Interim Assessment Technical Report
Appendix B: Test Blueprints
B-68
Grade 6
Block 8: Research
Claim Assessment Target DOK
Items
Total Items
Machine Scored Short Text
Research
2. Analyze/Integrate Information 2 5 0 5
3. Evaluate Information/Sources 2 5 0 5
4. Use Evidence 2 8 0 8
TOTAL ITEMS
18
Page 186
Smarter Balanced 2014-15 and 2015-16 Interim Assessment Technical Report
Appendix B: Test Blueprints
B-69
Grade 6
111 For the purpose of this table, Writing PTs are noted as three separate “items”; however, the Writing PT score is derived from a single student response scored on three distinct traits.
Block 9: Explanatory Performance Task
Claim Assessment Target DOK
Items
Total
Items Machine Scored
Human
Scored
Writing 4. Compose Full Texts (Explanatory) 4 0 1
0111
Research
2. Analyze/Integrate Information 3
1 2 0 3. Evaluate Information/Sources
4
4. Use Evidence 3
TOTAL ITEMS NA
Page 187
Smarter Balanced 2014-15 and 2015-16 Interim Assessment Technical Report
Appendix B: Test Blueprints
B-70
Grade 6
112 For the purpose of this table, Writing PTs are noted as three separate “items”; however, the Writing PT score is derived from a single student response scored on three distinct traits.
Block 10: Argument Performance Task
Claim Assessment Target DOK
Items
Total
Items Machine Scored
Human
Scored
Writing 7. Compose Full Texts (Argument) 4 0 1
3112
Research
2. Analyze/Integrate Information (0) 3
2 2
3. Evaluate Information/Sources (1) 4
4. Use Evidence (1) 3
TOTAL ITEMS
5
Page 188
Smarter Balanced 2014-15 and 2015-16 Interim Assessment Technical Report
Appendix B: Test Blueprints
B-71
Grade 6
113 For the purpose of this table, Writing PTs are noted as three separate “items”; however, the Writing PT score is derived from a single student response scored on three distinct traits.
Block 11: Narrative Performance Task
Claim Assessment Target DOK
Items
Total
Items Machine Scored
Human
Scored
Writing 2. Compose Full Texts (Narrative) 4 0 1
0113
Research
2. Analyze/Integrate Information 3
1 2 0 3. Evaluate Information/Sources
4
4. Use Evidence 3
TOTAL ITEMS NA
Page 189
Smarter Balanced 2014-15 and 2015-16 Interim Assessment Technical Report
Appendix B: Test Blueprints
B-72
Grade 7
Block 1: Read Literary Texts
Claim Assessment Target DOK114
Items
Total Items Short
Passage
Short
Passage
Long
Passage
Reading
2. Central Ideas 2 0-2
0-
2115 1-2 2
4. Reasoning & Evidence 3 0-2
0-257 1-
2116 3
1. Key Details 1,2 0-1 0-1
0-1 3
3. Word Meaning 1,2 0-1 0-1 0-1 3
5. Analysis within or across Texts 3,4 0-1 0-1 0-1 1
6. Test Structures & Features 2,3 0-1 0-1 0-1 3
114 The goal is for a student to receive no more than 4 items at DOK 1 and at least 3 items at DOK 3 or higher.
115 If necessary, the second short passage will be used to achieve item counts.
116 At least one of these items will be human scored; the other(s) will be machine scored.
Page 190
Smarter Balanced 2014-15 and 2015-16 Interim Assessment Technical Report
Appendix B: Test Blueprints
B-73
Block 1: Read Literary Texts
Claim Assessment Target DOK114
Items
Total Items Short
Passage
Short
Passage
Long
Passage
7. Language Use 2,3 0-1 0-1 0-1 1
TOTAL ITEMS
16
Page 191
Smarter Balanced 2014-15 and 2015-16 Interim Assessment Technical Report
Appendix B: Test Blueprints
B-74
Grade 7
Block 2: Read Informational Texts
Claim Assessment Target DOK117
Items
Total Items Short
Passage
Short
Passage
Long
Passage
Reading
9. Central Ideas 2 0-2
0-
2118
1-
2119 3
11. Reasoning & Evidence 3 0-2 0-260 1-2 2
8. Key Details 1, 2 0-1
0-1 0-1 2
10. Word Meanings 1, 2 0-1 0-1 0-1 2
12. Analysis within or across Texts 3, 4 0-1 0-1 0-1 3
13. Text Structures or Text Features 2, 3
0-1 0-1 0-1 2
117 The goal is for a student to receive no more than 4 items at DOK 1 and at least 3 items at DOK 3 or higher.
118 If necessary, the second short passage will be used to achieve item counts.
119 At least one of these items will be human scored; the other(s) will be machine scored.
Page 192
Smarter Balanced 2014-15 and 2015-16 Interim Assessment Technical Report
Appendix B: Test Blueprints
B-75
Block 2: Read Informational Texts
Claim Assessment Target DOK117
Items
Total Items Short
Passage
Short
Passage
Long
Passage
14. Language Use 2, 3 0-1 0-1 0-1 2
TOTAL ITEMS
16
Page 193
Smarter Balanced 2014-15 and 2015-16 Interim Assessment Technical Report
Appendix B: Test Blueprints
B-76
Grade 7
Block 3: Brief Writes
Claim Assessment Target DOK
Items
Total Items
Machine Scored Short Text120
Writing
1a. Write Brief Texts (Narrative) 3 0 2 2
3a. Write Brief Texts (Explanatory) 3 0 1 1
6a. Write Brief Texts (Argument) 3 0 3 3
TOTAL ITEMS
6
120 These items are designed for hand scoring and may be AI scored with an application that yields comparable results by meeting or exceeding reliability and validity criteria for hand scoring.
Page 194
Smarter Balanced 2014-15 and 2015-16 Interim Assessment Technical Report
Appendix B: Test Blueprints
B-77
Grade 7
Block 4: Revision
Claim Assessment Target DOK
Items
Total Items
Machine Scored Short Text
Writing
1b. Revise Brief Texts (Narrative) 2 4 0 4
3b. Revise Brief Texts (Explanatory 2 4 0 4
6b. Revise Brief Texts (Argument) 2 7 0 7
TOTAL ITEMS 15
Block 5: Language and Vocabulary Use
Claim Assessment Target DOK
Items
Claim
Machine Scored Short Text
Writing 8. Language and Vocabulary Use
1, 2 15 0 15
TOTAL ITEMS
15
Page 195
Smarter Balanced 2014-15 and 2015-16 Interim Assessment Technical Report
Appendix B: Test Blueprints
B-78
Grade 7
Block 6: Editing
Claim Assessment Target DOK
Items
Total Items
Machine Scored Short Text
Writing 9. Edit 1, 2 15 0 14
TOTAL ITEMS
14
Block 7: Listen and Interpret
Claim Assessment Target DOK
Items
Claim
Machine Scored Short Text
Listening 4. Listen/Interpret
1,2,3 15 0 15
TOTAL ITEMS
15
Page 196
Smarter Balanced 2014-15 and 2015-16 Interim Assessment Technical Report
Appendix B: Test Blueprints
B-79
Grade 7
Block 8: Research
Claim Assessment Target DOK
Items Total
Items Machine Scored Short Text
Research
2. Analyze/Integrate Information 2 6 0 6
3. Evaluate Information/Sources 2 6 0 6
4. Use Evidence 2 6 0 6
TOTAL ITEMS 18
Page 197
Smarter Balanced 2014-15 and 2015-16 Interim Assessment Technical Report
Appendix B: Test Blueprints
B-80
Grade 7
Block 9: Explanatory Performance Task
Claim Assessment Target DOK
Items
Total
Items Machine Scored
Human
Scored
Writing 4. Compose Full Texts (Explanatory) 4 0 1
3121
Research
2. Analyze/Integrate Information (1) 3
1 2 3 3. Evaluate Information/Sources (0)
4
4. Use Evidence (2) 3
TOTAL ITEMS
6
121 For the purpose of this table, Writing PTs are noted as three separate “items”; however, the Writing PT score is derived from a single student response scored on three distinct traits.
Page 198
Smarter Balanced 2014-15 and 2015-16 Interim Assessment Technical Report
Appendix B: Test Blueprints
B-81
Grade 7
Block 10: Argument Performance Task
Claim Assessment Target DOK
Items
Total
Items Machine Scored
Human
Scored
Writing 7. Compose Full Texts (Argument) 4 0 1
0122
Research
2. Analyze/Integrate Information 3
1 2
0 3. Evaluate Information/Sources
4
4. Use Evidence 3
TOTAL ITEMS NA
122 For the purpose of this table, Writing PTs are noted as three separate “items”; however, the Writing PT score is derived from a single student response scored on three distinct traits.
Page 199
Smarter Balanced 2014-15 and 2015-16 Interim Assessment Technical Report
Appendix B: Test Blueprints
B-82
Grade 7
Block 11: Narrative Performance Task
Claim Assessment Target DOK
Items
Total
Items Machine Scored
Human
Scored
Writing 2. Compose Full Texts (Narrative) 4 0
1 0123
Research
2. Analyze/Integrate Information 3
1 2 0 3. Evaluate Information/Sources
4
4. Use Evidence 3
TOTAL ITEMS NA
123 For the purpose of this table, Writing PTs are noted as three separate “items”; however, the Writing PT score is derived from a single student response scored on three distinct traits.
Page 200
Smarter Balanced 2014-15 and 2015-16 Interim Assessment Technical Report
Appendix B: Test Blueprints
B-83
Grade 8
Block 1: Read Literary Texts
Claim Assessment Target DOK124
Items
Total Items Short
Passage
Short
Passage
Long
Passage
Reading
2. Central Ideas 2 0-2
0-
2125
1-2126 2
4. Reasoning & Evidence 3 0-2 0-22 1-2 2
1. Key Details 1,2
0-1 0-1 0-1 4
3. Word Meaning 1,2 0-1 0-1 0-1
2
5. Analysis within or across Texts 3,4 0-1 0-1 0-1 0
6. Test Structures & Features 2,3 0-1 0-1 0-1 3
124 The goal is for a student to receive no more than 4 items at DOK 1 and at least 3 items at DOK 3 or higher.
125 If necessary, the second short passage will be used to achieve item counts.
126 At least one of these items will be human scored; the other(s) will be machine scored.
Page 201
Smarter Balanced 2014-15 and 2015-16 Interim Assessment Technical Report
Appendix B: Test Blueprints
B-84
Block 1: Read Literary Texts
Claim Assessment Target DOK124
Items
Total Items Short
Passage
Short
Passage
Long
Passage
7. Language Use 2,3 0-1 0-1 0-1
3
TOTAL ITEMS
16
Grade 8
Block 2: Read Informational Texts
Claim Assessment Target DOK127
Items
Total Items Short
Passage
Short
Passage
Long
Passage
Reading 9. Central Ideas 2 0-2
0-
2128
1-
2129 3
127 The goal is for a student to receive no more than 4 items at DOK 1 and at least 3 items at DOK 3 or higher.
128 If necessary, the second short passage will be used to achieve item counts.
129 At least one of these items will be human scored; the other(s) will be machine scored.
Page 202
Smarter Balanced 2014-15 and 2015-16 Interim Assessment Technical Report
Appendix B: Test Blueprints
B-85
Block 2: Read Informational Texts
Claim Assessment Target DOK127
Items
Total Items Short
Passage
Short
Passage
Long
Passage
11. Reasoning & Evidence 3 0-2 0-22 1-23 3
8. Key Details 1, 2 0-1 0-1 0-1 3
10. Word Meanings 1, 2 0-1 0-1 0-1 1
12. Analysis within or across Texts 3, 4 0-1 0-1 0-1 2
13. Text Structures or Text Features 2, 3 0-1 0-1 0-1 1
14. Language Use 2, 3
0-1 0-1 0-1 3
TOTAL ITEMS
16
Page 203
Smarter Balanced 2014-15 and 2015-16 Interim Assessment Technical Report
Appendix B: Test Blueprints
B-86
Grade 8
Block 3: Brief Writes
Claim Assessment Target DOK
Items
Total Items
Machine Scored Short Text130
Writing
1a. Write Brief Texts (Narrative) 3 0 2
2
3a. Write Brief Texts (Explanatory) 3 0 2 2
6a. Write Brief Texts (Argument) 3 0 2 2
TOTAL ITEMS
6
130 These items are designed for hand scoring and may be AI scored with an application that yields comparable results by meeting or exceeding reliability and validity criteria for hand scoring.
Page 204
Smarter Balanced 2014-15 and 2015-16 Interim Assessment Technical Report
Appendix B: Test Blueprints
B-87
Grade 8
Block 4: Edit/Revise
Claim Assessment Target DOK
Items
Total Items
Machine Scored Short Text
Writing
1b. Revise Brief Texts (Narrative) 2 2 0 2
3b. Revise Brief Texts (Explanatory) 2 2 0 2
6b. Revise Brief Texts (Argument) 2 1 0 1
8. Language and Vocabulary Use 1,2 5 0 5
9. Edit 1,2 8 0 4
TOTAL ITEMS 14
Page 205
Smarter Balanced 2014-15 and 2015-16 Interim Assessment Technical Report
Appendix B: Test Blueprints
B-88
Grade 8
Block 5: Listen/Interpret
Claim Assessment Target DOK
Items
Claim
Machine Scored Short Text
Writing 4. Listen/Interpret 1, 2, 3 15 0 15
TOTAL ITEMS 15
Page 206
Smarter Balanced 2014-15 and 2015-16 Interim Assessment Technical Report
Appendix B: Test Blueprints
B-89
Grade 8
Block 6: Research
Claim Assessment Target DOK
Items
Total Items
Machine Scored Short Text
Research
2. Analyze/Integrate Information 2 6 0 6
3. Evaluate Information/Sources 2 6
0 6
4. Use Evidence 2
6 0 6
TOTAL ITEMS
18
Page 207
Smarter Balanced 2014-15 and 2015-16 Interim Assessment Technical Report
Appendix B: Test Blueprints
B-90
Grade 8
Block 7: Explanatory Performance Task
Claim Assessment Target DOK
Items
Total
Items Machine
Scored
Human
Scored
Writing 4. Compose Full Texts (Explanatory) 4 0 1 3131
Research
2. Analyze/Integrate Information (1) 3
1 2 3 3. Evaluate Information/Sources 4
4. Use Evidence (2) 3
TOTAL ITEMS 6
131 For the purpose of this table, Writing PTs are noted as three separate “items”; however, the Writing PT score is derived from a single student response scored on three distinct traits.
Page 208
Smarter Balanced 2014-15 and 2015-16 Interim Assessment Technical Report
Appendix B: Test Blueprints
B-91
Grade 8
Block 8: Argument Performance Task
Claim Assessment Target DOK
Items
Total
Items Machine Scored
Human
Scored
Writing 7. Compose Full Texts (Argument) 4 0 1
0132
Research
2. Analyze/Integrate Information 3
1 2 0 3. Evaluate Information/Sources
4
4. Use Evidence 3
TOTAL ITEMS NA
132 For the purpose of this table, Writing PTs are noted as three separate “items”; however, the Writing PT score is derived from a single student response scored on three distinct traits.
Page 209
Smarter Balanced 2014-15 and 2015-16 Interim Assessment Technical Report
Appendix B: Test Blueprints
B-92
Grade 8
Block 9: Narrative Performance Task
Claim Assessment Target DOK
Items
Total
Items Machine Scored
Human
Scored
Writing 2. Compose Full Texts (Narrative) 4 0 1
0133
Research
2. Analyze/Integrate Information 3
1 2 0 3. Evaluate Information/Sources
4
4. Use Evidence 3
TOTAL ITEMS NA
133 For the purpose of this table, Writing PTs are noted as three separate “items”; however, the Writing PT score is derived from a single student response scored on three distinct traits.
Page 210
Smarter Balanced 2014-15 and 2015-16 Interim Assessment Technical Report
Appendix B: Test Blueprints
B-93
High School
Block 1: Read Literary Texts
Claim Assessment Target DOK134
Items
Total Items Short
Passage
Short
Passage
Long
Passage
Reading
2. Central Ideas 2 0-2 0-2135 1-2 1
4. Reasoning & Evidence 3 0-2 0-277 1-2136 3
1. Key Details 1,2 0-1 0-1 0-1 3
3. Word Meaning 1,2 0-1 0-1 0-1 2
5. Analysis within or across Texts 3,4 0-1 0-1 0-1 2
6. Test Structures & Features 2,3 0-1 0-1 0-1 2
134 The goal is for a student to receive no more than 4 items at DOK 1 and at least 3 items at DOK 3 or higher.
135 If necessary, the second short passage will be used to achieve item counts.
136 At least one of these items will be human scored; the other(s) will be machine scored.
Page 211
Smarter Balanced 2014-15 and 2015-16 Interim Assessment Technical Report
Appendix B: Test Blueprints
B-94
Block 1: Read Literary Texts
Claim Assessment Target DOK134
Items
Total Items Short
Passage
Short
Passage
Long
Passage
7. Language Use 2,3 0-1 0-1 0-1 3
TOTAL ITEMS
16
High School
Block 2: Read Informational Texts
Claim Assessment Target DOK137
Items
Total Items Short
Passage
Short
Passage
Long
Passage
Reading 9. Central Ideas 2 0-2
0-
2138 1-2 1
137 The goal is for a student to receive no more than 4 items at DOK 1 and at least 3 items at DOK 3 or higher.
138 If necessary, the second short passage will be used to achieve item counts.
Page 212
Smarter Balanced 2014-15 and 2015-16 Interim Assessment Technical Report
Appendix B: Test Blueprints
B-95
Block 2: Read Informational Texts
Claim Assessment Target DOK137
Items
Total Items Short
Passage
Short
Passage
Long
Passage
11. Reasoning & Evidence 3 0-2 0-280
1-
2139 4
8. Key Details 1, 2 0-1 0-1 0-1 3
10. Word Meanings 1, 2 0-1 0-1 0-1 3
12. Analysis within or across Texts 3, 4 0-1 0-1 0-1 2
13. Text Structures or Text Features 2, 3 0-1 0-1
0-1 0
14. Language Use 2, 3
0-1 0-1 0-1 2
TOTAL ITEMS
15
139 At least one of these items will be human scored; the other(s) will be machine scored.
Page 213
Smarter Balanced 2014-15 and 2015-16 Interim Assessment Technical Report
Appendix B: Test Blueprints
B-96
High School
Block 3: Brief Writes
Claim Assessment Target DOK
Items
Total Items
Machine Scored Short Text140
Writing
1a. Write Brief Texts (Narrative) 3 0 2
2
3a. Write Brief Texts (Explanatory) 3 0 2 2
6a. Write Brief Texts (Argument) 3 0 2 2
TOTAL ITEMS
6
140 These items are designed for hand scoring and may be AI scored with an application that yields comparable results by meeting or exceeding reliability and validity criteria for hand scoring.
Page 214
Smarter Balanced 2014-15 and 2015-16 Interim Assessment Technical Report
Appendix B: Test Blueprints
B-97
High School
Block 4: Revision
Claim Assessment Target DOK
Items
Total Items
Machine Scored Short Text
Writing
1b. Revise Brief Texts (Narrative) 3 4
4
3b. Revise Brief Texts (Explanatory) 3 5
5
6b. Revise Brief Texts (Argument) 3 6
6
TOTAL ITEMS
15
Block 5: Language and Vocabulary Use
Assessment Target DOK
Items
Claim
Machine Scored Short Text
8. Language and Vocabulary Use 1, 2 15 0 15
TOTAL ITEMS 15
Page 215
Smarter Balanced 2014-15 and 2015-16 Interim Assessment Technical Report
Appendix B: Test Blueprints
B-98
High School
Block 6: Editing
Claim Assessment Target DOK
Items
Total Items
Machine Scored Short Text
Writing 9. Edit 1, 2 15 0 15
TOTAL ITEMS
15
Block 7: Listen and Interpret
Claim Assessment Target DOK
Items
Claim
Machine Scored Short Text
Listening 4. Listen/Interpret
1,2,3 15 0 15
TOTAL ITEMS
15
High School
Page 216
Smarter Balanced 2014-15 and 2015-16 Interim Assessment Technical Report
Appendix B: Test Blueprints
B-99
Block 8: Research
Claim Assessment Target DOK
Items
Total Items
Machine Scored Short Text141
Research
2. Analyze/Integrate Information 3 8 0 8
3. Evaluate Information/Sources 4 2 0 2
4. Use Evidence 3 8 0 8
TOTAL ITEMS
18
141 These items are designed for hand scoring and may be AI scored with an application that yields comparable results by meeting or exceeding reliability and validity criteria for hand scoring.
Page 217
Smarter Balanced 2014-15 and 2015-16 Interim Assessment Technical Report
Appendix B: Test Blueprints
B-100
High School
Block 9: Explanatory Performance Task
Claim Assessment Target DOK
Items Total
Items Machine Scored Short Text
Writing 4. Compose Full Texts (Narrative) 4 0 1
3142
Research
2. Analyze/Integrate Information (1) 3
2 2
3. Evaluate Information/Sources 4
4. Use Evidence (1) 3
TOTAL ITEMS
5
142 For the purpose of this table, Writing PTs are noted as three separate “items”; however, the Writing PT score is derived from a single student response scored on three distinct traits.
Page 218
Smarter Balanced 2014-15 and 2015-16 Interim Assessment Technical Report
Appendix B: Test Blueprints
B-101
High School
Block 10: Argument Performance Task
Claim Assessment Target DOK
Items
Total
Items Machine
Scored
Short
Text
Writing 7. Compose Full Texts (Arguments)
4 0 1 0143
Researc
h
2. Analyze/Integrate Information 3
1 2 0 3. Evaluate Information/Sources
4
4. Use Evidence 3
TOTAL ITEMS NA
143 For the purpose of this table, Writing PTs are noted as three separate “items”; however, the Writing PT score is derived from a single student response scored on three distinct traits.
Page 219
Smarter Balanced 2014-15 and 2015-16 Interim Assessment Technical Report
Appendix B: Test Blueprints
B-102
Blueprint Table Mathematics Grades 3–5
Estimated Total Testing Time: 3:00 (with Classroom Activity)144
Claim/Score Reporting Category Content Category145
Stimuli Items Total Items by
Claim146
CAT PT CAT147 PT148
1. Concepts and Procedures
Priority Cluster 0
0
13-15
0 17-20
Supporting Cluster 0 4-5
2. Problem Solving
4. Modeling and Data Analysis149
Problem Solving 0
1
6 2-4 8-10
Modeling and Data Analysis 0
3. Communicating Reasoning Communicating Reasoning 0 8 0-2 8-10
Mathematics Interim Comprehensive Assessment Test Blueprints
144 All times are estimates. Actual times may vary.
145 For more information on content categories, see the Content Specifications document at http://www.smarterbalanced.org/assessments/development.
146 While the range for the total items by Claim for Problem Solving/Modeling and Data Analysis and Communicating Reasoning indicates 8-10 items in each reporting category, the total
number of items across these two reporting categories for any individual test event is 18-20.
147 All CAT items in grades 3–5 are designed to be machine-scored.
148 Each PT contains 4-6 total items. Up to four PT items may require hand-scoring.
149 Claim 2 (Problem Solving) and Claim 4 (Modeling and Data Analysis) have been combined because of content similarity and to provide flexibility for item development. There are still four
claims, but only three claim scores will be reported with the overall math score.
Page 220
Smarter Balanced 2014-15 and 2015-16 Interim Assessment Technical Report
Appendix B: Test Blueprints
B-103
Blueprint Table Mathematics Grades 6–8
Estimated Total Testing Time: 3:30 (with Classroom Activity)150
Claim/Score Reporting Category Content Category151
Stimuli Items Total Items by
Claim152
CAT PT CAT153 PT154
1. Concepts and Procedures
Priority Cluster 0
0
12-15
0 16-20
Supporting Cluster 0 4-5
2. Problem Solving
4. Modeling and Data Analysis155
Problem Solving 0
1
6 2-4 8-10
Modeling and Data Analysis 0
3. Communicating Reasoning Communicating Reasoning 0 8 0-2 8-10
150 All times are estimates. Actual times may vary.
151 For more information on content categories, see the Content Specifications document at http://www.smarterbalanced.org/assessments/development .
152 While the range for the total items by Claim for Problem Solving/Modeling and Data Analysis and Communicating Reasoning indicates 8-10 items in each reporting category, the total
number of items across these two reporting categories for any individual test event is 18-20.
153 In grades 6-8, up to one CAT item per student may require hand-scoring (from either Claim 3 or Claim 4), which may be AI-scored with an application that yields comparable results by
meeting or exceeding reliability and validity criteria for hand-scoring.
154 Each PT contains 4-6 total items. Up to four PT items may require hand-scoring.
155 Claim 2 (Problem Solving) and Claim 4 (Modeling and Data Analysis) have been combined because of content similarity and to provide flexibility for item development. There are still four
claims, but only three claim scores will be reported with the overall math score.
Page 221
Smarter Balanced 2014-15 and 2015-16 Interim Assessment Technical Report
Appendix B: Test Blueprints
B-104
Blueprint Table Mathematics Grade 11
Estimated Total Testing Time: 4:00 (with Classroom Activity)156
Claim/Score Reporting Category Content Category157
Stimuli Items Total Items by
Claim158
CAT PT CAT159 PT160
1. Concepts and Procedures
Priority Cluster 0
0
14-16
0 19-22
Supporting Cluster 0 5-6
2. Problem Solving
4. Modeling and Data Analysis5161
Problem Solving 0
1
6 2-4 8-10
Modeling and Data Analysis 0
3. Communicating Reasoning Communicating Reasoning 0 8 0-2 8-10
156 All times are estimates. Actual times may vary.
157 For more information on content categories, see the Content Specifications document at http://www.smarterbalanced.org/assessments/development .
158 While the range for the total items by Claim for Problem Solving/Modeling and Data Analysis and Communicating Reasoning indicates 8-10 items in each reporting category, the total
number of items across these two reporting categories for any individual test event is 18-20.
159 In grade 11, up to one CAT item per student may require hand-scoring (from either Claim 3 or Claim 4), which may be AI-scored with an application that yields comparable results by
meeting or exceeding reliability and validity criteria for hand-scoring.
160 Each PT contains 4-6 total items. Up to six PT items may require hand-scoring.
161 Claim 2 (Problem Solving) and Claim 4 (Modeling and Data Analysis) have been combined, because of content similarity and to provide flexibility for item development. There are still four
claims, but only three claim scores will be reported with the overall math score.
Page 222
Smarter Balanced 2014-15 and 2015-16 Interim Assessment Technical Report
Appendix B: Test Blueprints
B-105
Target Sampling Mathematics Grade 3
Claim Content
Category Assessment Targets DOK
Items Total
Items
CAT PT
1. Concepts and
Procedures
Priority
Cluster
B. Understand properties of multiplication and the relationship between
multiplication and division. 1
5-6
0 17-20
C. Multiply and divide within 100. 1
I. Geometric measurement: understand concepts of area and relate area to
multiplication and to addition. 1, 2
G. Solve problems involving measurement and estimation of intervals of time,
liquid volumes, and masses of objects. 1, 2
D. Solve problems involving the four operations, and identify and explain
patterns in arithmetic. 2
5-6
F. Develop understanding of fractions as numbers. 1, 2
A. Represent and solve problems involving multiplication and division. 1, 2 2-3
Supporting
Cluster
E. Use place value understanding and properties of operations to perform
multi-digit arithmetic. 1
3-4
J. Geometric measurement: recognize perimeter as an attribute of plane
figures and distinguish between linear and area measures. 1
Page 223
Smarter Balanced 2014-15 and 2015-16 Interim Assessment Technical Report
Appendix B: Test Blueprints
B-106
Target Sampling Mathematics Grade 3
Claim Content
Category Assessment Targets DOK
Items Total
Items
CAT PT
K. Reason with shapes and their attributes. 1, 2
H. Represent and interpret data. 2, 3 1
─ DOK: Depth of Knowledge, consistent with the Smarter Balanced Content Specifications.
─ The CAT algorithm will be configured to ensure the following:
• For Claim 1, each student will receive at least 7 CAT items at DOK 2 or higher.
• For combined Claims 2 and 4, each student will receive at least 2 CAT items at DOK 3 or higher.
• For Claim 3, each student will receive at least 2 CAT items at DOK 3 or higher.
Page 224
Smarter Balanced 2014-15 and 2015-16 Interim Assessment Technical Report
Appendix B: Test Blueprints
B-107
Target Sampling Mathematics Grade 3
Claim Content
Category Assessment Targets DOK
Items Total
Items
CAT PT
2. Problem
Solving
4. Modeling
and Data
Analysis
Problem
Solving
(drawn across
content
domains)
A. Apply mathematics to solve well-
posed problems arising in
everyday life, society, and the
workplace.
2, 3 2
1–
2
8-10
B. Select and use appropriate tools
strategically.
C. Interpret results in the context of a
situation.
D. Identify important quantities in a
practical situation and map their
relationships (e.g., using
diagrams, two-way tables, graphs,
flow charts, or formulas).
1,
2, 3 1
Modeling and
Data Analysis
(drawn across
content
domains)
A. Apply mathematics to solve
problems arising in everyday life,
society, and the workplace.
D. Interpret results in the context of a
situation.
2, 3 1
1–
3
B. Construct, autonomously, chains
of reasoning to justify
mathematical models used,
interpretations made, and
solutions proposed for a complex
problem.
E. Analyze the adequacy of and
make improvements to an existing
model or develop a mathematical
model of a real phenomenon.
2,
3, 4 1
C. State logical assumptions being
used.
F. Identify important quantities in a
practical situation and map their
relationships (e.g., using
diagrams, two-way tables, graphs,
flow charts, or formulas).
1,
2, 3 1
Page 225
Smarter Balanced 2014-15 and 2015-16 Interim Assessment Technical Report
Appendix B: Test Blueprints
B-108
Target Sampling Mathematics Grade 3
Claim Content
Category Assessment Targets DOK
Items Total
Items
CAT PT
G. Identify, analyze, and synthesize
relevant external resources to
pose or solve problems.
3, 4 0
3.
Communicating
Reasoning
Communicating
Reasoning
(drawn across
content
domains)
A. Test propositions or conjectures
with specific examples.
D. Use the technique of breaking an
argument into cases.
2, 3 3
0-
2 8-10
B. Construct, autonomously, chains
of reasoning that will justify or
refute propositions or conjectures.
E. Distinguish correct logic or
reasoning from that which is
flawed, and—if there is a flaw in
the argument—explain what it is.
2,
3, 4 3
C. State logical assumptions being
used.
F. Base arguments on concrete
referents such as objects,
drawings, diagrams, and actions.
2, 3 2
─ DOK: Depth of Knowledge, consistent with the Smarter Balanced Content Specifications.
─ The CAT algorithm will be configured to ensure the following:
• For Claim 1, each student will receive at least 7 CAT items at DOK 2 or higher.
• For combined Claims 2 and 4, each student will receive at least 2 CAT items at DOK 3 or higher.
• For Claim 3, each student will receive at least 2 CAT items at DOK 3 or higher.
Page 226
Smarter Balanced 2014-15 and 2015-16 Interim Assessment Technical Report
Appendix B: Test Blueprints
B-109
Target Sampling Mathematics Grade 4
Claim Content
Category Assessment Targets DOK
Items Total
Items
CAT PT
1. Concepts
and
Procedures
Priority
Cluster
A. Use the four operations with whole
numbers to solve problems. 1, 2
8-9
0 17-20
E. Use place value understanding and
properties of operations to perform multi-
digit arithmetic.
1, 2
F. Extend understanding of fraction
equivalence and ordering. 1, 2
G. Build fractions from unit fractions by
applying and extending previous
understandings of operations on whole
numbers.
1, 2 2-3
D. Generalize place value understanding for
multi-digit whole numbers. 1, 2 1-2
H. Understand decimal notation for fractions,
and compare decimal fractions. 1, 2 1
Supporting
Cluster
I. Solve problems involving measurement
and conversion of measurements from a
larger unit to a smaller unit.
1, 2
2-3
K. Geometric measurement: understand
concepts of angle and measure angles. 1, 2
B. Gain familiarity with factors and multiples. 1, 2
1 C. Generate and analyze patterns. 2, 3
J. Represent and interpret data. 1, 2
L. Draw and identify lines and angles, and
classify shapes by properties of their lines
and angles.
1, 2 1
─ DOK: Depth of Knowledge, consistent with the Smarter Balanced Content Specifications.
Page 227
Smarter Balanced 2014-15 and 2015-16 Interim Assessment Technical Report
Appendix B: Test Blueprints
B-110
─ The CAT algorithm will be configured to ensure the following:
• For Claim 1, each student will receive at least 7 CAT items at DOK 2 or higher.
• For combined Claims 2 and 4, each student will receive at least 2 CAT items at DOK 3 or higher.
• For Claim 3, each student will receive at least 2 CAT items at DOK 3 or higher.
Target Sampling Mathematics Grade 4
Claim Content
Category Assessment Targets DOK
Items Total
Items
CAT PT
2. Problem
Solving
4. Modeling
and Data
Analysis
Problem
Solving
(drawn across
content
domains)
A. Apply mathematics to solve well-
posed problems arising in
everyday life, society, and the
workplace.
2, 3 2
1–
2
8-10
B. Select and use appropriate tools
strategically.
C. Interpret results in the context of a
situation.
D. Identify important quantities in a
practical situation and map their
relationships (e.g., using
diagrams, two-way tables, graphs,
flow charts, or formulas).
1,
2, 3 1
Modeling and
Data Analysis
(drawn across
content
domains)
A. Apply mathematics to solve
problems arising in everyday life,
society, and the workplace.
D. Interpret results in the context of a
situation.
2, 3 1
1–
3
B. Construct, autonomously, chains
of reasoning to justify
mathematical models used,
interpretations made, and
solutions proposed for a complex
problem.
E. Analyze the adequacy of and
make improvements to an existing
model or develop a mathematical
model of a real phenomenon.
2,
3, 4 1
Page 228
Smarter Balanced 2014-15 and 2015-16 Interim Assessment Technical Report
Appendix B: Test Blueprints
B-111
Target Sampling Mathematics Grade 4
Claim Content
Category Assessment Targets DOK
Items Total
Items
CAT PT
C. State logical assumptions being
used.
F. Identify important quantities in a
practical situation and map their
relationships (e.g., using
diagrams, two-way tables, graphs,
flow charts, or formulas).
1,
2, 3 1
G. Identify, analyze, and synthesize
relevant external resources to
pose or solve problems.
3, 4 0
3.
Communicating
Reasoning
Communicating
Reasoning
(drawn across
content
domains)
A. Test propositions or conjectures
with specific examples.
D. Use the technique of breaking an
argument into cases.
2, 3 3
0-
2 8-10
B. Construct, autonomously, chains
of reasoning that will justify or
refute propositions or conjectures.
E. Distinguish correct logic or
reasoning from that which is
flawed, and—if there is a flaw in
the argument—explain what it is.
2,
3, 4 3
C. State logical assumptions being
used.
F. Base arguments on concrete
referents such as objects,
drawings, diagrams, and actions.
2, 3 2
─ DOK: Depth of Knowledge, consistent with the Smarter Balanced Content Specifications.
─ The CAT algorithm will be configured to ensure the following:
• For Claim 1, each student will receive at least 7 CAT items at DOK 2 or higher.
• For combined Claims 2 and 4, each student will receive at least 2 CAT items at DOK 3 or higher.
• For Claim 3, each student will receive at least 2 CAT items at DOK 3 or higher
Page 229
Smarter Balanced 2014-15 and 2015-16 Interim Assessment Technical Report
Appendix B: Test Blueprints
B-112
Target Sampling Mathematics Grade 5
Claim Content
Category Assessment Targets DOK
Items Total
Items
CAT PT
1.
Concepts
and
Procedures
Priority
Cluster
E. Use equivalent fractions as a strategy
to add and subtract fractions. 1, 2
5-6
0 17-20
I. Geometric measurement: understand
concepts of volume and relate volume
to multiplication and to addition.
1, 2
F. Apply and extend previous
understandings of multiplication and
division to multiply and divide
fractions.
1, 2 4-5
D. Perform operations with multi-digit
whole numbers and with decimals to
hundredths.
1, 2
3-4
C. Understand the place value system. 1, 2
Supporting
Cluster
J. Graph points on the coordinate plane
to solve real-world and mathematical
problems.
1
2-3
K. Classify two-dimensional figures into
categories based on their properties. 2
A. Write and interpret numerical
expressions. 1
2
B. Analyze patterns and relationships. 2
G. Convert like measurement units
within a given measurement system. 1
H. Represent and interpret data. 1, 2
─ DOK: Depth of Knowledge, consistent with the Smarter Balanced Content Specifications.
─ The CAT algorithm will be configured to ensure the following:
Page 230
Smarter Balanced 2014-15 and 2015-16 Interim Assessment Technical Report
Appendix B: Test Blueprints
B-113
• For Claim 1, each student will receive at least 7 CAT items at DOK 2 or higher.
• For combined Claims 2 and 4, each student will receive at least 2 CAT items at DOK 3 or higher.
• For Claim 3, each student will receive at least 2 CAT items at DOK 3 or higher.
Target Sampling Mathematics Grade 5
Claim Content
Category Assessment Targets DOK
Items Total
Items
CAT PT
2. Problem
Solving
4. Modeling
and Data
Analysis
Problem
Solving
(drawn across
content
domains)
A. Apply mathematics to solve well-
posed problems arising in
everyday life, society, and the
workplace.
2, 3 2
1–
2
8-10
B. Select and use appropriate tools
strategically.
C. Interpret results in the context of a
situation.
D. Identify important quantities in a
practical situation and map their
relationships (e.g., using
diagrams, two-way tables, graphs,
flow charts, or formulas).
1,
2, 3 1
Modeling and
Data Analysis
(drawn across
content
domains)
A. Apply mathematics to solve
problems arising in everyday life,
society, and the workplace.
D. Interpret results in the context of a
situation.
2, 3 1
1–
3
B. Construct, autonomously, chains
of reasoning to justify
mathematical models used,
interpretations made, and
solutions proposed for a complex
problem.
E. Analyze the adequacy of and
make improvements to an existing
model or develop a mathematical
model of a real phenomenon.
2,
3, 4 1
C. State logical assumptions being
used.
1,
2, 3 1
Page 231
Smarter Balanced 2014-15 and 2015-16 Interim Assessment Technical Report
Appendix B: Test Blueprints
B-114
─ DOK: Depth of Knowledge, consistent with the Smarter Balanced Content Specifications.
─ The CAT algorithm will be configured to ensure the following:
• For Claim 1, each student will receive at least 7 CAT items at DOK 2 or higher.
• For Claim 3, each student will receive at least 2 CAT items at DOK 3 or higher.
• For combined Claims 2 and 4, each student will receive at least 2 CAT items at DOK 3 or higher.
F. Identify important quantities in a
practical situation and map their
relationships (e.g., using
diagrams, two-way tables, graphs,
flow charts, or formulas).
G. Identify, analyze, and synthesize
relevant external resources to
pose or solve problems.
3, 4 0
3.
Communicating
Reasoning
Communicating
Reasoning
(drawn across
content
domains)
A. Test propositions or conjectures
with specific examples.
D. Use the technique of breaking an
argument into cases.
2, 3 3
0-
2 8-10
B. Construct, autonomously, chains
of reasoning that will justify or
refute propositions or conjectures.
E. Distinguish correct logic or
reasoning from that which is
flawed, and—if there is a flaw in
the argument—explain what it is.
2,
3, 4 3
C. State logical assumptions being
used.
F. Base arguments on concrete
referents such as objects,
drawings, diagrams, and actions.
2, 3 2
Page 232
Smarter Balanced 2014-15 and 2015-16 Interim Assessment Technical Report
Appendix B: Test Blueprints
B-115
Target Sampling Mathematics Grade 6
Claim Content
Category Assessment Targets DOK
Items Total
Items
CAT PT
1.
Concepts
and
Procedures
Priority
Cluster
E. Apply and extend previous
understandings of arithmetic to
algebraic expressions.
1
5-6
0 16-19
F. Reason about and solve one-
variable equations and
inequalities.
1, 2
A. Understand ratio concepts and
use ratio reasoning to solve
problems.
1, 2 3-4
G. Represent and analyze
quantitative relationships
between dependent and
independent variables.
2
2
B. Apply and extend previous
understandings of multiplication
and division to divide fractions by
fractions.
1, 2
D. Apply and extend previous
understandings of numbers to
the system of rational numbers.
1, 2 2
Supporting
Cluster
C. Compute fluently with multi-digit
numbers and find common
factors and multiples.
1, 2
4-5 H. Solve real-world and
mathematical problems involving
area, surface area, and volume.
1, 2
I. Develop understanding of
statistical variability. 2
Page 233
Smarter Balanced 2014-15 and 2015-16 Interim Assessment Technical Report
Appendix B: Test Blueprints
B-116
DOK: Depth of Knowledge, consistent with the Smarter Balanced Content Specifications.
─ The CAT algorithm will be configured to ensure the following:
• For Claim 1, each student will receive at least 7 CAT items at DOK 2 or higher.
• For Claim 3, each student will receive at least 2 CAT items at DOK 3 or higher.
• For combined Claims 2 and 4, each student will receive at least 2 CAT items at DOK 3 or higher.
Target Sampling Mathematics Grade 6
Claim Content
Category Assessment Targets DOK
Items Total
Items
CAT PT
2. Problem
Solving
4. Modeling
and Data
Analysis
Problem
Solving
(drawn across
content
domains)
A. Apply mathematics to solve well-
posed problems arising in
everyday life, society, and the
workplace.
2, 3 2
1–
2
8-10
B. Select and use appropriate tools
strategically.
C. Interpret results in the context of a
situation.
D. Identify important quantities in a
practical situation and map their
relationships (e.g., using
diagrams, two-way tables, graphs,
flow charts, or formulas).
1,
2, 3 1
Modeling and
Data Analysis
(drawn across
content
domains)
A. Apply mathematics to solve
problems arising in everyday life,
society, and the workplace.
D. Interpret results in the context of a
situation.
2, 3 1
1–
3 B. Construct, autonomously, chains
of reasoning to justify
mathematical models used,
interpretations made, and
solutions proposed for a complex
problem.
2,
3, 4 1
J. Summarize and describe
distributions. 1, 2
Page 234
Smarter Balanced 2014-15 and 2015-16 Interim Assessment Technical Report
Appendix B: Test Blueprints
B-117
Target Sampling Mathematics Grade 6
Claim Content
Category Assessment Targets DOK
Items Total
Items
CAT PT
E. Analyze the adequacy of and
make improvements to an existing
model or develop a mathematical
model of a real phenomenon.
C. State logical assumptions being
used.
F. Identify important quantities in a
practical situation and map their
relationships (e.g., using
diagrams, two-way tables, graphs,
flow charts, or formulas).
1,
2, 3 1
G. Identify, analyze, and synthesize
relevant external resources to
pose or solve problems.
3, 4 0
3.
Communicating
Reasoning
Communicating
Reasoning
(drawn across
content
domains)
A. Test propositions or conjectures
with specific examples.
D. Use the technique of breaking an
argument into cases.
2, 3 3
0-
2 8-10
B. Construct, autonomously, chains
of reasoning that will justify or
refute propositions or conjectures.
E. Distinguish correct logic or
reasoning from that which is
flawed, and—if there is a flaw in
the argument—explain what it is.
2,
3, 4 3
C. State logical assumptions being
used.
F. Base arguments on concrete
referents such as objects,
drawings, diagrams, and actions.
G. At later grades, determine
conditions under which an
argument does and does not
apply. (For example, area
increases with perimeter for
2, 3 2
Page 235
Smarter Balanced 2014-15 and 2015-16 Interim Assessment Technical Report
Appendix B: Test Blueprints
B-118
Target Sampling Mathematics Grade 6
Claim Content
Category Assessment Targets DOK
Items Total
Items
CAT PT
squares, but not for all plane
figures.)
─ DOK: Depth of Knowledge, consistent with the Smarter Balanced Content Specifications.
─ The CAT algorithm will be configured to ensure the following:
• For Claim 1, each student will receive at least 7 CAT items at DOK 2 or higher.
• For Claim 3, each student will receive at least 2 CAT items at DOK 3 or higher.
• For combined Claims 2 and 4, each student will receive at least 2 CAT items at DOK 3 or higher.
Target Sampling Mathematics Grade 7
Claim Content
Category Assessment Targets DOK
Items Total
Items
CAT PT
1. Concepts
and
Procedures
Priority
Cluster
A. Analyze proportional relationships and
use them to solve real-world and
mathematical problems.
2
8-9
0 17-20
D. Solve real-life and mathematical
problems using numerical and
algebraic expressions and equations.
1, 2
B. Apply and extend previous
understandings of operations with
fractions to add, subtract, multiply,
and divide rational numbers.
1, 2
5-6
C. Use properties of operations to
generate equivalent expressions. 1, 2
Supporting
Cluster
E. Draw, construct, and describe
geometrical figures and describe the
relationship between them.
1, 2 2-3
Page 236
Smarter Balanced 2014-15 and 2015-16 Interim Assessment Technical Report
Appendix B: Test Blueprints
B-119
Target Sampling Mathematics Grade 7
Claim Content
Category Assessment Targets DOK
Items Total
Items
CAT PT
F. Solve real-life and mathematical
problems involving angle measure,
area, surface area, and volume.
1, 2
G. Use random sampling to draw
inferences about a population. 1, 2
1-2
H. Draw informal comparative inferences
about two populations. 2
I. Investigate chance processes and
develop, use, and evaluate probability
models.
1, 2
─ DOK: Depth of Knowledge, consistent with the Smarter Balanced Content Specifications.
─ The CAT algorithm will be configured to ensure the following:
• For Claim 1, each student will receive at least 7 CAT items at DOK 2 or higher.
• For Claim 3, each student will receive at least 2 CAT items at DOK 3 or higher.
• For combined Claims 2 and 4, each student will receive at least 2 CAT items at DOK 3 or higher.
Target Sampling Mathematics Grade 7
Claim Content
Category Assessment Targets DOK
Items Total
Items
CAT PT
2. Problem
Solving
4. Modeling
and Data
Analysis
Problem
Solving
(drawn across
content
domains)
A. Apply mathematics to solve well-
posed problems arising in
everyday life, society, and the
workplace.
2, 3 2
1–2 8-10
B. Select and use appropriate tools
strategically.
C. Interpret results in the context of
a situation.
1,
2, 3 1
Page 237
Smarter Balanced 2014-15 and 2015-16 Interim Assessment Technical Report
Appendix B: Test Blueprints
B-120
Target Sampling Mathematics Grade 7
Claim Content
Category Assessment Targets DOK
Items Total
Items
CAT PT
D. Identify important quantities in a
practical situation and map their
relationships (e.g., using
diagrams, two-way tables, graphs,
flow charts, or formulas).
Modeling and
Data Analysis
(drawn across
content
domains)
A. Apply mathematics to solve
problems arising in everyday life,
society, and the workplace.
D. Interpret results in the context of
a situation.
2, 3 1
1–3
B. Construct, autonomously, chains
of reasoning to justify
mathematical models used,
interpretations made, and
solutions proposed for a complex
problem.
E. Analyze the adequacy of and
make improvements to an
existing model or develop a
mathematical model of a real
phenomenon.
2,
3, 4 1
C. State logical assumptions being
used.
F. Identify important quantities in a
practical situation and map their
relationships (e.g., using
diagrams, two-way tables, graphs,
flow charts, or formulas).
1,
2, 3 1
G. Identify, analyze, and synthesize
relevant external resources to
pose or solve problems.
3, 4 0
3.
Communicating
Reasoning
Communicating
Reasoning
A. Test propositions or conjectures
with specific examples.
D. Use the technique of breaking an
argument into cases.
2, 3 3 0-2 8-10
Page 238
Smarter Balanced 2014-15 and 2015-16 Interim Assessment Technical Report
Appendix B: Test Blueprints
B-121
Target Sampling Mathematics Grade 7
Claim Content
Category Assessment Targets DOK
Items Total
Items
CAT PT
(drawn across
content
domains)
B. Construct, autonomously, chains
of reasoning that will justify or
refute propositions or
conjectures.
E. Distinguish correct logic or
reasoning from that which is
flawed, and—if there is a flaw in
the argument—explain what it is.
2,
3, 4 3
C. State logical assumptions being
used.
F. Base arguments on concrete
referents such as objects,
drawings, diagrams, and actions.
G. At later grades, determine
conditions under which an
argument does and does not
apply. (For example, area
increases with perimeter for
squares, but not for all plane
figures.)
2, 3 2
─ DOK: Depth of Knowledge, consistent with the Smarter Balanced Content Specifications.
─ The CAT algorithm will be configured to ensure the following:
• For Claim 1, each student will receive at least 7 CAT items at DOK 2 or higher.
• For Claim 3, each student will receive at least 2 CAT items at DOK 3 or higher.
• For combined Claims 2 and 4, each student will receive at least 2 CAT items at DOK 3 or higher.
Page 239
Smarter Balanced 2014-15 and 2015-16 Interim Assessment Technical Report
Appendix B: Test Blueprints
B-122
DOK: Depth of Knowledge, consistent with the Smarter Balanced Content Specifications.
─ The CAT algorithm will be configured to ensure the following:
Target Sampling Mathematics Grade 8
Claim Content
Category Assessment Targets DOK
Items Total Items
CAT PT
1.
Concepts
and
Procedures
Priority
Cluster
C. Understand the connections
between proportional
relationships, lines, and linear
equations.
1, 2
5-6
0 17-20
D. Analyze and solve linear equations
and pairs of simultaneous linear
equations.
1, 2
B. Work with radicals and integer
exponents. 1, 2
5-6
E. Define, evaluate, and compare
functions. 1, 2
G. Understand congruence and
similarity using physical models,
transparencies, or geometry
software.
1, 2
F. Use functions to model
relationships between quantities. 1, 2
2-3
H. Understand and apply the
Pythagorean Theorem. 1, 2
Supporting
Cluster
A. Know that there are numbers that
are not rational, and approximate
them by rational numbers.
1, 2
4-5 I. Solve real-world and mathematical
problems involving volume of
cylinders, cones, and spheres.
1, 2
J. Investigate patterns of association
in bivariate data. 1, 2
Page 240
Smarter Balanced 2014-15 and 2015-16 Interim Assessment Technical Report
Appendix B: Test Blueprints
B-123
• For Claim 1, each student will receive at least 7 CAT items at DOK 2 or higher.
• For Claim 3, each student will receive at least 2 CAT items at DOK 3 or higher.
• For combined Claims 2 and 4, each student will receive at least 2 CAT items at DOK 3 or higher.
Target Sampling Mathematics Grade 8
Claim Content
Category Assessment Targets DOK
Items Total
Items
CAT PT
2. Problem
Solving
4. Modeling
and Data
Analysis
Problem
Solving
(drawn across
content
domains)
A. Apply mathematics to solve well-
posed problems arising in
everyday life, society, and the
workplace.
2, 3 2
1–2
8-10
B. Select and use appropriate tools
strategically.
C. Interpret results in the context of a
situation.
D. Identify important quantities in a
practical situation and map their
relationships (e.g., using
diagrams, two-way tables, graphs,
flow charts, or formulas).
1,
2, 3 1
Modeling and
Data Analysis
(drawn across
content
domains)
A. Apply mathematics to solve
problems arising in everyday life,
society, and the workplace.
D. Interpret results in the context of
a situation.
2, 3 1
1–3
B. Construct, autonomously, chains
of reasoning to justify
mathematical models used,
interpretations made, and
solutions proposed for a complex
problem.
E. Analyze the adequacy of and
make improvements to an existing
model or develop a mathematical
model of a real phenomenon.
2,
3, 4 1
C. State logical assumptions being
used.
F. Identify important quantities in a
practical situation and map their
1,
2, 3 1
Page 241
Smarter Balanced 2014-15 and 2015-16 Interim Assessment Technical Report
Appendix B: Test Blueprints
B-124
Target Sampling Mathematics Grade 8
Claim Content
Category Assessment Targets DOK
Items Total
Items
CAT PT
relationships (e.g., using
diagrams, two-way tables, graphs,
flow charts, or formulas).
G. Identify, analyze, and synthesize
relevant external resources to
pose or solve problems.
3, 4 0
3.
Communicating
Reasoning
Communicating
Reasoning
(drawn across
content
domains)
A. Test propositions or conjectures
with specific examples.
D. Use the technique of breaking an
argument into cases.
2, 3 3
0-2 8-10
B. Construct, autonomously, chains
of reasoning that will justify or
refute propositions or conjectures.
E. Distinguish correct logic or
reasoning from that which is
flawed, and—if there is a flaw in
the argument—explain what it is.
2,
3, 4 3
C. State logical assumptions being
used.
F. Base arguments on concrete
referents such as objects,
drawings, diagrams, and actions.
G. At later grades, determine
conditions under which an
argument does and does not
apply. (For example, area
increases with perimeter for
squares, but not for all plane
figures.)
2, 3 2
─ DOK: Depth of Knowledge, consistent with the Smarter Balanced Content Specifications.
─ The CAT algorithm will be configured to ensure the following:
• For Claim 1, each student will receive at least 7 CAT items at DOK 2 or higher.
• For Claim 3, each student will receive at least 2 CAT items at DOK 3 or higher.
• For combined Claims 2 and 4, each student will receive at least 2 CAT items at DOK 3 or higher.
Page 242
Smarter Balanced 2014-15 and 2015-16 Interim Assessment Technical Report
Appendix B: Test Blueprints
B-125
Target Sampling Mathematics Grade 11
Claim Content
Category Assessment Targets DOK
Items Total
Items
CAT PT
1. Concepts
and
Procedures
Priority
Cluster
D. Interpret the structure of
expressions. 1, 2
2
0 19-22
E. Write expressions in equivalent forms
to solve problems. 1, 2
F. Perform arithmetic operations on
polynomials. 2 1
G. Create equations that describe
numbers or relationships. 1, 2
4-5
H. Understand solving equations as a
process of reasoning and explain the
reasoning.
1, 2
I. Solve equations and inequalities in
one variable. 1, 2
J. Represent and solve equations and
inequalities graphically. 1, 2 2
K. Understand the concept of a function
and use function notation. 1, 2 2
L. Interpret functions that arise in
applications in terms of a context. 1, 2
3-4 M. Analyze functions using different
representations.
1, 2,
3
N. Build a function that models a
relationship between two quantities. 2
Supporting
Cluster
O. Define trigonometric ratios and solve
problems involving right triangles. 1, 2 2
Page 243
Smarter Balanced 2014-15 and 2015-16 Interim Assessment Technical Report
Appendix B: Test Blueprints
B-126
Target Sampling Mathematics Grade 11
Claim Content
Category Assessment Targets DOK
Items Total
Items
CAT PT
P. Summarize, represent, and interpret
data on a single count or
measurement variable.
2 1-2
A. Extend the properties of exponents to
rational exponents. 1, 2
1
B. Use properties of rational and
irrational numbers. 1, 2
C. Reason quantitatively and use units
to solve problems. 1, 2 1
─ DOK: Depth of Knowledge, consistent with the Smarter Balanced Content Specifications.
─ The CAT algorithm will be configured to ensure the following:
• For Claim 1, each student will receive at least 7 CAT items at DOK 2 or higher.
• For Claim 3, each student will receive at least 2 CAT items at DOK 3 or higher.
• For combined Claims 2 and 4, each student will receive at least 2 CAT items at DOK 3 or higher.
Page 244
Smarter Balanced 2014-15 and 2015-16 Interim Assessment Technical Report
Appendix B: Test Blueprints
B-127
Target Sampling Mathematics Grade 11
Claim Content
Category Assessment Targets DOK
Items Total
Items
CAT PT
2. Problem
Solving
4. Modeling
and Data
Analysis
Problem
Solving
(drawn across
content
domains)
A. Apply mathematics to solve well-
posed problems arising in
everyday life, society, and the
workplace.
2, 3 2
1–2
8-10
B. Select and use appropriate tools
strategically.
C. Interpret results in the context of a
situation.
D. Identify important quantities in a
practical situation and map their
relationships (e.g., using
diagrams, two-way tables, graphs,
flow charts, or formulas).
1,
2, 3 1
Modeling and
Data Analysis
(drawn across
content
domains)
A. Apply mathematics to solve
problems arising in everyday life,
society, and the workplace.
D. Interpret results in the context of
a situation.
2, 3 1
1–3
B. Construct, autonomously, chains
of reasoning to justify
mathematical models used,
interpretations made, and
solutions proposed for a complex
problem.
E. Analyze the adequacy of and
make improvements to an existing
model or develop a mathematical
model of a real phenomenon.
2,
3, 4 1
C. State logical assumptions being
used.
F. Identify important quantities in a
practical situation and map their
relationships (e.g., using
diagrams, two-way tables, graphs,
flow charts, or formulas).
1,
2, 3 1
Page 245
Smarter Balanced 2014-15 and 2015-16 Interim Assessment Technical Report
Appendix B: Test Blueprints
B-128
Target Sampling Mathematics Grade 11
Claim Content
Category Assessment Targets DOK
Items Total
Items
CAT PT
G. Identify, analyze, and synthesize
relevant external resources to
pose or solve problems.
3, 4 0
3.
Communicating
Reasoning
Communicating
Reasoning
(drawn across
content
domains)
A. Test propositions or conjectures
with specific examples.
D. Use the technique of breaking an
argument into cases.
2, 3 3
0-2 8-10
B. Construct, autonomously, chains
of reasoning that will justify or
refute propositions or conjectures.
E. Distinguish correct logic or
reasoning from that which is
flawed, and—if there is a flaw in
the argument—explain what it is.
2,
3, 4 3
C. State logical assumptions being
used.
F. Base arguments on concrete
referents such as objects,
drawings, diagrams, and actions.
G. At later grades, determine
conditions under which an
argument does and does not
apply. (For example, area
increases with perimeter for
squares, but not for all plane
figures.)
2, 3 2
─ DOK: Depth of Knowledge, consistent with the Smarter Balanced Content Specifications.
─ The CAT algorithm will be configured to ensure the following:
• For Claim 1, each student will receive at least 7 CAT items at DOK 2 or higher.
• For Claim 3, each student will receive at least 2 CAT items at DOK 3 or higher.
• For combined Claims 2 and 4, each student will receive at least 2 CAT items at DOK 3 or higher.
Page 246
Smarter Balanced 2014-15 and 2015-16 Interim Assessment Technical Report
Appendix B: Test Blueprints
B-129
Mathematics Interim Assessment Block Test Blueprints
Grade 3 Grade 4 Grade 5
Operations and Algebraic Thinking** Operations and Algebraic Thinking** Operations and Algebraic Thinking*
Number and Operations – Fractions** Number and Operations – Fractions** Number and Operations – Fractions**
Measurement and Data Measurement and Data* Measurement and Data**
Number and Operations in Base Ten* Number and Operations in Base Ten Number and Operations in Base Ten
Geometry* Geometry*
Mathematics Performance Task Mathematics Performance Task Mathematics Performance Task
* IAB is new for 2016–17
** IAB has been revised for 2016–17
Page 247
Smarter Balanced 2014-15 and 2015-16 Interim Assessment Technical Report
Appendix B: Test Blueprints
B-130
Grade 6 Grade 7 Grade 8
Ratios and Proportional Relationships Ratio and Proportional Relationships** Expressions & Equations I**
The Number System* The Number System** Expressions & Equations II
(with Prob/Stat)*
Expressions and Equations** Expressions and Equations** Functions**
Geometry** Geometry* Geometry**
Statistics and Probability* Statistics and Probability*
Mathematics Performance Task Mathematics Performance Task Mathematics Performance Task
IAB is new for 2016–17
** IAB has been revised for 2016–17
Page 248
Smarter Balanced 2014-15 and 2015-16 Interim Assessment Technical Report
Appendix B: Test Blueprints
B-131
GRADE 3
Grade 3 – Operations and Algebraic Thinking (15 items)
Claim Content
Category Assessment Targets DOK
Number
of
Items
Total Items
per
Reporting
Category
1. Concepts
and
Procedures
OA
A. Represent and solve problems involving multiplication and division. 1, 2 4
12
B. Understand properties of multiplication and the relationship between
multiplication and division. 1 2
C. Multiply and divide within 100. 1 2
D. Solve problems involving the four operations, and identify and explain
patterns in arithmetic. 2 4
2. Problem
Solving
4. Modeling and
Data Analysis
Problem Solving
A. Apply mathematics to solve well-posed problems arising in everyday
life, society, and the workplace. 2, 3
1
2
B. Select and use appropriate tools strategically.
C. Interpret results in the context of a situation.
D. Identify important quantities in a practical situation and map their
relationships (e.g., using diagrams, two-way tables, graphs, flow charts,
or formulas).
1, 2, 3
Modeling and
Data Analysis
A. Apply mathematics to solve problems arising in everyday life, society,
and the workplace.
D. Interpret results in the context of a situation.
2, 3 1
Page 249
Smarter Balanced 2014-15 and 2015-16 Interim Assessment Technical Report
Appendix B: Test Blueprints
B-132
Grade 3 – Operations and Algebraic Thinking (15 items)
Claim Content
Category Assessment Targets DOK
Number
of
Items
Total Items
per
Reporting
Category
B. Construct, autonomously, chains of reasoning to justify mathematical
models used, interpretations made, and solutions proposed for a
complex problem.
E. Analyze the adequacy of and make improvements to an existing model
or develop a mathematical model of a real phenomenon.
2, 3, 4
C. State logical assumptions being used.
F. Identify important quantities in a practical situation and map their
relationships (e.g., using diagrams, two-way tables, graphs, flow charts,
or formulas).
1, 2, 3
G. Identify, analyze, and synthesize relevant external resources to pose
or solve problems. 3, 4
3.
Communicating
Reasoning
Communicating
Reasoning
A. Test propositions or conjectures with specific examples.
D. Use the technique of breaking an argument into cases. 2, 3
1 1
B. Construct, autonomously, chains of reasoning that will justify or refute
propositions or conjectures.
E. Distinguish correct logic or reasoning from that which is flawed, and—if
there is a flaw in the argument—explain what it is.
2, 3, 4
C. State logical assumptions being used.
F. Base arguments on concrete referents such as objects, drawings,
diagrams, and actions.
2, 3
GRADE 3
Page 250
Smarter Balanced 2014-15 and 2015-16 Interim Assessment Technical Report
Appendix B: Test Blueprints
B-133
Grade 3 – Number and Operations – Fractions (14 items)
Claim Content
Category Assessment Targets DOK
Number
of Items
Total Items
per
Reporting
Category
1. Concepts and
Procedures NF F. Develop understanding of fractions as numbers. 1, 2 13 13
2. Problem Solving
4. Modeling and
Data Analysis
Problem Solving
A. Apply mathematics to solve well-posed problems arising in
everyday life, society, and the workplace. 2, 3
0
0
B. Select and use appropriate tools strategically.
C. Interpret results in the context of a situation.
D. Identify important quantities in a practical situation and map
their relationships (e.g., using diagrams, two-way tables, graphs,
flow charts, or formulas).
1, 2, 3
Modeling and
Data Analysis
A. Apply mathematics to solve problems arising in everyday life,
society, and the workplace.
D. Interpret results in the context of a situation.
2, 3
0
B. Construct, autonomously, chains of reasoning to justify
mathematical models used, interpretations made, and solutions
proposed for a complex problem.
E. Analyze the adequacy of and make improvements to an existing
model or develop a mathematical model of a real phenomenon.
2, 3, 4
C. State logical assumptions being used.
F. Identify important quantities in a practical situation and map
their relationships (e.g., using diagrams, two-way tables, graphs,
flow charts, or formulas).
1, 2, 3
Page 251
Smarter Balanced 2014-15 and 2015-16 Interim Assessment Technical Report
Appendix B: Test Blueprints
B-134
Grade 3 – Number and Operations – Fractions (14 items)
Claim Content
Category Assessment Targets DOK
Number
of Items
Total Items
per
Reporting
Category
G. Identify, analyze, and synthesize relevant external resources to
pose or solve problems. 3, 4
3. Communicating
Reasoning
Communicating
Reasoning
A. Test propositions or conjectures with specific examples.
D. Use the technique of breaking an argument into cases. 2, 3
1 1
B. Construct, autonomously, chains of reasoning that will justify or
refute propositions or conjectures.
E. Distinguish correct logic or reasoning from that which is flawed,
and—if there is a flaw in the argument—explain what it is.
2, 3, 4
C. State logical assumptions being used.
F. Base arguments on concrete referents such as objects,
drawings, diagrams, and actions.
2, 3
Page 252
Smarter Balanced 2014-15 and 2015-16 Interim Assessment Technical Report
Appendix B: Test Blueprints
B-135
GRADE 3
Grade 3 – Measurement and Data (15 items)
Claim Content
Category Assessment Targets DOK
Number
of Items
Total
Items per
Reporting
Category
1. Concepts and
Procedures MD
G. Solve problems involving measurement and estimation of intervals of
time, liquid volumes, and masses of objects. 1, 2 4
12
H. Represent and interpret data. 2, 3 2
I. Geometric measurement: understand concepts of area and relate
area to multiplication and to addition. 1, 2 4
J. Geometric measurement: recognize perimeter as an attribute of plane
figures and distinguish between linear and area measures. 1 2
2. Problem
Solving
4. Modeling and
Data Analysis
Problem
Solving
Claim 2
A. Apply mathematics to solve well-posed problems arising in everyday
life, society, and the workplace. 2, 3
1
2
B. Select and use appropriate tools strategically.
C. Interpret results in the context of a situation.
D. Identify important quantities in a practical situation and map their
relationships (e.g., using diagrams, two-way tables, graphs, flow
charts, or formulas).
1, 2,
3
Modeling and
Data Analysis
Claim 4
A. Apply mathematics to solve problems arising in everyday life, society,
and the workplace.
D. Interpret results in the context of a situation.
2, 3 1
Page 253
Smarter Balanced 2014-15 and 2015-16 Interim Assessment Technical Report
Appendix B: Test Blueprints
B-136
Grade 3 – Measurement and Data (15 items)
Claim Content
Category Assessment Targets DOK
Number
of Items
Total
Items per
Reporting
Category
B. Construct, autonomously, chains of reasoning to justify mathematical
models used, interpretations made, and solutions proposed for a
complex problem.
E. Analyze the adequacy of and make improvements to an existing model
or develop a mathematical model of a real phenomenon.
2, 3,
4
C. State logical assumptions being used.
F. Identify important quantities in a practical situation and map their
relationships (e.g., using diagrams, two-way tables, graphs, flow
charts, or formulas).
1, 2,
3
G. Identify, analyze, and synthesize relevant external resources to pose
or solve problems. 3, 4
3. Communicating
Reasoning
Communicating
Reasoning
A. Test propositions or conjectures with specific examples.
D. Use the technique of breaking an argument into cases. 2, 3
1 1 B. Construct, autonomously, chains of reasoning that will justify or refute
propositions or conjectures.
E. Distinguish correct logic or reasoning from that which is flawed, and—
if there is a flaw in the argument—explain what it is.
2, 3,
4
Page 254
Smarter Balanced 2014-15 and 2015-16 Interim Assessment Technical Report
Appendix B: Test Blueprints
B-137
Grade 3 – Measurement and Data (15 items)
Claim Content
Category Assessment Targets DOK
Number
of Items
Total
Items per
Reporting
Category
C. State logical assumptions being used.
F. Base arguments on concrete referents such as objects, drawings,
diagrams, and actions.
2, 3
Page 255
Smarter Balanced 2014-15 and 2015-16 Interim Assessment Technical Report
Appendix B: Test Blueprints
B-138
GRADE 3
Grade 3 – Number and Operations in Base Ten (14 items)
Claim Content
Category Assessment Targets DOK
Number
of
Items
Total
Items per
Reporting
Category
1. Concepts and
Procedures NBT
E. Use place value understanding and properties of operations to
perform multi-digit arithmetic. 1 12 12
2. Problem Solving
4. Modeling and
Data Analysis
Problem
Solving
A. Apply mathematics to solve well-posed problems arising in
everyday life, society, and the workplace. 2, 3
2
2
B. Select and use appropriate tools strategically.
C. Interpret results in the context of a situation.
D. Identify important quantities in a practical situation and map their
relationships (e.g., using diagrams, two-way tables, graphs, flow
charts, or formulas).
1, 2, 3
Modeling and
Data Analysis
A. Apply mathematics to solve problems arising in everyday life,
society, and the workplace.
D. Interpret results in the context of a situation.
2, 3
0
B. Construct, autonomously, chains of reasoning to justify
mathematical models used, interpretations made, and solutions
proposed for a complex problem.
E. Analyze the adequacy of and make improvements to an existing
model or develop a mathematical model of a real phenomenon.
2, 3, 4
C. State logical assumptions being used.
F. Identify important quantities in a practical situation and map their
relationships (e.g., using diagrams, two-way tables, graphs, flow
charts, or formulas).
1, 2, 3
Page 256
Smarter Balanced 2014-15 and 2015-16 Interim Assessment Technical Report
Appendix B: Test Blueprints
B-139
Grade 3 – Number and Operations in Base Ten (14 items)
Claim Content
Category Assessment Targets DOK
Number
of
Items
Total
Items per
Reporting
Category
G. Identify, analyze, and synthesize relevant external resources to
pose or solve problems. 3, 4
3. Communicating
Reasoning
Communicating
Reasoning
A. Test propositions or conjectures with specific examples.
D. Use the technique of breaking an argument into cases. 2, 3
0 0
B. Construct, autonomously, chains of reasoning that will justify or
refute propositions or conjectures.
E. Distinguish correct logic or reasoning from that which is flawed,
and—if there is a flaw in the argument—explain what it is.
2, 3, 4
C. State logical assumptions being used.
F. Base arguments on concrete referents such as objects, drawings,
diagrams, and actions.
2, 3
Page 257
Smarter Balanced 2014-15 and 2015-16 Interim Assessment Technical Report
Appendix B: Test Blueprints
B-140
GRADE 3
Grade 3 – Interim Assessment Block – Performance Task
Claim Content
Category Assessment Targets DOK
Items
per
Claim
Total
Items in
PT
2. Problem Solving
4. Modeling and
Data Analysis
Problem
Solving
A. Apply mathematics to solve well-posed problems arising in everyday life,
society, and the workplace. 2, 3
2
6
B. Select and use appropriate tools strategically.
C. Interpret results in the context of a situation.
D. Identify important quantities in a practical situation and map their
relationships (e.g., using diagrams, two-way tables, graphs, flow charts,
or formulas).
1, 2, 3
Modeling and
Data Analysis
A. Apply mathematics to solve problems arising in everyday life, society,
and the workplace.
D. Interpret results in the context of a situation.
2, 3
2
B. Construct, autonomously, chains of reasoning to justify mathematical
models used, interpretations made, and solutions proposed for a
complex problem.
E. Analyze the adequacy of and make improvements to an existing model
or develop a mathematical model of a real phenomenon.
2, 3, 4
C. State logical assumptions being used.
F. Identify important quantities in a practical situation and map their
relationships (e.g., using diagrams, two-way tables, graphs, flow charts,
or formulas).
1, 2, 3
G. Identify, analyze, and synthesize relevant external resources to pose or
solve problems. 3, 4
Page 258
Smarter Balanced 2014-15 and 2015-16 Interim Assessment Technical Report
Appendix B: Test Blueprints
B-141
Grade 3 – Interim Assessment Block – Performance Task
Claim Content
Category Assessment Targets DOK
Items
per
Claim
Total
Items in
PT
3. Communicating
Reasoning
Communicating
Reasoning
A. Test propositions or conjectures with specific examples.
D. Use the technique of breaking an argument into cases. 2, 3
2
B. Construct, autonomously, chains of reasoning that will justify or refute
propositions or conjectures.
E. Distinguish correct logic or reasoning from that which is flawed, and—if
there is a flaw in the argument—explain what it is.
2, 3, 4
C. State logical assumptions being used.
F. Base arguments on concrete referents such as objects, drawings,
diagrams, and actions.
2, 3
Page 259
Smarter Balanced 2014-15 and 2015-16 Interim Assessment Technical Report
Appendix B: Test Blueprints
B-142
GRADE 4
Grade 4 – Operations and Algebraic Thinking (16 items)
Claim Content
Category Assessment Targets DOK
Number
of Items
Total
Items per
Reporting
Category
1. Concepts and
Procedures OA
A. Use the four operations with whole numbers to solve problems. 1, 2 4
9 B. Gain familiarity with factors and multiples. 1, 2 4
C. Generate and analyze patterns. 2, 3 1
2. Problem
Solving
4. Modeling and
Data Analysis
Problem
Solving
A. Apply mathematics to solve well-posed problems arising in everyday
life, society, and the workplace. 2, 3
2
5
B. Select and use appropriate tools strategically.
C. Interpret results in the context of a situation.
D. Identify important quantities in a practical situation and map their
relationships (e.g., using diagrams, two-way tables, graphs, flow
charts, or formulas).
1, 2, 3
Modeling and
Data Analysis
A. Apply mathematics to solve problems arising in everyday life,
society, and the workplace.
D. Interpret results in the context of a situation.
2, 3 3
Page 260
Smarter Balanced 2014-15 and 2015-16 Interim Assessment Technical Report
Appendix B: Test Blueprints
B-143
Grade 4 – Operations and Algebraic Thinking (16 items)
Claim Content
Category Assessment Targets DOK
Number
of Items
Total
Items per
Reporting
Category
B. Construct, autonomously, chains of reasoning to justify
mathematical models used, interpretations made, and solutions
proposed for a complex problem.
E. Analyze the adequacy of and make improvements to an existing
model or develop a mathematical model of a real phenomenon.
2, 3, 4
C. State logical assumptions being used.
F. Identify important quantities in a practical situation and map their
relationships (e.g., using diagrams, two-way tables, graphs, flow
charts, or formulas).
1, 2, 3
G. Identify, analyze, and synthesize relevant external resources to
pose or solve problems. 3, 4
3. Communicating
Reasoning
Communicating
Reasoning
A. Test propositions or conjectures with specific examples.
D. Use the technique of breaking an argument into cases. 2, 3
2 2
B. Construct, autonomously, chains of reasoning that will justify or
refute propositions or conjectures.
E. Distinguish correct logic or reasoning from that which is flawed,
and—if there is a flaw in the argument—explain what it is.
2, 3, 4
C. State logical assumptions being used. 2, 3
Page 261
Smarter Balanced 2014-15 and 2015-16 Interim Assessment Technical Report
Appendix B: Test Blueprints
B-144
Grade 4 – Operations and Algebraic Thinking (16 items)
Claim Content
Category Assessment Targets DOK
Number
of Items
Total
Items per
Reporting
Category
F. Base arguments on concrete referents such as objects, drawings,
diagrams, and actions.
Page 262
Smarter Balanced 2014-15 and 2015-16 Interim Assessment Technical Report
Appendix B: Test Blueprints
B-145
GRADE 4
Grade 4 – Number and Operations in Base Ten (15 items)
Claim Content Category Assessment Targets DOK Number
of Items
Total Items
per
Reporting
Category
1. Concepts and
Procedures NBT
D. Generalize place value understanding for multi-digit whole
numbers. 1, 2 5
12
E. Use place value understanding and properties of operations to
perform multi-digit arithmetic. 1 7
2. Problem Solving
4. Modeling and
Data Analysis
Problem Solving
A. Apply mathematics to solve well-posed problems arising in everyday
life, society, and the workplace. 2, 3
1
1
B. Select and use appropriate tools strategically.
C. Interpret results in the context of a situation.
D. Identify important quantities in a practical situation and map their
relationships (e.g., using diagrams, two-way tables, graphs, flow
charts, or formulas).
1, 2, 3
Modeling and
Data Analysis
A. Apply mathematics to solve problems arising in everyday life,
society, and the workplace.
D. Interpret results in the context of a situation.
2, 3
0
B. Construct, autonomously, chains of reasoning to justify
mathematical models used, interpretations made, and solutions
proposed for a complex problem.
2, 3, 4
Page 263
Smarter Balanced 2014-15 and 2015-16 Interim Assessment Technical Report
Appendix B: Test Blueprints
B-146
Grade 4 – Number and Operations in Base Ten (15 items)
Claim Content Category Assessment Targets DOK Number
of Items
Total Items
per
Reporting
Category
E. Analyze the adequacy of and make improvements to an existing
model or develop a mathematical model of a real phenomenon.
C. State logical assumptions being used.
F. Identify important quantities in a practical situation and map their
relationships (e.g., using diagrams, two-way tables, graphs, flow
charts, or formulas).
1, 2, 3
G. Identify, analyze, and synthesize relevant external resources to
pose or solve problems. 3, 4
3. Communicating
Reasoning
Communicating
Reasoning
A. Test propositions or conjectures with specific examples.
D. Use the technique of breaking an argument into cases. 2, 3
2 2
B. Construct, autonomously, chains of reasoning that will justify or
refute propositions or conjectures.
E. Distinguish correct logic or reasoning from that which is flawed,
and—if there is a flaw in the argument—explain what it is.
2, 3, 4
C. State logical assumptions being used.
F. Base arguments on concrete referents such as objects, drawings,
diagrams, and actions.
2, 3
Page 264
Smarter Balanced 2014-15 and 2015-16 Interim Assessment Technical Report
Appendix B: Test Blueprints
B-147
GRADE 4
Grade 4 – Number and Operations – Fractions (15 items)
Claim Content Category Assessment Targets DOK
Number
of
Items
Total
Items per
Reporting
Category
1. Concepts and
Procedures NF
F. Extend understanding of fraction equivalence and ordering. 1, 2 5
12 G. Build fractions from unit fractions by applying and extending
previous understandings of operations on whole numbers. 1, 2 5
H. Understand decimal notation for fractions, and compare decimal
fractions. 1, 2 2
2. Problem Solving
4. Modeling and
Data Analysis
Problem Solving
A. Apply mathematics to solve well-posed problems arising in everyday
life, society, and the workplace. 2, 3
1
1
B. Select and use appropriate tools strategically.
C. Interpret results in the context of a situation.
D. Identify important quantities in a practical situation and map their
relationships (e.g., using diagrams, two-way tables, graphs, flow
charts, or formulas).
1, 2,
3
Modeling and
Data Analysis
A. Apply mathematics to solve problems arising in everyday life, society,
and the workplace.
D. Interpret results in the context of a situation.
2, 3
0
B. Construct, autonomously, chains of reasoning to justify
mathematical models used, interpretations made, and solutions
proposed for a complex problem.
2, 3,
4
Page 265
Smarter Balanced 2014-15 and 2015-16 Interim Assessment Technical Report
Appendix B: Test Blueprints
B-148
Grade 4 – Number and Operations – Fractions (15 items)
Claim Content Category Assessment Targets DOK
Number
of
Items
Total
Items per
Reporting
Category
E. Analyze the adequacy of and make improvements to an existing
model or develop a mathematical model of a real phenomenon.
C. State logical assumptions being used.
F. Identify important quantities in a practical situation and map their
relationships (e.g., using diagrams, two-way tables, graphs, flow
charts, or formulas).
1, 2,
3
G. Identify, analyze, and synthesize relevant external resources to pose
or solve problems. 3, 4
3. Communicating
Reasoning
Communicating
Reasoning
A. Test propositions or conjectures with specific examples.
D. Use the technique of breaking an argument into cases. 2, 3
2 2
B. Construct, autonomously, chains of reasoning that will justify or
refute propositions or conjectures.
E. Distinguish correct logic or reasoning from that which is flawed, and—
if there is a flaw in the argument—explain what it is.
2, 3,
4
C. State logical assumptions being used.
F. Base arguments on concrete referents such as objects, drawings,
diagrams, and actions.
2, 3
Page 266
Smarter Balanced 2014-15 and 2015-16 Interim Assessment Technical Report
Appendix B: Test Blueprints
B-149
GRADE 4
Grade 4 – Geometry (11 items)
Claim Content
Category Assessment Targets DOK
Number
of
Items
Total
Items per
Reporting
Category
1. Concepts and
Procedures G L. Draw and identify lines and angles, and classify shapes by properties
of their lines and angles. 1, 2 11 11
2. Problem Solving
4. Modeling and
Data Analysis
Problem
Solving
A. Apply mathematics to solve well-posed problems arising in everyday
life, society, and the workplace. 2, 3
0
0
B. Select and use appropriate tools strategically.
C. Interpret results in the context of a situation.
D. Identify important quantities in a practical situation and map their
relationships (e.g., using diagrams, two-way tables, graphs, flow
charts, or formulas).
1, 2,
3
Modeling and
Data Analysis
A. Apply mathematics to solve problems arising in everyday life,
society, and the workplace.
D. Interpret results in the context of a situation.
2, 3
0
B. Construct, autonomously, chains of reasoning to justify
mathematical models used, interpretations made, and solutions
proposed for a complex problem.
E. Analyze the adequacy of and make improvements to an existing
model or develop a mathematical model of a real phenomenon.
2, 3,
4
C. State logical assumptions being used.
F. Identify important quantities in a practical situation and map their
relationships (e.g., using diagrams, two-way tables, graphs, flow
charts, or formulas).
1, 2,
3
Page 267
Smarter Balanced 2014-15 and 2015-16 Interim Assessment Technical Report
Appendix B: Test Blueprints
B-150
Grade 4 – Geometry (11 items)
Claim Content
Category Assessment Targets DOK
Number
of
Items
Total
Items per
Reporting
Category
G. Identify, analyze, and synthesize relevant external resources to pose
or solve problems. 3, 4
3. Communicating
Reasoning
Communicating
Reasoning
A. Test propositions or conjectures with specific examples.
D. Use the technique of breaking an argument into cases. 2, 3
0 0
B. Construct, autonomously, chains of reasoning that will justify or
refute propositions or conjectures.
E. Distinguish correct logic or reasoning from that which is flawed,
and—if there is a flaw in the argument—explain what it is.
2, 3,
4
C. State logical assumptions being used.
F. Base arguments on concrete referents such as objects, drawings,
diagrams, and actions.
2, 3
Page 268
Smarter Balanced 2014-15 and 2015-16 Interim Assessment Technical Report
Appendix B: Test Blueprints
B-151
GRADE 4
Grade 4 – Measurement and Data (15 items)
Claim Content
Category Assessment Targets DOK
Number
of
Items
Total
Items per
Reporting
Category
1. Concepts and
Procedures MD
I. Solve problems involving measurement and conversion of
measurements from a larger unit to a smaller unit. 1, 2 6
13 J. Represent and interpret data. 1, 2 2
K. Geometric measurement: understand concepts of angle and measure
angles. 1, 2 5
2. Problem Solving
4. Modeling and Data
Analysis
Problem
Solving
A. Apply mathematics to solve well-posed problems arising in everyday
life, society, and the workplace. 2, 3
1
2
B. Select and use appropriate tools strategically.
C. Interpret results in the context of a situation.
D. Identify important quantities in a practical situation and map their
relationships (e.g., using diagrams, two-way tables, graphs, flow
charts, or formulas).
1, 2,
3
Modeling and
Data Analysis
A. Apply mathematics to solve problems arising in everyday life, society,
and the workplace.
D. Interpret results in the context of a situation.
2, 3
1
B. Construct, autonomously, chains of reasoning to justify mathematical
models used, interpretations made, and solutions proposed for a
complex problem.
E. Analyze the adequacy of and make improvements to an existing model
or develop a mathematical model of a real phenomenon.
2, 3,
4
Page 269
Smarter Balanced 2014-15 and 2015-16 Interim Assessment Technical Report
Appendix B: Test Blueprints
B-152
Grade 4 – Measurement and Data (15 items)
Claim Content
Category Assessment Targets DOK
Number
of
Items
Total
Items per
Reporting
Category
C. State logical assumptions being used.
F. Identify important quantities in a practical situation and map their
relationships (e.g., using diagrams, two-way tables, graphs, flow
charts, or formulas).
1, 2,
3
G. Identify, analyze, and synthesize relevant external resources to pose
or solve problems. 3, 4
3. Communicating
Reasoning
Communicating
Reasoning
A. Test propositions or conjectures with specific examples.
D. Use the technique of breaking an argument into cases. 2, 3
0 0
B. Construct, autonomously, chains of reasoning that will justify or refute
propositions or conjectures.
E. Distinguish correct logic or reasoning from that which is flawed, and—
if there is a flaw in the argument—explain what it is.
2, 3,
4
C. State logical assumptions being used.
F. Base arguments on concrete referents such as objects, drawings,
diagrams, and actions.
2, 3
GRADE 4
Page 270
Smarter Balanced 2014-15 and 2015-16 Interim Assessment Technical Report
Appendix B: Test Blueprints
B-153
Grade 4 – Interim Assessment Block – Performance Task
Claim Content
Category Assessment Targets DOK
Items
per
Claim
Total
Items in
PT
2. Problem Solving
4. Modeling and
Data Analysis
Problem
Solving
A. Apply mathematics to solve well-posed problems arising in everyday life,
society, and the workplace. 2, 3
2
6
B. Select and use appropriate tools strategically.
C. Interpret results in the context of a situation.
D. Identify important quantities in a practical situation and map their
relationships (e.g., using diagrams, two-way tables, graphs, flow charts,
or formulas).
1, 2, 3
Modeling and
Data Analysis
A. Apply mathematics to solve problems arising in everyday life, society,
and the workplace.
D. Interpret results in the context of a situation.
2, 3
2
B. Construct, autonomously, chains of reasoning to justify mathematical
models used, interpretations made, and solutions proposed for a
complex problem.
E. Analyze the adequacy of and make improvements to an existing model
or develop a mathematical model of a real phenomenon.
2, 3, 4
C. State logical assumptions being used.
F. Identify important quantities in a practical situation and map their
relationships (e.g., using diagrams, two-way tables, graphs, flow charts,
or formulas).
1, 2, 3
G. Identify, analyze, and synthesize relevant external resources to pose or
solve problems. 3, 4
Page 271
Smarter Balanced 2014-15 and 2015-16 Interim Assessment Technical Report
Appendix B: Test Blueprints
B-154
Grade 4 – Interim Assessment Block – Performance Task
Claim Content
Category Assessment Targets DOK
Items
per
Claim
Total
Items in
PT
3. Communicating
Reasoning
Communicating
Reasoning
A. Test propositions or conjectures with specific examples.
D. Use the technique of breaking an argument into cases. 2, 3
2
B. Construct, autonomously, chains of reasoning that will justify or refute
propositions or conjectures.
E. Distinguish correct logic or reasoning from that which is flawed, and—if
there is a flaw in the argument—explain what it is.
2, 3, 4
C. State logical assumptions being used.
F. Base arguments on concrete referents such as objects, drawings,
diagrams, and actions.
2, 3
Page 272
Smarter Balanced 2014-15 and 2015-16 Interim Assessment Technical Report
Appendix B: Test Blueprints
B-155
GRADE 5
Grade 5 – Number and Operations in Base Ten (15 items)
Claim Content
Category Assessment Targets DOK
Number
of
Items
Total Items
per
Reporting
Category
1. Concepts and
Procedures NBT
C. Understand the place value system. 1, 2 4
11 D. Perform operations with multi-digit whole numbers and with decimals
to hundredths. 1, 2 7
2. Problem Solving
4. Modeling and
Data Analysis
Problem
Solving
A. Apply mathematics to solve well-posed problems arising in everyday life,
society, and the workplace. 2, 3
1
2
B. Select and use appropriate tools strategically.
C. Interpret results in the context of a situation.
D. Identify important quantities in a practical situation and map their
relationships (e.g., using diagrams, two-way tables, graphs, flow charts,
or formulas).
1, 2,
3
Modeling and
Data Analysis
A. Apply mathematics to solve problems arising in everyday life, society,
and the workplace.
D. Interpret results in the context of a situation.
2, 3
1 B. Construct, autonomously, chains of reasoning to justify mathematical
models used, interpretations made, and solutions proposed for a
complex problem.
E. Analyze the adequacy of and make improvements to an existing model
or develop a mathematical model of a real phenomenon.
2, 3,
4
Page 273
Smarter Balanced 2014-15 and 2015-16 Interim Assessment Technical Report
Appendix B: Test Blueprints
B-156
Grade 5 – Number and Operations in Base Ten (15 items)
Claim Content
Category Assessment Targets DOK
Number
of
Items
Total Items
per
Reporting
Category
C. State logical assumptions being used.
F. Identify important quantities in a practical situation and map their
relationships (e.g., using diagrams, two-way tables, graphs, flow charts,
or formulas).
1, 2,
3
G. Identify, analyze, and synthesize relevant external resources to pose or
solve problems. 3, 4
3. Communicating
Reasoning
Communicating
Reasoning
A. Test propositions or conjectures with specific examples.
D. Use the technique of breaking an argument into cases. 2, 3
2 2
B. Construct, autonomously, chains of reasoning that will justify or refute
propositions or conjectures.
E. Distinguish correct logic or reasoning from that which is flawed, and—if
there is a flaw in the argument—explain what it is.
2, 3,
4
C. State logical assumptions being used.
F. Base arguments on concrete referents such as objects, drawings,
diagrams, and actions.
2, 3
Page 274
Smarter Balanced 2014-15 and 2015-16 Interim Assessment Technical Report
Appendix B: Test Blueprints
B-157
GRADE 5
Grade 5 – Number and Operations – Fractions (15 items)
Claim Content
Category Assessment Targets DOK
Number
of
Items
Total Items
per
Reporting
Category
1. Concepts and
Procedures NF
E. Use equivalent fractions as a strategy to add and subtract fractions. 1, 2 5
11 F. Apply and extend previous understandings of multiplication and division
to multiply and divide fractions. 1, 2 6
2. Problem Solving
4. Modeling and
Data Analysis
Problem
Solving
A. Apply mathematics to solve well-posed problems arising in everyday life,
society, and the workplace. 2, 3
1
2
B. Select and use appropriate tools strategically.
C. Interpret results in the context of a situation.
D. Identify important quantities in a practical situation and map their
relationships (e.g., using diagrams, two-way tables, graphs, flow charts,
or formulas).
1, 2,
3
Modeling and
Data Analysis
A. Apply mathematics to solve problems arising in everyday life, society,
and the workplace.
D. Interpret results in the context of a situation.
2, 3
1 B. Construct, autonomously, chains of reasoning to justify mathematical
models used, interpretations made, and solutions proposed for a
complex problem.
E. Analyze the adequacy of and make improvements to an existing model
or develop a mathematical model of a real phenomenon.
2, 3,
4
Page 275
Smarter Balanced 2014-15 and 2015-16 Interim Assessment Technical Report
Appendix B: Test Blueprints
B-158
Grade 5 – Number and Operations – Fractions (15 items)
Claim Content
Category Assessment Targets DOK
Number
of
Items
Total Items
per
Reporting
Category
C. State logical assumptions being used.
F. Identify important quantities in a practical situation and map their
relationships (e.g., using diagrams, two-way tables, graphs, flow charts,
or formulas).
1, 2,
3
G. Identify, analyze, and synthesize relevant external resources to pose or
solve problems. 3, 4
3. Communicating
Reasoning
Communicating
Reasoning
A. Test propositions or conjectures with specific examples.
D. Use the technique of breaking an argument into cases. 2, 3
2 2
B. Construct, autonomously, chains of reasoning that will justify or refute
propositions or conjectures.
E. Distinguish correct logic or reasoning from that which is flawed, and—if
there is a flaw in the argument—explain what it is.
2, 3,
4
C. State logical assumptions being used.
F. Base arguments on concrete referents such as objects, drawings,
diagrams, and actions.
2, 3
Page 276
Smarter Balanced 2014-15 and 2015-16 Interim Assessment Technical Report
Appendix B: Test Blueprints
B-159
GRADE 5
Grade 5 – Measurement and Data (14 items)
Claim Content
Category Assessment Targets DOK
Number
of
Items
Total Items
per
Reporting
Category
1. Concepts and
Procedures MD
G. Convert like measurement units within a given measurement system. 1 1
9 H. Represent and interpret data. 1, 2 2
I. Geometric measurement: understand concepts of volume and relate
volume to multiplication and to addition. 1, 2 6
2. Problem Solving
4. Modeling and
Data Analysis
Problem
Solving
A. Apply mathematics to solve well-posed problems arising in everyday life,
society, and the workplace. 2, 3
3
4
B. Select and use appropriate tools strategically.
C. Interpret results in the context of a situation.
D. Identify important quantities in a practical situation and map their
relationships (e.g., using diagrams, two-way tables, graphs, flow charts,
or formulas).
1, 2,
3
Modeling and
Data Analysis
A. Apply mathematics to solve problems arising in everyday life, society,
and the workplace.
D. Interpret results in the context of a situation.
2, 3 1
Page 277
Smarter Balanced 2014-15 and 2015-16 Interim Assessment Technical Report
Appendix B: Test Blueprints
B-160
Grade 5 – Measurement and Data (14 items)
Claim Content
Category Assessment Targets DOK
Number
of
Items
Total Items
per
Reporting
Category
B. Construct, autonomously, chains of reasoning to justify mathematical
models used, interpretations made, and solutions proposed for a
complex problem.
E. Analyze the adequacy of and make improvements to an existing model
or develop a mathematical model of a real phenomenon.
2, 3,
4
C. State logical assumptions being used.
F. Identify important quantities in a practical situation and map their
relationships (e.g., using diagrams, two-way tables, graphs, flow charts,
or formulas).
1, 2,
3
G. Identify, analyze, and synthesize relevant external resources to pose or
solve problems. 3, 4
3. Communicating
Reasoning
Communicating
Reasoning
A. Test propositions or conjectures with specific examples.
D. Use the technique of breaking an argument into cases. 2, 3
1 1
B. Construct, autonomously, chains of reasoning that will justify or refute
propositions or conjectures.
E. Distinguish correct logic or reasoning from that which is flawed, and—if
there is a flaw in the argument—explain what it is.
2, 3,
4
C. State logical assumptions being used. 2, 3
Page 278
Smarter Balanced 2014-15 and 2015-16 Interim Assessment Technical Report
Appendix B: Test Blueprints
B-161
Grade 5 – Measurement and Data (14 items)
Claim Content
Category Assessment Targets DOK
Number
of
Items
Total Items
per
Reporting
Category
F. Base arguments on concrete referents such as objects, drawings,
diagrams, and actions.
Page 279
Smarter Balanced 2014-15 and 2015-16 Interim Assessment Technical Report
Appendix B: Test Blueprints
B-162
GRADE 5
Grade 5 – Geometry (13 items)
Claim Content
Category Assessment Targets DOK
Number
of
Items
Total Items
per
Reporting
Category
1. Concepts and
Procedures G
J. Graph points on the coordinate plane to solve real-world and
mathematical problems. 1 5
9
K. Classify two-dimensional figures into categories based on their
properties. 2 4
2. Problem Solving
4. Modeling and
Data Analysis
Problem
Solving
A. Apply mathematics to solve well-posed problems arising in everyday life,
society, and the workplace. 2, 3
1
2
B. Select and use appropriate tools strategically.
C. Interpret results in the context of a situation.
D. Identify important quantities in a practical situation and map their
relationships (e.g., using diagrams, two-way tables, graphs, flow charts,
or formulas).
1, 2,
3
Modeling and
Data Analysis
A. Apply mathematics to solve problems arising in everyday life, society,
and the workplace.
D. Interpret results in the context of a situation.
2, 3
1
B. Construct, autonomously, chains of reasoning to justify mathematical
models used, interpretations made, and solutions proposed for a
complex problem.
2, 3,
4
Page 280
Smarter Balanced 2014-15 and 2015-16 Interim Assessment Technical Report
Appendix B: Test Blueprints
B-163
Grade 5 – Geometry (13 items)
Claim Content
Category Assessment Targets DOK
Number
of
Items
Total Items
per
Reporting
Category
E. Analyze the adequacy of and make improvements to an existing model
or develop a mathematical model of a real phenomenon.
C. State logical assumptions being used.
F. Identify important quantities in a practical situation and map their
relationships (e.g., using diagrams, two-way tables, graphs, flow charts,
or formulas).
1, 2,
3
G. Identify, analyze, and synthesize relevant external resources to pose or
solve problems. 3, 4
3. Communicating
Reasoning
Communicating
Reasoning
A. Test propositions or conjectures with specific examples.
D. Use the technique of breaking an argument into cases. 2, 3
2 2
B. Construct, autonomously, chains of reasoning that will justify or refute
propositions or conjectures.
E. Distinguish correct logic or reasoning from that which is flawed, and—if
there is a flaw in the argument—explain what it is.
2, 3,
4
C. State logical assumptions being used.
F. Base arguments on concrete referents such as objects, drawings,
diagrams, and actions.
2, 3
Page 281
Smarter Balanced 2014-15 and 2015-16 Interim Assessment Technical Report
Appendix B: Test Blueprints
B-164
GRADE 5
Grade 5 – Operations and Algebraic Thinking (15 items)
Claim Content
Category Assessment Targets DOK
Number
of
Items
Total Items
per
Reporting
Category
1. Concepts and
Procedures OA
A. Write and interpret numerical expressions. 1 9
13
B. Analyze patterns and relationships. 2 4
2. Problem Solving
4. Modeling and
Data Analysis
Problem
Solving
A. Apply mathematics to solve well-posed problems arising in everyday life,
society, and the workplace. 2, 3
1
2
B. Select and use appropriate tools strategically.
C. Interpret results in the context of a situation.
D. Identify important quantities in a practical situation and map their
relationships (e.g., using diagrams, two-way tables, graphs, flow charts,
or formulas).
1, 2,
3
Modeling and
Data Analysis
A. Apply mathematics to solve problems arising in everyday life, society,
and the workplace.
D. Interpret results in the context of a situation.
2, 3
1 B. Construct, autonomously, chains of reasoning to justify mathematical
models used, interpretations made, and solutions proposed for a
complex problem.
E. Analyze the adequacy of and make improvements to an existing model
or develop a mathematical model of a real phenomenon.
2, 3,
4
Page 282
Smarter Balanced 2014-15 and 2015-16 Interim Assessment Technical Report
Appendix B: Test Blueprints
B-165
Grade 5 – Operations and Algebraic Thinking (15 items)
Claim Content
Category Assessment Targets DOK
Number
of
Items
Total Items
per
Reporting
Category
C. State logical assumptions being used.
F. Identify important quantities in a practical situation and map their
relationships (e.g., using diagrams, two-way tables, graphs, flow charts,
or formulas).
1, 2,
3
G. Identify, analyze, and synthesize relevant external resources to pose or
solve problems. 3, 4
3. Communicating
Reasoning
Communicating
Reasoning
A. Test propositions or conjectures with specific examples.
D. Use the technique of breaking an argument into cases. 2, 3
0 0
B. Construct, autonomously, chains of reasoning that will justify or refute
propositions or conjectures.
E. Distinguish correct logic or reasoning from that which is flawed, and—if
there is a flaw in the argument—explain what it is.
2, 3,
4
C. State logical assumptions being used.
F. Base arguments on concrete referents such as objects, drawings,
diagrams, and actions.
2, 3
Page 283
Smarter Balanced 2014-15 and 2015-16 Interim Assessment Technical Report
Appendix B: Test Blueprints
B-166
GRADE 5
Grade 5 – Interim Assessment Block – Performance Task
Claim Content
Category Assessment Targets DOK
Items
per
Claim
Total
Items in
PT
2. Problem Solving
4. Modeling and
Data Analysis
Problem
Solving
A. Apply mathematics to solve well-posed problems arising in everyday life,
society, and the workplace. 2, 3
2
6
B. Select and use appropriate tools strategically.
C. Interpret results in the context of a situation.
D. Identify important quantities in a practical situation and map their
relationships (e.g., using diagrams, two-way tables, graphs, flow charts,
or formulas).
1, 2, 3
Modeling and
Data Analysis
A. Apply mathematics to solve problems arising in everyday life, society,
and the workplace.
D. Interpret results in the context of a situation.
2, 3
2
B. Construct, autonomously, chains of reasoning to justify mathematical
models used, interpretations made, and solutions proposed for a
complex problem.
E. Analyze the adequacy of and make improvements to an existing model
or develop a mathematical model of a real phenomenon.
2, 3, 4
C. State logical assumptions being used.
F. Identify important quantities in a practical situation and map their
relationships (e.g., using diagrams, two-way tables, graphs, flow charts,
or formulas).
1, 2, 3
G. Identify, analyze, and synthesize relevant external resources to pose or
solve problems. 3, 4
Page 284
Smarter Balanced 2014-15 and 2015-16 Interim Assessment Technical Report
Appendix B: Test Blueprints
B-167
Grade 5 – Interim Assessment Block – Performance Task
Claim Content
Category Assessment Targets DOK
Items
per
Claim
Total
Items in
PT
3. Communicating
Reasoning
Communicating
Reasoning
A. Test propositions or conjectures with specific examples.
D. Use the technique of breaking an argument into cases. 2, 3
2
B. Construct, autonomously, chains of reasoning that will justify or refute
propositions or conjectures.
E. Distinguish correct logic or reasoning from that which is flawed, and—if
there is a flaw in the argument—explain what it is.
2, 3, 4
C. State logical assumptions being used.
F. Base arguments on concrete referents such as objects, drawings,
diagrams, and actions.
2, 3
Page 285
Smarter Balanced 2014-15 and 2015-16 Interim Assessment Technical Report
Appendix B: Test Blueprints
B-168
GRADE 6
Grade 6 – Ratio and Proportional Relationships (13 items)
Claim Content
Category Assessment Targets DOK
Number
of
Items
Total Items
per
Reporting
Category
1. Concepts and
Procedures RP A. Understand ratio concepts and use ratio reasoning to solve problems. 1, 2 11 11
2. Problem Solving
4. Modeling and Data
Analysis
Problem
Solving
A. Apply mathematics to solve well-posed problems arising in everyday life,
society, and the workplace. 2, 3
1
1
B. Select and use appropriate tools strategically.
C. Interpret results in the context of a situation.
D. Identify important quantities in a practical situation and map their
relationships (e.g., using diagrams, two-way tables, graphs, flow charts, or
formulas).
1, 2,
3
Modeling and
Data Analysis
A. Apply mathematics to solve problems arising in everyday life, society, and
the workplace.
D. Interpret results in the context of a situation.
2, 3
0 B. Construct, autonomously, chains of reasoning to justify mathematical
models used, interpretations made, and solutions proposed for a complex
problem.
E. Analyze the adequacy of and make improvements to an existing model or
develop a mathematical model of a real phenomenon.
2, 3,
4
Page 286
Smarter Balanced 2014-15 and 2015-16 Interim Assessment Technical Report
Appendix B: Test Blueprints
B-169
Grade 6 – Ratio and Proportional Relationships (13 items)
Claim Content
Category Assessment Targets DOK
Number
of
Items
Total Items
per
Reporting
Category
C. State logical assumptions being used.
F. Identify important quantities in a practical situation and map their
relationships (e.g., using diagrams, two-way tables, graphs, flow charts, or
formulas).
1, 2,
3
G. Identify, analyze, and synthesize relevant external resources to pose or
solve problems. 3, 4
3. Communicating
Reasoning
Communicating
Reasoning
A. Test propositions or conjectures with specific examples.
D. Use the technique of breaking an argument into cases. 2, 3
1 1
B. Construct, autonomously, chains of reasoning that will justify or refute
propositions or conjectures.
E. Distinguish correct logic or reasoning from that which is flawed, and—if
there is a flaw in the argument—explain what it is.
2, 3,
4
C. State logical assumptions being used.
F. Base arguments on concrete referents such as objects, drawings,
diagrams, and actions.
G. At later grades, determine conditions under which an argument does and
does not apply. (For example, area increases with perimeter for squares,
but not for all plane figures.)
2, 3
Page 287
Smarter Balanced 2014-15 and 2015-16 Interim Assessment Technical Report
Appendix B: Test Blueprints
B-170
GRADE 6
Grade 6 – Expressions and Equations (16 items)
Claim Content
Category Assessment Targets DOK
Number
of
Items
Total
Items per
Reporting
Category
1. Concepts and
Procedures EE
E. Apply and extend previous understandings of arithmetic to algebraic
expressions. 1 3
13 F. Reason about and solve one-variable equations and inequalities. 1, 2 6
G. Represent and analyze quantitative relationships between dependent and
independent variables. 2 4
2. Problem Solving
4. Modeling and
Data Analysis
Problem
Solving
A. Apply mathematics to solve well-posed problems arising in everyday life,
society, and the workplace. 2, 3
1
2
B. Select and use appropriate tools strategically.
C. Interpret results in the context of a situation.
D. Identify important quantities in a practical situation and map their
relationships (e.g., using diagrams, two-way tables, graphs, flow charts, or
formulas).
1,
2, 3
Modeling and
Data Analysis
A. Apply mathematics to solve problems arising in everyday life, society, and
the workplace.
D. Interpret results in the context of a situation.
2, 3 1
Page 288
Smarter Balanced 2014-15 and 2015-16 Interim Assessment Technical Report
Appendix B: Test Blueprints
B-171
Grade 6 – Expressions and Equations (16 items)
Claim Content
Category Assessment Targets DOK
Number
of
Items
Total
Items per
Reporting
Category
B. Construct, autonomously, chains of reasoning to justify mathematical
models used, interpretations made, and solutions proposed for a complex
problem.
E. Analyze the adequacy of and make improvements to an existing model or
develop a mathematical model of a real phenomenon.
2,
3, 4
C. State logical assumptions being used.
F. Identify important quantities in a practical situation and map their
relationships (e.g., using diagrams, two-way tables, graphs, flow charts, or
formulas).
1,
2, 3
G. Identify, analyze, and synthesize relevant external resources to pose or
solve problems. 3, 4
3. Communicating
Reasoning
Communicating
Reasoning
A. Test propositions or conjectures with specific examples.
D. Use the technique of breaking an argument into cases. 2, 3
1 1
B. Construct, autonomously, chains of reasoning that will justify or refute
propositions or conjectures.
E. Distinguish correct logic or reasoning from that which is flawed, and—if
there is a flaw in the argument—explain what it is.
2,
3, 4
C. State logical assumptions being used.
F. Base arguments on concrete referents such as objects, drawings,
diagrams, and actions.
2, 3
Page 289
Smarter Balanced 2014-15 and 2015-16 Interim Assessment Technical Report
Appendix B: Test Blueprints
B-172
Grade 6 – Expressions and Equations (16 items)
Claim Content
Category Assessment Targets DOK
Number
of
Items
Total
Items per
Reporting
Category
G. At later grades, determine conditions under which an argument does and
does not apply. (For example, area increases with perimeter for squares,
but not for all plane figures.)
Page 290
Smarter Balanced 2014-15 and 2015-16 Interim Assessment Technical Report
Appendix B: Test Blueprints
B-173
GRADE 6
Grade 6 – Geometry (14 items)
Claim Content
Category Assessment Targets DOK
Number
of
Items
Total
Items per
Reporting
Category
1. Concepts and
Procedures G
H. Solve real-world and mathematical problems involving area, surface area,
and volume. 2 11 11
2. Problem Solving
4. Modeling and
Data Analysis
Problem
Solving
A. Apply mathematics to solve well-posed problems arising in everyday life,
society, and the workplace. 2, 3
1
2
B. Select and use appropriate tools strategically.
C. Interpret results in the context of a situation.
D. Identify important quantities in a practical situation and map their
relationships (e.g., using diagrams, two-way tables, graphs, flow charts, or
formulas).
1,
2, 3
Modeling and
Data Analysis
A. Apply mathematics to solve problems arising in everyday life, society, and
the workplace.
D. Interpret results in the context of a situation.
2, 3
1
B. Construct, autonomously, chains of reasoning to justify mathematical
models used, interpretations made, and solutions proposed for a complex
problem.
E. Analyze the adequacy of and make improvements to an existing model or
develop a mathematical model of a real phenomenon.
2,
3, 4
C. State logical assumptions being used.
F. Identify important quantities in a practical situation and map their
relationships (e.g., using diagrams, two-way tables, graphs, flow charts, or
formulas).
1,
2, 3
Page 291
Smarter Balanced 2014-15 and 2015-16 Interim Assessment Technical Report
Appendix B: Test Blueprints
B-174
Grade 6 – Geometry (14 items)
Claim Content
Category Assessment Targets DOK
Number
of
Items
Total
Items per
Reporting
Category
G. Identify, analyze, and synthesize relevant external resources to pose or
solve problems. 3, 4
3. Communicating
Reasoning
Communicating
Reasoning
A. Test propositions or conjectures with specific examples.
D. Use the technique of breaking an argument into cases. 2, 3
1 1
B. Construct, autonomously, chains of reasoning that will justify or refute
propositions or conjectures.
E. Distinguish correct logic or reasoning from that which is flawed, and—if
there is a flaw in the argument—explain what it is.
2,
3, 4
C. State logical assumptions being used.
F. Base arguments on concrete referents such as objects, drawings,
diagrams, and actions.
G. At later grades, determine conditions under which an argument does and
does not apply. (For example, area increases with perimeter for squares,
but not for all plane figures.)
2, 3
Page 292
Smarter Balanced 2014-15 and 2015-16 Interim Assessment Technical Report
Appendix B: Test Blueprints
B-175
GRADE 6
Grade 6 – The Number System (15 items)
Claim Content
Category Assessment Targets DOK
Number
of
Items
Total
Items per
Reporting
Category
1. Concepts
and
Procedures
NS
B. Apply and extend previous understandings of multiplication and division to
divide fractions by fractions. 1, 2 2
13 C. Compute fluently with multi-digit numbers and find common factors and
multiples. 1, 2 5
D. Apply and extend previous understandings of numbers to the system of rational
numbers. 1, 2 6
2. Problem
Solving
4. Modeling
and Data
Analysis
Problem
Solving
A. Apply mathematics to solve well-posed problems arising in everyday life,
society, and the workplace. 2, 3
1
1
B. Select and use appropriate tools strategically.
C. Interpret results in the context of a situation.
D. Identify important quantities in a practical situation and map their relationships
(e.g., using diagrams, two-way tables, graphs, flow charts, or formulas).
1,
2, 3
Modeling and
Data Analysis
A. Apply mathematics to solve problems arising in everyday life, society, and the
workplace.
D. Interpret results in the context of a situation.
2, 3 0
Page 293
Smarter Balanced 2014-15 and 2015-16 Interim Assessment Technical Report
Appendix B: Test Blueprints
B-176
Grade 6 – The Number System (15 items)
Claim Content
Category Assessment Targets DOK
Number
of
Items
Total
Items per
Reporting
Category
B. Construct, autonomously, chains of reasoning to justify mathematical models
used, interpretations made, and solutions proposed for a complex problem.
E. Analyze the adequacy of and make improvements to an existing model or
develop a mathematical model of a real phenomenon.
2,
3, 4
C. State logical assumptions being used.
F. Identify important quantities in a practical situation and map their relationships
(e.g., using diagrams, two-way tables, graphs, flow charts, or formulas).
1,
2, 3
G. Identify, analyze, and synthesize relevant external resources to pose or solve
problems. 3, 4
3.
Communicating
Reasoning
Communicating
Reasoning
A. Test propositions or conjectures with specific examples.
D. Use the technique of breaking an argument into cases. 2, 3
1 1
B. Construct, autonomously, chains of reasoning that will justify or refute
propositions or conjectures.
E. Distinguish correct logic or reasoning from that which is flawed, and—if there is
a flaw in the argument—explain what it is.
2,
3, 4
C. State logical assumptions being used.
F. Base arguments on concrete referents such as objects, drawings, diagrams,
and actions.
G. At later grades, determine conditions under which an argument does and does
not apply. (For example, area increases with perimeter for squares, but not for
all plane figures.)
2, 3
Page 294
Smarter Balanced 2014-15 and 2015-16 Interim Assessment Technical Report
Appendix B: Test Blueprints
B-177
GRADE 6
Grade 6 – Statistics and Probability (13 items)
Claim Content
Category Assessment Targets DOK
Number
of
Items
Total
Items per
Reporting
Category
1. Concepts and
Procedures SP
I. Develop understanding of statistical variability. 2 3
13
J. Summarize and describe distributions. 1, 2 10
2. Problem Solving
4. Modeling and
Data Analysis
Problem
Solving
A. Apply mathematics to solve well-posed problems arising in everyday life,
society, and the workplace. 2, 3
0
0
B. Select and use appropriate tools strategically.
C. Interpret results in the context of a situation.
D. Identify important quantities in a practical situation and map their
relationships (e.g., using diagrams, two-way tables, graphs, flow charts, or
formulas).
1,
2, 3
Modeling and
Data Analysis
A. Apply mathematics to solve problems arising in everyday life, society, and
the workplace.
D. Interpret results in the context of a situation.
2, 3
0 B. Construct, autonomously, chains of reasoning to justify mathematical
models used, interpretations made, and solutions proposed for a complex
problem.
E. Analyze the adequacy of and make improvements to an existing model or
develop a mathematical model of a real phenomenon.
2,
3, 4
Page 295
Smarter Balanced 2014-15 and 2015-16 Interim Assessment Technical Report
Appendix B: Test Blueprints
B-178
Grade 6 – Statistics and Probability (13 items)
Claim Content
Category Assessment Targets DOK
Number
of
Items
Total
Items per
Reporting
Category
C. State logical assumptions being used.
F. Identify important quantities in a practical situation and map their
relationships (e.g., using diagrams, two-way tables, graphs, flow charts, or
formulas).
1,
2, 3
G. Identify, analyze, and synthesize relevant external resources to pose or
solve problems. 3, 4
3. Communicating
Reasoning
Communicating
Reasoning
A. Test propositions or conjectures with specific examples.
D. Use the technique of breaking an argument into cases. 2, 3
0 0
B. Construct, autonomously, chains of reasoning that will justify or refute
propositions or conjectures.
E. Distinguish correct logic or reasoning from that which is flawed, and—if
there is a flaw in the argument—explain what it is.
2,
3, 4
C. State logical assumptions being used.
F. Base arguments on concrete referents such as objects, drawings,
diagrams, and actions.
G. At later grades, determine conditions under which an argument does and
does not apply. (For example, area increases with perimeter for squares,
but not for all plane figures.)
2, 3
Page 296
Smarter Balanced 2014-15 and 2015-16 Interim Assessment Technical Report
Appendix B: Test Blueprints
B-179
GRADE 6
Grade 6 – Interim Assessment Block – Performance Task
Claim Content
Category Assessment Targets DOK
Items
per
Claim
Total
Items
in PT
2. Problem Solving
4. Modeling and
Data Analysis
Problem
Solving
A. Apply mathematics to solve well-posed problems arising in everyday life,
society, and the workplace. 2, 3
2
6
B. Select and use appropriate tools strategically.
C. Interpret results in the context of a situation.
D. Identify important quantities in a practical situation and map their
relationships (e.g., using diagrams, two-way tables, graphs, flow charts, or
formulas).
1, 2, 3
Modeling and
Data Analysis
A. Apply mathematics to solve problems arising in everyday life, society, and
the workplace.
D. Interpret results in the context of a situation.
2, 3
2
B. Construct, autonomously, chains of reasoning to justify mathematical
models used, interpretations made, and solutions proposed for a complex
problem.
E. Analyze the adequacy of and make improvements to an existing model or
develop a mathematical model of a real phenomenon.
2, 3, 4
C. State logical assumptions being used.
F. Identify important quantities in a practical situation and map their
relationships (e.g., using diagrams, two-way tables, graphs, flow charts, or
formulas).
1, 2, 3
G. Identify, analyze, and synthesize relevant external resources to pose or solve
problems. 3, 4
Page 297
Smarter Balanced 2014-15 and 2015-16 Interim Assessment Technical Report
Appendix B: Test Blueprints
B-180
Grade 6 – Interim Assessment Block – Performance Task
Claim Content
Category Assessment Targets DOK
Items
per
Claim
Total
Items
in PT
3. Communicating
Reasoning
Communicating
Reasoning
A. Test propositions or conjectures with specific examples.
D. Use the technique of breaking an argument into cases. 2, 3
2
B. Construct, autonomously, chains of reasoning that will justify or refute
propositions or conjectures.
E. Distinguish correct logic or reasoning from that which is flawed, and—if there
is a flaw in the argument—explain what it is.
2, 3, 4
C. State logical assumptions being used.
F. Base arguments on concrete referents such as objects, drawings, diagrams,
and actions.
G. At later grades, determine conditions under which an argument does and
does not apply. (For example, area increases with perimeter for squares, but
not for all plane figures.)
2, 3
Page 298
Smarter Balanced 2014-15 and 2015-16 Interim Assessment Technical Report
Appendix B: Test Blueprints
B-181
GRADE 7
Grade 7 – Ratio and Proportional Relationships (13 items)
Claim Content
Category Assessment Targets DOK
Number
of
Items
Total Items
per
Reporting
Category
1. Concepts and
Procedures RP
A. Analyze proportional relationships and use them to solve real-world and
mathematical problems. 2 10 10
2. Problem Solving
4. Modeling and
Data Analysis
Problem
Solving
A. Apply mathematics to solve well-posed problems arising in everyday life,
society, and the workplace. 2, 3
1
2
B. Select and use appropriate tools strategically.
C. Interpret results in the context of a situation.
D. Identify important quantities in a practical situation and map their
relationships (e.g., using diagrams, two-way tables, graphs, flow charts, or
formulas).
1, 2,
3
Modeling and
Data Analysis
A. Apply mathematics to solve problems arising in everyday life, society, and
the workplace.
D. Interpret results in the context of a situation.
2, 3
1 B. Construct, autonomously, chains of reasoning to justify mathematical
models used, interpretations made, and solutions proposed for a complex
problem.
E. Analyze the adequacy of and make improvements to an existing model or
develop a mathematical model of a real phenomenon.
2, 3,
4
Page 299
Smarter Balanced 2014-15 and 2015-16 Interim Assessment Technical Report
Appendix B: Test Blueprints
B-182
Grade 7 – Ratio and Proportional Relationships (13 items)
Claim Content
Category Assessment Targets DOK
Number
of
Items
Total Items
per
Reporting
Category
C. State logical assumptions being used.
F. Identify important quantities in a practical situation and map their
relationships (e.g., using diagrams, two-way tables, graphs, flow charts, or
formulas).
1, 2,
3
G. Identify, analyze, and synthesize relevant external resources to pose or
solve problems. 3, 4
3. Communicating
Reasoning
Communicating
Reasoning
A. Test propositions or conjectures with specific examples.
D. Use the technique of breaking an argument into cases. 2, 3
1 1
B. Construct, autonomously, chains of reasoning that will justify or refute
propositions or conjectures.
E. Distinguish correct logic or reasoning from that which is flawed, and—if
there is a flaw in the argument—explain what it is.
2, 3,
4
C. State logical assumptions being used.
F. Base arguments on concrete referents such as objects, drawings,
diagrams, and actions.
G. At later grades, determine conditions under which an argument does and
does not apply. (For example, area increases with perimeter for squares,
but not for all plane figures.)
2, 3
Page 300
Smarter Balanced 2014-15 and 2015-16 Interim Assessment Technical Report
Appendix B: Test Blueprints
B-183
GRADE 7
Grade 7 – The Number System (14 items)
Claim Content Category Assessment Targets DOK
Number
of
Items
Total
Items per
Reporting
Category
1. Concepts and
Procedures NS
B. Apply and extend previous understandings of operations with fractions to
add, subtract, multiply, and divide rational numbers. 1, 2 11 11
2. Problem Solving
4. Modeling and
Data Analysis
Problem Solving
A. Apply mathematics to solve well-posed problems arising in everyday life,
society, and the workplace. 2, 3
0
1
B. Select and use appropriate tools strategically.
C. Interpret results in the context of a situation.
D. Identify important quantities in a practical situation and map their
relationships (e.g., using diagrams, two-way tables, graphs, flow charts, or
formulas).
1, 2,
3
Modeling and
Data Analysis
A. Apply mathematics to solve problems arising in everyday life, society, and
the workplace.
D. Interpret results in the context of a situation.
2, 3
1 B. Construct, autonomously, chains of reasoning to justify mathematical
models used, interpretations made, and solutions proposed for a complex
problem.
E. Analyze the adequacy of and make improvements to an existing model or
develop a mathematical model of a real phenomenon.
2, 3,
4
Page 301
Smarter Balanced 2014-15 and 2015-16 Interim Assessment Technical Report
Appendix B: Test Blueprints
B-184
Grade 7 – The Number System (14 items)
Claim Content Category Assessment Targets DOK
Number
of
Items
Total
Items per
Reporting
Category
C. State logical assumptions being used.
F. Identify important quantities in a practical situation and map their
relationships (e.g., using diagrams, two-way tables, graphs, flow charts, or
formulas).
1, 2,
3
G. Identify, analyze, and synthesize relevant external resources to pose or
solve problems. 3, 4
3. Communicating
Reasoning
Communicating
Reasoning
A. Test propositions or conjectures with specific examples.
D. Use the technique of breaking an argument into cases. 2, 3
2 2
B. Construct, autonomously, chains of reasoning that will justify or refute
propositions or conjectures.
E. Distinguish correct logic or reasoning from that which is flawed, and—if
there is a flaw in the argument—explain what it is.
2, 3,
4
C. State logical assumptions being used.
F. Base arguments on concrete referents such as objects, drawings,
diagrams, and actions.
G. At later grades, determine conditions under which an argument does and
does not apply. (For example, area increases with perimeter for squares,
but not for all plane figures.)
2, 3
Page 302
Smarter Balanced 2014-15 and 2015-16 Interim Assessment Technical Report
Appendix B: Test Blueprints
B-185
GRADE 7
Grade 7 – Expressions and Equations (15 items)
Claim Content Category Assessment Targets DOK
Number
of
Items
Total
Items per
Reporting
Category
1. Concepts and
Procedures EE
C. Use properties of operations to generate equivalent expressions. 1, 2 5
12
D. Solve real-life and mathematical problems using numerical and algebraic
expressions and equations. 1, 2 7
2. Problem Solving
4. Modeling and
Data Analysis
Problem Solving
A. Apply mathematics to solve well-posed problems arising in everyday life,
society, and the workplace. 2, 3
1
2
B. Select and use appropriate tools strategically.
C. Interpret results in the context of a situation.
D. Identify important quantities in a practical situation and map their
relationships (e.g., using diagrams, two-way tables, graphs, flow charts, or
formulas).
1, 2,
3
Modeling and
Data Analysis
A. Apply mathematics to solve problems arising in everyday life, society, and
the workplace.
D. Interpret results in the context of a situation.
2, 3
1 B. Construct, autonomously, chains of reasoning to justify mathematical
models used, interpretations made, and solutions proposed for a complex
problem.
E. Analyze the adequacy of and make improvements to an existing model or
develop a mathematical model of a real phenomenon.
2, 3,
4
Page 303
Smarter Balanced 2014-15 and 2015-16 Interim Assessment Technical Report
Appendix B: Test Blueprints
B-186
Grade 7 – Expressions and Equations (15 items)
Claim Content Category Assessment Targets DOK
Number
of
Items
Total
Items per
Reporting
Category
C. State logical assumptions being used.
F. Identify important quantities in a practical situation and map their
relationships (e.g., using diagrams, two-way tables, graphs, flow charts, or
formulas).
1, 2,
3
G. Identify, analyze, and synthesize relevant external resources to pose or
solve problems. 3, 4
3. Communicating
Reasoning
Communicating
Reasoning
A. Test propositions or conjectures with specific examples.
D. Use the technique of breaking an argument into cases. 2, 3
1 1
B. Construct, autonomously, chains of reasoning that will justify or refute
propositions or conjectures.
E. Distinguish correct logic or reasoning from that which is flawed, and—if
there is a flaw in the argument—explain what it is.
2, 3,
4
C. State logical assumptions being used.
F. Base arguments on concrete referents such as objects, drawings,
diagrams, and actions.
G. At later grades, determine conditions under which an argument does and
does not apply. (For example, area increases with perimeter for squares,
but not for all plane figures.)
2, 3
Page 304
Smarter Balanced 2014-15 and 2015-16 Interim Assessment Technical Report
Appendix B: Test Blueprints
B-187
GRADE 7
Grade 7 – Geometry (13 items)
Claim Content Category Assessment Targets DOK
Number
of
Items
Total
Items per
Reporting
Category
1. Concepts and
Procedures G
E. Draw, construct, and describe geometrical figures and describe the
relationship between them. 1, 2 5
11
F. Solve real-life and mathematical problems involving angle measure, area,
surface area, and volume. 1, 2 6
2. Problem Solving
4. Modeling and
Data Analysis
Problem Solving
A. Apply mathematics to solve well-posed problems arising in everyday life,
society, and the workplace. 2, 3
2
2
B. Select and use appropriate tools strategically.
C. Interpret results in the context of a situation.
D. Identify important quantities in a practical situation and map their
relationships (e.g., using diagrams, two-way tables, graphs, flow charts, or
formulas).
1, 2,
3
Modeling and
Data Analysis
A. Apply mathematics to solve problems arising in everyday life, society, and
the workplace.
D. Interpret results in the context of a situation.
2, 3
0 B. Construct, autonomously, chains of reasoning to justify mathematical
models used, interpretations made, and solutions proposed for a complex
problem.
E. Analyze the adequacy of and make improvements to an existing model or
develop a mathematical model of a real phenomenon.
2, 3,
4
Page 305
Smarter Balanced 2014-15 and 2015-16 Interim Assessment Technical Report
Appendix B: Test Blueprints
B-188
Grade 7 – Geometry (13 items)
Claim Content Category Assessment Targets DOK
Number
of
Items
Total
Items per
Reporting
Category
C. State logical assumptions being used.
F. Identify important quantities in a practical situation and map their
relationships (e.g., using diagrams, two-way tables, graphs, flow charts, or
formulas).
1, 2,
3
G. Identify, analyze, and synthesize relevant external resources to pose or
solve problems. 3, 4
3. Communicating
Reasoning
Communicating
Reasoning
A. Test propositions or conjectures with specific examples.
D. Use the technique of breaking an argument into cases. 2, 3
0 0
B. Construct, autonomously, chains of reasoning that will justify or refute
propositions or conjectures.
E. Distinguish correct logic or reasoning from that which is flawed, and—if
there is a flaw in the argument—explain what it is.
2, 3,
4
C. State logical assumptions being used.
F. Base arguments on concrete referents such as objects, drawings,
diagrams, and actions.
G. At later grades, determine conditions under which an argument does and
does not apply. (For example, area increases with perimeter for squares,
but not for all plane figures.)
2, 3
Page 306
Smarter Balanced 2014-15 and 2015-16 Interim Assessment Technical Report
Appendix B: Test Blueprints
B-189
GRADE 7
Grade 7 – Statistics and Probability (15 items)
Claim Content
Category Assessment Targets DOK
Number
of
Items
Total
Items per
Reporting
Category
1. Concepts and
Procedures SP
G. Use random sampling to draw inferences about a population. 1, 2 3
13 H. Draw informal comparative inferences about two populations. 2 4
I. Investigate chance processes and develop, use, and evaluate probability
models. 1, 2 6
2. Problem Solving
4. Modeling and
Data Analysis
Problem
Solving
A. Apply mathematics to solve well-posed problems arising in everyday life,
society, and the workplace. 2, 3
0
2
B. Select and use appropriate tools strategically.
C. Interpret results in the context of a situation.
D. Identify important quantities in a practical situation and map their
relationships (e.g., using diagrams, two-way tables, graphs, flow charts, or
formulas).
1, 2,
3
Modeling and
Data Analysis
A. Apply mathematics to solve problems arising in everyday life, society, and
the workplace.
D. Interpret results in the context of a situation.
2, 3
2 B. Construct, autonomously, chains of reasoning to justify mathematical
models used, interpretations made, and solutions proposed for a complex
problem.
E. Analyze the adequacy of and make improvements to an existing model or
develop a mathematical model of a real phenomenon.
2, 3,
4
Page 307
Smarter Balanced 2014-15 and 2015-16 Interim Assessment Technical Report
Appendix B: Test Blueprints
B-190
Grade 7 – Statistics and Probability (15 items)
Claim Content
Category Assessment Targets DOK
Number
of
Items
Total
Items per
Reporting
Category
C. State logical assumptions being used.
F. Identify important quantities in a practical situation and map their
relationships (e.g., using diagrams, two-way tables, graphs, flow charts, or
formulas).
1, 2,
3
G. Identify, analyze, and synthesize relevant external resources to pose or
solve problems. 3, 4
3. Communicating
Reasoning
Communicating
Reasoning
A. Test propositions or conjectures with specific examples.
D. Use the technique of breaking an argument into cases. 2, 3
0 0
B. Construct, autonomously, chains of reasoning that will justify or refute
propositions or conjectures.
E. Distinguish correct logic or reasoning from that which is flawed, and—if
there is a flaw in the argument—explain what it is.
2, 3,
4
C. State logical assumptions being used.
F. Base arguments on concrete referents such as objects, drawings,
diagrams, and actions.
G. At later grades, determine conditions under which an argument does and
does not apply. (For example, area increases with perimeter for squares,
but not for all plane figures.)
2, 3
GRADE 7
Page 308
Smarter Balanced 2014-15 and 2015-16 Interim Assessment Technical Report
Appendix B: Test Blueprints
B-191
Grade 7 – Interim Assessment Block – Performance Task
Claim Content
Category Assessment Targets DOK
Items
per
Claim
Total
Items in
PT
2. Problem Solving
4. Modeling and
Data Analysis
Problem
Solving
A. Apply mathematics to solve well-posed problems arising in everyday life,
society, and the workplace. 2, 3
2
6
B. Select and use appropriate tools strategically.
C. Interpret results in the context of a situation.
D. Identify important quantities in a practical situation and map their
relationships (e.g., using diagrams, two-way tables, graphs, flow charts, or
formulas).
1, 2, 3
Modeling and
Data Analysis
A. Apply mathematics to solve problems arising in everyday life, society, and
the workplace.
D. Interpret results in the context of a situation.
2, 3
2
B. Construct, autonomously, chains of reasoning to justify mathematical
models used, interpretations made, and solutions proposed for a complex
problem.
E. Analyze the adequacy of and make improvements to an existing model or
develop a mathematical model of a real phenomenon.
2, 3, 4
C. State logical assumptions being used.
F. Identify important quantities in a practical situation and map their
relationships (e.g., using diagrams, two-way tables, graphs, flow charts, or
formulas).
1, 2, 3
G. Identify, analyze, and synthesize relevant external resources to pose or solve
problems. 3, 4
Page 309
Smarter Balanced 2014-15 and 2015-16 Interim Assessment Technical Report
Appendix B: Test Blueprints
B-192
Grade 7 – Interim Assessment Block – Performance Task
Claim Content
Category Assessment Targets DOK
Items
per
Claim
Total
Items in
PT
3. Communicating
Reasoning
Communicating
Reasoning
A. Test propositions or conjectures with specific examples.
D. Use the technique of breaking an argument into cases. 2, 3
2
B. Construct, autonomously, chains of reasoning that will justify or refute
propositions or conjectures.
E. Distinguish correct logic or reasoning from that which is flawed, and—if there
is a flaw in the argument—explain what it is.
2, 3, 4
C. State logical assumptions being used.
F. Base arguments on concrete referents such as objects, drawings, diagrams,
and actions.
G. At later grades, determine conditions under which an argument does and
does not apply. (For example, area increases with perimeter for squares, but
not for all plane figures.)
2, 3
Page 310
Smarter Balanced 2014-15 and 2015-16 Interim Assessment Technical Report
Appendix B: Test Blueprints
B-193
GRADE 8
Grade 8 – Expressions & Equations I (14 items)
Claim Content Category Assessment Targets DOK
Number
of
Items
Total
Items per
Reporting
Category
1. Concepts and
Procedures EE
B. Work with radicals and integer exponents. 1, 2 3
9 C. Understand the connections between proportional relationships, lines,
and linear equations. 1, 2 2
D. Analyze and solve linear equations and pairs of simultaneous linear
equations. 1, 2 4
2. Problem Solving
4. Modeling and
Data Analysis
Problem Solving
A. Apply mathematics to solve well-posed problems arising in everyday life,
society, and the workplace. 2, 3
3
3
B. Select and use appropriate tools strategically.
C. Interpret results in the context of a situation.
D. Identify important quantities in a practical situation and map their
relationships (e.g., using diagrams, two-way tables, graphs, flow charts, or
formulas).
1, 2,
3
Modeling and
Data Analysis
A. Apply mathematics to solve problems arising in everyday life, society, and
the workplace.
D. Interpret results in the context of a situation.
2, 3
0 B. Construct, autonomously, chains of reasoning to justify mathematical
models used, interpretations made, and solutions proposed for a complex
problem.
E. Analyze the adequacy of and make improvements to an existing model or
develop a mathematical model of a real phenomenon.
2, 3,
4
Page 311
Smarter Balanced 2014-15 and 2015-16 Interim Assessment Technical Report
Appendix B: Test Blueprints
B-194
Grade 8 – Expressions & Equations I (14 items)
Claim Content Category Assessment Targets DOK
Number
of
Items
Total
Items per
Reporting
Category
C. State logical assumptions being used.
F. Identify important quantities in a practical situation and map their
relationships (e.g., using diagrams, two-way tables, graphs, flow charts, or
formulas).
1, 2,
3
G. Identify, analyze, and synthesize relevant external resources to pose or
solve problems. 3, 4
3. Communicating
Reasoning
Communicating
Reasoning
A. Test propositions or conjectures with specific examples.
D. Use the technique of breaking an argument into cases. 2, 3
2 2
B. Construct, autonomously, chains of reasoning that will justify or refute
propositions or conjectures.
E. Distinguish correct logic or reasoning from that which is flawed, and—if
there is a flaw in the argument—explain what it is.
2, 3,
4
C. State logical assumptions being used.
F. Base arguments on concrete referents such as objects, drawings,
diagrams, and actions.
G. At later grades, determine conditions under which an argument does and
does not apply. (For example, area increases with perimeter for squares,
but not for all plane figures.)
2, 3
Page 312
Smarter Balanced 2014-15 and 2015-16 Interim Assessment Technical Report
Appendix B: Test Blueprints
B-195
GRADE 8
Grade 8 – Expressions & Equations II with Statistics (13 items)
Claim Content Category Assessment Targets DOK
Number
of
Items
Total
Items per
Reporting
Category
1. Concepts and
Procedures
EE
SP
D. Analyze and solve linear equations and pairs of simultaneous linear
equations. 1, 2 5
10
J. Investigate patterns of association in bivariate data. 1, 2 5
2. Problem Solving
4. Modeling and
Data Analysis
Problem Solving
A. Apply mathematics to solve well-posed problems arising in everyday life,
society, and the workplace. 2, 3
1
2
B. Select and use appropriate tools strategically.
C. Interpret results in the context of a situation.
D. Identify important quantities in a practical situation and map their
relationships (e.g., using diagrams, two-way tables, graphs, flow charts, or
formulas).
1, 2,
3
Modeling and Data
Analysis
A. Apply mathematics to solve problems arising in everyday life, society, and
the workplace.
D. Interpret results in the context of a situation.
2, 3
1 B. Construct, autonomously, chains of reasoning to justify mathematical
models used, interpretations made, and solutions proposed for a complex
problem.
E. Analyze the adequacy of and make improvements to an existing model or
develop a mathematical model of a real phenomenon.
2, 3,
4
Page 313
Smarter Balanced 2014-15 and 2015-16 Interim Assessment Technical Report
Appendix B: Test Blueprints
B-196
Grade 8 – Expressions & Equations II with Statistics (13 items)
Claim Content Category Assessment Targets DOK
Number
of
Items
Total
Items per
Reporting
Category
C. State logical assumptions being used.
F. Identify important quantities in a practical situation and map their
relationships (e.g., using diagrams, two-way tables, graphs, flow charts, or
formulas).
1, 2,
3
G. Identify, analyze, and synthesize relevant external resources to pose or
solve problems. 3, 4
3. Communicating
Reasoning
Communicating
Reasoning
A. Test propositions or conjectures with specific examples.
D. Use the technique of breaking an argument into cases. 2, 3
1 1
B. Construct, autonomously, chains of reasoning that will justify or refute
propositions or conjectures.
E. Distinguish correct logic or reasoning from that which is flawed, and—if
there is a flaw in the argument—explain what it is.
2, 3,
4
C. State logical assumptions being used.
F. Base arguments on concrete referents such as objects, drawings,
diagrams, and actions.
G. At later grades, determine conditions under which an argument does and
does not apply. (For example, area increases with perimeter for squares,
but not for all plane figures.)
2, 3
Page 314
Smarter Balanced 2014-15 and 2015-16 Interim Assessment Technical Report
Appendix B: Test Blueprints
B-197
GRADE 8
Grade 8 – Functions (15 items)
Claim Content Category Assessment Targets DOK
Number
of
Items
Total
Items per
Reporting
Category
1. Concepts and
Procedures F
E. Define, evaluate, and compare functions. 1, 2 6
11
F. Use functions to model relationships between quantities. 1, 2 5
2. Problem Solving
4. Modeling and
Data Analysis
Problem Solving
A. Apply mathematics to solve well-posed problems arising in everyday life,
society, and the workplace. 2, 3
1
2
B. Select and use appropriate tools strategically.
C. Interpret results in the context of a situation.
D. Identify important quantities in a practical situation and map their
relationships (e.g., using diagrams, two-way tables, graphs, flow charts, or
formulas).
1,
2, 3
Modeling and
Data Analysis
A. Apply mathematics to solve problems arising in everyday life, society, and
the workplace.
D. Interpret results in the context of a situation.
2, 3
1 B. Construct, autonomously, chains of reasoning to justify mathematical
models used, interpretations made, and solutions proposed for a complex
problem.
E. Analyze the adequacy of and make improvements to an existing model or
develop a mathematical model of a real phenomenon.
2,
3, 4
Page 315
Smarter Balanced 2014-15 and 2015-16 Interim Assessment Technical Report
Appendix B: Test Blueprints
B-198
Grade 8 – Functions (15 items)
Claim Content Category Assessment Targets DOK
Number
of
Items
Total
Items per
Reporting
Category
C. State logical assumptions being used.
F. Identify important quantities in a practical situation and map their
relationships (e.g., using diagrams, two-way tables, graphs, flow charts, or
formulas).
1,
2, 3
G. Identify, analyze, and synthesize relevant external resources to pose or
solve problems. 3, 4
3. Communicating
Reasoning
Communicating
Reasoning
A. Test propositions or conjectures with specific examples.
D. Use the technique of breaking an argument into cases. 2, 3
2 2
B. Construct, autonomously, chains of reasoning that will justify or refute
propositions or conjectures.
E. Distinguish correct logic or reasoning from that which is flawed, and—if
there is a flaw in the argument—explain what it is.
2,
3, 4
C. State logical assumptions being used.
F. Base arguments on concrete referents such as objects, drawings,
diagrams, and actions.
G. At later grades, determine conditions under which an argument does and
does not apply. (For example, area increases with perimeter for squares,
but not for all plane figures.)
2, 3
Page 316
Smarter Balanced 2014-15 and 2015-16 Interim Assessment Technical Report
Appendix B: Test Blueprints
B-199
GRADE 8
Grade 8 – Geometry (15 items)
Claim Content Category Assessment Targets DOK
Number
of
Items
Total
Items per
Reporting
Category
1. Concepts and
Procedures G
G. Understand congruence and similarity using physical models,
transparencies, or geometry software. 1, 2 5
13 H. Understand congruence and similarity using physical models,
transparencies, or geometry software. 1, 2 5
I. Solve real-world and mathematical problems involving volume of
cylinders, cones, and spheres. 1, 2 3
2. Problem Solving
4. Modeling and
Data Analysis
Problem Solving
A. Apply mathematics to solve well-posed problems arising in everyday life,
society, and the workplace. 2, 3
0
1
B. Select and use appropriate tools strategically.
C. Interpret results in the context of a situation.
D. Identify important quantities in a practical situation and map their
relationships (e.g., using diagrams, two-way tables, graphs, flow charts, or
formulas).
1,
2, 3
Modeling and
Data Analysis
A. Apply mathematics to solve problems arising in everyday life, society, and
the workplace.
D. Interpret results in the context of a situation.
2, 3
1
B. Construct, autonomously, chains of reasoning to justify mathematical
models used, interpretations made, and solutions proposed for a complex
problem.
2,
3, 4
Page 317
Smarter Balanced 2014-15 and 2015-16 Interim Assessment Technical Report
Appendix B: Test Blueprints
B-200
Grade 8 – Geometry (15 items)
Claim Content Category Assessment Targets DOK
Number
of
Items
Total
Items per
Reporting
Category
E. Analyze the adequacy of and make improvements to an existing model or
develop a mathematical model of a real phenomenon.
C. State logical assumptions being used.
F. Identify important quantities in a practical situation and map their
relationships (e.g., using diagrams, two-way tables, graphs, flow charts, or
formulas).
1,
2, 3
G. Identify, analyze, and synthesize relevant external resources to pose or
solve problems. 3, 4
3. Communicating
Reasoning
Communicating
Reasoning
A. Test propositions or conjectures with specific examples.
D. Use the technique of breaking an argument into cases. 2, 3
1 1
B. Construct, autonomously, chains of reasoning that will justify or refute
propositions or conjectures.
E. Distinguish correct logic or reasoning from that which is flawed, and—if
there is a flaw in the argument—explain what it is.
2,
3, 4
C. State logical assumptions being used.
F. Base arguments on concrete referents such as objects, drawings,
diagrams, and actions.
G. At later grades, determine conditions under which an argument does and
does not apply. (For example, area increases with perimeter for squares,
but not for all plane figures.)
2, 3
Page 318
Smarter Balanced 2014-15 and 2015-16 Interim Assessment Technical Report
Appendix B: Test Blueprints
B-201
GRADE 8
Grade 8 – Interim Assessment Block – Performance Task
Claim Content Category Assessment Targets DOK
Items
per
Claim
Total
Items
in PT
2. Problem Solving
4. Modeling and
Data Analysis
Problem Solving
A. Apply mathematics to solve well-posed problems arising in everyday life,
society, and the workplace. 2, 3
2
6
B. Select and use appropriate tools strategically.
C. Interpret results in the context of a situation.
D. Identify important quantities in a practical situation and map their
relationships (e.g., using diagrams, two-way tables, graphs, flow charts, or
formulas).
1, 2, 3
Modeling and
Data Analysis
A. Apply mathematics to solve problems arising in everyday life, society, and the
workplace.
D. Interpret results in the context of a situation.
2, 3
2
B. Construct, autonomously, chains of reasoning to justify mathematical models
used, interpretations made, and solutions proposed for a complex problem.
E. Analyze the adequacy of and make improvements to an existing model or
develop a mathematical model of a real phenomenon.
2, 3, 4
C. State logical assumptions being used.
F. Identify important quantities in a practical situation and map their
relationships (e.g., using diagrams, two-way tables, graphs, flow charts, or
formulas).
1, 2, 3
G. Identify, analyze, and synthesize relevant external resources to pose or solve
problems. 3, 4
Page 319
Smarter Balanced 2014-15 and 2015-16 Interim Assessment Technical Report
Appendix B: Test Blueprints
B-202
Grade 8 – Interim Assessment Block – Performance Task
Claim Content Category Assessment Targets DOK
Items
per
Claim
Total
Items
in PT
3. Communicating
Reasoning
Communicating
Reasoning
A. Test propositions or conjectures with specific examples.
D. Use the technique of breaking an argument into cases. 2, 3
2
B. Construct, autonomously, chains of reasoning that will justify or refute
propositions or conjectures.
E. Distinguish correct logic or reasoning from that which is flawed, and—if there
is a flaw in the argument—explain what it is.
2, 3, 4
C. State logical assumptions being used.
F. Base arguments on concrete referents such as objects, drawings, diagrams,
and actions.
G. At later grades, determine conditions under which an argument does and
does not apply. (For example, area increases with perimeter for squares, but
not for all plane figures.)
2, 3
Page 320
Smarter Balanced 2014-15 and 2015-16 Interim Assessment Technical Report
Appendix B: Test Blueprints
B-203
High School
High School – Algebra and Functions I – Linear Functions, Equations, and Inequalities (15 items)
Claim Content Category Assessment Targets DOK
Number
of
Items
Total Items
per Reporting
Category
1. Concepts and
Procedures A, F
G. Create equations that describe numbers or relationships. 1, 2 1
11
I. Solve equations and inequalities in one variable. 1, 2 3
J. Represent and solve equations and inequalities graphically. 1, 2 4
L. Interpret functions that arise in applications in terms of a context. 1, 2 1
M. Analyze functions using different representations. 1, 2,
3 1
N. Build a function that models a relationship between two quantities. 2 1
2. Problem Solving
4. Modeling and Data
Analysis
Problem Solving
A. Apply mathematics to solve well-posed problems arising in everyday
life, society, and the workplace. 2, 3
2 3 B. Select and use appropriate tools strategically.
C. Interpret results in the context of a situation.
D. Identify important quantities in a practical situation and map their
relationships (e.g., using diagrams, two-way tables, graphs, flow charts,
or formulas).
1, 2,
3
Page 321
Smarter Balanced 2014-15 and 2015-16 Interim Assessment Technical Report
Appendix B: Test Blueprints
B-204
High School – Algebra and Functions I – Linear Functions, Equations, and Inequalities (15 items)
Claim Content Category Assessment Targets DOK
Number
of
Items
Total Items
per Reporting
Category
Modeling and
Data Analysis
A. Apply mathematics to solve problems arising in everyday life, society,
and the workplace.
D. Interpret results in the context of a situation.
2, 3
1
B. Construct, autonomously, chains of reasoning to justify mathematical
models used, interpretations made, and solutions proposed for a
complex problem.
E. Analyze the adequacy of and make improvements to an existing model
or develop a mathematical model of a real phenomenon.
2, 3,
4
C. State logical assumptions being used.
F. Identify important quantities in a practical situation and map their
relationships (e.g., using diagrams, two-way tables, graphs, flow charts,
or formulas).
1, 2,
3
G. Identify, analyze, and synthesize relevant external resources to pose
or solve problems. 3, 4
3. Communicating
Reasoning
Communicating
Reasoning
A. Test propositions or conjectures with specific examples.
D. Use the technique of breaking an argument into cases. 2, 3
1 1
B. Construct, autonomously, chains of reasoning that will justify or refute
propositions or conjectures.
E. Distinguish correct logic or reasoning from that which is flawed, and—if
there is a flaw in the argument—explain what it is.
2, 3,
4
C. State logical assumptions being used. 2, 3
Page 322
Smarter Balanced 2014-15 and 2015-16 Interim Assessment Technical Report
Appendix B: Test Blueprints
B-205
High School – Algebra and Functions I – Linear Functions, Equations, and Inequalities (15 items)
Claim Content Category Assessment Targets DOK
Number
of
Items
Total Items
per Reporting
Category
F. Base arguments on concrete referents such as objects, drawings,
diagrams, and actions.
G. At later grades, determine conditions under which an argument does
and does not apply.
High School
High School – Algebra and Functions II – Quadratic Functions, Equations, and Inequalities (15 items)
Claim Content
Category Assessment Targets DOK
Number
of
Items
Total Items
per
Reporting
Category
1. Concepts and
Procedures A, F
G. Create equations that describe numbers or relationships. 1, 2 1
12
H. Understand solving equations as a process of reasoning and explain the
reasoning. 1, 2 3
I. Solve equations and inequalities in one variable. 1, 2 1
J. Represent and solve equations and inequalities graphically. 1, 2 3
Page 323
Smarter Balanced 2014-15 and 2015-16 Interim Assessment Technical Report
Appendix B: Test Blueprints
B-206
High School – Algebra and Functions II – Quadratic Functions, Equations, and Inequalities (15 items)
Claim Content
Category Assessment Targets DOK
Number
of
Items
Total Items
per
Reporting
Category
L. Interpret functions that arise in applications in terms of a context. 1, 2 1
M. Analyze functions using different representations. 1, 2, 3 2
N. Build a function that models a relationship between two quantities. 2 1
2. Problem Solving
4. Modeling and
Data Analysis
Problem
Solving
A. Apply mathematics to solve well-posed problems arising in everyday life,
society, and the workplace. 2, 3
0
2
B. Select and use appropriate tools strategically.
C. Interpret results in the context of a situation.
D. Identify important quantities in a practical situation and map their
relationships (e.g., using diagrams, two-way tables, graphs, flow charts, or
formulas).
1, 2, 3
Modeling and
Data Analysis
A. Apply mathematics to solve problems arising in everyday life, society, and
the workplace.
D. Interpret results in the context of a situation.
2, 3
2 B. Construct, autonomously, chains of reasoning to justify mathematical
models used, interpretations made, and solutions proposed for a complex
problem.
E. Analyze the adequacy of and make improvements to an existing model or
develop a mathematical model of a real phenomenon.
2, 3, 4
Page 324
Smarter Balanced 2014-15 and 2015-16 Interim Assessment Technical Report
Appendix B: Test Blueprints
B-207
High School – Algebra and Functions II – Quadratic Functions, Equations, and Inequalities (15 items)
Claim Content
Category Assessment Targets DOK
Number
of
Items
Total Items
per
Reporting
Category
C. State logical assumptions being used.
F. Identify important quantities in a practical situation and map their
relationships (e.g., using diagrams, two-way tables, graphs, flow charts, or
formulas).
1, 2, 3
G. Identify, analyze, and synthesize relevant external resources to pose or
solve problems. 3, 4
3. Communicating
Reasoning
Communicating
Reasoning
A. Test propositions or conjectures with specific examples.
D. Use the technique of breaking an argument into cases. 2, 3
1 1
B. Construct, autonomously, chains of reasoning that will justify or refute
propositions or conjectures.
E. Distinguish correct logic or reasoning from that which is flawed, and—if
there is a flaw in the argument—explain what it is.
2, 3, 4
C. State logical assumptions being used.
F. Base arguments on concrete referents such as objects, drawings,
diagrams, and actions.
G. At later grades, determine conditions under which an argument does and
does not apply.
2, 3
Page 325
Smarter Balanced 2014-15 and 2015-16 Interim Assessment Technical Report
Appendix B: Test Blueprints
B-208
High School
High School – Geometry and Right Triangle Trigonometry (15 items)
Claim Content Category Assessment Targets DOK
Number
of
Items
Total Items
per
Reporting
Category
1. Concepts and
Procedures G O. O: Define trigonometric ratios and solve problems involving right triangles. 1, 2 11 11
2. Problem Solving
4. Modeling and Data
Analysis
Problem Solving
A. Apply mathematics to solve well-posed problems arising in everyday life,
society, and the workplace. 2, 3
1
1
B. Select and use appropriate tools strategically.
C. Interpret results in the context of a situation.
D. Identify important quantities in a practical situation and map their
relationships (e.g., using diagrams, two-way tables, graphs, flow charts,
or formulas).
1, 2,
3
Modeling and Data
Analysis
A. Apply mathematics to solve problems arising in everyday life, society,
and the workplace.
D. Interpret results in the context of a situation.
2, 3
0
B. Construct, autonomously, chains of reasoning to justify mathematical
models used, interpretations made, and solutions proposed for a
complex problem.
E. Analyze the adequacy of and make improvements to an existing model or
develop a mathematical model of a real phenomenon.
2, 3,
4
C. State logical assumptions being used.
F. Identify important quantities in a practical situation and map their
relationships (e.g., using diagrams, two-way tables, graphs, flow charts,
or formulas).
1, 2,
3
Page 326
Smarter Balanced 2014-15 and 2015-16 Interim Assessment Technical Report
Appendix B: Test Blueprints
B-209
High School – Geometry and Right Triangle Trigonometry (15 items)
Claim Content Category Assessment Targets DOK
Number
of
Items
Total Items
per
Reporting
Category
G. Identify, analyze, and synthesize relevant external resources to pose or
solve problems. 3, 4
3. Communicating
Reasoning
Communicating
Reasoning
A. Test propositions or conjectures with specific examples.
D. Use the technique of breaking an argument into cases. 2, 3
3 3
B. Construct, autonomously, chains of reasoning that will justify or refute
propositions or conjectures.
E. Distinguish correct logic or reasoning from that which is flawed, and—if
there is a flaw in the argument—explain what it is.
2, 3,
4
C. State logical assumptions being used.
F. Base arguments on concrete referents such as objects, drawings,
diagrams, and actions.
G. At later grades, determine conditions under which an argument does and
does not apply. (For example, area increases with perimeter for squares,
but not for all plane figures.)
2, 3
Page 327
Smarter Balanced 2014-15 and 2015-16 Interim Assessment Technical Report
Appendix B: Test Blueprints
B-210
High School
High School – Statistics and Probability (12 items)
Claim Content
Category Assessment Targets DOK
Number
of
Items
Total Items
per
Reporting
Category
1. Concepts and
Procedures SP
O. P. Summarize, represent, and interpret data on a single count or measurement
variable. 2 6 6
2. Problem Solving
4. Modeling and
Data Analysis
Problem
Solving
A. Apply mathematics to solve well-posed problems arising in everyday life,
society, and the workplace. 2, 3
3
6
B. Select and use appropriate tools strategically.
C. Interpret results in the context of a situation.
D. Identify important quantities in a practical situation and map their
relationships (e.g., using diagrams, two-way tables, graphs, flow charts, or
formulas).
1, 2,
3
Modeling and
Data Analysis
A. Apply mathematics to solve problems arising in everyday life, society, and the
workplace.
D. Interpret results in the context of a situation.
2, 3
3
B. Construct, autonomously, chains of reasoning to justify mathematical
models used, interpretations made, and solutions proposed for a complex
problem.
E. Analyze the adequacy of and make improvements to an existing model or
develop a mathematical model of a real phenomenon.
2, 3,
4
C. State logical assumptions being used.
F. Identify important quantities in a practical situation and map their
relationships (e.g., using diagrams, two-way tables, graphs, flow charts, or
formulas).
1, 2,
3
Page 328
Smarter Balanced 2014-15 and 2015-16 Interim Assessment Technical Report
Appendix B: Test Blueprints
B-211
High School – Statistics and Probability (12 items)
Claim Content
Category Assessment Targets DOK
Number
of
Items
Total Items
per
Reporting
Category
G. Identify, analyze, and synthesize relevant external resources to pose or solve
problems. 3, 4
3. Communicating
Reasoning
Communicating
Reasoning
A. Test propositions or conjectures with specific examples.
D. Use the technique of breaking an argument into cases. 2, 3
0 0
B. Construct, autonomously, chains of reasoning that will justify or refute
propositions or conjectures.
E. Distinguish correct logic or reasoning from that which is flawed, and—if there
is a flaw in the argument—explain what it is.
2, 3,
4
C. State logical assumptions being used.
F. Base arguments on concrete referents such as objects, drawings, diagrams,
and actions.
G. At later grades, determine conditions under which an argument does and
does not apply. (For example, area increases with perimeter for squares, but
not for all plane figures.)
2, 3
Page 329
Smarter Balanced 2014-15 and 2015-16 Interim Assessment Technical Report
Appendix B: Test Blueprints
B-212
High School
High School – Interim Assessment Block – Performance Task
Claim Content Category Assessment Targets DOK
Items
per
Claim
Total
Items
in PT
2. Problem Solving
4. Modeling and
Data Analysis
Problem Solving
A. Apply mathematics to solve well-posed problems arising in everyday life,
society, and the workplace. 2, 3
1
6
B. Select and use appropriate tools strategically.
C. Interpret results in the context of a situation.
D. Identify important quantities in a practical situation and map their
relationships (e.g., using diagrams, two-way tables, graphs, flow charts, or
formulas).
1, 2, 3
Modeling and Data
Analysis
A. Apply mathematics to solve problems arising in everyday life, society, and
the workplace.
D. Interpret results in the context of a situation.
2, 3
3
B. Construct, autonomously, chains of reasoning to justify mathematical
models used, interpretations made, and solutions proposed for a complex
problem.
E. Analyze the adequacy of and make improvements to an existing model or
develop a mathematical model of a real phenomenon.
2, 3, 4
C. State logical assumptions being used.
F. Identify important quantities in a practical situation and map their
relationships (e.g., using diagrams, two-way tables, graphs, flow charts, or
formulas).
1, 2, 3
G. Identify, analyze, and synthesize relevant external resources to pose or
solve problems. 3, 4
Page 330
Smarter Balanced 2014-15 and 2015-16 Interim Assessment Technical Report
Appendix B: Test Blueprints
B-213
High School – Interim Assessment Block – Performance Task
Claim Content Category Assessment Targets DOK
Items
per
Claim
Total
Items
in PT
3. Communicating
Reasoning
Communicating
Reasoning
A. Test propositions or conjectures with specific examples.
D. Use the technique of breaking an argument into cases. 2, 3
2
B. Construct, autonomously, chains of reasoning that will justify or refute
propositions or conjectures.
E. Distinguish correct logic or reasoning from that which is flawed, and—if
there is a flaw in the argument—explain what it is.
2, 3, 4
C. State logical assumptions being used.
F. Base arguments on concrete referents such as objects, drawings,
diagrams, and actions.
G. At later grades, determine conditions under which an argument does and
does not apply. (For example, area increases with perimeter for squares,
but not for all plane figures.)
2, 3
Page 331
Smarter Balanced 2014-15 and 2015-16 Interim Assessment Technical Report
Appendix C: Test Maps
C-1
Appendix C: Test Maps
The charts below provide the test maps for the ICA and IABs for ELA and Math.
Grade 3 ELA IABs
Grade 3 ELA/literacy- Brief Writes
Interim Assessment Block Test Map
Item
Sequence Claim Target DOK Item Type
Point
Value
1 2 1 3 SA 2
2 2 3 3 SA 2
3 2 1 3 SA 2
4 2 1 3 SA 2
5 2 1 3 SA 2
6 2 6 3 SA 2
Grade 3 ELA/literacy- Edit and Revise
Interim Assessment Block Test Map
Item
Sequence Claim Target DOK Item Type
Point
Value
1 2 9 1 MC4 1
2 2 8 1 MC4 1
3 2 9 1 MC4 1
4 2 8 1 HTQ 1
5 2 8 1 MC4 1
Page 332
Smarter Balanced 2014-15 and 2015-16 Interim Assessment Technical Report
Appendix C: Test Maps
C-2
Grade 3 ELA/literacy- Edit and Revise
Interim Assessment Block Test Map
Item
Sequence Claim Target DOK Item Type
Point
Value
6 2 6 2 MC4 1
7 2 3 2 HTQ 1
8 2 9 1 MC4 1
9 2 9 1 MC4 1
10 2 3 2 MC4 1
11 2 9 1 HTQ 1
12 2 8 2 MC4 1
13 2 6 2 MS6 1
14 2 9 1 HTQ 1
15 2 9 1 MC4 1
Grade 3 ELA/literacy- Listen Interpret
Interim Assessment Block Test Map
Item
Sequence Claim Target DOK Item Type
Point
Value
1 3 4 1 MI 1
2 3 4 1 MC4 1
3 3 4 3 MS5 1
Page 333
Smarter Balanced 2014-15 and 2015-16 Interim Assessment Technical Report
Appendix C: Test Maps
C-3
Grade 3 ELA/literacy- Listen Interpret
Interim Assessment Block Test Map
Item
Sequence Claim Target DOK Item Type
Point
Value
4 3 4 1 MI 1
5 3 4 3 MC4 1
6 3 4 2 MC4 1
7 3 4 3 MC4 1
8 3 4 3 EBSR4 1
9 3 4 1 MI 1
10 3 4 1 MC4 1
11 3 4 2 MC4 1
12 3 4 3 EBSR4 1
13 3 4 3 MC4 1
14 3 4 3 EBSR4 1
15 3 4 1 MI 1
Page 334
Smarter Balanced 2014-15 and 2015-16 Interim Assessment Technical Report
Appendix C: Test Maps
C-4
Grade 3 ELA/literacy- Read Informational texts
Interim Assessment Block Test Map
Item
Sequence Claim Target DOK
Item
Type Point Value
1 1 10 2 MC4 1
2 1 14 2 MC4 1
3 1 12 3 MC4 1
4 1 13 2 MC4 1
5 1 8 2 HTQ 1
6 1 11 3 HTQ 1
7 1 9 3 SA 1
8 1 10 1 MC4 1
9 1 13 3 MC4 1
10 1 9 2 MC4 1
11 1 11 3 EBSR4 1
12 1 8 2 HTQ 1
13 1 14 3 MC4 1
14 1 9 2 EBSR4 1
15 1 13 2 MS6 1
16 1 11 3 HTQ 1
Page 335
Smarter Balanced 2014-15 and 2015-16 Interim Assessment Technical Report
Appendix C: Test Maps
C-5
Grade 3 ELA/literacy- Read Literary Texts
Interim Assessment Block Test Map
Item
Sequence Claim Target DOK Item Type
Point
Value
1 1 2 2 MC4 1
2 1 6 3 MC4 1
3 1 4 3 EBSR4 1
4 1 7 2 MC4 1
5 1 6 2 MC4 1
6 1 5 4 MC4 1
7 1 5 3 HTQ 1
8 1 2 2 HTQ 1
9 1 4 3 SA 1
10 1 3 1 MC4 1
11 1 2 2 MC4 1
12 1 4 3 EBSR4 1
13 1 7 3 MC4 1
14 1 6 2 MC4 1
15 1 4 3 HTQ 1
Page 336
Smarter Balanced 2014-15 and 2015-16 Interim Assessment Technical Report
Appendix C: Test Maps
C-6
Grade 3 ELA/literacy- Research
Interim Assessment Block Test Map
Item
Sequence Claim Target DOK Item Type
Point
Value
1 4 2 2 MC4 1
2 4 3 2 MC4 1
3 4 2 2 MS6 1
4 4 4 2 MC4 1
5 4 2 2 MC4 1
6 4 4 2 HTQ 1
7 4 2 2 MC4 1
8 4 3 2 MC4 1
9 4 4 2 HTQ 1
10 4 4 2 MC4 1
11 4 4 2 MC4 1
12 4 3 2 MC4 1
13 4 2 2 MC4 1
14 4 3 2 MC4 1
15 4 3 2 MC4 1
16 4 4 2 HTQ 1
Page 337
Smarter Balanced 2014-15 and 2015-16 Interim Assessment Technical Report
Appendix C: Test Maps
C-7
Grade 3 ELA/literacy- Research
Interim Assessment Block Test Map
Item
Sequence Claim Target DOK Item Type
Point
Value
17 4 2 2 MS6 1
Grade 3 ELA/literacy- Performance Task Beetles 1
Interim Assessment Block Test Map
Item
Sequence Claim Target DOK Item Type
Point
Value
1 4 2 3 SA 2
2 4 4 3 SA 2
3 4 4 3 MI 1
Grade 3 ELA/literacy- Performance Task Beetles 2
Interim Assessment Block Test Map
Item
Sequence Claim Target DOK Item Type
Point
Value
1 2 7 4 WER 10
Page 338
Smarter Balanced 2014-15 and 2015-16 Interim Assessment Technical Report
Appendix C: Test Maps
C-8
Grade 4 ELA IABs
Grade 4 ELA/literacy- Brief Writes
Interim Assessment Block Test Map
Item
Sequence Claim Target DOK Item Type
Point
Value
1 2 1 3 SA 2
2 2 1 3 SA 2
3 2 6 3 SA 2
4 2 3 3 SA 2
5 2 3 3 SA 2
6 2 1 3 SA 2
Grade 4 ELA/literacy- Edit and Revise
Interim Assessment Block Test Map
Item
Sequence Claim Target DOK Item Type
Point
Value
1 2 8 1 MC4 1
2 2 9 1 MC4 1
3 2 9 1 MC4 1
4 2 1 2 MC4 1
5 2 9 1 MC4 1
6 2 9 1 HTQ 1
7 2 9 1 MC4 1
Page 339
Smarter Balanced 2014-15 and 2015-16 Interim Assessment Technical Report
Appendix C: Test Maps
C-9
Grade 4 ELA/literacy- Edit and Revise
Interim Assessment Block Test Map
Item
Sequence Claim Target DOK Item Type
Point
Value
8 2 9 1 MC4 1
9 2 8 2 HTQ 1
10 2 3 2 MC4 1
11 2 9 1 MC4 1
12 2 9 1 MC4 1
13 2 8 1 MC4 1
14 2 1 2 MC4 1
15 2 3 2 HTQ 1
16 2 8 1 MS6 1
Grade 4 ELA/literacy- Listen and Interpret
Interim Assessment Block Test Map
Item
Sequence Claim Target DOK Item Type
Point
Value
1 3 4 3 EBSR4 1
2 3 4 2 MC4 1
3 3 4 2 MC4 1
4 3 4 1 MI 1
5 3 4 2 MC4 1
Page 340
Smarter Balanced 2014-15 and 2015-16 Interim Assessment Technical Report
Appendix C: Test Maps
C-10
Grade 4 ELA/literacy- Listen and Interpret
Interim Assessment Block Test Map
Item
Sequence Claim Target DOK Item Type
Point
Value
6 3 4 2 MC4 1
7 3 4 1 MS5 1
8 3 4 3 EBSR4 1
9 3 4 1 MC4 1
10 3 4 3 MC4 1
11 3 4 3 MS5 1
12 3 4 2 MC4 1
13 3 4 3 MS6 1
14 3 4 3 MI 1
15 3 4 3 EBSR4 1
Grade 4 ELA/literacy- Read Informational Texts
Interim Assessment Block Test Map
Item
Sequence Claim Target DOK Item Type Point Value
1 1 10 2 MC4 1
2 1 13 2 MC4 1
3 1 14 3 HTQ 1
4 1 14 2 MS6 1
Page 341
Smarter Balanced 2014-15 and 2015-16 Interim Assessment Technical Report
Appendix C: Test Maps
C-11
Grade 4 ELA/literacy- Read Informational Texts
Interim Assessment Block Test Map
Item
Sequence Claim Target DOK Item Type Point Value
5 1 9 2 EBSR5 1
6 1 10 2 MC4 1
7 1 14 3 MC4 1
8 1 13 2 MC4 1
9 1 11 3 HTQ 1
10 1 8 2 MS5 1
11 1 10 2 HTQ 1
12 1 8 2 MS5 1
13 1 12 4 MS6 1
14 1 9 3 SA 2
Grade 4 ELA/literacy- Research
Interim Assessment Block Test Map
Item
Sequence Claim Target DOK Item Type
Point
Value
1 4 4 2 MC4 1
2 4 3 2 MC4 1
3 4 2 2 MC4 1
4 4 4 2 MS6 1
Page 342
Smarter Balanced 2014-15 and 2015-16 Interim Assessment Technical Report
Appendix C: Test Maps
C-12
Grade 4 ELA/literacy- Research
Interim Assessment Block Test Map
Item
Sequence Claim Target DOK Item Type
Point
Value
5 4 4 2 MC4 1
6 4 3 2 MC4 1
7 4 4 2 HTQ 1
8 4 2 2 MC4 1
9 4 3 2 MS6 1
10 4 4 2 MC4 1
11 4 2 2 MC6 1
12 4 2 2 MI 1
13 4 2 2 MC4 1
14 4 3 2 MC4 1
15 4 3 2 MC4 1
16 4 4 2 MS6 1
17 4 2 2 MS6 1
18 4 3 2 MS6 1
Page 343
Smarter Balanced 2014-15 and 2015-16 Interim Assessment Technical Report
Appendix C: Test Maps
C-13
Grade 4 ELA/literacy- Read Literary Texts
Interim Assessment Block Test Map
Item
Sequence Claim Target DOK Item Type
Point
Value
1 1 5 4 MC4 1
2 1 3 2 MC4 1
3 1 6 2 MC4 1
4 1 4 3 EBSR4 1
5 1 2 2 MC4 1
6 1 1 2 HTQ 1
7 1 2 2 MC4 1
8 1 1 2 MC4 1
9 1 4 3 EBSR4 1
10 1 3 2 MS6 1
11 1 4 3 SA 2
12 1 3 1 MS5 1
13 1 2 2 MC4 1
14 1 7 3 MS5 1
15 1 1 1 HTQ 1
Page 344
Smarter Balanced 2014-15 and 2015-16 Interim Assessment Technical Report
Appendix C: Test Maps
C-14
Grade 4 ELA/literacy- Performance Task Unlikely Animal 1
Interim Assessment Block Test Map
Item
Sequence Claim Target DOK Item Type
Point
Value
1 4 2 3 SA 2
2 4 4 3 SA 2
3 4 4 3 MI 1
Grade 4 ELA/literacy- Performance Task Unlikely Animal 2
Interim Assessment Block Test Map
Item
Sequence Claim Target DOK Item Type
Point
Value
1 2 2 4 WER 10
Page 345
Smarter Balanced 2014-15 and 2015-16 Interim Assessment Technical Report
Appendix C: Test Maps
C-15
Grade 5 ELA IABs
Grade 5 ELA/literacy- Brief Writes
Interim Assessment Block Test Map
Item
Sequence Claim Target DOK Item Type
Point
Value
1 2 1 3 SA 2
2 2 6 3 SA 2
3 2 3 3 SA 2
4 2 3 3 SA 2
5 2 6 3 SA 2
6 2 1 3 SA 2
Grade 5 ELA/literacy- Edit and Revise
Interim Assessment Block Test Map
Item
Sequence Claim Target DOK Item Type
Point
Value
1 2 8 1 MC4 1
2 2 9 1 MC4 1
3 2 9 1 MC4 1
4 2 8 2 HTQ 1
5 2 1 2 MC4 1
6 2 3 2 MS6 1
7 2 8 1 HTQ 1
Page 346
Smarter Balanced 2014-15 and 2015-16 Interim Assessment Technical Report
Appendix C: Test Maps
C-16
Grade 5 ELA/literacy- Edit and Revise
Interim Assessment Block Test Map
Item
Sequence Claim Target DOK Item Type
Point
Value
8 2 9 1 MC4 1
9 2 9 1 MS6 1
10 2 9 1 HTQ 1
11 2 9 1 MC4 1
12 2 8 2 MC4 1
13 2 3 2 HTQ 1
Grade 5 ELA/literacy- Listen and Interpret
Interim Assessment Block Test Map
Item
Sequence Claim Target DOK Item Type
Point
Value
1 3 4 3 MC4 1
2 3 4 2 MC4 1
3 3 4 3 EBSR4 1
4 3 4 2 MC4 1
5 3 4 3 EBSR4 1
6 3 4 1 MI 1
7 3 4 1 MI 1
8 3 4 2 MC4 1
Page 347
Smarter Balanced 2014-15 and 2015-16 Interim Assessment Technical Report
Appendix C: Test Maps
C-17
Grade 5 ELA/literacy- Listen and Interpret
Interim Assessment Block Test Map
Item
Sequence Claim Target DOK Item Type
Point
Value
9 3 4 1 MC4 1
10 3 4 3 EBSR4 1
11 3 4 3 MS5 1
12 3 4 3 MC4 1
13 3 4 3 MS5 1
14 3 4 3 EBSR4 1
Grade 5 ELA/literacy- Read Informational Texts
Interim Assessment Block Test Map
Item
Sequence Claim Target DOK Item Type
Point
Value
1 1 10 1 MC4 1
2 1 8 1 HTQ 1
3 1 13 2 MC4 1
4 1 9 2 EBSR4 1
5 1 14 3 MS6 1
6 1 11 3 HTQ 1
7 1 12 4 MC4 1
Page 348
Smarter Balanced 2014-15 and 2015-16 Interim Assessment Technical Report
Appendix C: Test Maps
C-18
Grade 5 ELA/literacy- Read Informational Texts
Interim Assessment Block Test Map
Item
Sequence Claim Target DOK Item Type
Point
Value
8 1 10 2 MC4 1
9 1 13 2 MC4 1
10 1 11 3 SA 2
11 1 12 3 MC4 1
12 1 10 2 HTQ 1
13 1 14 3 MS5 1
14 1 8 2 MS5 1
15 1 11 3 SA 2
Grade 5 ELA/literacy- Read Literary Texts
Interim Assessment Block Test Map
Item
Sequence Claim Target DOK Item Type
Point
Value
1 1 3 1 MC4 1
2 1 7 2 MC4 1
3 1 5 3 EBSR4 1
4 1 1 2 MS6 1
5 1 4 3 SA 2
Page 349
Smarter Balanced 2014-15 and 2015-16 Interim Assessment Technical Report
Appendix C: Test Maps
C-19
Grade 5 ELA/literacy- Read Literary Texts
Interim Assessment Block Test Map
Item
Sequence Claim Target DOK Item Type
Point
Value
6 1 7 2 MC4 1
7 1 4 3 EBSR4 1
8 1 3 2 MS5 1
9 1 2 3 HTQ 1
10 1 1 2 MS6 1
11 1 2 3 SA 2
12 1 1 2 MC4 1
13 1 3 2 HTQ 1
14 1 2 2 MS6 1
15 1 4 3 EBSR4 1
Grade 5 ELA/literacy- Research
Interim Assessment Block Test Map
Item
Sequence Claim Target DOK Item Type
Point
Value
1 4 4 2 MC4 1
2 4 3 2 MC4 1
3 4 3 2 MC4 1
Page 350
Smarter Balanced 2014-15 and 2015-16 Interim Assessment Technical Report
Appendix C: Test Maps
C-20
Grade 5 ELA/literacy- Research
Interim Assessment Block Test Map
Item
Sequence Claim Target DOK Item Type
Point
Value
4 4 2 2 MS6 1
5 4 3 2 MS6 1
6 4 4 2 MS6 1
7 4 4 2 MC4 1
8 4 4 2 HTQ 1
9 4 2 2 MS6 1
10 4 3 2 MC4 1
11 4 4 2 MS6 1
12 4 2 2 MC4 1
13 4 3 2 MS6 1
14 4 2 2 MC4 1
15 4 2 2 MS6 1
16 4 3 2 MS6 1
17 4 4 2 HTQ 1
Page 351
Smarter Balanced 2014-15 and 2015-16 Interim Assessment Technical Report
Appendix C: Test Maps
C-21
Grade 5 ELA/literacy- Performance Task Whales 1
Interim Assessment Block Test Map
Item
Sequence Claim Target DOK Item Type
Point
Value
1 4 4 3 SA 2
2 4 2 3 MS6 1
3 4 2 3 SA 2
Grade 5 ELA/literacy- Performance Task Whales 2
Interim Assessment Block Test Map
Item
Sequence Claim Target DOK Item Type
Point
Value
1 2 2 4 WER 10
Page 352
Smarter Balanced 2014-15 and 2015-16 Interim Assessment Technical Report
Appendix C: Test Maps
C-22
Grade 6 ELA IABs
Grade 6 ELA/literacy- Brief Writes
Interim Assessment Block Test Map
Item
Sequence Claim Target DOK Item Type
Point
Value
1 2 1 3 SA 2
2 2 1 3 SA 2
3 2 1 3 SA 2
4 2 6 3 SA 2
5 2 6 3 SA 2
6 2 3 3 SA 2
Grade 6 ELA/literacy- Edit and Revise
Interim Assessment Block Test Map
Item
Sequence Claim Target DOK Item Type
Point
Value
1 2 8 1 MC4 1
2 2 9 1 MC4 1
3 2 9 1 HTQ 1
4 2 9 1 MC4 1
5 2 9 1 MC4 1
6 2 8 2 MS6 1
Page 353
Smarter Balanced 2014-15 and 2015-16 Interim Assessment Technical Report
Appendix C: Test Maps
C-23
Grade 6 ELA/literacy- Edit and Revise
Interim Assessment Block Test Map
Item
Sequence Claim Target DOK Item Type
Point
Value
7 2 9 1 HTQ 1
8 2 1 2 MC4 1
9 2 8 2 MS6 1
10 2 8 1 MC4 1
11 2 3 2 MC4 1
12 2 9 1 HTQ 1
13 2 1 2 MC4 1
14 2 8 2 MS6 1
15 2 9 1 HTQ 1
16 2 6 2 MS6 1
17 2 3 2 MC4 1
18 2 9 1 HTQ 1
Page 354
Smarter Balanced 2014-15 and 2015-16 Interim Assessment Technical Report
Appendix C: Test Maps
C-24
Grade 6 ELA/literacy- Read Informational Texts
Interim Assessment Block Test Map
Item
Sequence Claim Target DOK Item Type
Point
Value
1 1 8 2 HTQ 1
2 1 9 2 EBSR4 1
3 1 14 3 MC4 1
4 1 10 1 MS5 1
5 1 13 3 MS6 1
6 1 11 3 EBSR4 1
7 1 10 1 HTQ 1
8 1 9 2 MS6 1
9 1 12 3 EBSR4 1
10 1 11 3 SA 2
11 1 8 2 HTQ 1
12 1 9 2 MC4 1
13 1 13 3 MC4 1
14 1 14 3 MS6 1
15 1 11 3 EBSR4 1
16 1 12 4 MS6 1
Page 355
Smarter Balanced 2014-15 and 2015-16 Interim Assessment Technical Report
Appendix C: Test Maps
C-25
Grade 6 ELA/literacy- Read Literary Texts
Interim Assessment Block Test Map
Item
Sequence Claim Target DOK Item Type
Point
Value
1 1 5 3 MC4 1
2 1 3 2 MC4 1
3 1 2 2 HTQ 1
4 1 6 3 MC4 1
5 1 6 3 MS6 1
6 1 6 2 MC4 1
7 1 3 2 MC4 1
8 1 5 3 MC4 1
9 1 2 3 SA 2
10 1 6 2 MC4 1
11 1 2 2 MC4 1
12 1 1 2 MC4 1
13 1 3 1 MC4 1
14 1 4 3 HTQ 1
15 1 7 3 MS5 1
Grade 6 ELA/literacy- Research
Interim Assessment Block Test Map
Page 356
Smarter Balanced 2014-15 and 2015-16 Interim Assessment Technical Report
Appendix C: Test Maps
C-26
Item Sequence Claim Target DOK Item Type Point Value
1 4 2 2 MC4 1
2 4 4 2 HTQ 1
3 4 2 2 HTQ 1
4 4 3 2 MC4 1
5 4 2 2 HTQ 1
6 4 3 2 MC4 1
7 4 4 2 MS6 1
8 4 4 2 MC4 1
9 4 4 2 HTQ 1
10 4 3 2 MC4 1
11 4 4 2 HTQ 1
12 4 3 2 MS6 1
13 4 2 2 MC4 1
14 4 2 2 HTQ 1
15 4 4 2 MS6 1
16 4 4 2 HTQ 1
17 4 3 2 MS6 1
18 4 4 2 MS6 1
Grade 6 ELA/literacy- Listen & interpret
Interim Assessment Block Test Map
Page 357
Smarter Balanced 2014-15 and 2015-16 Interim Assessment Technical Report
Appendix C: Test Maps
C-27
Item
Sequence Claim Target DOK
Item
Type Point Value
1 3 4 2 MC4 1
2 3 4 3 EBSR4 1
3 3 4 3 MS5 1
4 3 4 3 MC4 1
5 3 4 2 MS6 1
6 3 4 1 MC4 1
7 3 4 3 MC4 1
8 3 4 3 EBSR4 1
9 3 4 1 MI 1
10 3 4 3 EBSR4 1
11 3 4 3 EBSR4 1
12 3 4 3 MS5 1
13 3 4 3 MC4 1
14 3 4 2 EBSR4 1
15 3 4 3 MS5 1
Grade 6 ELA/literacy- Performance Task Multivitamins 1
Interim Assessment Block Test Map
Page 358
Smarter Balanced 2014-15 and 2015-16 Interim Assessment Technical Report
Appendix C: Test Maps
C-28
Item
Sequence Claim Target DOK Item Type
Point
Value
1 4 4 3 SA 2
2 4 3 4 SA 2
Grade 6 ELA/literacy- Performance Task Multivitamins 2
Interim Assessment Block Test Map
Item
Sequence Claim Target DOK Item Type
Point
Value
1 2 7 4 WER 10
Page 359
Smarter Balanced 2014-15 and 2015-16 Interim Assessment Technical Report
Appendix C: Test Maps
C-29
Grade 7 ELA IABs
Grade 7 ELA/literacy- Brief Writes
Interim Assessment Block Test Map
Item
Sequence Claim Target DOK Item Type Point Value
1 2 1 3 SA 2
2 2 3 3 SA 2
3 2 1 3 SA 2
4 2 6 3 SA 2
5 2 6 3 SA 2
6 2 6 3 SA 2
Grade 7 ELA/literacy- Edit and Revise
Interim Assessment Block Test Map
Item
Sequence Claim Target DOK Item Type
Point
Value
1 2 8 2 MC4 1
2 2 9 1 MC4 1
3 2 8 2 MC4 1
4 2 1 2 MC4 1
5 2 8 2 HTQ 1
6 2 9 1 MC4 1
7 2 8 1 MS6 1
Page 360
Smarter Balanced 2014-15 and 2015-16 Interim Assessment Technical Report
Appendix C: Test Maps
C-30
Grade 7 ELA/literacy- Edit and Revise
Interim Assessment Block Test Map
Item
Sequence Claim Target DOK Item Type
Point
Value
8 2 9 1 MC4 1
9 2 6 2 MC4 1
10 2 1 2 MC4 1
11 2 6 2 HTQ 1
12 2 9 1 MC4 1
13 2 3 2 HTQ 1
14 2 9 1 MS6 1
15 2 8 2 HTQ 1
16 2 9 1 MS6 1
17 2 9 1 HTQ 1
Grade 7 ELA/literacy- Listen and Interpret
Interim Assessment Block Test Map
Item
Sequence Claim Target DOK Item Type
Point
Value
1 3 4 3 MC4 1
2 3 4 2 MC4 1
3 3 4 1 MS6 1
Page 361
Smarter Balanced 2014-15 and 2015-16 Interim Assessment Technical Report
Appendix C: Test Maps
C-31
Grade 7 ELA/literacy- Listen and Interpret
Interim Assessment Block Test Map
Item
Sequence Claim Target DOK Item Type
Point
Value
4 3 4 3 EBSR4 1
5 3 4 2 MC4 1
6 3 4 3 MC4 1
7 3 4 3 MC4 1
8 3 4 1 MC4 1
9 3 4 3 MS5 1
10 3 4 3 MC4 1
11 3 4 1 EBSR4 1
12 3 4 3 EBSR4 1
13 3 4 3 MC4 1
14 3 4 2 MC4 1
15 3 4 1 MS6 1
Page 362
Smarter Balanced 2014-15 and 2015-16 Interim Assessment Technical Report
Appendix C: Test Maps
C-32
Grade 7 ELA/literacy- Read Informational Texts
Interim Assessment Block Test Map
Item
Sequence Claim Target DOK Item Type
Point
Value
1 1 14 3 MC4 1
2 1 12 4 MC4 1
3 1 9 2 EBSR4 1
4 1 10 1 HTQ 1
5 1 14 3 MS6 1
6 1 8 2 MS6 1
7 1 10 1 MS5 1
8 1 8 2 HTQ 1
9 1 11 3 HTQ 1
10 1 12 4 EBSR6 1
11 1 13 3 MS6 2
12 1 9 3 SA 2
13 1 11 4 EBSR4 1
14 1 13 3 MS6 1
15 1 9 2 MS6 1
16 1 12 4 HTQ 1
Page 363
Smarter Balanced 2014-15 and 2015-16 Interim Assessment Technical Report
Appendix C: Test Maps
C-33
Grade 7 ELA/literacy- Read Literary Texts
Interim Assessment Block Test Map
Item
Sequence Claim Target DOK Item Type
Point
Value
1 1 6 2 MC4 1
2 1 3 2 MC4 1
3 1 4 3 EBSR4 1
4 1 1 2 HTQ 1
5 1 3 2 HTQ 1
6 1 2 2 MC4 2
7 1 5 3 MC4 1
8 1 6 3 MC4 1
9 1 1 2 MS5 1
10 1 4 4 SA 1
11 1 3 2 MC4 1
12 1 1 2 MC4 1
13 1 4 4 EBSR4 1
14 1 2 2 EBSR4 1
15 1 6 3 MS6 1
16 1 7 3 MC4 1
Page 364
Smarter Balanced 2014-15 and 2015-16 Interim Assessment Technical Report
Appendix C: Test Maps
C-34
Grade 7 ELA/literacy- Research
Interim Assessment Block Test Map
Item
Sequence Claim Target DOK Item Type
Point
Value
1 4 3 2 MC4 1
2 4 4 2 MC4 1
3 4 3 2 MS6 1
4 4 3 2 MC4 1
5 4 4 2 MI 1
6 4 2 2 HTQ 1
7 4 3 2 MS6 1
8 4 4 2 HTQ 1
9 4 3 2 MS6 1
10 4 4 2 MI 1
11 4 2 2 MC4 1
12 4 4 2 MI 1
13 4 2 2 MC4 1
14 4 2 2 MS6 1
15 4 2 2 HTQ 1
Page 365
Smarter Balanced 2014-15 and 2015-16 Interim Assessment Technical Report
Appendix C: Test Maps
C-35
Grade 7 ELA/literacy- Performance Task Mobile Ed Technology 1
Interim Assessment Block Test Map
Item
Sequence Claim Target DOK Item Type
Point
Value
1 4 4 3 SA 2
2 4 2 4 SA 2
3 4 4 3 MI 1
Grade 7 ELA/literacy- Performance Task Mobile Ed Technology 2
Interim Assessment Block Test Map
Item
Sequence Claim Target DOK Item Type
Point
Value
1 2 4 4 WER 10
Page 366
Smarter Balanced 2014-15 and 2015-16 Interim Assessment Technical Report
Appendix C: Test Maps
C-36
Grade 8 ELA IABs
Grade 8 ELA/literacy- Brief Writes
Interim Assessment Block Test Map
Item
Sequence Claim Target DOK Item Type
Point
Value
1 2 1 3 SA 2
2 2 1 3 SA 2
3 2 6 3 SA 2
4 2 6 3 SA 2
5 2 3 3 SA 2
6 2 3 3 SA 2
Grade 8 ELA/literacy- Edit and Revise
Interim Assessment Block Test Map
Item
Sequence Claim Target DOK Item Type
Point
Value
1 2 8 2 MC4 1
2 2 8 2 MC4 1
3 2 1 2 MC4 1
4 2 9 1 MC4 1
5 2 8 1 MS6 1
6 2 9 1 MC4 1
Page 367
Smarter Balanced 2014-15 and 2015-16 Interim Assessment Technical Report
Appendix C: Test Maps
C-37
Grade 8 ELA/literacy- Edit and Revise
Interim Assessment Block Test Map
Item
Sequence Claim Target DOK Item Type
Point
Value
7 2 9 1 MC4 1
8 2 6 2 HTQ 1
9 2 3 2 MS6 1
10 2 9 1 MS6 1
11 2 3 2 HTQ 1
12 2 8 1 MC4 1
13 2 1 2 MS5 1
14 2 8 2 HTQ 1
Grade 8 ELA/literacy- Listen and Interpret
Interim Assessment Block Test Map
Item
Sequence Claim Target DOK Item Type Point Value
1 3 4 1 MC4 1
2 3 4 3 MC4 1
3 3 4 2 MC4 1
4 3 4 2 MC4 1
5 3 4 2 MC4 1
6 3 4 3 MC4 1
7 3 4 1 MC4 1
8 3 4 3 EBSR4 1
9 3 4 2 MC4 1
10 3 4 3 MC4 1
Page 368
Smarter Balanced 2014-15 and 2015-16 Interim Assessment Technical Report
Appendix C: Test Maps
C-38
Grade 8 ELA/literacy- Listen and Interpret
Interim Assessment Block Test Map
Item
Sequence Claim Target DOK Item Type Point Value
11 3 4 1 MI 1
12 3 4 2 MC4 1
13 3 4 3 MC4 1
14 3 4 3 EBSR4 1
15 3 4 2 MS5 1
Grade 8 ELA/literacy- Read Informational Texts
Interim Assessment Block Test Map
Item
Sequence Claim Target DOK Item Type Point Value
1 1 14 3 MC4 1
2 1 8 2 MC4 1
3 1 12 4 EBSR4 1
4 1 10 1 MS5 1
5 1 11 3 HTQ 1
6 1 9 2 HTQ 1
7 1 14 3 MC4 1
8 1 8 2 MS5 1
9 1 12 3 MS6 1
10 1 14 3 MS5 1
11 1 11 4 SA 2
Page 369
Smarter Balanced 2014-15 and 2015-16 Interim Assessment Technical Report
Appendix C: Test Maps
C-39
Grade 8 ELA/literacy- Read Informational Texts
Interim Assessment Block Test Map
Item
Sequence Claim Target DOK Item Type Point Value
12 1 9 3 SA 2
13 1 8 2 HTQ 1
14 1 11 4 HTQ 1
15 1 9 2 HTQ 1
16 1 13 2 MS5 1
Grade 8 ELA/literacy- Read Literary Texts
Interim Assessment Block Test Map
Item
Sequence Claim Target DOK Item Type Point Value
1 1 7 3 MC4 1
2 1 1 2 MC4 1
3 1 6 3 MC4 1
4 1 6 2 MS6 1
5 1 3 2 MS5 1
6 1 2 3 SA 2
7 1 1 2 MC4 1
8 1 3 2 MC4 1
Page 370
Smarter Balanced 2014-15 and 2015-16 Interim Assessment Technical Report
Appendix C: Test Maps
C-40
Grade 8 ELA/literacy- Read Literary Texts
Interim Assessment Block Test Map
Item
Sequence Claim Target DOK Item Type Point Value
9 1 1 2 MC4 1
10 1 4 4 HTQ 1
11 1 7 3 MS6 1
12 1 7 3 MC4 1
13 1 6 2 MC4 1
14 1 2 2 EBSR4 1
15 1 1 2 MS6 1
16 1 4 4 HTQ 1
Grade 8 ELA/literacy- Research
Interim Assessment Block Test Map
Item
Sequence Claim Target DOK Item Type Point Value
1 4 3 2 MC4 1
2 4 3 2 MC4 1
3 4 4 2 HTQ 1
4 4 3 2 MC4 1
5 4 3 2 MS6 1
Page 371
Smarter Balanced 2014-15 and 2015-16 Interim Assessment Technical Report
Appendix C: Test Maps
C-41
Grade 8 ELA/literacy- Research
Interim Assessment Block Test Map
Item
Sequence Claim Target DOK Item Type Point Value
6 4 2 2 HTQ 1
7 4 4 2 MC4 1
8 4 3 2 MC4 1
9 4 4 2 MC4 1
10 4 2 2 HTQ 1
11 4 2 2 HTQ 1
12 4 3 2 MS6 1
13 4 4 2 MC4 1
14 4 4 2 MI 1
15 4 4 2 HTQ 1
16 4 2 2 HTQ 1
17 4 2 2 HTQ 1
Page 372
Smarter Balanced 2014-15 and 2015-16 Interim Assessment Technical Report
Appendix C: Test Maps
C-42
Grade 8 ELA/literacy- Performance Task Pres Or Present 1
Interim Assessment Block Test Map
Item
Sequence Claim Target DOK Item Type Point Value
1 4 2 3 MS6 1
2 4 2 4 SA 2
3 4 4 3 SA 2
Grade 8 ELA/literacy- Performance Task Pres Or Present 2
Interim Assessment Block Test Map
Item
Sequence Claim Target DOK Item Type
Point
Value
1 2 7 4 WER 10
Page 373
Smarter Balanced 2014-15 and 2015-16 Interim Assessment Technical Report
Appendix C: Test Maps
C-43
Grade 11 ELA IABs
Grade 11 ELA/literacy- Brief Writes
Interim Assessment Block Test Map
Item
Sequence Claim Target DOK Item Type
Point
Value
1 2 1 3 SA 2
2 2 3 3 SA 2
3 2 1 3 SA 2
4 2 6 3 SA 2
5 2 3 3 SA 2
6 2 6 3 SA 2
Grade 11 ELA/literacy- Edit and Revise
Interim Assessment Block Test Map
Item
Sequence Claim Target DOK Item Type
Point
Value
1 2 8 2 MC4 1
2 2 6 2 MC4 1
3 2 8 2 HTQ 1
4 2 9 1 MC4 1
5 2 1 2 MC4 1
6 2 9 1 HTQ 1
Page 374
Smarter Balanced 2014-15 and 2015-16 Interim Assessment Technical Report
Appendix C: Test Maps
C-44
Grade 11 ELA/literacy- Edit and Revise
Interim Assessment Block Test Map
Item
Sequence Claim Target DOK Item Type
Point
Value
7 2 9 1 MC4 1
8 2 9 1 HTQ 1
9 2 8 1 MC4 1
10 2 9 1 HTQ 1
11 2 9 1 MC4 1
12 2 8 2 HTQ 1
13 2 9 1 MC4 1
14 2 1 2 MC4 1
15 2 8 1 HTQ 1
16 2 3 2 MS6 1
17 2 3 2 MC4 1
18 2 9 1 HTQ 1
Page 375
Smarter Balanced 2014-15 and 2015-16 Interim Assessment Technical Report
Appendix C: Test Maps
C-45
Grade 11 ELA/literacy- Listen and Interpret
Interim Assessment Block Test Map
Item
Sequence Claim Target DOK Item Type
Point
Value
1 3 4 1 MC4 1
2 3 4 3 MC4 1
3 3 4 2 MC4 1
4 3 4 3 MC4 1
5 3 4 3 MC4 1
6 3 4 2 MC4 1
7 3 4 3 MS5 1
8 3 4 1 MC4 1
9 3 4 3 MC4 1
10 3 4 2 MS6 1
11 3 4 1 MI 1
12 3 4 3 MC4 1
13 3 4 3 MS5 1
14 3 4 2 MC4 1
15 3 4 2 MS5 1
Page 376
Smarter Balanced 2014-15 and 2015-16 Interim Assessment Technical Report
Appendix C: Test Maps
C-46
Grade 11 ELA/literacy- Read Informational Texts
Interim Assessment Block Test Map
Item
Sequence Claim Target DOK Item Type
Point
Value
1 1 10 2 MC4 1
2 1 11 3 HTQ 1
3 1 8 2 MC4 1
4 1 14 3 MS6 1
5 1 14 3 MC4 1
6 1 8 2 MC4 1
7 1 11 3 HTQ 1
8 1 11 3 EBSR4 1
9 1 10 1 HTQ 1
10 1 12 3 HTQ 1
11 1 11 4 SA 2
12 1 10 1 MC4 1
13 1 8 2 HTQ 1
14 1 9 2 MS6 1
15 1 12 3 MS6 1
Page 377
Smarter Balanced 2014-15 and 2015-16 Interim Assessment Technical Report
Appendix C: Test Maps
C-47
Grade 11 ELA/literacy- Read Literary Texts
Interim Assessment Block Test Map
Item
Sequence Claim Target DOK Item Type
Point
Value
1 1 7 3 MC4 1
2 1 3 1 MC4 1
3 1 5 4 MC4 1
4 1 6 4 MC4 1
5 1 4 3 EBSR4 1
6 1 1 2 MS5 1
7 1 7 3 MC4 1
8 1 2 2 MC4 1
9 1 6 4 MC4 1
10 1 1 2 HTQ 1
11 1 5 4 HTQ 1
12 1 4 4 SA 2
13 1 3 2 MC4 1
14 1 1 2 MC4 1
15 1 7 3 MS6 1
16 1 4 3 HTQ 1
Page 378
Smarter Balanced 2014-15 and 2015-16 Interim Assessment Technical Report
Appendix C: Test Maps
C-48
Grade 11 ELA/literacy- Research
Interim Assessment Block Test Map
Item
Sequence Claim Target DOK Item Type
Point
Value
1 4 2 2 MC4 1
2 4 3 2 MC4 1
3 4 4 2 HTQ 1
4 4 2 2 MC4 1
5 4 2 2 MC4 1
6 4 4 2 MC4 1
7 4 4 2 HTQ 1
8 4 4 2 HTQ 1
9 4 4 2 MC4 1
10 4 2 2 HTQ 1
11 4 2 2 HTQ 1
12 4 2 2 MS6 1
13 4 2 2 HTQ 1
14 4 4 2 MC4 1
15 4 4 2 MC4 1
16 4 2 2 MS6 1
17 4 4 2 HTQ 1
Page 379
Smarter Balanced 2014-15 and 2015-16 Interim Assessment Technical Report
Appendix C: Test Maps
C-49
Grade 11 ELA/literacy- Performance Task Marshmallow 1
Interim Assessment Block Test Map
Item
Sequence Claim Target DOK Item Type
Point
Value
1 4 4 3 MI 1
2 4 3 4 SA 2
3 4 2 4 SA 2
Grade 11 ELA/literacy- Performance Task Marshmallow 2
Interim Assessment Block Test Map
Item
Sequence Claim Target DOK Item Type
Point
Value
1 2 4 4 WER 10
Page 380
Smarter Balanced 2014-15 and 2015-16 Interim Assessment Technical Report
Appendix C: Test Maps
C-50
Grade 3 Math IABs
Grade 3 Mathematics- Measurement and Data
Interim Assessment Block Test Map
Item
Sequence Claim Target DOK Item Type
Point
Value
1 2 B 2 MS4 1
2 4 D 2 EQ 1
3 3 E 2 MC4 1
4 1 G-3 1 MC4 1
5 1 G-3 2 EQ 1
6 1 G-3 1 MC4 1
7 1 H-3 2 EQ 1
8 1 G-3 2 EQ 1
9 1 I-3 2 MC4 1
10 1 I-3 2 EQ 1
11 1 H-3 2 EQ 1
12 1 J-3 1 EQ 1
13 1 J-3 1 EQ 2
14 1 I-3 2 MC4 1
15 1 I-3 2 EQ 1
Page 381
Smarter Balanced 2014-15 and 2015-16 Interim Assessment Technical Report
Appendix C: Test Maps
C-51
Grade 3 Mathematics- Number and Operations - Fractions
Interim Assessment Block Test Map
Item
Sequence Claim Target DOK Item Type
Point
Value
1 3 C 3 MS4 1
2 1 F-3 1 MC4 1
3 1 F-3 2 MC4 1
4 1 F-3 1 EQ 1
5 1 F-3 1 EQ 1
6 1 F-3 1 EQ 1
7 1 F-3 2 EQ 1
8 1 F-3 1 EQ 1
9 1 F-3 2 EQ 1
10 1 F-3 1 MI 1
11 1 F-3 2 EQ 1
12 1 F-3 2 EQ 1
13 1 F-3 2 EQ 1
Page 382
Smarter Balanced 2014-15 and 2015-16 Interim Assessment Technical Report
Appendix C: Test Maps
C-52
Grade 3 Mathematics- Operations and Algebraic Thinking
Interim Assessment Block Test Map
Item
Sequence Claim Target DOK Item Type
Point
Value
1 1
A-3,
B-4 1 EQ 1
2 1 D-3 2 TI 1
3 1
A-4,
D-3 2 EQ 1
4 2 A 2 EQ 1
5 1 A-3 1 EQ 1
6 1 A-3 1 EQ 1
7 3 E 3 MC4 1
8 1 D-3 2 EQ 1
9 1 C-3 1 EQ 1
10 1 A-3 1 EQ 1
11 1 D-3 2 TI 1
12 1 C-3 1 EQ 1
13 1 B-3 1 MI 1
14 4 E 3 MC4 1
15 1 A-3 1 EQ 1
Page 383
Smarter Balanced 2014-15 and 2015-16 Interim Assessment Technical Report
Appendix C: Test Maps
C-53
Grade 3 Mathematics- Performance Task - Order Form
Interim Assessment Block Test Map
Item
Sequence Claim Target DOK Item Type
Point
Value
1 4 A 2 EQ 1
2 2 A 2 EQ 1
3 3 E 3 SA 2
4 3 E 3 SA 2
5 2 A 2 SA 1
6 4 A 3 SA 2
Grade 4 Math IABs
Grade 4 Mathematics- Number and Operations in Base Ten
Interim Assessment Block Test Map
Item
Sequence Claim Target DOK Item Type
Point
Value
1 1
D-5,
E-4 1 EQ 1
2 1 E-4 2 MC4 1
3 1 D-4 2 EQ 1
4 1 E-4 1 MC4 1
5 1 E-4 1 EQ 1
6 1 E-4 2 MC4 1
7 1 D-4 1 EQ 1
Page 384
Smarter Balanced 2014-15 and 2015-16 Interim Assessment Technical Report
Appendix C: Test Maps
C-54
Grade 4 Mathematics- Number and Operations in Base Ten
Interim Assessment Block Test Map
Item
Sequence Claim Target DOK Item Type
Point
Value
8 1 D-4 2 MI 1
9 1 E-4 1 EQ 1
10 1 E-4 2 MC4 1
11 1 D-4 2 MI 1
12 1 D-4 1 EQ 1
13 2 D 2 MS4 1
14 3 C 3 MS5 1
15 3 D 3 MC4 1
Grade 4 Mathematics- Number and Operations - Fractions
Interim Assessment Block Test Map
Item
Sequence Claim Target DOK Item Type
Point
Value
1 1
H-4,
C-5,
D-6 2 EQ 1
2 1 G-4 1 EQ 1
3 3 D 3 MS5 1
4 1 F-4 2 EQ 1
5 1 F-4 1 EQ 1
Page 385
Smarter Balanced 2014-15 and 2015-16 Interim Assessment Technical Report
Appendix C: Test Maps
C-55
Grade 4 Mathematics- Number and Operations - Fractions
Interim Assessment Block Test Map
Item
Sequence Claim Target DOK Item Type
Point
Value
6 1 F-4 2 EQ 1
7 1 F-4 2 MI 1
8 1 G-4 2 MI 1
9 1 F-4 1 MI 1
10 3 C 3 MS4 1
11 1 G-4 1 EQ 1
12 1 G-4 1 EQ 1
13 2 G-4 1 EQ 1
14 3 F-4 2 MI 1
15 3 G-4 2 MI 1
16 2 A 3 EQ 1
Page 386
Smarter Balanced 2014-15 and 2015-16 Interim Assessment Technical Report
Appendix C: Test Maps
C-56
Grade 4 Mathematics- Operations and Algebraic Thinking
Interim Assessment Block Test Map
Item
Sequence Claim Target DOK Item Type
Point
Value
1 1
D-3, A-
4 1 EQ 1
2 1 B-4 2 MI 1
3 3 B-4 1 MC4 1
4 1 A-4 1 EQ 1
5 4 A 2 EQ 1
6 1 A-4 1 EQ 1
7 4 F 2 EQ 1
8 1 C-4 2 MC4 1
9 2 D 2 MI 1
10 1 B-4 2 MI 1
11 1 B-4 1 MC4 1
12 3 F 3 MC4 1
13 4 E 3 EQ 1
14 3 F 2 MC4 1
15 1 A-4 1 EQ 1
Page 387
Smarter Balanced 2014-15 and 2015-16 Interim Assessment Technical Report
Appendix C: Test Maps
C-57
Grade 4 Mathematics- Performance Task - Animal Jumping
Interim Assessment Block Test Map
Item
Sequence Claim Target DOK Item Type
Point
Value
1 4 A 2 EQ 1
2 2 A 2 MC4 1
3 2 A 2 TI 2
4 3 E 3 SA 1
5 3 B 3 SA 1
6 4 E 3 SA 3
Grade 5 Math IABs
Grade 5 Mathematics- Measurement and Data
Interim Assessment Block Test Map
Item
Sequence Claim Target DOK Item Type
Point
Value
1 1 I-5 2 EQ 1
2 1 I-5 2 EQ 1
3 3 E 3 MC4 1
4 1 I-5 1 EQ 1
5 1 I-5 1 EQ 1
6 1 H-5 2 EQ 1
Page 388
Smarter Balanced 2014-15 and 2015-16 Interim Assessment Technical Report
Appendix C: Test Maps
C-58
Grade 5 Mathematics- Measurement and Data
Interim Assessment Block Test Map
Item
Sequence Claim Target DOK Item Type
Point
Value
7 1 I-5 2 EQ 1
8 4 D 2 EQ 1
9 1 I-5 2 MI 1
10 2 D 2 EQ 1
11 2 D 2 EQ 1
12 3 D 2 MS5 1
13 2 D 2 EQ 2
14 2 D 2 EQ 1
Grade 5 Mathematics- Number and Operations in Base Ten
Interim Assessment Block Test Map
Item
Sequence Claim Target DOK Item Type
Point
Value
1 1 C-6 1 EQ 1
2 1 C-6 1 EQ 1
3 1 C-5 2 MI 1
4 3 E 3 MC4 1
5 4 C 2 MC4 1
Page 389
Smarter Balanced 2014-15 and 2015-16 Interim Assessment Technical Report
Appendix C: Test Maps
C-59
Grade 5 Mathematics- Number and Operations in Base Ten
Interim Assessment Block Test Map
Item
Sequence Claim Target DOK Item Type
Point
Value
6 1 C-5 1 MC4 1
7 1 D-5 1 EQ 1
8 1 C-5 2 MI 1
9 1 D-5 2 EQ 1
10 1 D-5 2 MC4 1
11 1 D-5 2 MC4 1
12 1 D-5 2 MC4 1
13 1 C-5 1 MI 1
14 3 C 3 EQ 1
15 1 D-5 2 EQ 1
16 2 A 2 EQ 1
Grade 5 Mathematics- Numbers and Operations- Fractions
Interim Assessment Block Test Map
Item
Sequence Claim Target DOK Item Type
Point
Value
1 1 C-6 2 MC4 1
2 1 F-5 1 MC4 1
Page 390
Smarter Balanced 2014-15 and 2015-16 Interim Assessment Technical Report
Appendix C: Test Maps
C-60
Grade 5 Mathematics- Numbers and Operations- Fractions
Interim Assessment Block Test Map
Item
Sequence Claim Target DOK Item Type
Point
Value
3 1 E-5 1 MC4 1
4 1 F-5 1 MC4 1
5 1 E-5 1 MC4 1
6 1 E-5 1 EQ 1
7 1 E-5 1 MC4 1
8 1 E-5 2 MC4 1
9 3 D 3 MS4 1
10 4 E 3 MC4 1
11 2 A 2 EQ 1
12 3 E 3 MS3 1
13 1 F-5 2 EQ 1
14 1 F-5 1 EQ 1
15 1 F-5 2 EQ 1
Page 391
Smarter Balanced 2014-15 and 2015-16 Interim Assessment Technical Report
Appendix C: Test Maps
C-61
Grade 5 Mathematics- Performance Task - Turtle Habitat
Interim Assessment Block Test Map
Item
Sequence Claim Target DOK Item Type
Point
Value
1 2 A 2 EQ 1
2 2 A 2 EQ 1
3 4 F 2 TI 2
4 4 A 2 EQ 3
5 3 F 3 SA 1
6 3 F 3 SA 2
Page 392
Smarter Balanced 2014-15 and 2015-16 Interim Assessment Technical Report
Appendix C: Test Maps
C-62
Grade 6 Math IABs
Grade 6 Mathematics- Expressions and Equations - Calculator
Interim Assessment Block Test Map
Item
Sequence Claim Target DOK Item Type
Point
Value
1 4 C 2 MS4 1
2 2 A 2 EQ 1
3 1 G-6 2 EQ 1
4 3 E 3 MC4 1
5 1 G-6 2 EQ 1
6 1 G-6 2 EQ 1
7 1
D-7,C-
8,G-6 2 EQ 1
Grade 6 Mathematics - Expressions and Equations - no Calculator
Interim Assessment Block Test Map
Item
Sequence Claim Target DOK Item Type
Point
Value
1 1 E-6 1 MS4 1
2 1 E-6 1 MS4 1
3 1 F-6 2 MI 1
4 1 F-6 2 MS4 1
5 1 F-6 2 MS4 1
Page 393
Smarter Balanced 2014-15 and 2015-16 Interim Assessment Technical Report
Appendix C: Test Maps
C-63
Grade 6 Mathematics - Expressions and Equations - no Calculator
Interim Assessment Block Test Map
Item
Sequence Claim Target DOK Item Type
Point
Value
6 1 E-6 1 EQ 1
7 1 F-6 2 MI 1
8 1
D-7,C-
8,F-6 1 EQ 1
Grade 6 Mathematics- Geometry Calculator
Interim Assessment Block Test Map
Item
Sequence Claim Target DOK Item Type
Point
Value
1 1 H-6 1 EQ 1
2 1 H-6 2 EQ 1
3 4 B 2 EQ 2
4 1 H-6 2 EQ 1
5 2 A 2 EQ 2
6 1 H-6 2 EQ 1
7 3 G 3 MC4 1
8 1 H-6 2 EQ 1
9 1 H-6 1 MS4 1
10 1 H-6 2 EQ 1
Page 394
Smarter Balanced 2014-15 and 2015-16 Interim Assessment Technical Report
Appendix C: Test Maps
C-64
Grade 6 Mathematics- Geometry Calculator
Interim Assessment Block Test Map
Item
Sequence Claim Target DOK Item Type
Point
Value
11 1 H-6 1 EQ 1
12 2 A 2 EQ 1
13 1 H-6 2 EQ 1
Grade 6 Mathematics- Ratios and Proportional Relationships -
Calculator
Interim Assessment Block Test Map
Item
Sequence Claim Target DOK Item Type
Point
Value
1 2 A 2 EQ 1
2 1 A-6 2 EQ 1
3 1 A-6 1 EQ 1
4 1 A-6 2 EQ 1
5 3 G 2 MI 1
6 1 A-6 2 EQ 1
7 1 A-6 2 EQ 1
8 1 A-6 2 EQ 1
9 1 A-6 2 EQ 1
10 1
A-6,A-
7 1 EQ 1
Page 395
Smarter Balanced 2014-15 and 2015-16 Interim Assessment Technical Report
Appendix C: Test Maps
C-65
Grade 6 Mathematics- Ratios and Proportional Relationships - No
Calculator
Interim Assessment Block Test Map
Item
Sequence Claim Target DOK Item Type
Point
Value
1 1
A-6,A-
7 1 EQ 1
2 1 A-6 1 EQ 1
3 1 A-6 2 EQ 1
4 1 A-6 2 EQ 1
Grade 6 Mathematics- Performance Task - Cell Phone Plan
Interim Assessment Block Test Map
Item
Sequence Claim Target DOK Item Type
Point
Value
1 2 A 2 EQ 1
2 4 F 2 EQ 1
3 2 A 2 EQ 1
4 3 A 2 EQ 1
5 4 A 2 SA 2
6 3 A 2 SA 3
Page 396
Smarter Balanced 2014-15 and 2015-16 Interim Assessment Technical Report
Appendix C: Test Maps
C-66
Grade 7 Math IABs
Grade 7 Mathematics- Expressions and Equations Calculator
Interim Assessment Block Test Map
Item
Sequence Claim Target DOK Item Type
Point
Value
1 1 D-7 2 MC4 1
2 2 A 2 EQ 1
3 1 D-7 1 EQ 1
4 4 F 3 EQ 2
5 1 D-7 2 MC4 1
6 1 D-7 2 MC4 1
7 1 D-7 2 MC4 1
8 1 D-7 1 EQ 1
9 3 E 3 MC4 1
Grade 7 Mathematics- Expressions and Equations no Calculator
Interim Assessment Block Test Map
Item
Sequence Claim Target DOK Item Type
Point
Value
1 1 C-7 2 EQ 1
2 1 C-7 1 MC4 1
3 1 C-7 2 MS4 1
4 1 C-7 1 MS4 1
Page 397
Smarter Balanced 2014-15 and 2015-16 Interim Assessment Technical Report
Appendix C: Test Maps
C-67
Grade 7 Mathematics- Expressions and Equations no Calculator
Interim Assessment Block Test Map
Item
Sequence Claim Target DOK Item Type
Point
Value
5 1 C-7 2 MS4 1
6 1 D-7 1 EQ 1
Grade 7 Mathematics- The Number System Calculator
Interim Assessment Block Test Map
Item
Sequence Claim Target DOK Item Type
Point
Value
1 1 D-7 1 EQ 1
2 4 C 2 EQ 1
3 3 G 3 MS5 1
4 3 D 3 MC4 1
Grade 7 Mathematics- The Number System no Calculator
Interim Assessment Block Test Map
Item
Sequence Claim Target DOK Item Type
Point
Value
1 1 B-7 1 MC4 1
2 1 B-7 1 EQ 1
3 1 B-7 1 MS4 1
4 1 B-7 2 EQ 1
Page 398
Smarter Balanced 2014-15 and 2015-16 Interim Assessment Technical Report
Appendix C: Test Maps
C-68
Grade 7 Mathematics- The Number System no Calculator
Interim Assessment Block Test Map
Item
Sequence Claim Target DOK Item Type
Point
Value
5 1 B-7 2 MI 1
6 1 B-7 1 MC4 1
7 1 B-7 1 EQ 1
8 1 B-7 2 EQ 1
9 1 B-7 1 EQ 1
10 1 B-7 1 MC4 1
Grade 7 Mathematics- Ratios and Proportional Relationships
Calculator
Interim Assessment Block Test Map
Item
Sequence Claim Target DOK Item Type
Point
Value
1 1 A-7 2 EQ 1
2 2 A 2 MC4 1
3 1 A-7 2 MC4 1
4 1 A-7 2 EQ 1
5 1 A-7 2 EQ 1
6 1 A-7 2 MS4 1
7 3 D 2 MC4 1
Page 399
Smarter Balanced 2014-15 and 2015-16 Interim Assessment Technical Report
Appendix C: Test Maps
C-69
Grade 7 Mathematics- Ratios and Proportional Relationships
Calculator
Interim Assessment Block Test Map
Item
Sequence Claim Target DOK Item Type
Point
Value
8 1 A-7 2 EQ 1
9 1 A-7 2 EQ 1
10 4 E 3 MC4 1
11 1 A-7 2 EQ 1
12 1 A-7 2 EQ 1
13 1 A-7 2 MC3 1
14 1 A-7 2 EQ 1
Grade 7 Mathematics- Performance Task - Camping Tasks
Interim Assessment Block Test Map
Item
Sequence Claim Target DOK Item Type
Point
Value
1 2 A 2 EQ 1
2 4 A 2 MC4 1
3 3 E 3 SA 2
4 2 A 2 TI 1
5 4 A 2 TI 1
6 3 B 3 SA 2
Page 400
Smarter Balanced 2014-15 and 2015-16 Interim Assessment Technical Report
Appendix C: Test Maps
C-70
Grade 8 Math IABs
Grade 8 Mathematics- Expressions and Equations Calculator
Interim Assessment Block Test Map
Item
Sequence Claim Target DOK Item Type
Point
Value
1 1 D-8 2 MC4 1
2 1 D-8 2 EQ 1
3 4 C 2 MC4 1
4 1 D-8 2 MS4 1
5 1 J-8 2 EQ 2
6 1 D-8 1 EQ 1
7 1 J-8 2 EQ 2
8 1 D-8 2 MC4 1
9 2 C 2 EQ 1
10 1 J-8 2 EQ 2
11 1 D-8 2 MC4 1
Page 401
Smarter Balanced 2014-15 and 2015-16 Interim Assessment Technical Report
Appendix C: Test Maps
C-71
Grade 8 Mathematics- Expressions and Equations no Calculator
Interim Assessment Block Test Map
Item
Sequence Claim Target DOK Item Type
Point
Value
1 1 C-8 2 EQ 1
2 1 C-8 2 EQ 1
3 1 B-8 1 MC4 1
Grade 8 Mathematics- Functions Calculator
Interim Assessment Block Test Map
Item
Sequence Claim Target DOK Item Type
Point
Value
1 1 F-8 2 EQ 1
2 1 E-8 1 MS4 1
3 2 D 2 MC4 1
4 4 D 2 MI 1
5 1 F-8 2 EQ 1
6 1 E-8 2 MC4 1
7 1 E-8 1 MS4 1
8 1 E-8 1 MS4 1
9 1 E-8 1 MS4 1
10 1 E-8 2 MC4 1
Page 402
Smarter Balanced 2014-15 and 2015-16 Interim Assessment Technical Report
Appendix C: Test Maps
C-72
Grade 8 Mathematics- Functions Calculator
Interim Assessment Block Test Map
Item
Sequence Claim Target DOK Item Type
Point
Value
11 1 E-8 2 MC4 1
12 3 A 2 MC4 1
13 3 E 3 MC4 1
14 1 E-8 2 MC4 1
15 1 F-8 1 EQ 1
Grade 8 Mathematics- Functions Calculator
Interim Assessment Block Test Map
Item
Sequence Claim Target DOK Item Type
Point
Value
1 4 E 3 MS4 1
2 1 G-8 2 MI 1
3 1 H-8 2 EQ 1
4 1 H-8 2 MC4 1
5 1 I-8 2 EQ 1
6 1 G-8 2 EQ 1
7 1 H-8 2 MC4 1
8 1 G-8 2 MI 1
9 1 G-8 2 MI 1
Page 403
Smarter Balanced 2014-15 and 2015-16 Interim Assessment Technical Report
Appendix C: Test Maps
C-73
Grade 8 Mathematics- Functions Calculator
Interim Assessment Block Test Map
Item
Sequence Claim Target DOK Item Type
Point
Value
10 3 G 2 MC4 1
11 1 H-8 2 EQ 1
12 1 G-8 1 MI 1
13 1 I-8 2 EQ 1
14 1 G-8 1 MI 1
Grade 8 Mathematics- Performance Task - Baseball Tickets
Interim Assessment Block Test Map
Item
Sequence Claim Target DOK Item Type
Point
Value
1 2 A 2 EQ 1
2 2 A 2 TI 2
3 4 A 2 EQ 1
4 4 E 3 EQ 1
5 3 A 3 SA 2
6 3 F 3 SA 1
Page 404
Smarter Balanced 2014-15 and 2015-16 Interim Assessment Technical Report
Appendix C: Test Maps
C-74
Grade 11 Math IABs
Grade 11 Mathematics- Algebra and Functions I - Linear Functions,
Equations, and Inequalities (Calculator)
Interim Assessment Block Test Map
Item
Sequence Claim Target DOK Item Type
Point
Value
1 1 J 2 MC4 1
2 1 G 2 EQ 1
3 4 E 3 MC4 1
4 2 A 2 EQ 2
5 1 J 2 MC4 1
6 1 M 2 MI 1
7 3 E 3 MC4 1
8 4 D 3 EQ 1
9 2 A 2 EQ 2
10 1 N 2 MI 1
11 2 A 2 MS6 1
12 1 G 2 EQ 1
13 1 L 1 MI 1
14 2 A 2 EQ 2
Page 405
Smarter Balanced 2014-15 and 2015-16 Interim Assessment Technical Report
Appendix C: Test Maps
C-75
Grade 11 Mathematics- Algebra and Functions I - Linear Functions,
Equations, and Inequalities (no Calculator)
Interim Assessment Block Test Map
Item
Sequence Claim Target DOK Item Type
Point
Value
1 1 I 2 MC4 1
Grade 11 Mathematics- Algebra and Functions II - Quadratic
Functions, Equations, and Inequalities (Calculator)
Interim Assessment Block Test Map
Item
Sequence Claim Target DOK Item Type
Point
Value
1 1 J 2 MC4 1
2 1 L 1 MI 1
3 1 N 2 MC4 1
4 1 J 1 MS6 1
5 4 D 3 MC4 1
6 1 M 2 MI 1
7 1 G 1 EQ 1
8 4 A 3 MI 1
9 4 F 2 MC4 1
Page 406
Smarter Balanced 2014-15 and 2015-16 Interim Assessment Technical Report
Appendix C: Test Maps
C-76
Grade 11 Mathematics- Algebra and Functions II - Quadratic
Functions, Equations, and Inequalities (no Calculator)
Interim Assessment Block Test Map
Item
Sequence Claim Target DOK
Item
Type
Point
Value
1 3 A 2 MC4 1
2 1 I 2 MC4 1
Grade 11 Mathematics- Geometry and Right Triangle Trigonometry
(Calculator)
Interim Assessment Block Test Map
Item
Sequence Claim Target DOK Item Type
Point
Value
1 1 O 1 MI 1
2 1 O 1 EQ 1
3 1 O 1 MI 1
4 1 O 1 MI 1
5 1 O 2 EQ 1
6 1 O 2 EQ 1
7 1 O 2 EQ 1
8 1 O 1 MS6 1
9 1 O 2 EQ 1
10 1 O 2 EQ 1
11 1 O 2 EQ 1
Page 407
Smarter Balanced 2014-15 and 2015-16 Interim Assessment Technical Report
Appendix C: Test Maps
C-77
Grade 11 Mathematics- Geometry and Right Triangle Trigonometry
(Calculator)
Interim Assessment Block Test Map
Item
Sequence Claim Target DOK Item Type
Point
Value
12 1 O 1 MI 1
13 1 O 2 EQ 1
Grade 11 Mathematics- Performance Task - Teen Driving
Restriction
Interim Assessment Block Test Map
Item
Sequence Claim Target DOK Item Type
Point
Value
1 2 C 2 MC4 1
2 3 E 2 SA 2
3 4 D 2 SA 2
4 3 E 2 SA 2
5 4 A 2 EQ 1
6 4 A 3 SA 3
Page 408
Smarter Balanced 2014-15 and 2015-16 Interim Assessment Technical Report
Appendix C: Test Maps
C-78
Grade 3 ELA ICAs
Grade 3 ELA/literacy
Interim Comprehensive Assessments Test Map
Item
Sequence Claim Target DOK Item Type
Point
Value
1 2 9 1 MC4 1
2 4 2 2 MS6 1
3 2 9 1 MC4 1
4 1 3 1 MC4 1
5 1 1 2 MC4 1
6 1 2 2 HTQ 1
7 1 4 3 EBSR4 1
8 2 8 1 MC4 1
9 3 4 1 MI 1
10 3 4 1 MC4 1
11 3 4 3 MS5 1
12 4 3 2 MC4 1
13 2 6 2 MC4 1
14 1 10 2 MC4 1
15 1 12 3 MC4 1
16 1 14 2 MC4 1
Page 409
Smarter Balanced 2014-15 and 2015-16 Interim Assessment Technical Report
Appendix C: Test Maps
C-79
Grade 3 ELA/literacy
Interim Comprehensive Assessments Test Map
Item
Sequence Claim Target DOK Item Type
Point
Value
17 1 9 2 MC4 1
18 1 13 2 MC4 1
19 1 9 3 SA 2
20 2 9 1 MC4 1
21 3 4 3 MC4 1
22 3 4 3 EBSR4 1
23 3 4 1 MI 1
24 4 3 2 MC4 1
25 2 3 2 MC4 1
26 1 7 2 MC4 1
27 1 6 2 MC4 1
28 1 1 2 MC4 1
29 1 5 3 HTQ 1
30 1 2 2 HTQ 1
31 1 4 3 SA 2
32 2 1 3 SA 2
33 3 4 3 MC4 1
Page 410
Smarter Balanced 2014-15 and 2015-16 Interim Assessment Technical Report
Appendix C: Test Maps
C-80
Grade 3 ELA/literacy
Interim Comprehensive Assessments Test Map
Item
Sequence Claim Target DOK Item Type
Point
Value
34 3 4 1 MI 1
35 3 4 3 EBSR4 1
36 4 2 2 MC4 1
37 2 8 2 MC4 1
38 1 9 2 MC4 1
39 1 14 3 MC4 1
40 1 11 3 EBSR4 1
41 1 9 2 EBSR4 1
42 2 9 1 HTQ 1
43 4 4 2 MC4 1
Grade 3 ELA/literacy- Performance Task - Animals With Shells A
Interim Comprehensive Assessments Test Map
Item Sequence Claim Target DOK Item Type Point
Value
1 4 2 3 SA 2
2 4 4 3 SA 2
3 4 4 3 MI 1
Page 411
Smarter Balanced 2014-15 and 2015-16 Interim Assessment Technical Report
Appendix C: Test Maps
C-81
Grade 3 ELA/literacy- Performance Task - Animals With Shells B
Interim Comprehensive Assessments Test Map
Item
Sequence Claim Target DOK Item Type
Point
Value
1 2 7 4 WER 1
Grade 4 ELA ICAs
Grade 4 ELA/literacy
Interim Comprehensive Assessments Test Map
Item
Sequence Claim Target DOK Item Type
Point
Value
1 2 9 1 MC4 1
2 4 3 2 MC4 1
3 2 8 1 MC4 1
4 1 3 2 MC4 1
5 1 7 2 MC4 1
6 1 4 3 EBSR4 1
7 1 2 2 MC4 1
8 1 1 2 HTQ 1
9 2 9 1 MC4 1
10 3 4 2 MC4 1
11 3 4 3 EBSR4 1
12 3 4 2 MC4 1
Page 412
Smarter Balanced 2014-15 and 2015-16 Interim Assessment Technical Report
Appendix C: Test Maps
C-82
Grade 4 ELA/literacy
Interim Comprehensive Assessments Test Map
Item
Sequence Claim Target DOK Item Type
Point
Value
13 4 4 2 MS6 1
14 2 1 2 MC4 1
15 1 14 2 MC4 1
16 1 8 2 MC4 1
17 2 9 1 HTQ 1
18 3 4 1 MC4 1
19 3 4 3 MC4 1
20 3 4 3 MS5 1
21 4 3 2 MC4 1
22 2 9 1 MC4 1
23 1 4 3 SA 2
24 1 6 3 MC4 1
25 1 2 2 MC4 1
26 1 7 2 MS6 1
27 1 3 2 MS6 1
28 2 9 1 MC4 1
29 3 4 2 MC4 1
Page 413
Smarter Balanced 2014-15 and 2015-16 Interim Assessment Technical Report
Appendix C: Test Maps
C-83
Grade 4 ELA/literacy
Interim Comprehensive Assessments Test Map
Item
Sequence Claim Target DOK Item Type
Point
Value
30 3 4 3 MS6 1
31 3 4 3 MI 1
32 4 2 2 MI 1
33 2 1 3 SA 2
34 1 10 2 MC4 1
35 1 13 2 MC4 1
36 1 11 3 HTQ 1
37 2 8 1 MC4 1
38 4 2 2 MC6 1
39 2 3 2 HTQ 1
40 1 9 3 SA 2
41 1 10 2 HTQ 1
42 1 13 2 MC4 1
43 1 11 3 EBSR4 1
44 1 8 1 MC4 1
Page 414
Smarter Balanced 2014-15 and 2015-16 Interim Assessment Technical Report
Appendix C: Test Maps
C-84
Grade 4 ELA/literacy- Performance Task - Uncommon Animals A
Interim Comprehensive Assessments Test Map
Item
Sequence Claim Target DOK Item Type
Point
Value
1 4 2 3 SA 2
2 4 4 3 SA 2
3 4 4 3 MI 1
Grade 4 ELA/literacy- Performance Task - Uncommon Animals B
Interim Comprehensive Assessments Test Map
Item
Sequence Claim Target DOK Item Type
Point
Value
1 2 2 4 WER 1
Grade 5 ELA ICAs
Grade 5 ELA/literacy
Interim Comprehensive Assessments Test Map
Item
Sequence Claim Target DOK Item Type
Point
Value
1 2 8 1 MC4 1
2 4 4 2 MC4 1
3 2 3 2 MC4 1
4 2 9 1 MC4 1
5 3 4 3 MC4 1
Page 415
Smarter Balanced 2014-15 and 2015-16 Interim Assessment Technical Report
Appendix C: Test Maps
C-85
Grade 5 ELA/literacy
Interim Comprehensive Assessments Test Map
Item
Sequence Claim Target DOK Item Type
Point
Value
6 3 4 2 MC4 1
7 3 4 3 EBSR4 1
8 4 3 2 MC4 1
9 2 3 2 MS6 1
10 1 3 1 MC4 1
11 1 6 2 MC4 1
12 1 4 3 HTQ 1
13 1 5 3 EBSR4 1
14 1 1 2 MS6 1
15 2 8 2 MC4 1
16 3 4 3 EBSR4 1
17 3 4 2 MC4 1
18 3 4 1 MI 1
19 4 3 2 MC4 1
20 2 9 1 MC4 1
21 1 12 3 MC4 1
22 1 10 2 HTQ 1
Page 416
Smarter Balanced 2014-15 and 2015-16 Interim Assessment Technical Report
Appendix C: Test Maps
C-86
Grade 5 ELA/literacy
Interim Comprehensive Assessments Test Map
Item
Sequence Claim Target DOK Item Type
Point
Value
23 1 11 3 EBSR4 1
24 1 8 1 HTQ 1
25 1 14 3 MS5 1
26 1 11 3 SA 2
27 2 9 1 MC4 1
28 3 4 1 MI 1
29 3 4 2 MC4 1
30 3 4 3 EBSR4 1
31 4 2 2 MC4 1
32 2 6 3 SA 2
33 1 11 3 EBSR4 1
34 1 8 1 HTQ 1
35 1 13 2 MC4 1
36 1 9 2 EBSR4 1
37 2 9 1 HTQ 1
38 4 2 2 MS6 1
39 2 9 1 MC4 1
Page 417
Smarter Balanced 2014-15 and 2015-16 Interim Assessment Technical Report
Appendix C: Test Maps
C-87
Grade 5 ELA/literacy
Interim Comprehensive Assessments Test Map
Item
Sequence Claim Target DOK Item Type
Point
Value
40 1 3 1 MC4 1
41 1 7 2 MC4 1
42 1 3 2 MS5 1
43 1 2 3 SA 2
Grade 5 ELA/literacy- Performance Task -Marine Animal A
Interim Comprehensive Assessments Test Map
Item
Sequence Claim Target DOK Item Type
Point
Value
1 4 4 3 SA 2
2 4 2 3 MS6 1
3 4 2 3 SA 2
Grade 5 ELA/literacy- Performance Task - Marine Animal B
Interim Comprehensive Assessments Test Map
Item
Sequence Claim Target DOK Item Type
Point
Value
1 2 2 4 WER 1
Page 418
Smarter Balanced 2014-15 and 2015-16 Interim Assessment Technical Report
Appendix C: Test Maps
C-88
Grade 6 ELA ICAs
Grade 6 ELA/literacy
Interim Comprehensive Assessments Test Map
Item Sequence Claim Target DOK Item Type Point
Value
1 2 8 1 MC4 1
2 4 2 2 MC4 1
3 2 9 1 MC4 1
4 1 8 2 HTQ 1
5 1 9 2 EBSR4 1
6 1 14 3 MC4 1
7 1 10 1 MS5 1
8 2 1 2 MC4 1
9 3 4 2 MC4 1
10 3 4 1 MI 1
11 3 4 3 EBSR4 1
12 4 4 2 HTQ 1
13 2 9 1 MC4 1
14 1 6 2 MC4 1
15 1 3 1 MC4 1
16 1 3 2 MC4 1
Page 419
Smarter Balanced 2014-15 and 2015-16 Interim Assessment Technical Report
Appendix C: Test Maps
C-89
Grade 6 ELA/literacy
Interim Comprehensive Assessments Test Map
Item Sequence Claim Target DOK Item Type Point
Value
17 1 5 3 MC4 1
18 1 4 3 HTQ 1
19 2 9 1 MC4 1
20 3 4 1 MC4 1
21 3 4 3 MC4 1
22 3 4 3 EBSR4 1
23 4 2 2 HTQ 1
24 2 3 2 MC4 1
25 1 3 2 MC4 1
26 1 2 2 HTQ 1
27 1 6 3 MC4 1
28 1 2 3 SA 2
29 2 8 2 MS6 1
30 3 4 3 MC4 1
31 3 4 3 MC4 1
32 3 4 2 MS6 1
33 4 3 2 MC4 1
Page 420
Smarter Balanced 2014-15 and 2015-16 Interim Assessment Technical Report
Appendix C: Test Maps
C-90
Grade 6 ELA/literacy
Interim Comprehensive Assessments Test Map
Item Sequence Claim Target DOK Item Type Point
Value
34 2 9 1 HTQ 1
35 1 9 3 SA 2
36 1 8 2 MS6 1
37 1 14 3 MC4 1
38 1 13 3 MC4 1
39 2 1 3 SA 2
40 4 4 2 HTQ 1
41 2 8 2 MS6 1
42 1 10 2 HTQ 1
43 1 9 2 MC4 1
44 1 11 3 EBSR4 1
45 1 14 3 MS6 1
Page 421
Smarter Balanced 2014-15 and 2015-16 Interim Assessment Technical Report
Appendix C: Test Maps
C-91
Grade 6 ELA/literacy- Performance Task - Importance Of Nutrition
A
Interim Comprehensive Assessments Test Map
Item
Sequence Claim Target DOK
Item
Type
Point
Value
1 4 4 3 SA 2
2 4 3 4 SA 2
Grade 6 ELA/literacy- Performance Task - Importance Of Nutrition
B
Interim Comprehensive Assessments Test Map
Item
Sequence Claim Target DOK
Item
Type
Point
Value
1 2 7 4 WER 1
Grade 7 ELA ICAs
Grade 7 ELA/literacy
Interim Comprehensive Assessments Test Map
Item
Sequence Claim Target DOK Item Type
Point
Value
1 2 8 2 MC4 1
2 4 4 2 MC4 1
3 2 1 2 MC4 1
4 1 8 2 HTQ 1
5 1 11 4 EBSR4 1
Page 422
Smarter Balanced 2014-15 and 2015-16 Interim Assessment Technical Report
Appendix C: Test Maps
C-92
Grade 7 ELA/literacy
Interim Comprehensive Assessments Test Map
Item
Sequence Claim Target DOK Item Type
Point
Value
6 2 1 3 SA 2
7 3 4 3 MC4 1
8 3 4 2 MC4 1
9 3 4 1 MS6 1
10 4 3 2 MC4 1
11 2 9 1 MS5 1
12 1 3 2 HTQ 1
13 1 2 2 MC4 1
14 1 5 3 MC4 1
15 1 4 3 EBSR4 1
16 1 6 3 MC4 1
17 2 9 1 MC4 1
18 3 4 3 MC4 1
19 3 4 1 MC4 1
20 3 4 3 MS5 1
21 4 2 2 MC4 1
22 2 9 1 MC4 1
Page 423
Smarter Balanced 2014-15 and 2015-16 Interim Assessment Technical Report
Appendix C: Test Maps
C-93
Grade 7 ELA/literacy
Interim Comprehensive Assessments Test Map
Item
Sequence Claim Target DOK Item Type
Point
Value
23 1 4 4 SA 2
24 1 6 2 MC4 1
25 1 7 3 MC4 1
26 2 9 1 MC4 1
27 3 4 2 MC4 1
28 3 4 3 MC4 1
29 3 4 2 MS6 1
30 4 2 2 MC4 1
31 2 6 2 HTQ 1
32 1 8 2 MC4 1
33 1 11 4 EBSR4 1
34 1 14 3 MC4 1
35 1 13 3 MS6 1
36 1 9 2 MS6 1
37 2 8 2 HTQ 1
38 4 2 2 HTQ 1
39 2 9 1 MS6 1
Page 424
Smarter Balanced 2014-15 and 2015-16 Interim Assessment Technical Report
Appendix C: Test Maps
C-94
Grade 7 ELA/literacy
Interim Comprehensive Assessments Test Map
Item
Sequence Claim Target DOK Item Type
Point
Value
40 1 9 2 EBSR4 1
41 1 10 1 HTQ 1
42 1 8 2 HTQ 1
43 1 8 2 MS6 1
44 1 11 4 SA 2
Grade 7 ELA/literacy- Performance Task - Technology In The
Classroom A
Interim Comprehensive Assessments Test Map
Item
Sequence Claim Target DOK
Item
Type
Point
Value
1 4 4 3 SA 2
2 4 2 4 SA 2
3 4 4 3 MI 1
Grade 7 ELA/literacy- Performance Task - Technology In The
Classroom B
Interim Comprehensive Assessments Test Map
Item
Sequence Claim Target DOK
Item
Type
Point
Value
1 2 4 4 WER 1
Grade 8 ELA ICAs
Page 425
Smarter Balanced 2014-15 and 2015-16 Interim Assessment Technical Report
Appendix C: Test Maps
C-95
Grade 8 ELA/literacy
Interim Comprehensive Assessments Test Map
Item
Sequence Claim Target DOK Item Type
Point
Value
1 2 8 2 MC4 1
2 4 3 2 MC4 1
3 2 8 2 MC4 1
4 1 14 3 MC4 1
5 1 8 2 MC4 1
6 1 12 4 EBSR4 1
7 1 11 3 EBSR4 1
8 2 9 1 MC4 1
9 3 4 1 MC4 1
10 3 4 3 MC4 1
11 3 4 2 MC4 1
12 4 4 2 HTQ 1
13 2 9 1 MC4 1
14 1 1 2 MC4 1
15 1 7 3 MC4 1
16 1 3 2 MC4 1
17 1 4 3 SA 2
Page 426
Smarter Balanced 2014-15 and 2015-16 Interim Assessment Technical Report
Appendix C: Test Maps
C-96
Grade 8 ELA/literacy
Interim Comprehensive Assessments Test Map
Item
Sequence Claim Target DOK Item Type
Point
Value
18 2 9 1 MS6 1
19 3 4 2 MC4 1
20 3 4 2 MC4 1
21 3 4 3 MC4 1
22 4 4 2 MC4 1
23 2 9 1 HTQ 1
24 1 7 3 MC4 1
25 1 6 2 MC4 1
26 1 1 2 MS6 1
27 1 4 4 HTQ 1
28 2 9 1 MC4 1
29 3 4 2 MC4 1
30 3 4 3 MC4 1
31 3 4 3 MC4 1
32 4 2 2 HTQ 1
33 2 1 2 HTQ 1
34 1 9 2 MC4 1
Page 427
Smarter Balanced 2014-15 and 2015-16 Interim Assessment Technical Report
Appendix C: Test Maps
C-97
Grade 8 ELA/literacy
Interim Comprehensive Assessments Test Map
Item
Sequence Claim Target DOK Item Type
Point
Value
35 1 8 2 HTQ 1
36 1 11 4 HTQ 1
37 1 10 1 MC4 1
38 2 6 3 SA 2
39 4 3 2 MC4 1
40 2 1 2 MS5 1
41 1 10 1 MS5 1
42 1 9 2 MC4 1
43 1 11 4 SA 2
44 1 8 2 HTQ 1
45 1 8 2 MC4 1
Page 428
Smarter Balanced 2014-15 and 2015-16 Interim Assessment Technical Report
Appendix C: Test Maps
C-98
Grade 8 ELA/literacy- Performance Task - Archeological
Discoveries A
Interim Comprehensive Assessments Test Map
Item
Sequence Claim Target DOK
Item
Type
Point
Value
1 4 2 3 MS6 1
2 4 2 4 SA 2
3 4 4 3 SA 2
Grade 8 ELA/literacy- Performance Task - Archeological
Discoveries B
Interim Comprehensive Assessments Test Map
Item
Sequence Claim Target DOK
Item
Type
Point
Value
1 2 7 4 WER 1
Grade 11 ELA ICAs
Grade 11 ELA/literacy
Interim Comprehensive Assessments Test Map
Item
Sequence Claim Target DOK Item Type
Point
Value
1 2 8 2 MC4 1
2 4 2 2 MC4 1
3 2 9 1 MC4 1
4 1 10 2 MC4 1
Page 429
Smarter Balanced 2014-15 and 2015-16 Interim Assessment Technical Report
Appendix C: Test Maps
C-99
Grade 11 ELA/literacy
Interim Comprehensive Assessments Test Map
Item
Sequence Claim Target DOK Item Type
Point
Value
5 1 11 3 HTQ 1
6 1 8 2 MC4 1
7 2 8 2 HTQ 1
8 3 4 1 MC4 1
9 3 4 3 MC4 1
10 3 4 2 MC4 1
11 4 3 2 MC4 1
12 2 1 2 MC4 1
13 1 10 1 MC4 1
14 1 14 3 MC4 1
15 1 8 2 HTQ 1
16 2 9 1 MC4 1
17 3 4 2 MS6 1
18 3 4 3 MC4 1
19 3 4 1 MC4 1
20 3 4 3 MS5 1
21 3 4 3 MC4 1
Page 430
Smarter Balanced 2014-15 and 2015-16 Interim Assessment Technical Report
Appendix C: Test Maps
C-100
Grade 11 ELA/literacy
Interim Comprehensive Assessments Test Map
Item
Sequence Claim Target DOK Item Type
Point
Value
22 3 4 1 MI 1
23 4 2 2 MC4 1
24 2 3 3 SA 2
25 1 14 3 MC4 1
26 1 8 2 MC4 1
27 1 11 3 HTQ 1
28 2 9 1 HTQ 1
29 4 4 2 MC4 1
30 2 9 1 HTQ 1
31 1 10 2 MC4 1
32 1 9 2 HTQ 1
33 1 8 2 MC4 1
34 1 9 3 SA 2
35 2 9 1 MC4 1
36 4 4 2 MC4 1
37 1 6 4 MC4 1
38 1 3 1 MC4 1
Page 431
Smarter Balanced 2014-15 and 2015-16 Interim Assessment Technical Report
Appendix C: Test Maps
C-101
Grade 11 ELA/literacy
Interim Comprehensive Assessments Test Map
Item
Sequence Claim Target DOK Item Type
Point
Value
39 1 4 3 EBSR4 1
40 1 7 3 MC4 1
41 1 4 4 SA 2
42 1 7 3 MC4 1
Grade 11 ELA/literacy- Performance Task -How We Learn A
Interim Comprehensive Assessments Test Map
Item
Sequence Claim Target DOK
Item
Type Point Value
1 4 4 3 MI 1
2 4 3 4 SA 2
3 4 2 4 SA 2
Grade 11 ELA/literacy- Performance Task -How We Learn B
Interim Comprehensive Assessments Test Map
Item Sequence Claim Target DOK Item Type Point
Value
1 2 4 4 WER 1
Grade 3 Math ICAs
Page 432
Smarter Balanced 2014-15 and 2015-16 Interim Assessment Technical Report
Appendix C: Test Maps
C-102
Grade 3 Mathematics
Interim Comprehensive Assessments Test Map
Item
Sequence Claim Target DOK Item Type Point Value
1 1
A-4,D-
3 2 EQ 1
2 1 A-3 1 EQ 1
3 1 I-3 2 EQ 1
4 1 C-3 1 EQ 1
5 1 D-3 2 TI 1
6 1 D-3 2 EQ 1
7 1 A-3 1 EQ 1
8 1 I-3 2 EQ 1
9 3 D 2 MI 1
10 1 E-3 1 EQ 1
11 1 A-3 1 EQ 1
12 3 E 2 MC4 1
13 1 D-3 2 TI 1
14 1 C-3 1 EQ 1
15 3 C 2 MC4 1
16 1 H-3 2 EQ 1
17 1 B-3 1 MI 1
Page 433
Smarter Balanced 2014-15 and 2015-16 Interim Assessment Technical Report
Appendix C: Test Maps
C-103
Grade 3 Mathematics
Interim Comprehensive Assessments Test Map
Item
Sequence Claim Target DOK Item Type Point Value
18 3 D 3 MI 1
19 3 E 3 MC4 1
20 4 E 3 MC4 1
21 1 J-3 1 EQ 2
22 2 D 2 MC4 1
23 4 F 2 MC4 1
24 1 F-3 1 EQ 1
25 2 A 2 EQ 1
26 4 D 2 EQ 1
27 1 I-3 2 EQ 1
28 3 C 3 MS4 1
29 1 E-3 1 EQ 1
30 1 F-3 2 EQ 1
31 1 J-3 1 EQ 2
Page 434
Smarter Balanced 2014-15 and 2015-16 Interim Assessment Technical Report
Appendix C: Test Maps
C-104
Grade 3 Mathematics- Performance Task - Order Form
Interim Comprehensive Assessments Test Map
Item
Sequence Claim Target DOK Item Type
Point
Value
1 4 A 2 EQ 1
2 2 A 2 EQ 1
3 3 E 3 SA 2
4 3 E 3 SA 2
5 2 A 2 SA 1
6 4 A 3 SA 2
Grade 4 Math ICAs
Grade 4 Mathematics
Interim Comprehensive Assessments Test Map
Item
Sequence Claim Target DOK Item Type
Point
Value
1 1
E-5,G-
4 2 MI 1
2 1 E-4 1 EQ 1
3 1
C-5,D-
6,H-4 1 EQ 1
4 1 G-4 1 EQ 1
5 1 A-4 1 EQ 1
6 1 B-4 1 MC4 1
Page 435
Smarter Balanced 2014-15 and 2015-16 Interim Assessment Technical Report
Appendix C: Test Maps
C-105
Grade 4 Mathematics
Interim Comprehensive Assessments Test Map
Item
Sequence Claim Target DOK Item Type
Point
Value
7 4 A 2 EQ 1
8 4 E 3 MC4 1
9 1 A-4 1 EQ 1
10 1 E-4 2 MC4 1
11 3 F-4 1 MI 1
12 1 D-4 1 EQ 1
13 3 F 2 MC4 1
14 1 A-4 1 EQ 1
15 3 B 3 EQ 1
16 1 L-4 1 MI 1
17 1 F-4 2 MI 1
18 1 E-4 1 EQ 1
19 2 D 2 MI 1
20 3 D 3 MS4 1
21 3 F 2 MC4 1
22 1 G-4 1 EQ 1
23 1 I-4 1 EQ 1
Page 436
Smarter Balanced 2014-15 and 2015-16 Interim Assessment Technical Report
Appendix C: Test Maps
C-106
Grade 4 Mathematics
Interim Comprehensive Assessments Test Map
Item
Sequence Claim Target DOK Item Type
Point
Value
24 1 I-4 2 EQ 1
25 3 F 3 MC4 1
26 1 D-4 1 EQ 1
27 4 B 2 EQ 2
28 2 A 2 EQ 1
29 1 F-4 2 MI 1
30 1 K-4 2 EQ 1
Grade 4 Mathematics- Performance Task - Animal Jumping
Interim Comprehensive Assessments Test Map
Item
Sequence Claim Target DOK Item Type
Point
Value
1 4 A 2 EQ 1
2 2 A 2 MC4 1
3 2 A 2 TI 2
4 3 E 3 SA 1
5 3 B 3 SA 1
6 4 E 3 SA 3
Grade 5 Math ICAs
Page 437
Smarter Balanced 2014-15 and 2015-16 Interim Assessment Technical Report
Appendix C: Test Maps
C-107
Grade 5 Mathematics
Interim Comprehensive Assessments Test Map
Item
Sequence Claim Target DOK Item Type Point Value
1 1 F-5 1 MC4 1
2 1 C-6, D-
5 1 EQ 1
3 3 F 3 EQ 2
4 1 J-5 1 MC4 1
5 3 E 2 MC4 1
6 4 C 2 MC4 1
7 1 C-5 1 MC4 1
8 1 B-5 2 MC4 1
9 1 K-5 2 MI 1
10 1 F-5 1 MC4 1
11 1 E-5 1 MC4 1
12 3 A 2 MC4 1
13 1 C-5 2 MI 1
14 1 I-5 2 EQ 1
15 1 F-5 1 MC4 1
16 1 I-5 1 EQ 1
17 3 C 2 MC4 1
Page 438
Smarter Balanced 2014-15 and 2015-16 Interim Assessment Technical Report
Appendix C: Test Maps
C-108
Grade 5 Mathematics
Interim Comprehensive Assessments Test Map
Item
Sequence Claim Target DOK Item Type Point Value
18 3 D 2 MS4 1
19 1 E-5 1 MC4 1
20 1 K-5 2 MI 1
21 1 C-5 1 MI 1
22 1 I-5 2 MI 1
23 1 F-5 1 MC4 1
24 2 A 2 EQ 1
25 1 F-5 2 EQ 1
26 1 E-5 2 MC4 1
27 1 B-5 2 MC4 1
28 3 E 3 MS3 1
29 4 E 3 MC4 1
30 2 B 2 MC4 1
31 4 E 3 MC4 1
Grade 5 Mathematics - Performance Task - Turtle Habitat
Interim Comprehensive Assessments Test Map
Item Sequence Claim Target DOK Item Type
Point
Value
Page 439
Smarter Balanced 2014-15 and 2015-16 Interim Assessment Technical Report
Appendix C: Test Maps
C-109
1 2 A 2 EQ 1
2 2 A 2 EQ 1
3 4 F 2 TI 2
4 4 A 2 EQ 3
5 3 F 3 SA 1
6 3 F 3 SA 2
Grade 6 Math ICAs
Grade 6 Mathematics (Calculator)
Interim Comprehensive Assessments Test Map
Item
Sequence Claim Target DOK Item Type
Point
Value
1 1
D-7,
C-8,
G-6
2 EQ 1
2 1 A-6, A-
7 1 EQ 1
3 1 A-6 2 EQ 1
4 3 E 3 MC4 1
5 1 J-6 2 MC4 1
6 3 E 3 MC4 1
7 2 D 2 MC4 1
8 1 H-6 2 EQ 1
9 3 D 2 MS6 1
Page 440
Smarter Balanced 2014-15 and 2015-16 Interim Assessment Technical Report
Appendix C: Test Maps
C-110
Grade 6 Mathematics (Calculator)
Interim Comprehensive Assessments Test Map
Item
Sequence Claim Target DOK Item Type
Point
Value
10 1 G-6 2 EQ 1
11 1 H-6 1 MS4 1
12 2 A 2 EQ 2
13 3 G 2 MI 1
14 1 A-6 2 EQ 1
15 3 A 3 EQ 1
16 1 J-6 2 MI 1
17 1 A-6 2 EQ 1
18 2 A 2 EQ 1
19 2 A 2 EQ 1
20 4 C 2 MS6 1
21 3 G 3 MC4 1
Grade 6 Mathematics- Performance Task - Cell Phone Plan
ICA Test Map
Item
Sequence Claim Target DOK Item Type
Point
Value
1 2 A 2 EQ 1
2 4 F 2 EQ 1
Page 441
Smarter Balanced 2014-15 and 2015-16 Interim Assessment Technical Report
Appendix C: Test Maps
C-111
3 2 A 2 EQ 1
4 3 A 2 EQ 1
5 4 A 2 SA 2
6 3 A 2 SA 3
Grade 7 Math ICAs
Grade 7 Mathematics (Calculator)
Interim Comprehensive Assessments Test Map
Item
Sequence Claim Target DOK Item Type
Point
Value
1 1 G-7, J-
8 1 MC4 1
2 1 A-7 2 MC3 1
3 4 A 2 MC4 1
4 3 E 3 MC4 1
5 1 A-7 2 MS4 1
6 3 E 3 MC4 1
7 1 I-7 1 MI 1
8 1 D-7 1 EQ 1
9 1 F-7 2 MI 1
10 1 A-7 2 EQ 1
11 1 D-7 2 MC4 1
Page 442
Smarter Balanced 2014-15 and 2015-16 Interim Assessment Technical Report
Appendix C: Test Maps
C-112
Grade 7 Mathematics (Calculator)
Interim Comprehensive Assessments Test Map
Item
Sequence Claim Target DOK Item Type
Point
Value
12 3 D 3 MC4 1
13 4 C 1 TI 1
14 1 A-7 2 EQ 1
15 1 D-7 2 MC4 1
16 2 A 2 EQ 1
17 1 E-7 2 EQ 1
18 1 I-7 2 EQ 1
19 3 F 3 MC4 1
20 4 E 3 MC4 1
21 2 A 2 EQ 1
22 1 D-7 1 EQ 1
23 3 A 3 MC4 1
24 1 A-7 2 MC4 1
25 3 F 3 EQ 1
Grade 7 Mathematics (No Calculator)
Interim Comprehensive Assessments Test Map
Page 443
Smarter Balanced 2014-15 and 2015-16 Interim Assessment Technical Report
Appendix C: Test Maps
C-113
Item
Sequence Claim Target DOK Item Type
Point
Value
1 1 E-7 2 EQ 1
2 1 C-7 2 MS4 1
3 1 B-7 2 EQ 1
4 1 C-7 1 MS4 1
5 1 B-7 2 EQ 1
6 1 C-7 2 MS4 1
Grade 7 Mathematics - Performance Task - Camping Tasks
Interim Comprehensive Assessments Test Map
Item
Sequence Claim Target DOK Item Type
Point
Value
1 2 A 2 EQ 1
2 4 A 2 MC4 1
3 3 E 3 SA 2
4 2 A 2 TI 1
5 4 A 2 TI 1
6 3 B 3 SA 2
Grade 8 Math ICAs
Page 444
Smarter Balanced 2014-15 and 2015-16 Interim Assessment Technical Report
Appendix C: Test Maps
C-114
Grade 8 Mathematics (Calculator)
Interim Comprehensive Assessments Test Map
Item
Sequence Claim Target DOK Item Type
Point
Value
1 1 E-8 2 MC4 1
2 1 J-8 2 EQ 2
3 1 G-8 1 MI 1
4 3 E 3 MC4 1
5 1 J-8 2 EQ 2
6 3 A 2 MC4 1
7 3 F 2 MC4 1
8 1 D-8 2 EQ 1
9 1 D-8 2 MC4 1
10 1 H-8 2 EQ 1
11 1 E-8 2 MC4 1
12 1 G-8 2 MI 1
13 3 G 2 MC4 1
14 1 D-8 2 EQ 1
15 1 D-8 2 MC4 1
16 4 C 2 MC4 1
17 2 A 3 EQ 1
Page 445
Smarter Balanced 2014-15 and 2015-16 Interim Assessment Technical Report
Appendix C: Test Maps
C-115
Grade 8 Mathematics (Calculator)
Interim Comprehensive Assessments Test Map
Item
Sequence Claim Target DOK Item Type
Point
Value
18 1 F-8 1 EQ 1
19 1 E-8 1 MS4 1
20 2 D 2 MC4 1
21 3 E 3 MC4 1
22 2 C 2 EQ 1
23 3 E 3 MC4 1
24 1 F-8 2 EQ 1
25 1 E-8 1 MS4 1
26 4 A 2 EQ 1
Grade 8 Mathematics (No Calculator)
Interim Comprehensive Assessments Test Map
Item
Sequence Claim Target DOK Item Type
Point
Value
1 1 A-8 1 MC4 1
2 1 C-8 2 EQ 1
3 1 A-8 2 MC4 1
4 1 C-8 2 EQ 1
Page 446
Smarter Balanced 2014-15 and 2015-16 Interim Assessment Technical Report
Appendix C: Test Maps
C-116
5 1 A-8 1 MC4 1
Grade 8 Mathematics - Performance Task - Baseball Tickets
Interim Comprehensive Assessments Test Map
Item
Sequence Claim Target DOK Item Type
Point
Value
1 2 A 2 EQ 1
2 2 A 2 TI 2
3 4 A 2 EQ 1
4 4 E 3 EQ 1
5 3 A 3 SA 2
6 3 F 3 SA 1
Page 447
Smarter Balanced 2014-15 and 2015-16 Interim Assessment Technical Report
Appendix C: Test Maps
C-117
Grade 11 Math ICAs
Grade 11 Mathematics (Calculator)
Interim Comprehensive Assessments Test Map
Item
Sequence Claim Target DOK Item Type
Point
Value
1 1 P 2 MC4 1
2 1 L 2 MC4 1
3 3 F 3 MC4 1
4 1 L 2 MC4 1
5 4 C 2 MS5 1
6 2 A 2 EQ 2
7 3 A 3 MC4 1
8 1 G 2 EQ 1
9 3 A 3 MC4 1
10 1 J 2 MC4 1
11 1 C 1 MC4 1
12 1 G 2 EQ 1
13 1 P 2 MC4 1
14 3 C 3 MC4 1
15 1 L 1 MI 1
16 2 C 2 EQ 1
Page 448
Smarter Balanced 2014-15 and 2015-16 Interim Assessment Technical Report
Appendix C: Test Maps
C-118
Grade 11 Mathematics (Calculator)
Interim Comprehensive Assessments Test Map
Item
Sequence Claim Target DOK Item Type
Point
Value
17 1 J 2 MC4 1
18 1 O 1 MI 1
19 4 D 2 MI 1
20 3 C 3 MC4 1
21 4 B 3 SA 2
22 1 O 2 EQ 1
23 4 F 2 MC4 1
24 1 G 2 EQ 1
25 1 N 2 MC4 1
26 1 M 2 MI 1
27 3 B 3 MS6 1
Page 449
Smarter Balanced 2014-15 and 2015-16 Interim Assessment Technical Report
Appendix C: Test Maps
C-119
Grade 11 Mathematics (No Calculator)
Interim Comprehensive Assessments Test Map
Item
Sequence Claim Target DOK
Item
Type
Point
Value
1 1 I 2 MC4 1
2 1 K 1 MI 1
3 1 A 1 MI 1
4 1 F 2 EQ 1
5 1 H 2 MC4 1
6 1 D 2 MC4 1
Grade 11 Mathematics - Performance Task - Teen Driving
Restriction
Interim Comprehensive Assessments Test Map
Item Sequence Claim Target DOK Item Type
Point
Value
1 2 C 2 MC4 1
2 3 E 2 SA 2
3 4 D 2 SA 2
4 3 E 2 SA 2
5 4 A 2 EQ 1
6 4 A 3 SA 3
Page 450
Smarter Balanced 2014-15 and 2015-16 Interim Assessment Technical Report
Appendix D: Item Development Process
D-1
Appendix D: Item Development Process
The charts below outline the detailed process for stages of item development. They describe the
many checks and reviews each item receives before it is approved for field testing. Item content,
graphics, artwork, response processes and stimuli get extensive reviews. Items are also subject to
reviews for possible cultural bias or material that may distract some test takers because it is in an
area of sensitivity. Throughout the process there are checks to assure that items are accessible to as
many students as possible.
Page 451
Smarter Balanced 2014-15 and 2015-16 Interim Assessment Technical Report
Appendix D: Item Development Process
D-2
Page 452
Smarter Balanced 2014-15 and 2015-16 Interim Assessment Technical Report
Appendix D: Item Development Process
D-3
Detailed information about item writing, development, review and scoring can be obtained upon request.
Page 453
Smarter Balanced 2014-15 and 2015-16 Interim Assessment Technical Report
Appendix D: Item Development Process
D-4
Topic Sub-topic Document Name
Item Writing Process Flow 20150512 Item Development Process Description FINAL
20150512 Smarter process maps FINAL
Smarter 16 ITS Final Content Approval checklist FINAL
Smarter 16 Final Web Approval Checklist20150512
Models-Specifications 20131003 Smarter 16 Item pool specification v12a Math FINALnew
20131006 Smarter 16 Item pool specification v12d ELA FINALnew
ELA Archetypes
Math_Archetype_Metadata
Review criteria SB_16_ELA_Quality_Criteria_FINAL
SB_16_MATH_Quality_Criteria_FINAL
CBA Item Review Business Rules 9-25
Human
Scoring
Process Description 20150512 Smarter Hand Scoring Process FINAL
Qualifications 20150512 Smarter Hand Scoring Rater Qualifications FINAL
Quality Monitoring 20150512 Smarter Hand Scoring Quality Monitoring FINAL
Recruitment-Training 0150512 Smarter Hand Scoring Rater Training FINAL
Data Review 20150512 Smarter 2014 Field Test Data Review Summary Report FINAL
20150512 Smarter Data Review Results Summary
Page 454
Smarter Balanced 2014-15 and 2015-16 Interim Assessment Technical Report
Appendix E: Reporting Achievement Levels
E-5
Appendix E. Reporting Achievement Levels for Interim Comprehensive Report Overall Achievement Levels
Enclosed are the Achievement Levels for the English language arts/literacy and mathematics Smarter Balanced assessments. Please note
states may choose to alter the descriptions or name descriptors.
Mathematics Reporting Achievement Levels
High School Grades 6–8 Grades 3–5
Level 4
The student has exceeded the
achievement standard and demonstrates
the knowledge and skills in mathematics
needed for likely success in entry-level
credit-bearing college coursework after
high school.
Level 4
The student has exceeded the achievement
standard and demonstrates advanced
progress toward mastery of the knowledge
and skills in mathematics needed for likely
success in entry-level credit-bearing college
coursework after high school.
Level 4
The student has exceeded the achievement
standard and demonstrates advanced progress
toward mastery of the knowledge and skills in
mathematics needed for likely success in future
coursework.
Level 3
The student has met the achievement
standard and demonstrates progress
toward mastery of the knowledge and
skills in mathematics needed for likely
success in entry-level credit-bearing
college coursework after completing high
school coursework.
Level 3
The student has met the achievement
standard and demonstrates progress toward
mastery of the knowledge and skills in
mathematics needed for likely success in
entry-level credit-bearing college
coursework after high school.
Level 3
The student has met the achievement standard
and demonstrates progress toward mastery of
the knowledge and skills in mathematics
needed for likely success in future coursework.
Level 2
The student has nearly met the
achievement standard and may require
further development to demonstrate the
knowledge and skills in mathematics
needed for likely success in entry-level
credit-bearing college coursework after
high school.
Level 2
The student has nearly met the achievement
standard and may require further
development to demonstrate the knowledge
and skills in mathematics needed for likely
success in entry-level credit-bearing college
coursework after high school.
Level 2
The student has nearly met the achievement
standard and may require further development
to demonstrate the knowledge and skills in
mathematics needed for likely success in future
coursework.
Level 1
The student has not met the achievement
standard and needs substantial
improvement to demonstrate the
knowledge and skills in mathematics
Level 1
The student has not met the achievement
standard and needs substantial
improvement to demonstrate the knowledge
and skills in mathematics needed for likely
Level 1
The student has not met the achievement
standard and needs substantial improvement to
demonstrate the knowledge and skills in
mathematics needed for likely success in future
Page 455
Smarter Balanced 2014-15 and 2015-16 Interim Assessment Technical Report
Appendix E: Reporting Achievement Levels
E-6
High School Grades 6–8 Grades 3–5
needed for likely success in entry-level
credit-bearing college coursework after
high school.
success in entry-level credit-bearing college
coursework after high school.
coursework.
English language arts/literacy Reporting Achievement Levels
High School Grades 6–8 Grades 3–5
Level 4
The student has exceeded the
achievement standard and
demonstrates the knowledge and skills
in English language arts/literacy
needed for likely success in entry-level
credit-bearing college coursework after
high school.
Level 4
The student has exceeded the achievement
standard and demonstrates advanced
progress toward mastery of the knowledge
and skills in English language arts/literacy
needed for likely success in entry-level credit-
bearing college coursework after high school.
Level 4
The student has exceeded the achievement
standard and demonstrates advanced progress
toward mastery of the knowledge and skills in
English language arts/literacy needed for likely
success in future coursework.
Level 3
The student has met the achievement
standard and demonstrates progress
toward mastery of the knowledge and
skills in English language arts/literacy
needed for likely success in entry-level
credit-bearing college coursework after
completing high school coursework.
Level 3
The student has met the achievement
standard and demonstrates progress toward
mastery of the knowledge and skills in
English language arts/literacy needed for
likely success in entry-level credit-bearing
college coursework after high school.
Level 3
The student has met the achievement standard and
demonstrates progress toward mastery of the
knowledge and skills in English language
arts/literacy needed for likely success in future
coursework.
Level 2
The student has nearly met the
achievement standard and may
require further development to
demonstrate the knowledge and skills
in English language arts/literacy
needed for likely success in entry-level
credit-bearing college coursework after
Level 2
The student has nearly met the achievement
standard and may require further
development to demonstrate the knowledge
and skills in English language arts/literacy
needed for likely success in entry-level credit-
bearing college coursework after high school.
Level 2
The student has nearly met the achievement
standard and may require further development to
demonstrate the knowledge and skills in English
language arts/literacy needed for likely success in
future coursework.
Page 456
Smarter Balanced 2014-15 and 2015-16 Interim Assessment Technical Report
Appendix E: Reporting Achievement Levels
E-7
High School Grades 6–8 Grades 3–5
high school.
Level 1
The student has not met the
achievement standard and needs
substantial improvement to
demonstrate the knowledge and skills
in English language arts/literacy
needed for likely success in entry-level
credit-bearing college coursework after
high school.
Level 1
The student has not met the achievement
standard and needs substantial
improvement to demonstrate the knowledge
and skills in English language arts/literacy
needed for likely success in entry-level credit-
bearing college coursework after high school.
Level 1
The student has not met the achievement standard
and needs substantial improvement to demonstrate
the knowledge and skills in English language
arts/literacy needed for likely success in future
coursework.